|
|||||||||||||||||||||||||||||||||||||||||||||||||||||||||||||||||||||||||||||||||||||||||||||||||||||||||||||||||||||||||||||||||||||||||||||||||||||||||||||||||||||||||||||||||||||||||||||||||||||||||||||||||||||||||||||||||||||||||||||||||||||||||||||||||||||||||||||||||||||||||||||||||||||||||||||||||||||||||||||||||||||||||||||||||||||||||||||||
| |
| Phenotypic Information (metabolism pathway, cancer, disease, phenome) |
| |
| |
| Gene-Gene Network Information: Co-Expression Network, Interacting Genes & KEGG |
| |
|


| Gene Summary for IDH1 |
| Basic gene info. | Gene symbol | IDH1 |
| Gene name | isocitrate dehydrogenase 1 (NADP+), soluble | |
| Synonyms | HEL-216|HEL-S-26|IDCD|IDH|IDP|IDPC|PICD | |
| Cytomap | UCSC genome browser: 2q33.3 | |
| Genomic location | chr2 :209100952-209119806 | |
| Type of gene | protein-coding | |
| RefGenes | NM_001282386.1, NM_001282387.1,NM_005896.3, | |
| Ensembl id | ENSG00000138413 | |
| Description | NADP(+)-specific ICDHNADP-dependent isocitrate dehydrogenase, cytosolicNADP-dependent isocitrate dehydrogenase, peroxisomalepididymis luminal protein 216epididymis secretory protein Li 26isocitrate dehydrogenase [NADP] cytoplasmicoxalosuccinate deca | |
| Modification date | 20141222 | |
| dbXrefs | MIM : 147700 | |
| HGNC : HGNC | ||
| Ensembl : ENSG00000138413 | ||
| HPRD : 00984 | ||
| Vega : OTTHUMG00000132943 | ||
| Protein | UniProt: O75874 go to UniProt's Cross Reference DB Table | |
| Expression | CleanEX: HS_IDH1 | |
| BioGPS: 3417 | ||
| Gene Expression Atlas: ENSG00000138413 | ||
| The Human Protein Atlas: ENSG00000138413 | ||
| Pathway | NCI Pathway Interaction Database: IDH1 | |
| KEGG: IDH1 | ||
| REACTOME: IDH1 | ||
| ConsensusPathDB | ||
| Pathway Commons: IDH1 | ||
| Metabolism | MetaCyc: IDH1 | |
| HUMANCyc: IDH1 | ||
| Regulation | Ensembl's Regulation: ENSG00000138413 | |
| miRBase: chr2 :209,100,952-209,119,806 | ||
| TargetScan: NM_001282386 | ||
| cisRED: ENSG00000138413 | ||
| Context | iHOP: IDH1 | |
| cancer metabolism search in PubMed: IDH1 | ||
| UCL Cancer Institute: IDH1 | ||
| Assigned class in ccmGDB | A - This gene has a literature evidence and it belongs to cancer gene. | |
| References showing role of IDH1 in cancer cell metabolism | 1. Grassian AR, Parker SJ, Davidson SM, Divakaruni AS, Green CR, et al. (2014) IDH1 mutations alter citric acid cycle metabolism and increase dependence on oxidative mitochondrial metabolism. Cancer Res 74: 3317-3331. doi: 10.1158/0008-5472.CAN-14-0772-T. go to article 2. Esmaeili M, Hamans BC, Navis AC, van Horssen R, Bathen TF, et al. (2014) IDH1 R132H mutation generates a distinct phospholipid metabolite profile in glioma. Cancer Res 74: 4898-4907. doi: 10.1158/0008-5472.CAN-14-0008. go to article 3. Izquierdo-Garcia JL, Viswanath P, Eriksson P, Cai L, Radoul M, et al. (2015) IDH1 Mutation Induces Reprogramming of Pyruvate Metabolism. Cancer Res. doi: 10.1158/0008-5472.CAN-15-0840. go to article 4. Schumacher T, Bunse L, Pusch S, Sahm F, Wiestler B, et al. (2014) A vaccine targeting mutant IDH1 induces antitumour immunity. Nature 512: 324-327. doi: 10.1038/nature13387. go to article 5. Hirata M, Sasaki M, Cairns RA, Inoue S, Puviindran V, et al. (2015) Mutant IDH is sufficient to initiate enchondromatosis in mice. Proc Natl Acad Sci U S A 112: 2829-2834. doi: 10.1073/pnas.1424400112. pmid: 4352794. go to article | |
| Top |
| Phenotypic Information for IDH1(metabolism pathway, cancer, disease, phenome) |
| Cancer | CGAP: IDH1 |
| Familial Cancer Database: IDH1 | |
| * This gene is included in those cancer gene databases. |
|
|
|
|
|
|
| |||||||||||||||||||||||||||||||||||||||||||||||||||||||||||||||||||||||||||||||||||||||||||||||||||||||||||||||||||||||||||||||||||||||||||||||||||||||||||||||||||||||||||||||||||||||||||||||||||||||||||||||||||||||||||||||||||||||||||||||||||||||||||||||||||||||||||||||||||||||||||||||||||||||||||||||||||||||||||||||||||||||||||||||||||||||||
Oncogene 1 | Significant driver gene in GBM 6, LAML 7, MM 8, SKCM 9, GBM 10, | ||||||||||||||||||||||||||||||||||||||||||||||||||||||||||||||||||||||||||||||||||||||||||||||||||||||||||||||||||||||||||||||||||||||||||||||||||||||||||||||||||||||||||||||||||||||||||||||||||||||||||||||||||||||||||||||||||||||||||||||||||||||||||||||||||||||||||||||||||||||||||||||||||||||||||||||||||||||||||||||||||||||||||||||||||||||||||||||
| cf) number; DB name 1 Oncogene; http://nar.oxfordjournals.org/content/35/suppl_1/D721.long, 2 Tumor Suppressor gene; https://bioinfo.uth.edu/TSGene/, 3 Cancer Gene Census; http://www.nature.com/nrc/journal/v4/n3/abs/nrc1299.html, 4 CancerGenes; http://nar.oxfordjournals.org/content/35/suppl_1/D721.long, 5 Network of Cancer Gene; http://ncg.kcl.ac.uk/index.php, 6 http://www.sciencedirect.com/science/article/pii/S0092867413012087, 7 http://www.nejm.org/doi/full/10.1056/NEJMoa1301689, 8 http://www.nature.com/nature/journal/v505/n7484/full/nature12912.html, 9 http://www.sciencedirect.com/science/article/pii/S0092867415006340, 10 http://www.nejm.org/doi/full/10.1056/NEJMoa1402121, 11Therapeutic Vulnerabilities in Cancer; http://cbio.mskcc.org/cancergenomics/statius/ |
| KEGG_GLUTATHIONE_METABOLISM REACTOME_PYRUVATE_METABOLISM_AND_CITRIC_ACID_TCA_CYCLE REACTOME_PEROXISOMAL_LIPID_METABOLISM REACTOME_METABOLISM_OF_LIPIDS_AND_LIPOPROTEINS | |
| OMIM | 137800; phenotype. 147700; gene. |
| Orphanet | 163634; Maffucci syndrome. 251576; Gliosarcoma. 251579; Giant cell glioblastoma. 296; Enchondromatosis. 99646; Metaphyseal chondromatosis with D-2-hydroxyglutaric aciduria. |
| Disease | KEGG Disease: IDH1 |
| MedGen: IDH1 (Human Medical Genetics with Condition) | |
| ClinVar: IDH1 | |
| Phenotype | MGI: IDH1 (International Mouse Phenotyping Consortium) |
| PhenomicDB: IDH1 | |
| Mutations for IDH1 |
| * Under tables are showing count per each tissue to give us broad intuition about tissue specific mutation patterns.You can go to the detailed page for each mutation database's web site. |
| There's no structural variation information in COSMIC data for this gene. |
| * From mRNA Sanger sequences, Chitars2.0 arranged chimeric transcripts. This table shows IDH1 related fusion information. |
| ID | Head Gene | Tail Gene | Accession | Gene_a | qStart_a | qEnd_a | Chromosome_a | tStart_a | tEnd_a | Gene_a | qStart_a | qEnd_a | Chromosome_a | tStart_a | tEnd_a |
| CN423757 | IDH1 | 1 | 89 | 2 | 209103827 | 209103915 | NCL | 85 | 305 | 2 | 232326411 | 232326631 | |
| BU153261 | IDH1 | 94 | 480 | 2 | 209104672 | 209108329 | RPS24 | 471 | 772 | 10 | 79795397 | 79800459 | |
| AW001546 | IDH1 | 1 | 242 | 2 | 209100954 | 209101195 | MBOAT2 | 239 | 557 | 2 | 9077895 | 9078213 | |
| BC065703 | CCNYL1 | 1 | 426 | 2 | 208576416 | 208576841 | IDH1 | 424 | 1672 | 2 | 209100951 | 209104729 | |
| Top |
| Mutation type/ Tissue ID | brca | cns | cerv | endome | haematopo | kidn | Lintest | liver | lung | ns | ovary | pancre | prost | skin | stoma | thyro | urina | |||
| Total # sample | 1 | |||||||||||||||||||
| GAIN (# sample) | ||||||||||||||||||||
| LOSS (# sample) | 1 |
| cf) Tissue ID; Tissue type (1; Breast, 2; Central_nervous_system, 3; Cervix, 4; Endometrium, 5; Haematopoietic_and_lymphoid_tissue, 6; Kidney, 7; Large_intestine, 8; Liver, 9; Lung, 10; NS, 11; Ovary, 12; Pancreas, 13; Prostate, 14; Skin, 15; Stomach, 16; Thyroid, 17; Urinary_tract) |
| Top |
|
 |
| Top |
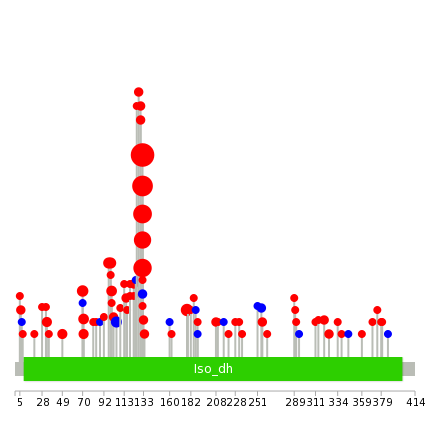
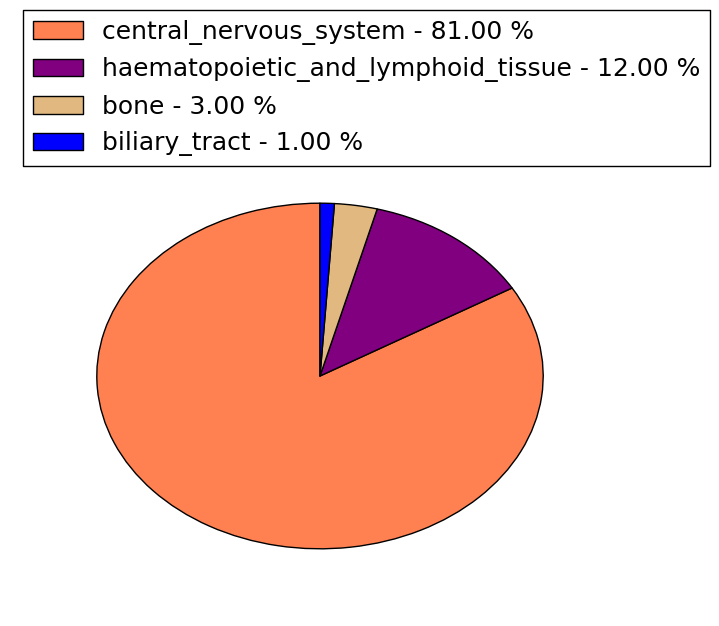
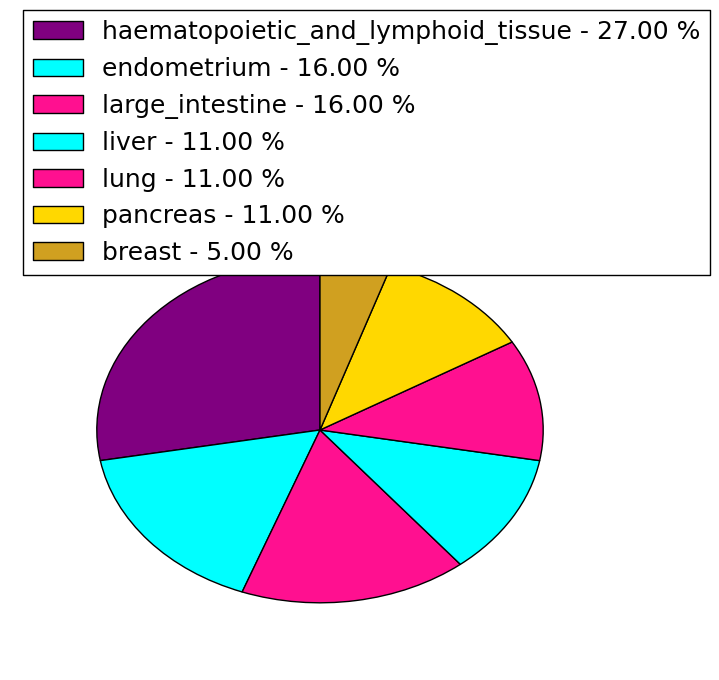
| Stat. for Non-Synonymous SNVs (# total SNVs=7619) | (# total SNVs=18) |
 |  |
(# total SNVs=0) | (# total SNVs=0) |
| Top |
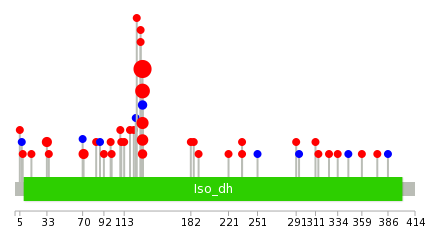
| * When you move the cursor on each content, you can see more deailed mutation information on the Tooltip. Those are primary_site,primary_histology,mutation(aa),pubmedID. |
| GRCh37 position | Mutation(aa) | Unique sampleID count |
| chr2:209113112-209113112 | p.R132H | 4057 |
| chr2:209113113-209113113 | p.R132C | 896 |
| chr2:209108317-209108317 | p.V178I | 9 |
| chr2:209113112-209113113 | p.R132S | 7 |
| chr2:209113298-209113298 | p.G70D | 6 |
| chr2:209113192-209113192 | p.G105G | 5 |
| chr2:209113208-209113208 | p.R100Q | 5 |
| chr2:209113210-209113210 | p.I99M | 5 |
| chr2:209113111-209113112 | p.R132H | 4 |
| chr2:209113295-209113295 | p.V71A | 3 |
| Top |
|
 |
| Point Mutation/ Tissue ID | 1 | 2 | 3 | 4 | 5 | 6 | 7 | 8 | 9 | 10 | 11 | 12 | 13 | 14 | 15 | 16 | 17 | 18 | 19 | 20 |
| # sample | 2 | 3 | 19 | 15 | 2 | 1 | 19 | 3 | 2 | 1 | 1 | 14 | 3 | 6 | ||||||
| # mutation | 2 | 3 | 16 | 2 | 2 | 1 | 2 | 4 | 2 | 1 | 1 | 5 | 3 | 7 | ||||||
| nonsynonymous SNV | 2 | 2 | 14 | 2 | 2 | 1 | 2 | 3 | 2 | 1 | 1 | 4 | 2 | 4 | ||||||
| synonymous SNV | 1 | 2 | 1 | 1 | 1 | 3 |
| cf) Tissue ID; Tissue type (1; BLCA[Bladder Urothelial Carcinoma], 2; BRCA[Breast invasive carcinoma], 3; CESC[Cervical squamous cell carcinoma and endocervical adenocarcinoma], 4; COAD[Colon adenocarcinoma], 5; GBM[Glioblastoma multiforme], 6; Glioma Low Grade, 7; HNSC[Head and Neck squamous cell carcinoma], 8; KICH[Kidney Chromophobe], 9; KIRC[Kidney renal clear cell carcinoma], 10; KIRP[Kidney renal papillary cell carcinoma], 11; LAML[Acute Myeloid Leukemia], 12; LUAD[Lung adenocarcinoma], 13; LUSC[Lung squamous cell carcinoma], 14; OV[Ovarian serous cystadenocarcinoma ], 15; PAAD[Pancreatic adenocarcinoma], 16; PRAD[Prostate adenocarcinoma], 17; SKCM[Skin Cutaneous Melanoma], 18:STAD[Stomach adenocarcinoma], 19:THCA[Thyroid carcinoma], 20:UCEC[Uterine Corpus Endometrial Carcinoma]) |
| Top |
| * We represented just top 10 SNVs. When you move the cursor on each content, you can see more deailed mutation information on the Tooltip. Those are primary_site, primary_histology, mutation(aa), pubmedID. |
| Genomic Position | Mutation(aa) | Unique sampleID count |
| chr2:209113112 | p.R132H,IDH1 | 171 |
| chr2:209113113 | p.R132C,IDH1 | 42 |
| chr2:209113295 | p.V71A,IDH1 | 3 |
| chr2:209116179 | p.P33S,IDH1 | 3 |
| chr2:209113111 | p.R132R,IDH1 | 2 |
| chr2:209113208 | p.L359F,IDH1 | 1 |
| chr2:209104696 | p.K345K,IDH1 | 1 |
| chr2:209116255 | p.G70G,IDH1 | 1 |
| chr2:209113211 | p.F334I,IDH1 | 1 |
| chr2:209104705 | p.I130M,IDH1 | 1 |
| * Copy number data were extracted from TCGA using R package TCGA-Assembler. The URLs of all public data files on TCGA DCC data server were gathered on Jan-05-2015. Function ProcessCNAData in TCGA-Assembler package was used to obtain gene-level copy number value which is calculated as the average copy number of the genomic region of a gene. |
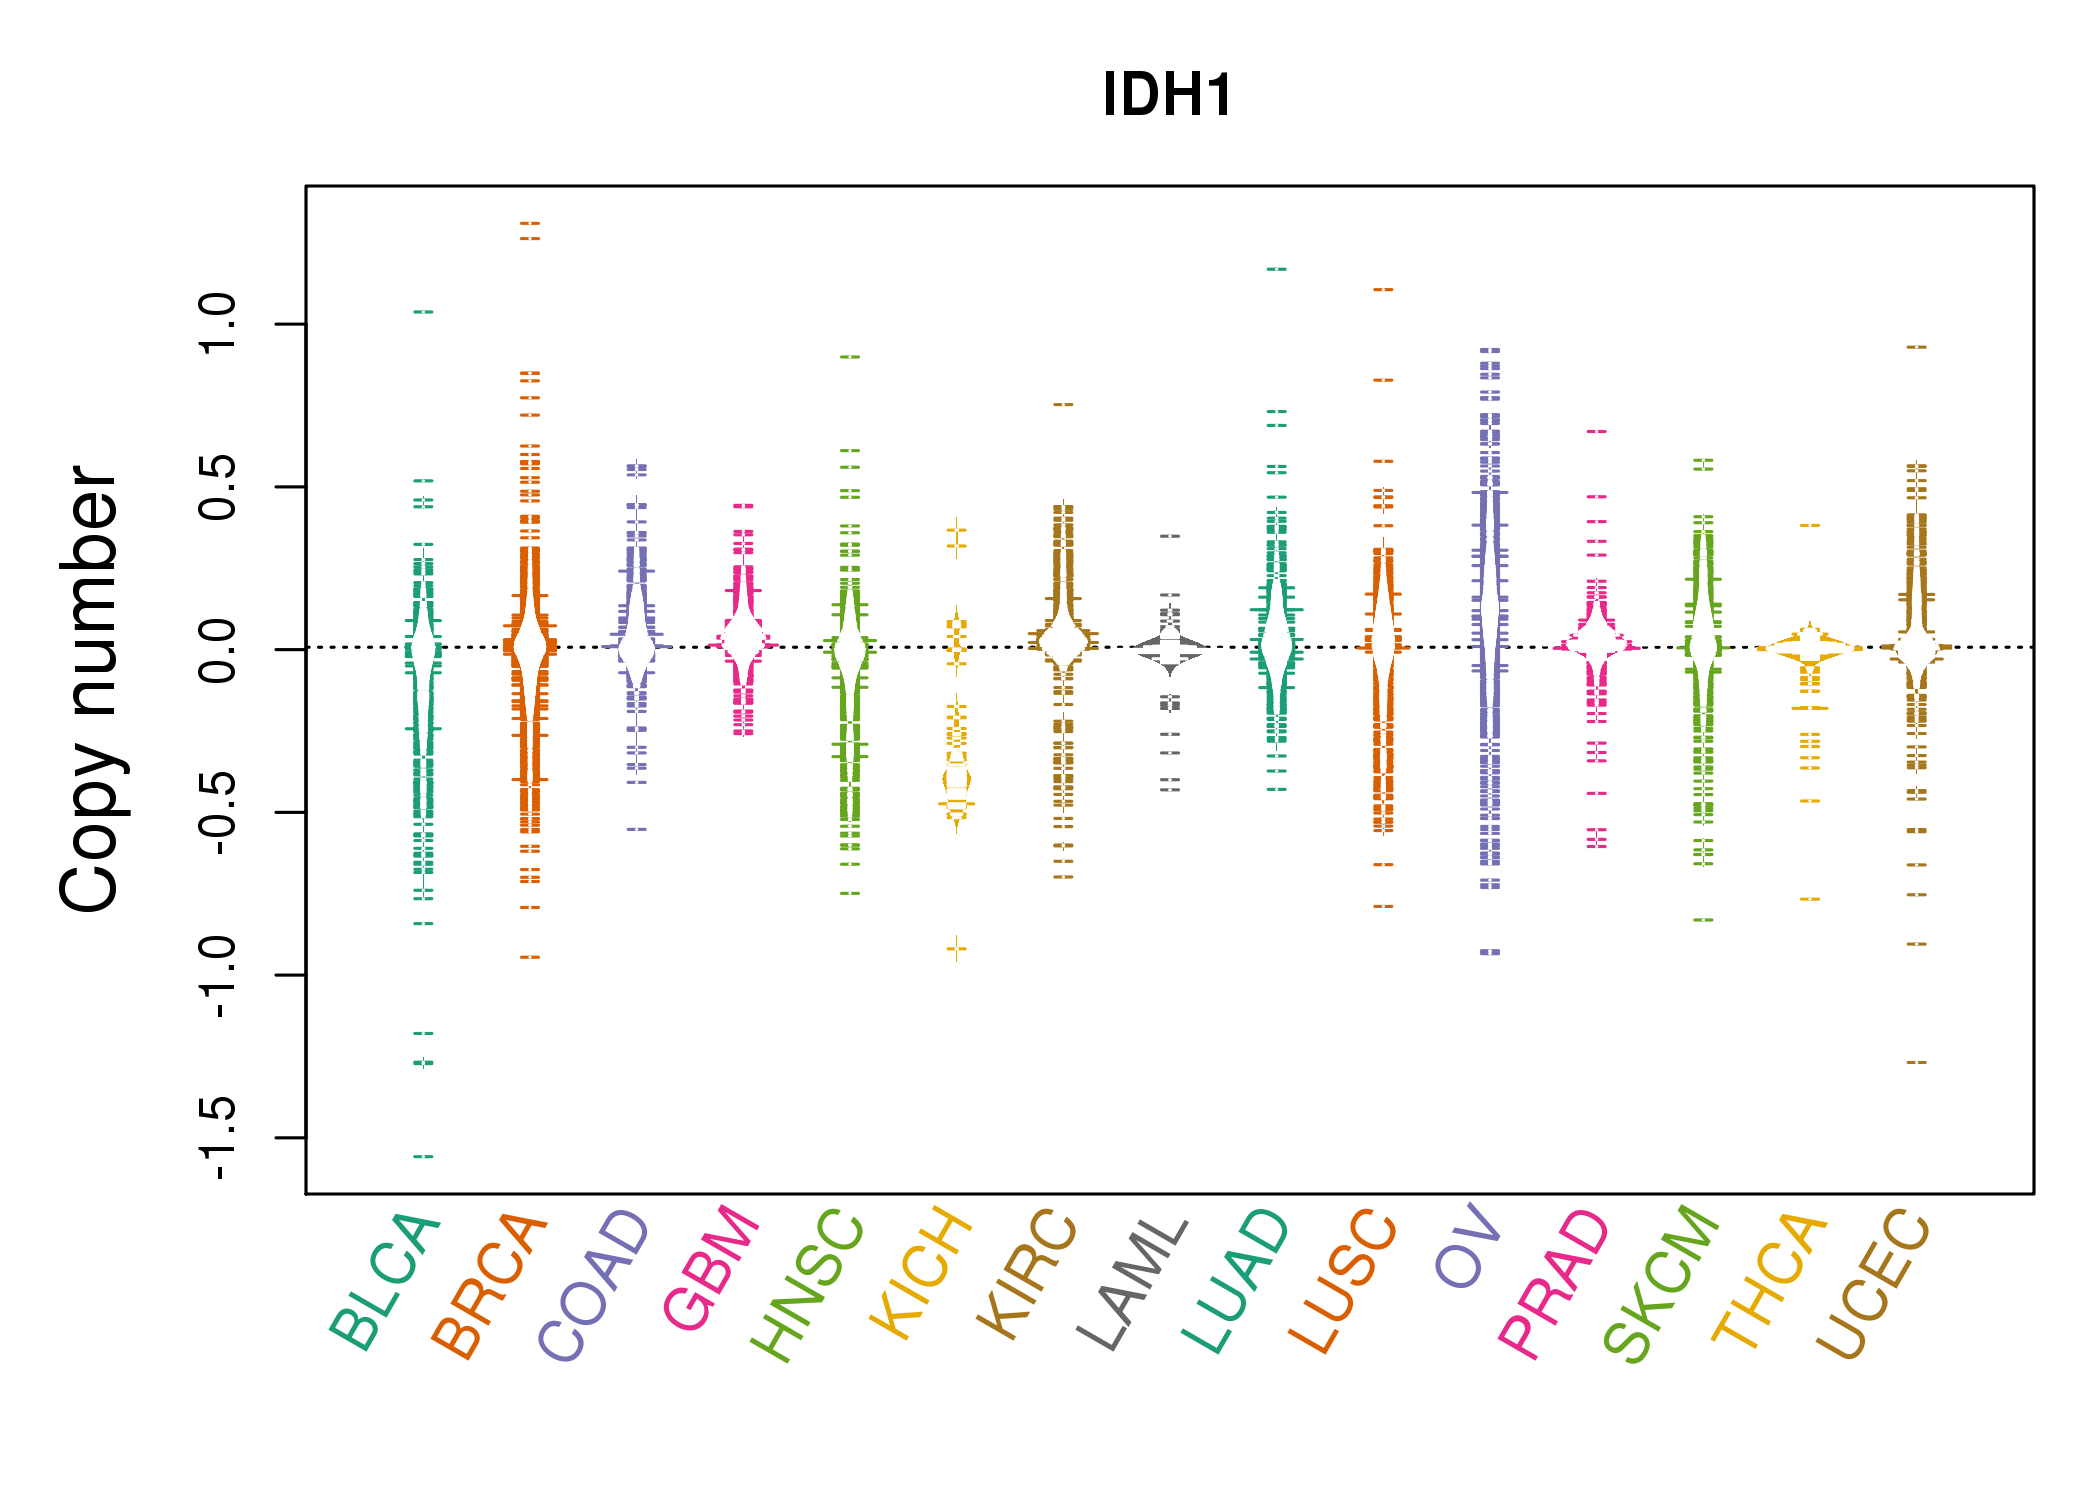 |
| cf) Tissue ID[Tissue type]: BLCA[Bladder Urothelial Carcinoma], BRCA[Breast invasive carcinoma], CESC[Cervical squamous cell carcinoma and endocervical adenocarcinoma], COAD[Colon adenocarcinoma], GBM[Glioblastoma multiforme], Glioma Low Grade, HNSC[Head and Neck squamous cell carcinoma], KICH[Kidney Chromophobe], KIRC[Kidney renal clear cell carcinoma], KIRP[Kidney renal papillary cell carcinoma], LAML[Acute Myeloid Leukemia], LUAD[Lung adenocarcinoma], LUSC[Lung squamous cell carcinoma], OV[Ovarian serous cystadenocarcinoma ], PAAD[Pancreatic adenocarcinoma], PRAD[Prostate adenocarcinoma], SKCM[Skin Cutaneous Melanoma], STAD[Stomach adenocarcinoma], THCA[Thyroid carcinoma], UCEC[Uterine Corpus Endometrial Carcinoma] |
| Top |
| Gene Expression for IDH1 |
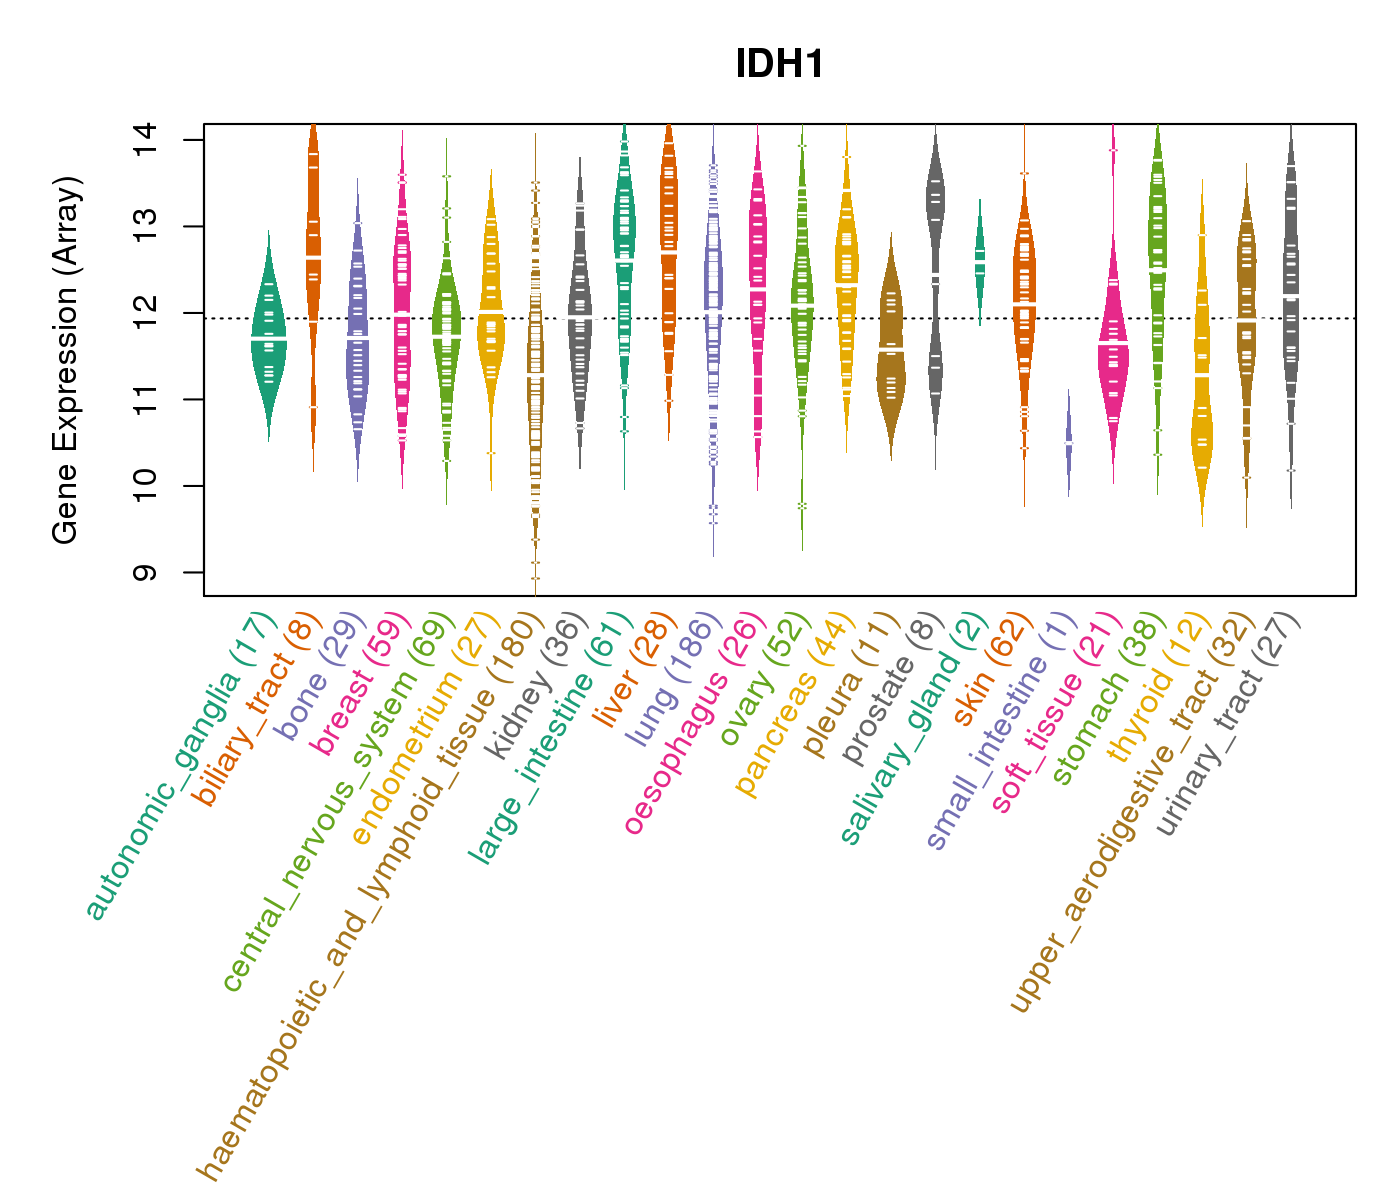
| * CCLE gene expression data were extracted from CCLE_Expression_Entrez_2012-10-18.res: Gene-centric RMA-normalized mRNA expression data. |
 |
| * Normalized gene expression data of RNASeqV2 was extracted from TCGA using R package TCGA-Assembler. The URLs of all public data files on TCGA DCC data server were gathered at Jan-05-2015. Only eight cancer types have enough normal control samples for differential expression analysis. (t test, adjusted p<0.05 (using Benjamini-Hochberg FDR)) |
 |
| Top |
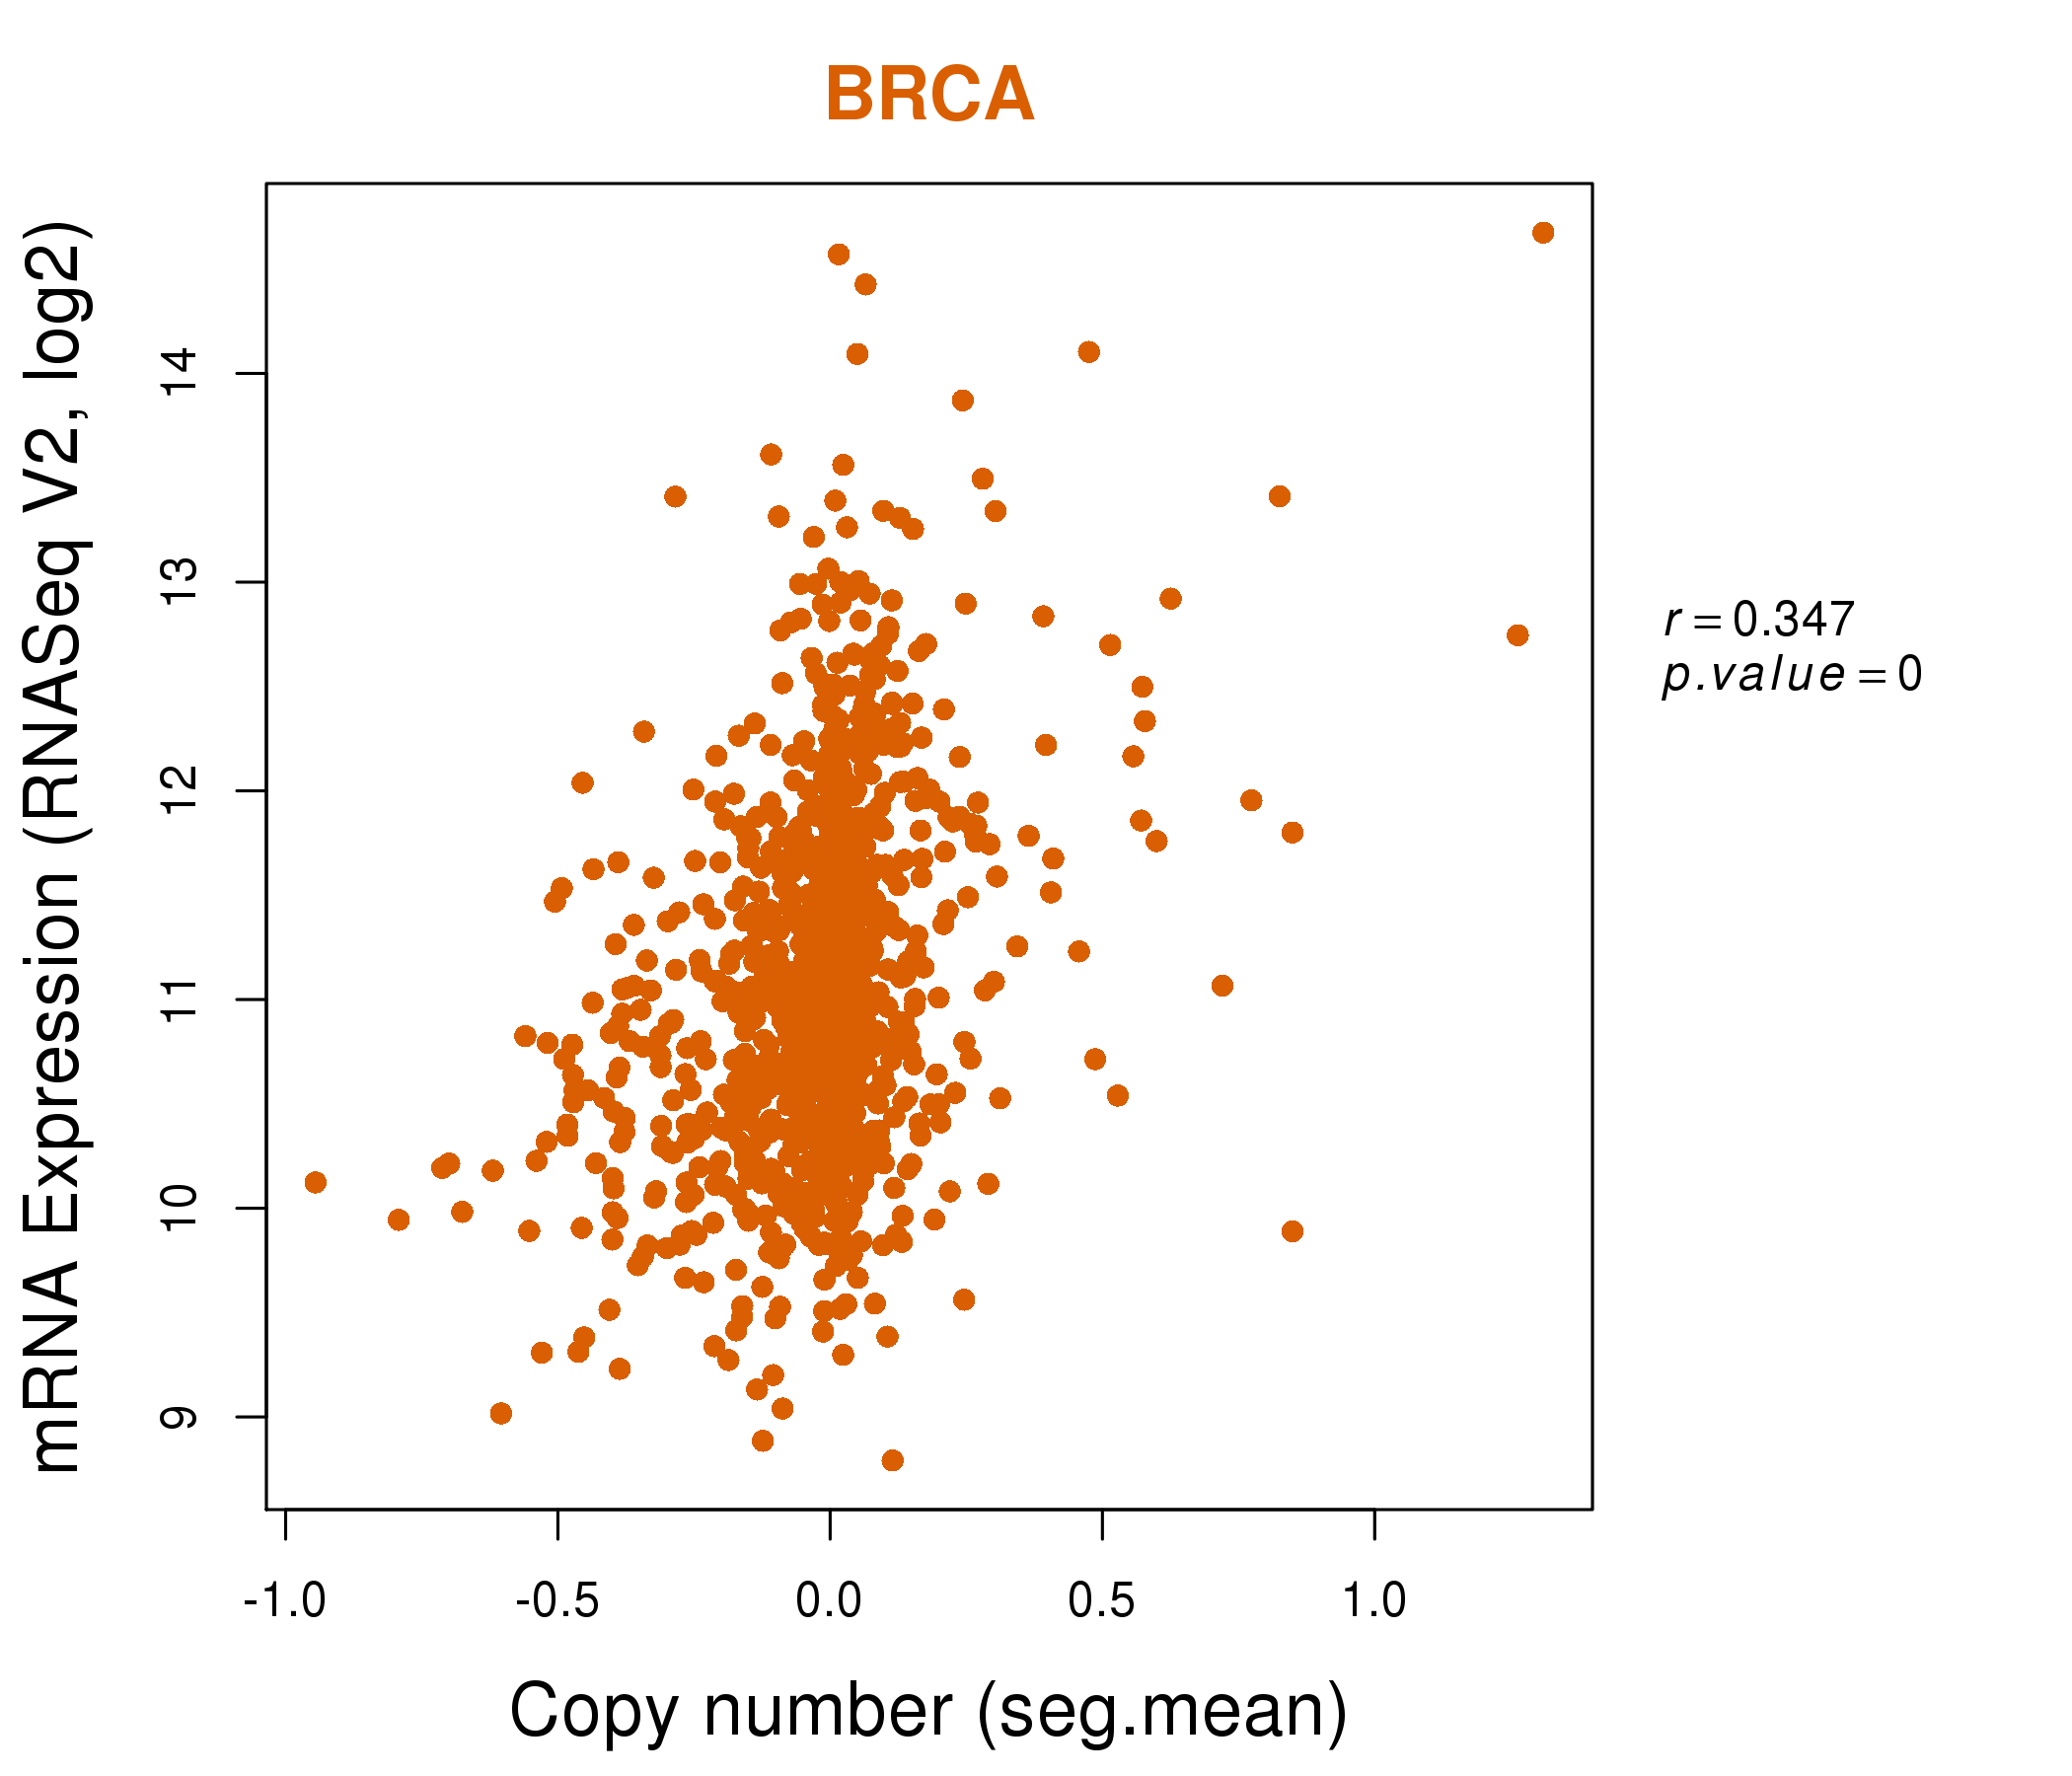
| * This plots show the correlation between CNV and gene expression. |
: Open all plots for all cancer types
 |
|
 |
|

| Top |
| Gene-Gene Network Information |
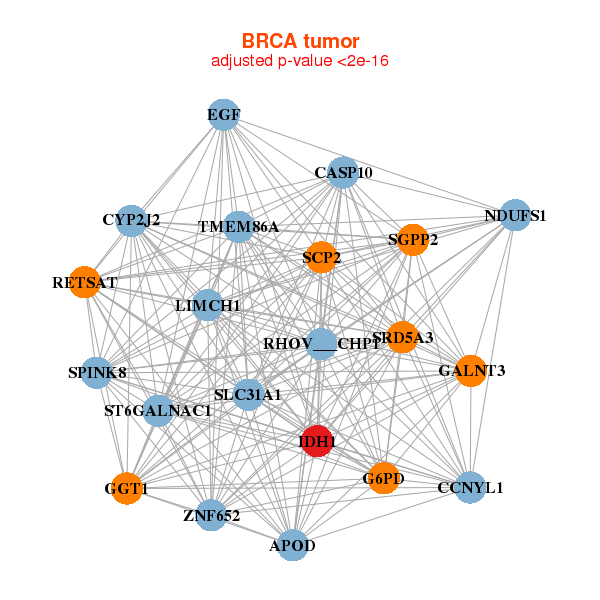
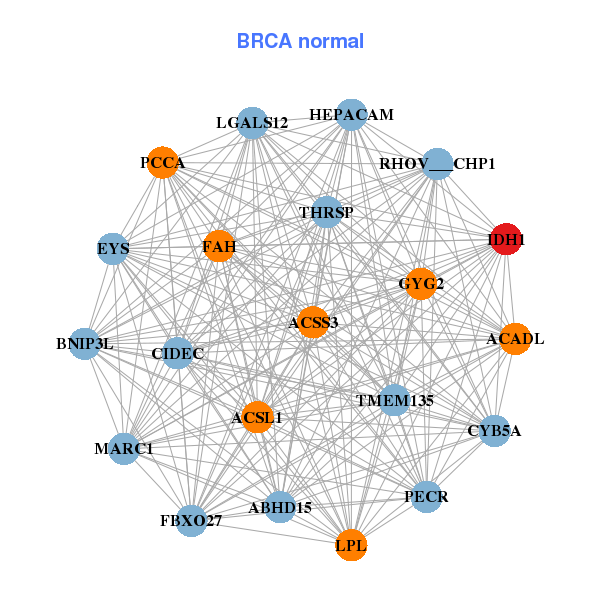
| * Co-Expression network figures were drawn using R package igraph. Only the top 20 genes with the highest correlations were shown. Red circle: input gene, orange circle: cell metabolism gene, sky circle: other gene |
: Open all plots for all cancer types
 |
| ||||
| APOD,CASP10,CCNYL1,RHOV___CHP1,CYP2J2,EGF,G6PD, GALNT3,GGT1,IDH1,LIMCH1,NDUFS1,RETSAT,SCP2, SGPP2,SLC31A1,SPINK8,SRD5A3,ST6GALNAC1,TMEM86A,ZNF652 | ABHD15,ACADL,ACSL1,ACSS3,BNIP3L,RHOV___CHP1,CIDEC, CYB5A,EYS,FAH,FBXO27,GYG2,HEPACAM,IDH1, LGALS12,LPL,MARC1,PCCA,PECR,THRSP,TMEM135 | ||||
 |
| ||||
| ACAT2,ATP5G3,C2orf47,CASP6,DBI,IDH1,IDI1, MDH1,MRPL1,MRPL19,MRPL35,MRPL42,MRPL44,MVK, PPCS,PRDX3,RDH11,SC5D,SDHD,SUCLG1,TMEM135 | ADH1C,BCL2L15,CD46,COX15,EHHADH,EIF2AK1,GJB1, IDH1,MCCC2,MEST,AP5M1,NDUFS1,PEX11A,PHKB, SH2D4A,SKAP2,SUCLG2,SULT1B1,TMEM184C,UGT1A8,UGT8 |

| * Co-Expression network figures were drawn using R package igraph. Only the top 20 genes with the highest correlations were shown. Red circle: input gene, orange circle: cell metabolism gene, sky circle: other gene |
: Open all plots for all cancer types
| Top |
: Open all interacting genes' information including KEGG pathway for all interacting genes from DAVID
| Top |
| Pharmacological Information for IDH1 |
| DB Category | DB Name | DB's ID and Url link |
| Chemistry | BindingDB | O75874; -. |
| Chemistry | ChEMBL | CHEMBL2007625; -. |
| Organism-specific databases | PharmGKB | PA29630; -. |
| Organism-specific databases | CTD | 3417; -. |
| * Gene Centered Interaction Network. |
 |
| * Drug Centered Interaction Network. |
| DrugBank ID | Target Name | Drug Groups | Generic Name | Drug Centered Network | Drug Structure |
| DB01727 | isocitrate dehydrogenase 1 (NADP+), soluble | experimental | Isocitric Acid |  |  |
| DB03461 | isocitrate dehydrogenase 1 (NADP+), soluble | experimental | 2'-Monophosphoadenosine 5'-Diphosphoribose | 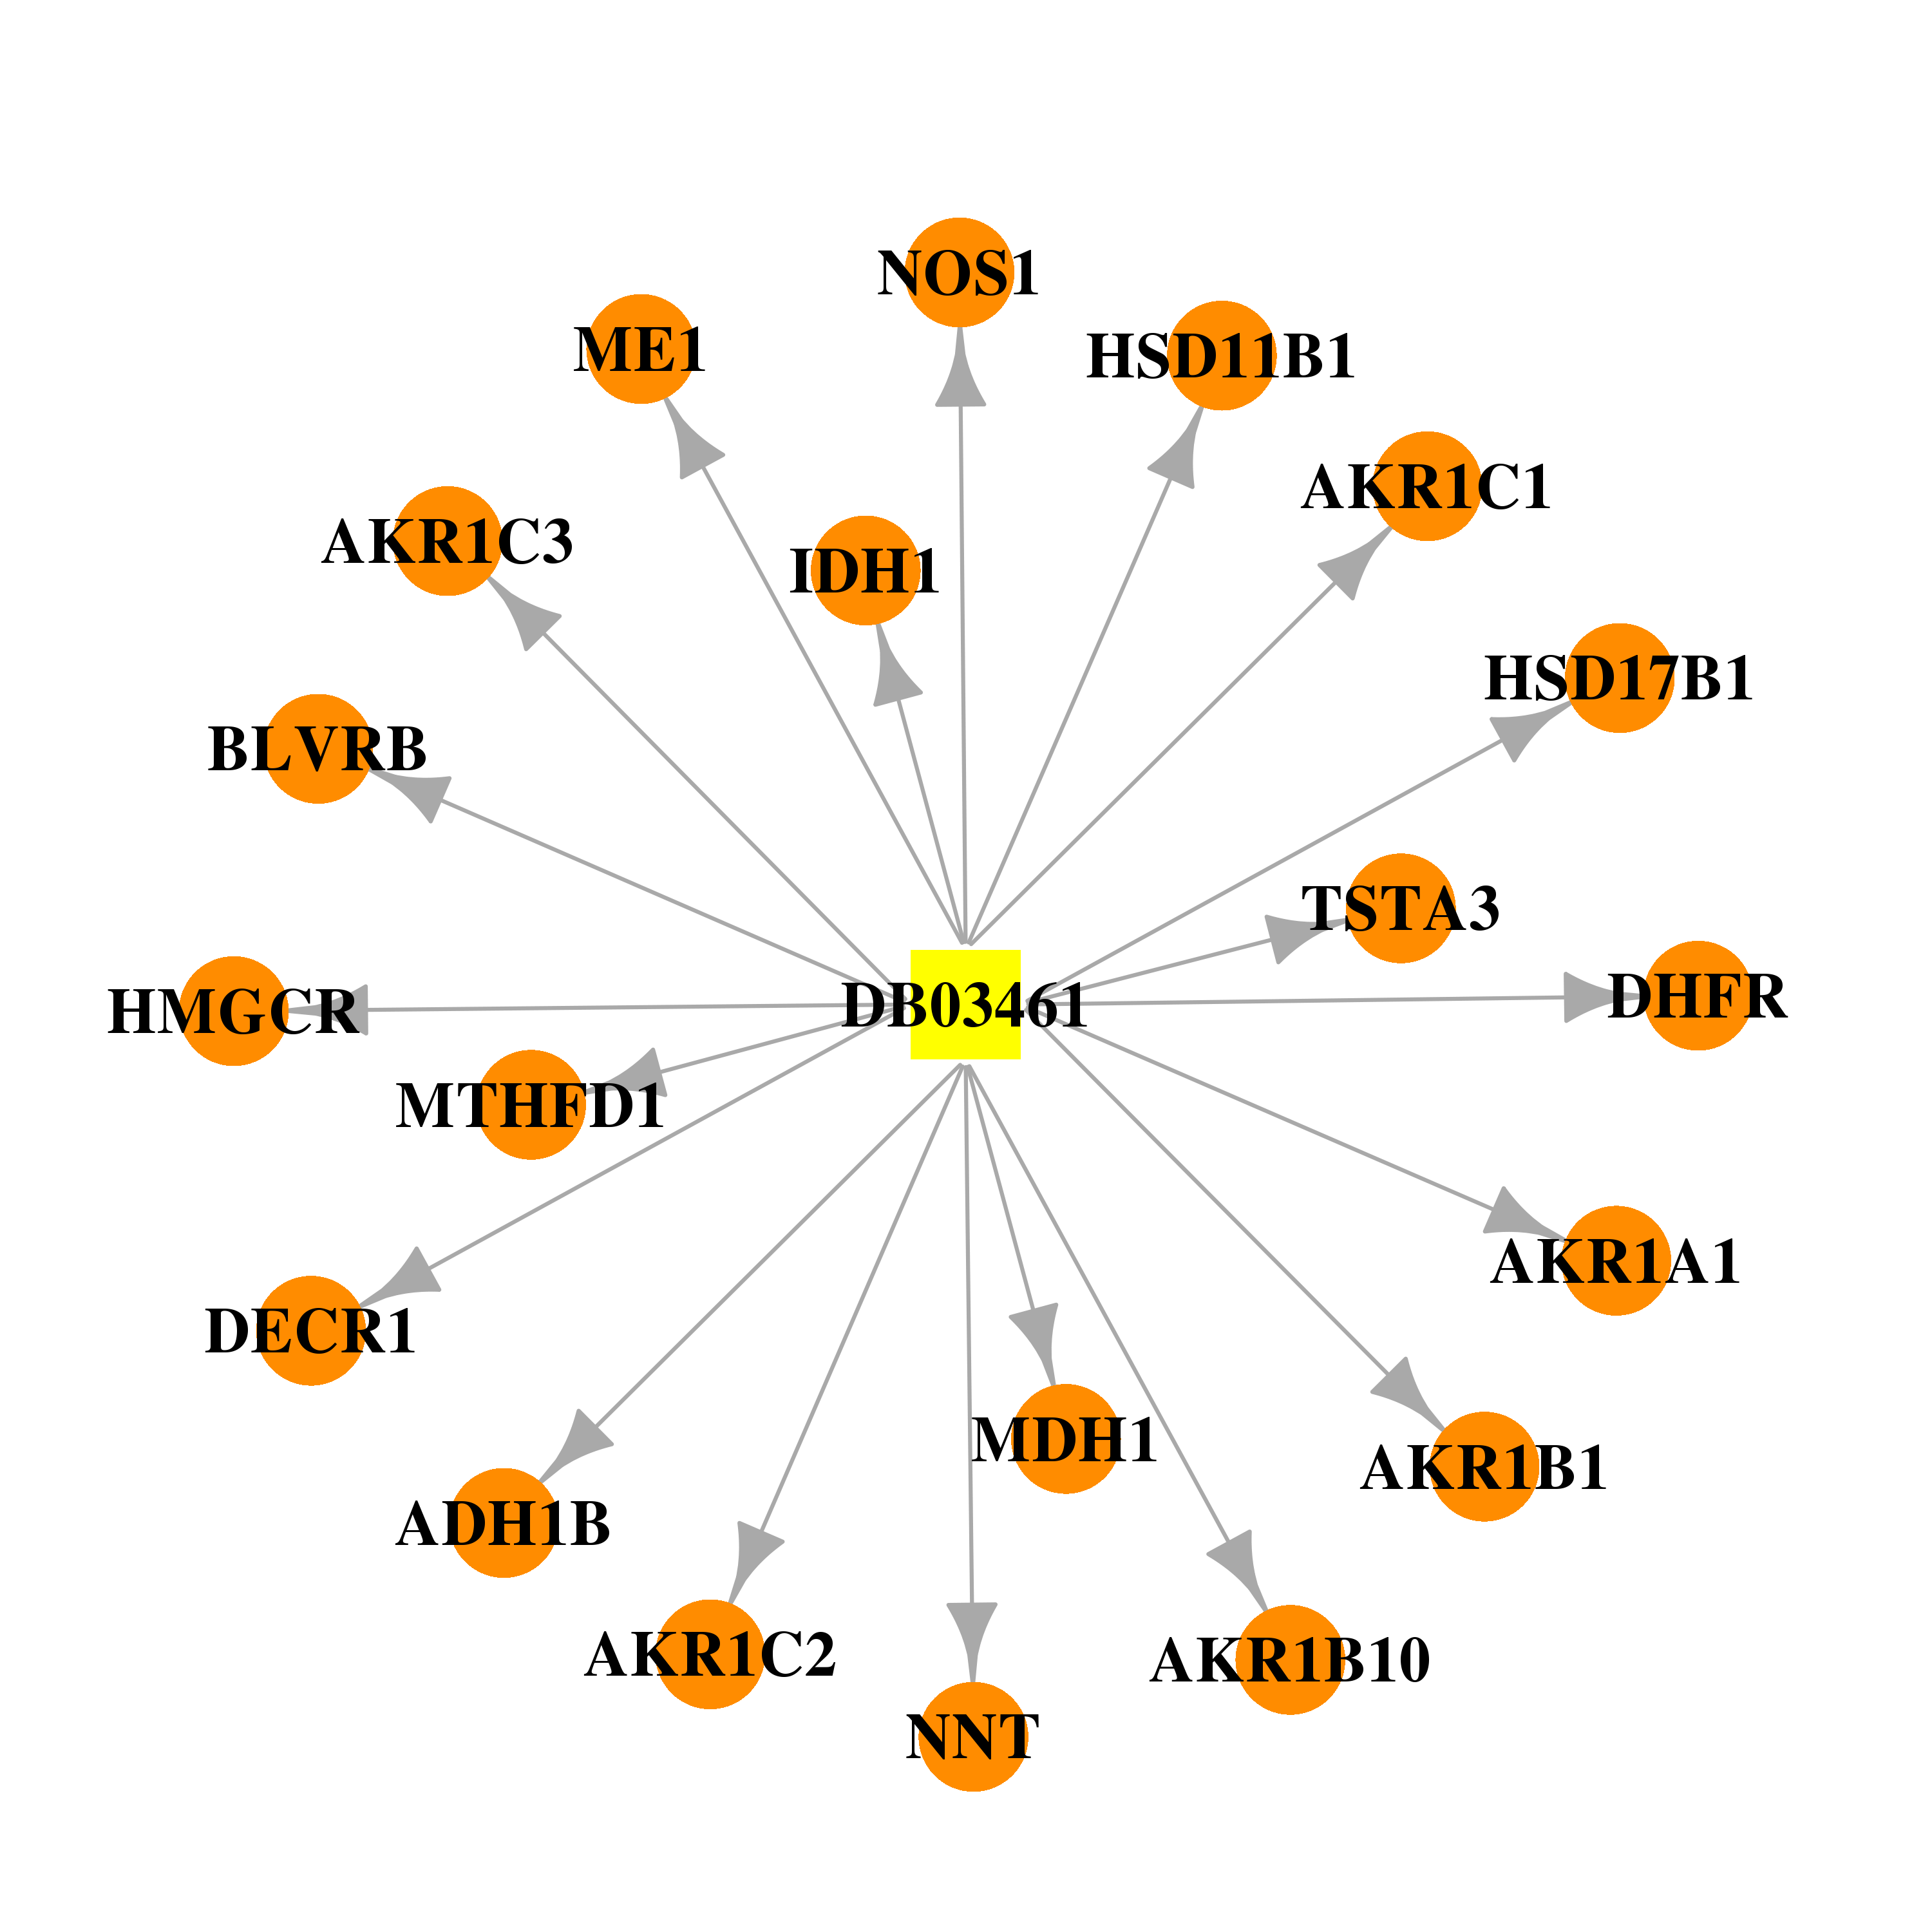 |  |
| Top |
| Cross referenced IDs for IDH1 |
| * We obtained these cross-references from Uniprot database. It covers 150 different DBs, 18 categories. http://www.uniprot.org/help/cross_references_section |
: Open all cross reference information
|
Copyright © 2016-Present - The Univsersity of Texas Health Science Center at Houston @ |