|
||||||||||||||||||||
| |
| Phenotypic Information (metabolism pathway, cancer, disease, phenome) |
| |
| |
| Gene-Gene Network Information: Co-Expression Network, Interacting Genes & KEGG |
| |
|


| Gene Summary for INS |
| Basic gene info. | Gene symbol | INS |
| Gene name | insulin | |
| Synonyms | IDDM|IDDM1|IDDM2|ILPR|IRDN|MODY10 | |
| Cytomap | UCSC genome browser: 11p15.5 | |
| Genomic location | chr11 :2181008-2182439 | |
| Type of gene | protein-coding | |
| RefGenes | NM_000207.2, NM_001185097.1,NM_001185098.1,NM_001291897.1, | |
| Ensembl id | ENSG00000254647 | |
| Description | preproinsulinproinsulin | |
| Modification date | 20141222 | |
| dbXrefs | MIM : 176730 | |
| HGNC : HGNC | ||
| Ensembl : ENSG00000254647 | ||
| HPRD : 01455 | ||
| Vega : OTTHUMG00000009558 | ||
| Protein | UniProt: P01308 go to UniProt's Cross Reference DB Table | |
| Expression | CleanEX: HS_INS | |
| BioGPS: 3630 | ||
| Gene Expression Atlas: ENSG00000254647 | ||
| The Human Protein Atlas: ENSG00000254647 | ||
| Pathway | NCI Pathway Interaction Database: INS | |
| KEGG: INS | ||
| REACTOME: INS | ||
| ConsensusPathDB | ||
| Pathway Commons: INS | ||
| Metabolism | MetaCyc: INS | |
| HUMANCyc: INS | ||
| Regulation | Ensembl's Regulation: ENSG00000254647 | |
| miRBase: chr11 :2,181,008-2,182,439 | ||
| TargetScan: NM_000207 | ||
| cisRED: ENSG00000254647 | ||
| Context | iHOP: INS | |
| cancer metabolism search in PubMed: INS | ||
| UCL Cancer Institute: INS | ||
| Assigned class in ccmGDB | A - This gene has a literature evidence and it belongs to cancer gene. | |
| References showing role of INS in cancer cell metabolism | 1. Lin LL, Huang HC, Juan HF, Taida Cancer Systems Biology Study G (2015) Circadian systems biology in Metazoa. Brief Bioinform. doi: 10.1093/bib/bbv006. go to article 2. Ferroni P, Riondino S, Buonomo O, Palmirotta R, Guadagni F, et al. (2015) Type 2 Diabetes and Breast Cancer: The Interplay between Impaired Glucose Metabolism and Oxidant Stress. Oxid Med Cell Longev 2015: 183928. doi: 10.1155/2015/183928. pmid: 4480937. go to article 3. Feitelson MA, Arzumanyan A, Kulathinal RJ, Blain SW, Holcombe RF, et al. (2015) Sustained proliferation in cancer: Mechanisms and novel therapeutic targets. Semin Cancer Biol. doi: 10.1016/j.semcancer.2015.02.006. go to article | |
| Top |
| Phenotypic Information for INS(metabolism pathway, cancer, disease, phenome) |
| Cancer | CGAP: INS |
| Familial Cancer Database: INS | |
| * This gene is included in those cancer gene databases. |
|
|
|
|
|
| . | ||||||||||||||
Oncogene 1 | Significant driver gene in | |||||||||||||||||||
| cf) number; DB name 1 Oncogene; http://nar.oxfordjournals.org/content/35/suppl_1/D721.long, 2 Tumor Suppressor gene; https://bioinfo.uth.edu/TSGene/, 3 Cancer Gene Census; http://www.nature.com/nrc/journal/v4/n3/abs/nrc1299.html, 4 CancerGenes; http://nar.oxfordjournals.org/content/35/suppl_1/D721.long, 5 Network of Cancer Gene; http://ncg.kcl.ac.uk/index.php, 1Therapeutic Vulnerabilities in Cancer; http://cbio.mskcc.org/cancergenomics/statius/ |
| REACTOME_INTEGRATION_OF_ENERGY_METABOLISM | |
| OMIM | 125852; phenotype. 176730; gene+phenotype. 606176; phenotype. 613370; phenotype. |
| Orphanet | 552; MODY syndrome. 99885; Permanent neonatal diabetes mellitus. |
| Disease | KEGG Disease: INS |
| MedGen: INS (Human Medical Genetics with Condition) | |
| ClinVar: INS | |
| Phenotype | MGI: INS (International Mouse Phenotyping Consortium) |
| PhenomicDB: INS | |
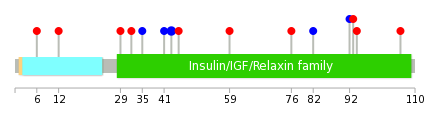
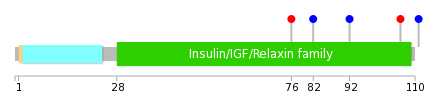
| Mutations for INS |
| * Under tables are showing count per each tissue to give us broad intuition about tissue specific mutation patterns.You can go to the detailed page for each mutation database's web site. |
| There's no structural variation information in COSMIC data for this gene. |
| * From mRNA Sanger sequences, Chitars2.0 arranged chimeric transcripts. This table shows INS related fusion information. |
| ID | Head Gene | Tail Gene | Accession | Gene_a | qStart_a | qEnd_a | Chromosome_a | tStart_a | tEnd_a | Gene_a | qStart_a | qEnd_a | Chromosome_a | tStart_a | tEnd_a |
| BC148488 | IGF2 | 33 | 220 | 11 | 2129117 | 2149603 | INS | 221 | 640 | 11 | 2159779 | 2161209 | |
| BC153083 | IGF2 | 33 | 220 | 11 | 2129117 | 2149603 | INS | 221 | 640 | 11 | 2159779 | 2161209 | |
| Top |
| There's no copy number variation information in COSMIC data for this gene. |
| Top |
|
 |
| Top |
| Stat. for Non-Synonymous SNVs (# total SNVs=8) | (# total SNVs=5) |
 |  |
(# total SNVs=0) | (# total SNVs=0) |
| Top |
| * When you move the cursor on each content, you can see more deailed mutation information on the Tooltip. Those are primary_site,primary_histology,mutation(aa),pubmedID. |
| GRCh37 position | Mutation(aa) | Unique sampleID count |
| chr11:2182073-2182073 | p.C43C | 2 |
| chr11:2182027-2182027 | p.E59K | 1 |
| chr11:2182069-2182069 | p.E45K | 1 |
| chr11:2182081-2182081 | p.L41L | 1 |
| chr11:2181082-2181082 | p.*111* | 1 |
| chr11:2182097-2182097 | p.L35L | 1 |
| chr11:2181097-2181097 | p.E106D | 1 |
| chr11:2182108-2182108 | p.G32R | 1 |
| chr11:2181135-2181135 | p.Q94K | 1 |
| chr11:2182116-2182116 | p.H29P | 1 |
| Top |
|
 |
| Point Mutation/ Tissue ID | 1 | 2 | 3 | 4 | 5 | 6 | 7 | 8 | 9 | 10 | 11 | 12 | 13 | 14 | 15 | 16 | 17 | 18 | 19 | 20 |
| # sample | 2 | 1 | 2 | |||||||||||||||||
| # mutation | 2 | 1 | 2 | |||||||||||||||||
| nonsynonymous SNV | 1 | 1 | ||||||||||||||||||
| synonymous SNV | 1 | 1 | 1 |
| cf) Tissue ID; Tissue type (1; BLCA[Bladder Urothelial Carcinoma], 2; BRCA[Breast invasive carcinoma], 3; CESC[Cervical squamous cell carcinoma and endocervical adenocarcinoma], 4; COAD[Colon adenocarcinoma], 5; GBM[Glioblastoma multiforme], 6; Glioma Low Grade, 7; HNSC[Head and Neck squamous cell carcinoma], 8; KICH[Kidney Chromophobe], 9; KIRC[Kidney renal clear cell carcinoma], 10; KIRP[Kidney renal papillary cell carcinoma], 11; LAML[Acute Myeloid Leukemia], 12; LUAD[Lung adenocarcinoma], 13; LUSC[Lung squamous cell carcinoma], 14; OV[Ovarian serous cystadenocarcinoma ], 15; PAAD[Pancreatic adenocarcinoma], 16; PRAD[Prostate adenocarcinoma], 17; SKCM[Skin Cutaneous Melanoma], 18:STAD[Stomach adenocarcinoma], 19:THCA[Thyroid carcinoma], 20:UCEC[Uterine Corpus Endometrial Carcinoma]) |
| Top |
| * We represented just top 10 SNVs. When you move the cursor on each content, you can see more deailed mutation information on the Tooltip. Those are primary_site, primary_histology, mutation(aa), pubmedID. |
| Genomic Position | Mutation(aa) | Unique sampleID count |
| chr11:2181082 | p.X111X,INS | 1 |
| chr11:2181097 | p.E106D,INS | 1 |
| chr11:2181139 | p.V92V,INS | 1 |
| chr11:2181169 | p.L82L,INS | 1 |
| chr11:2181187 | p.S76R,INS | 1 |
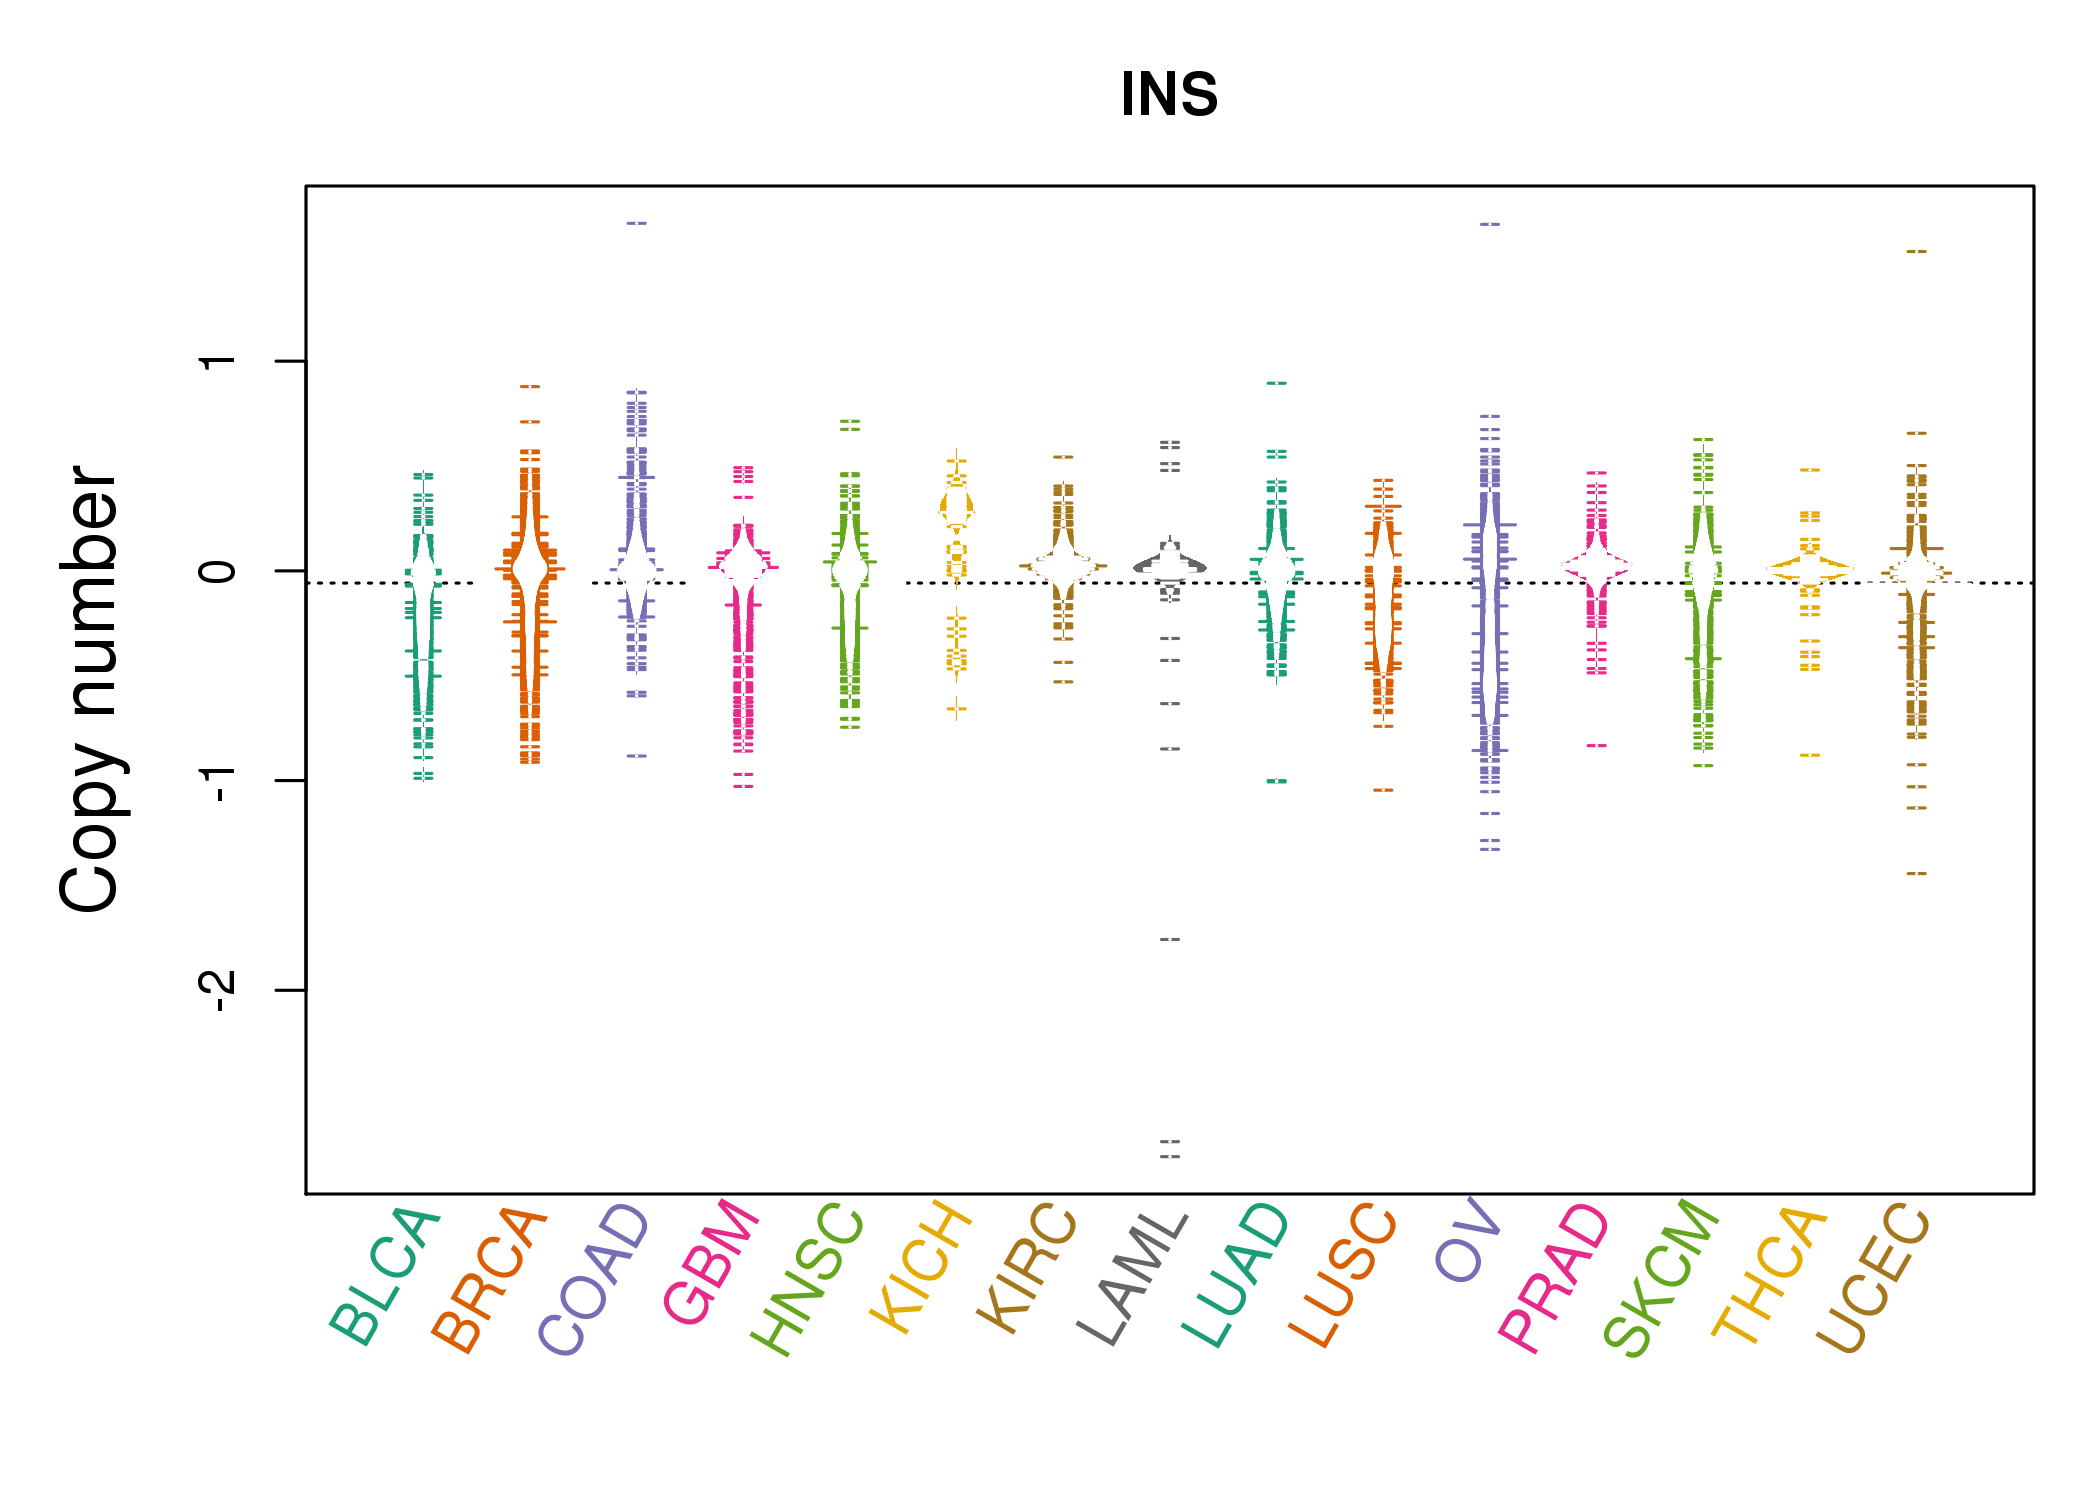
| * Copy number data were extracted from TCGA using R package TCGA-Assembler. The URLs of all public data files on TCGA DCC data server were gathered on Jan-05-2015. Function ProcessCNAData in TCGA-Assembler package was used to obtain gene-level copy number value which is calculated as the average copy number of the genomic region of a gene. |
 |
| cf) Tissue ID[Tissue type]: BLCA[Bladder Urothelial Carcinoma], BRCA[Breast invasive carcinoma], CESC[Cervical squamous cell carcinoma and endocervical adenocarcinoma], COAD[Colon adenocarcinoma], GBM[Glioblastoma multiforme], Glioma Low Grade, HNSC[Head and Neck squamous cell carcinoma], KICH[Kidney Chromophobe], KIRC[Kidney renal clear cell carcinoma], KIRP[Kidney renal papillary cell carcinoma], LAML[Acute Myeloid Leukemia], LUAD[Lung adenocarcinoma], LUSC[Lung squamous cell carcinoma], OV[Ovarian serous cystadenocarcinoma ], PAAD[Pancreatic adenocarcinoma], PRAD[Prostate adenocarcinoma], SKCM[Skin Cutaneous Melanoma], STAD[Stomach adenocarcinoma], THCA[Thyroid carcinoma], UCEC[Uterine Corpus Endometrial Carcinoma] |
| Top |
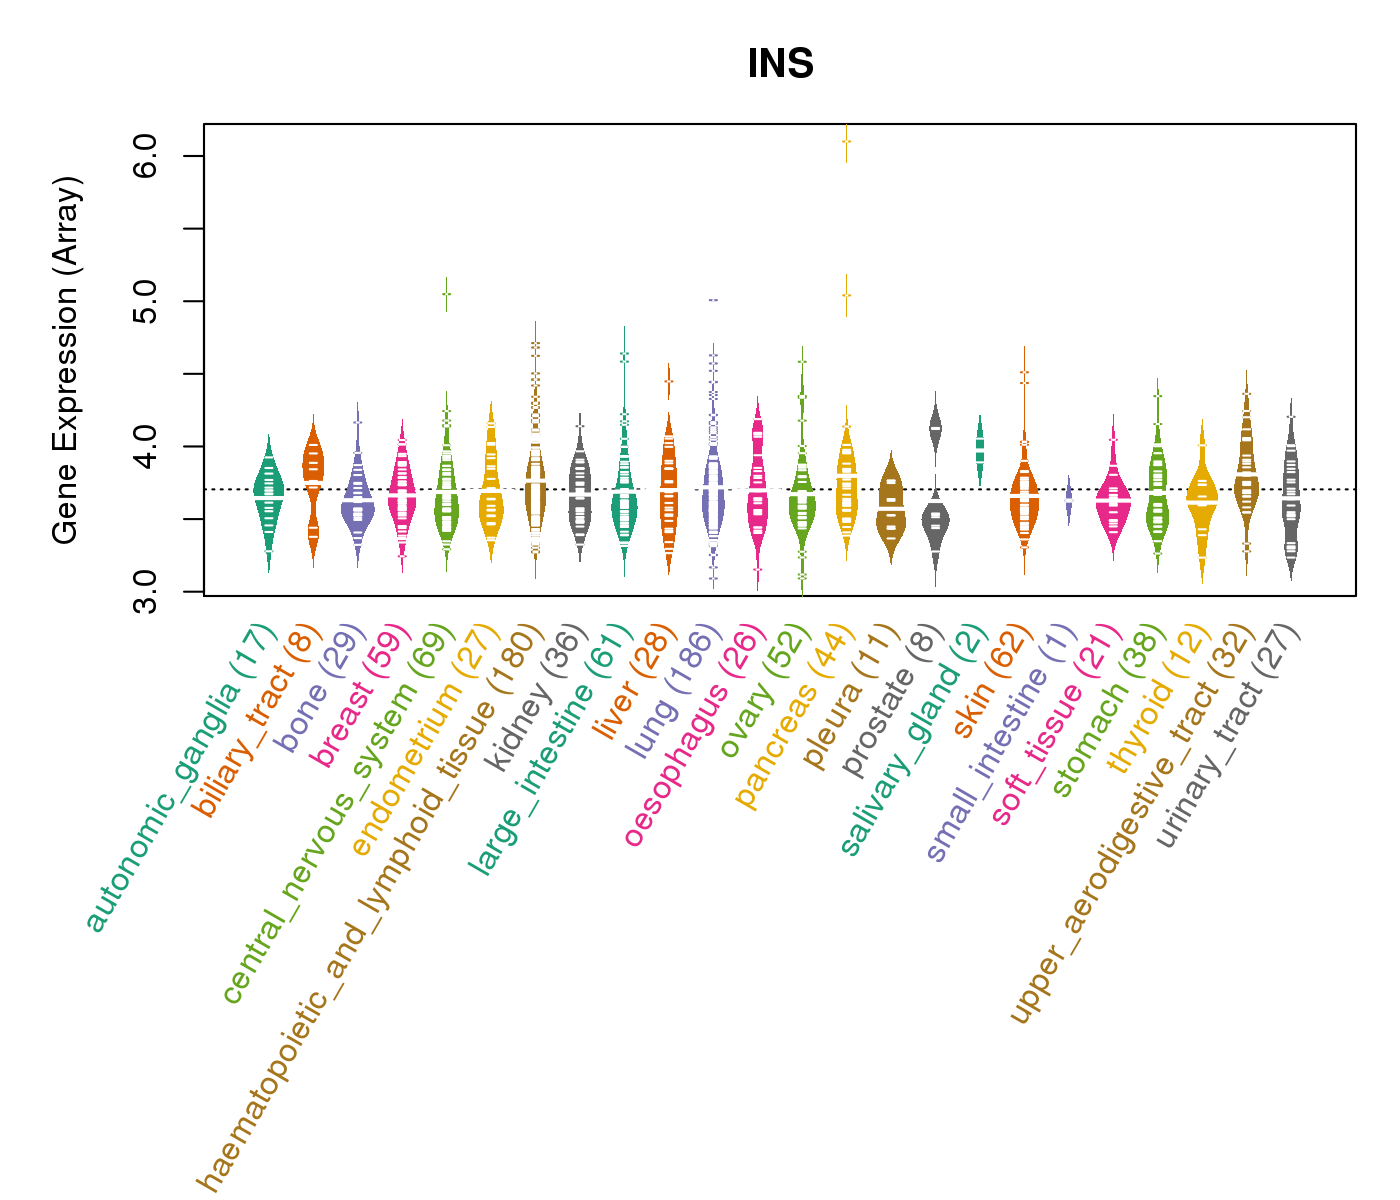
| Gene Expression for INS |
| * CCLE gene expression data were extracted from CCLE_Expression_Entrez_2012-10-18.res: Gene-centric RMA-normalized mRNA expression data. |
 |
| * Normalized gene expression data of RNASeqV2 was extracted from TCGA using R package TCGA-Assembler. The URLs of all public data files on TCGA DCC data server were gathered at Jan-05-2015. Only eight cancer types have enough normal control samples for differential expression analysis. (t test, adjusted p<0.05 (using Benjamini-Hochberg FDR)) |
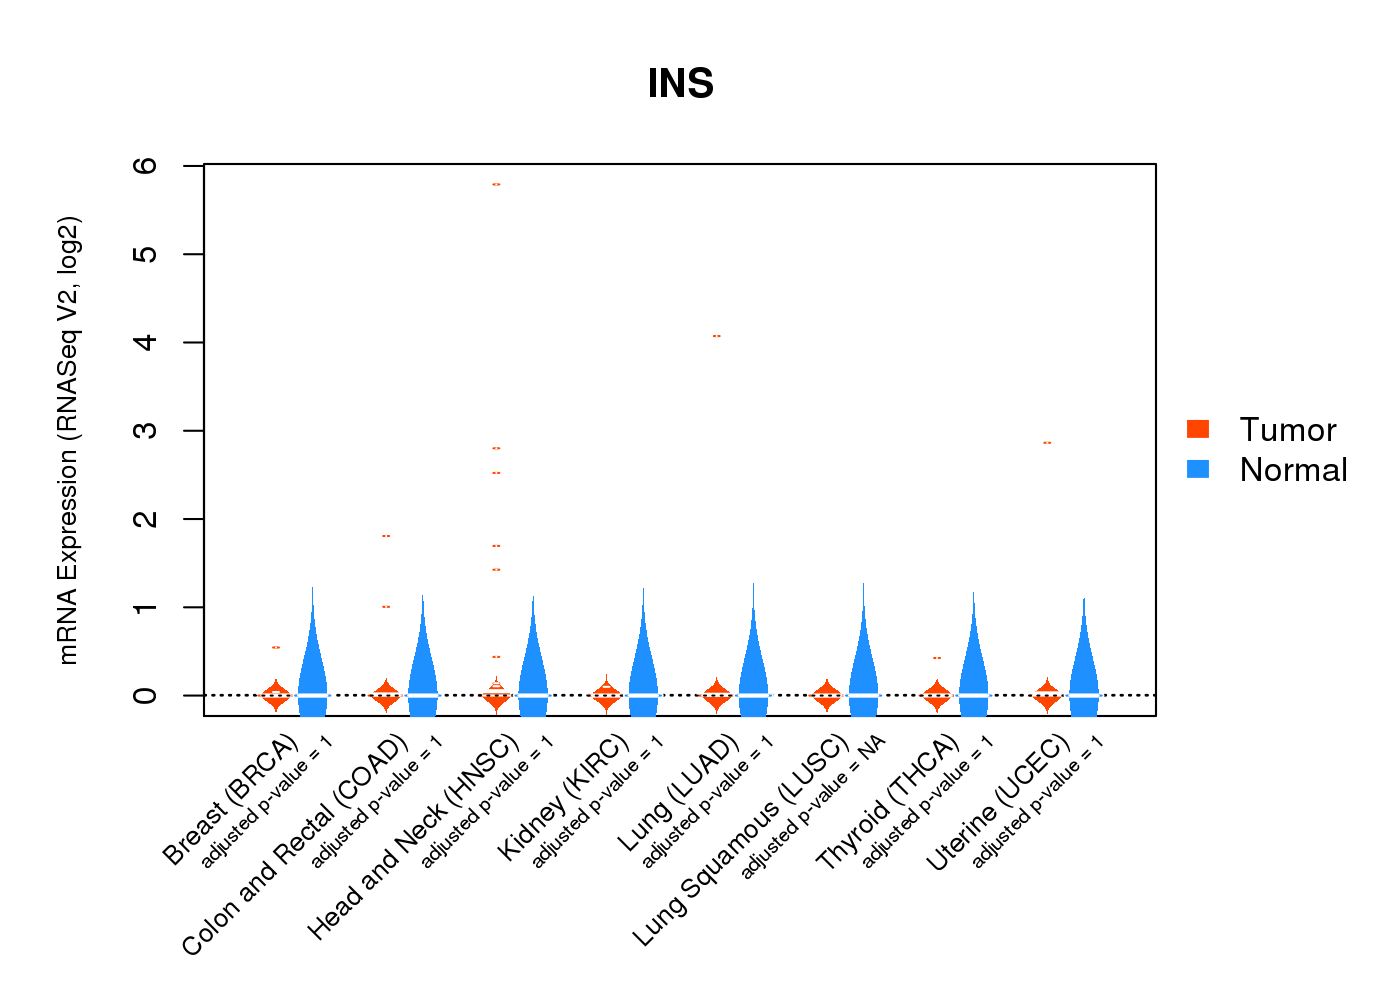 |
| Top |
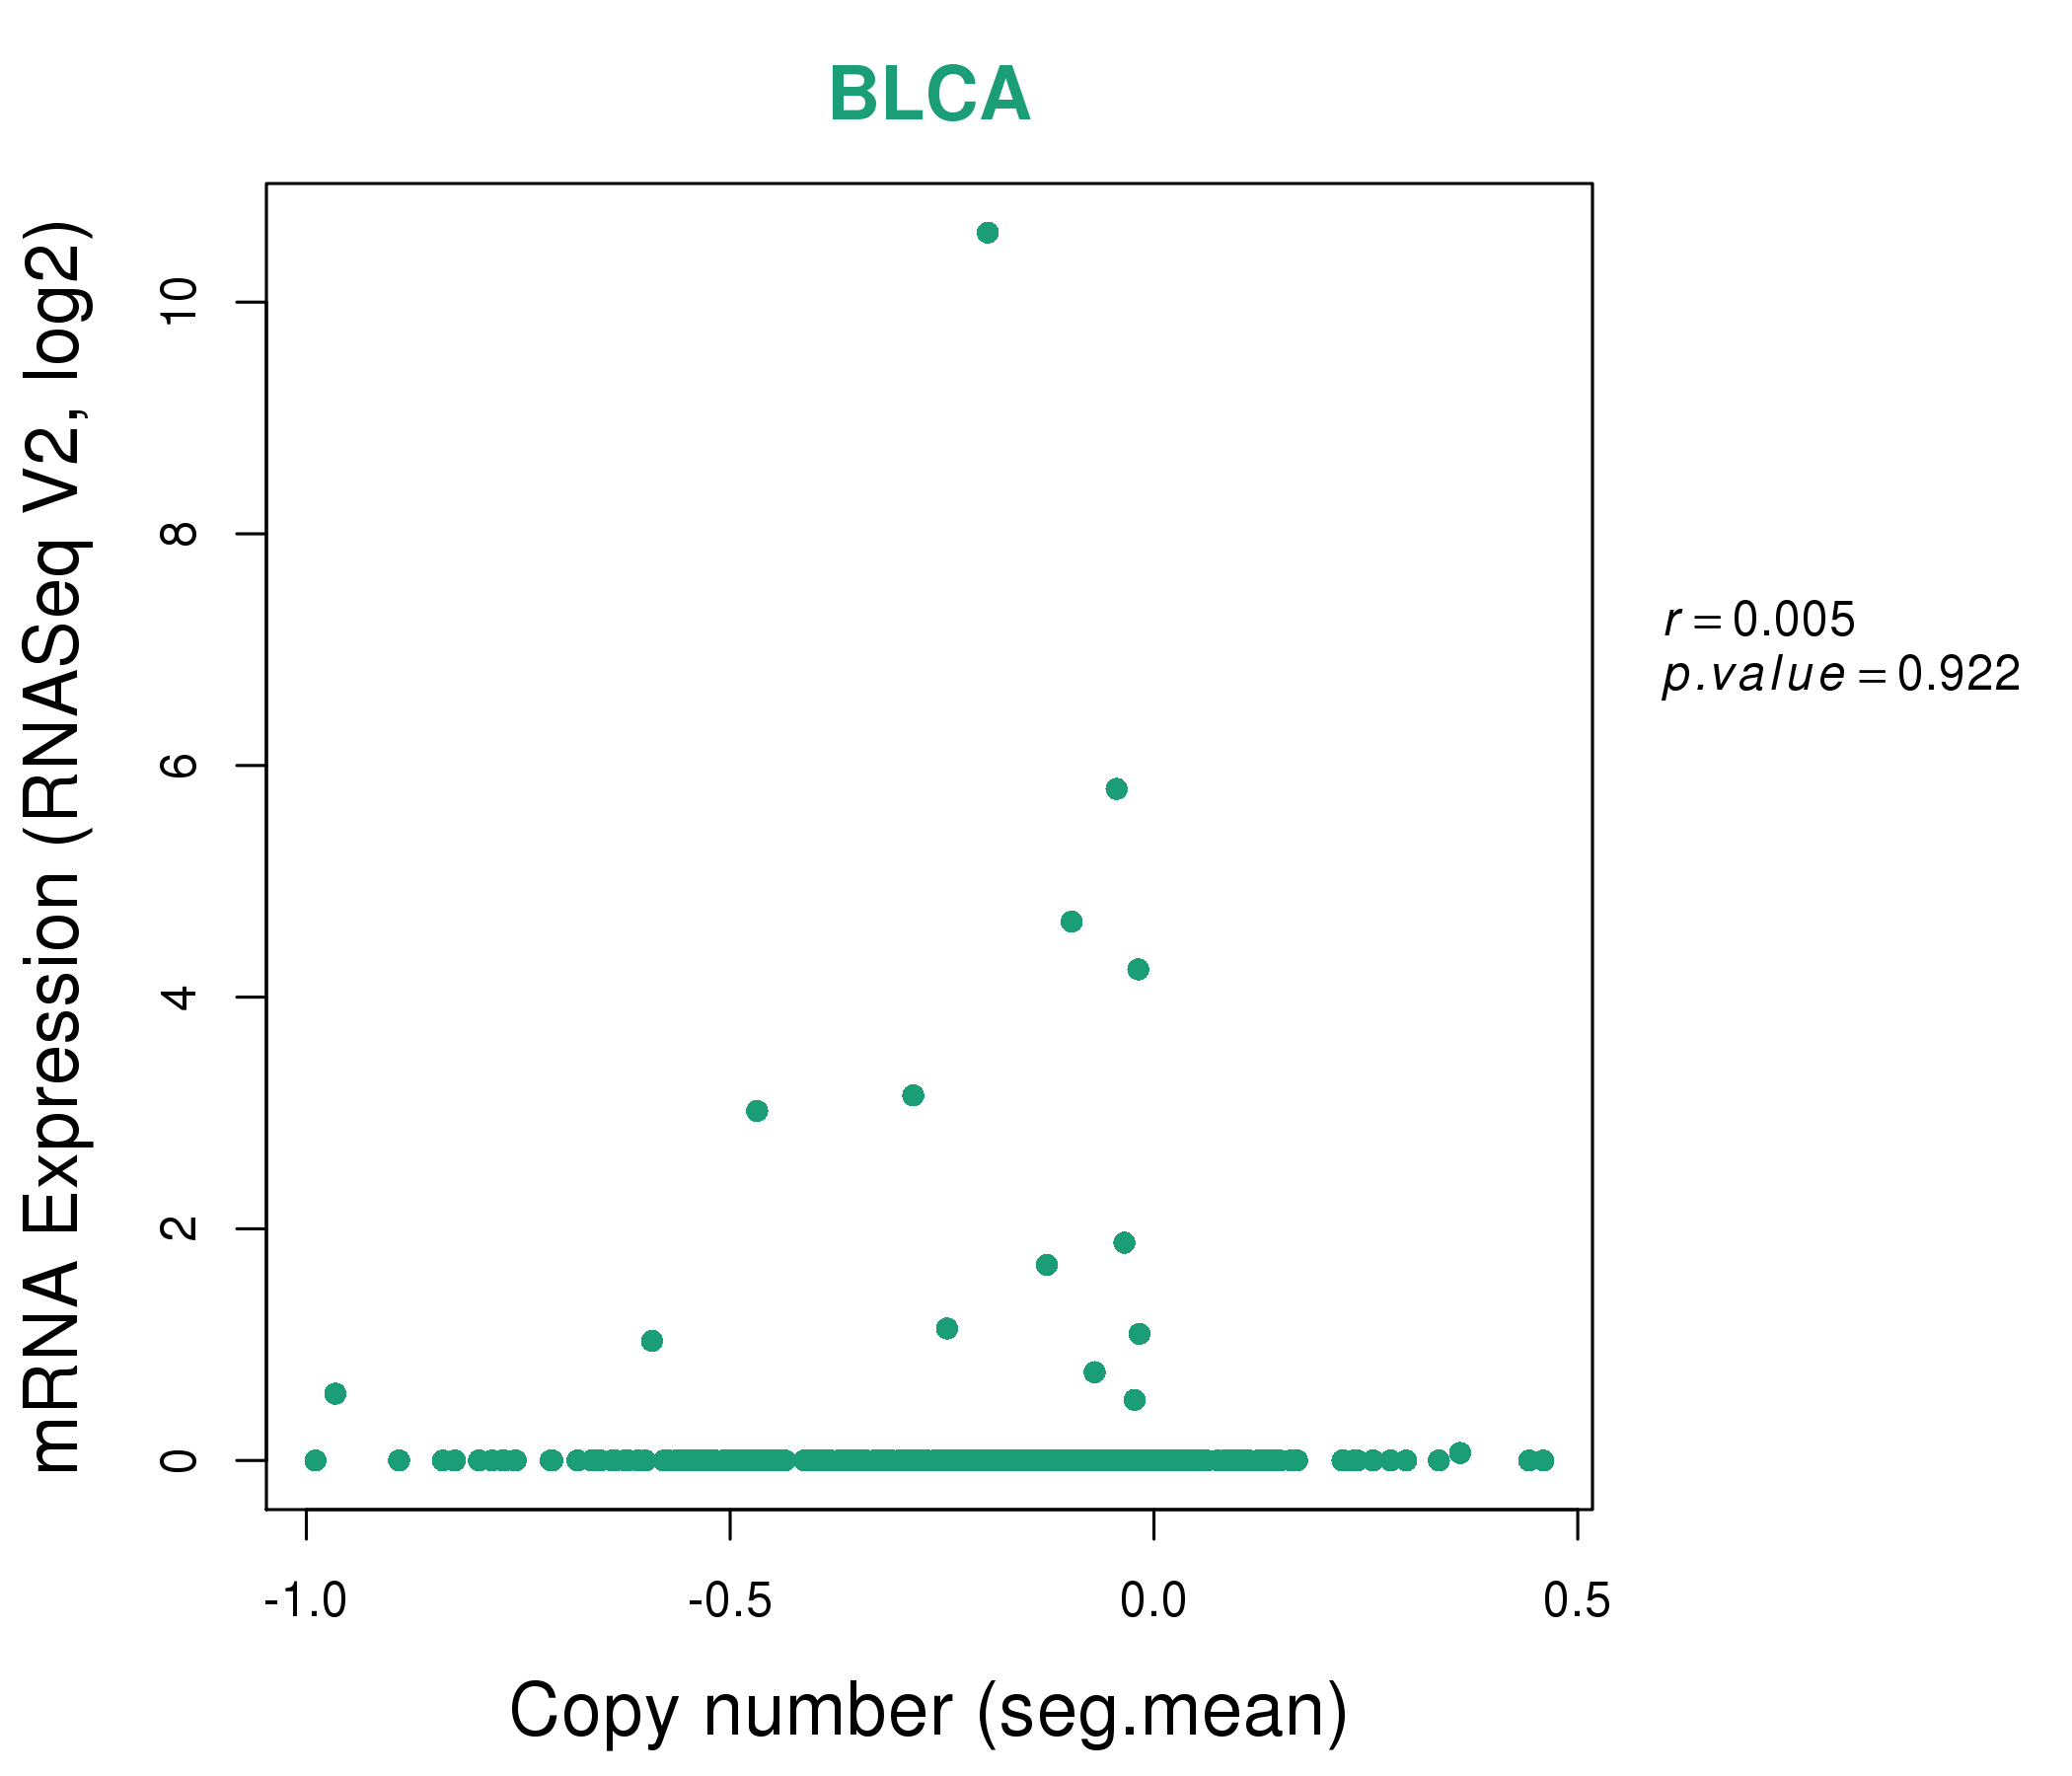
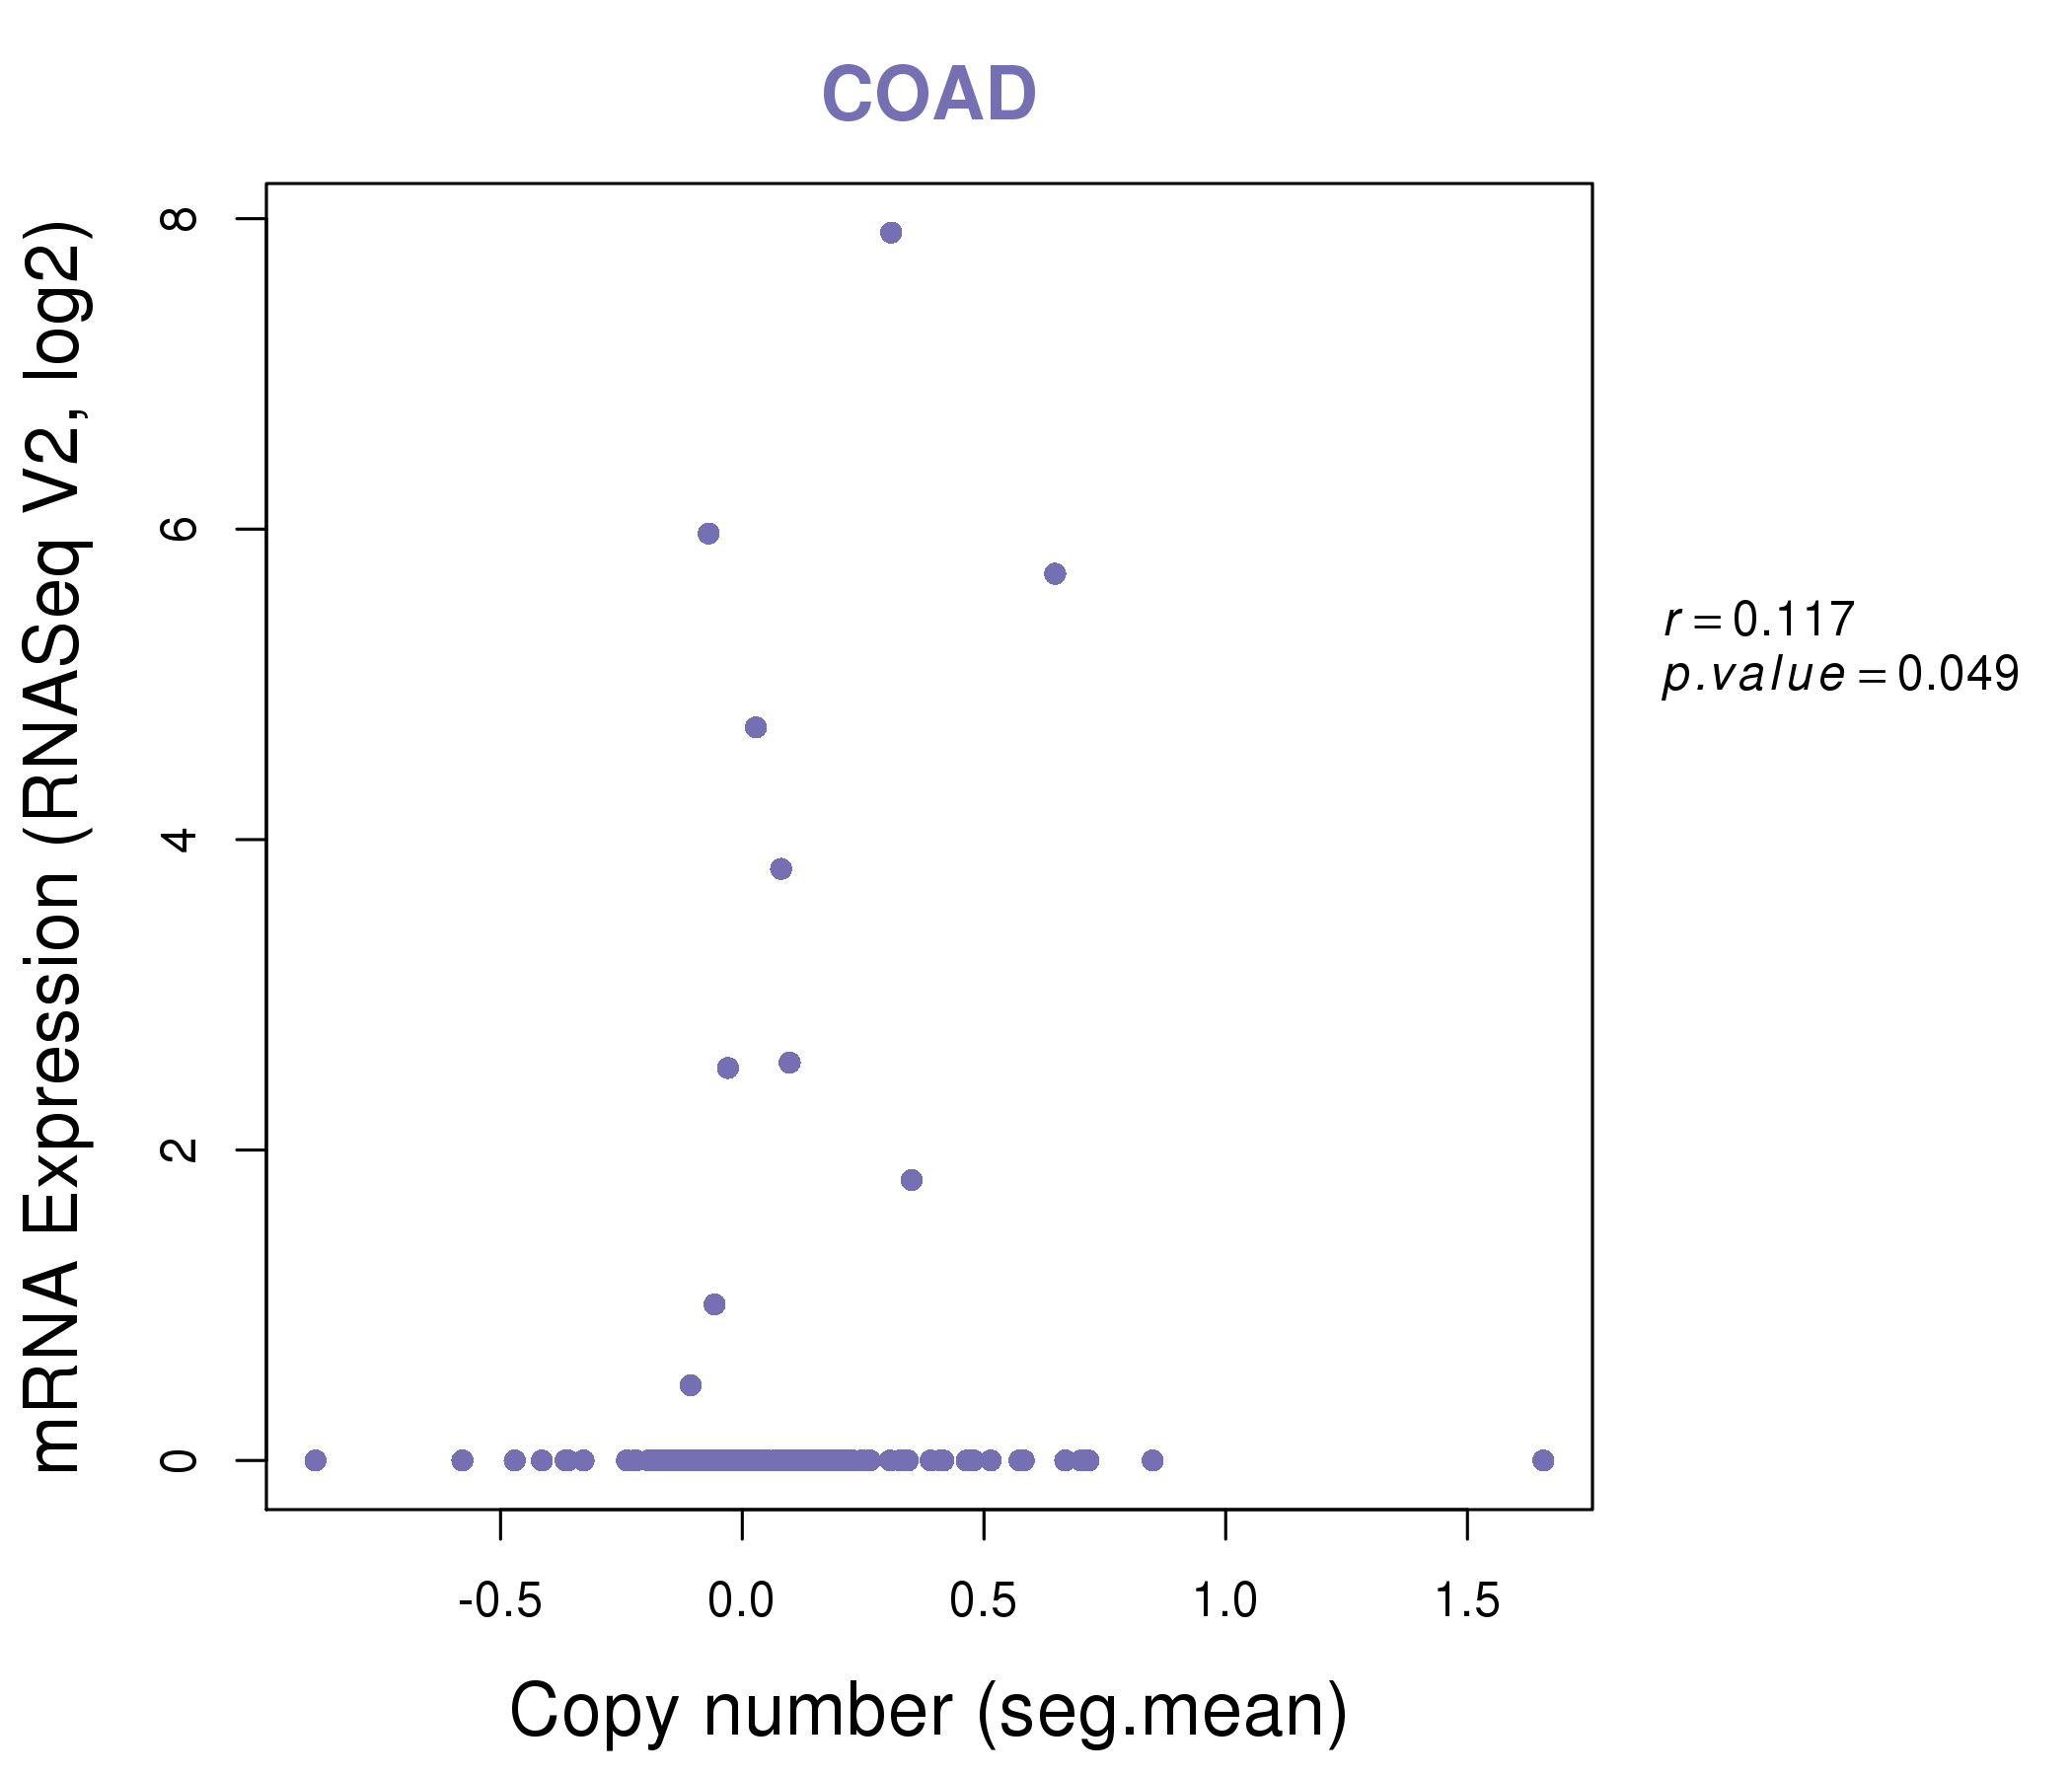
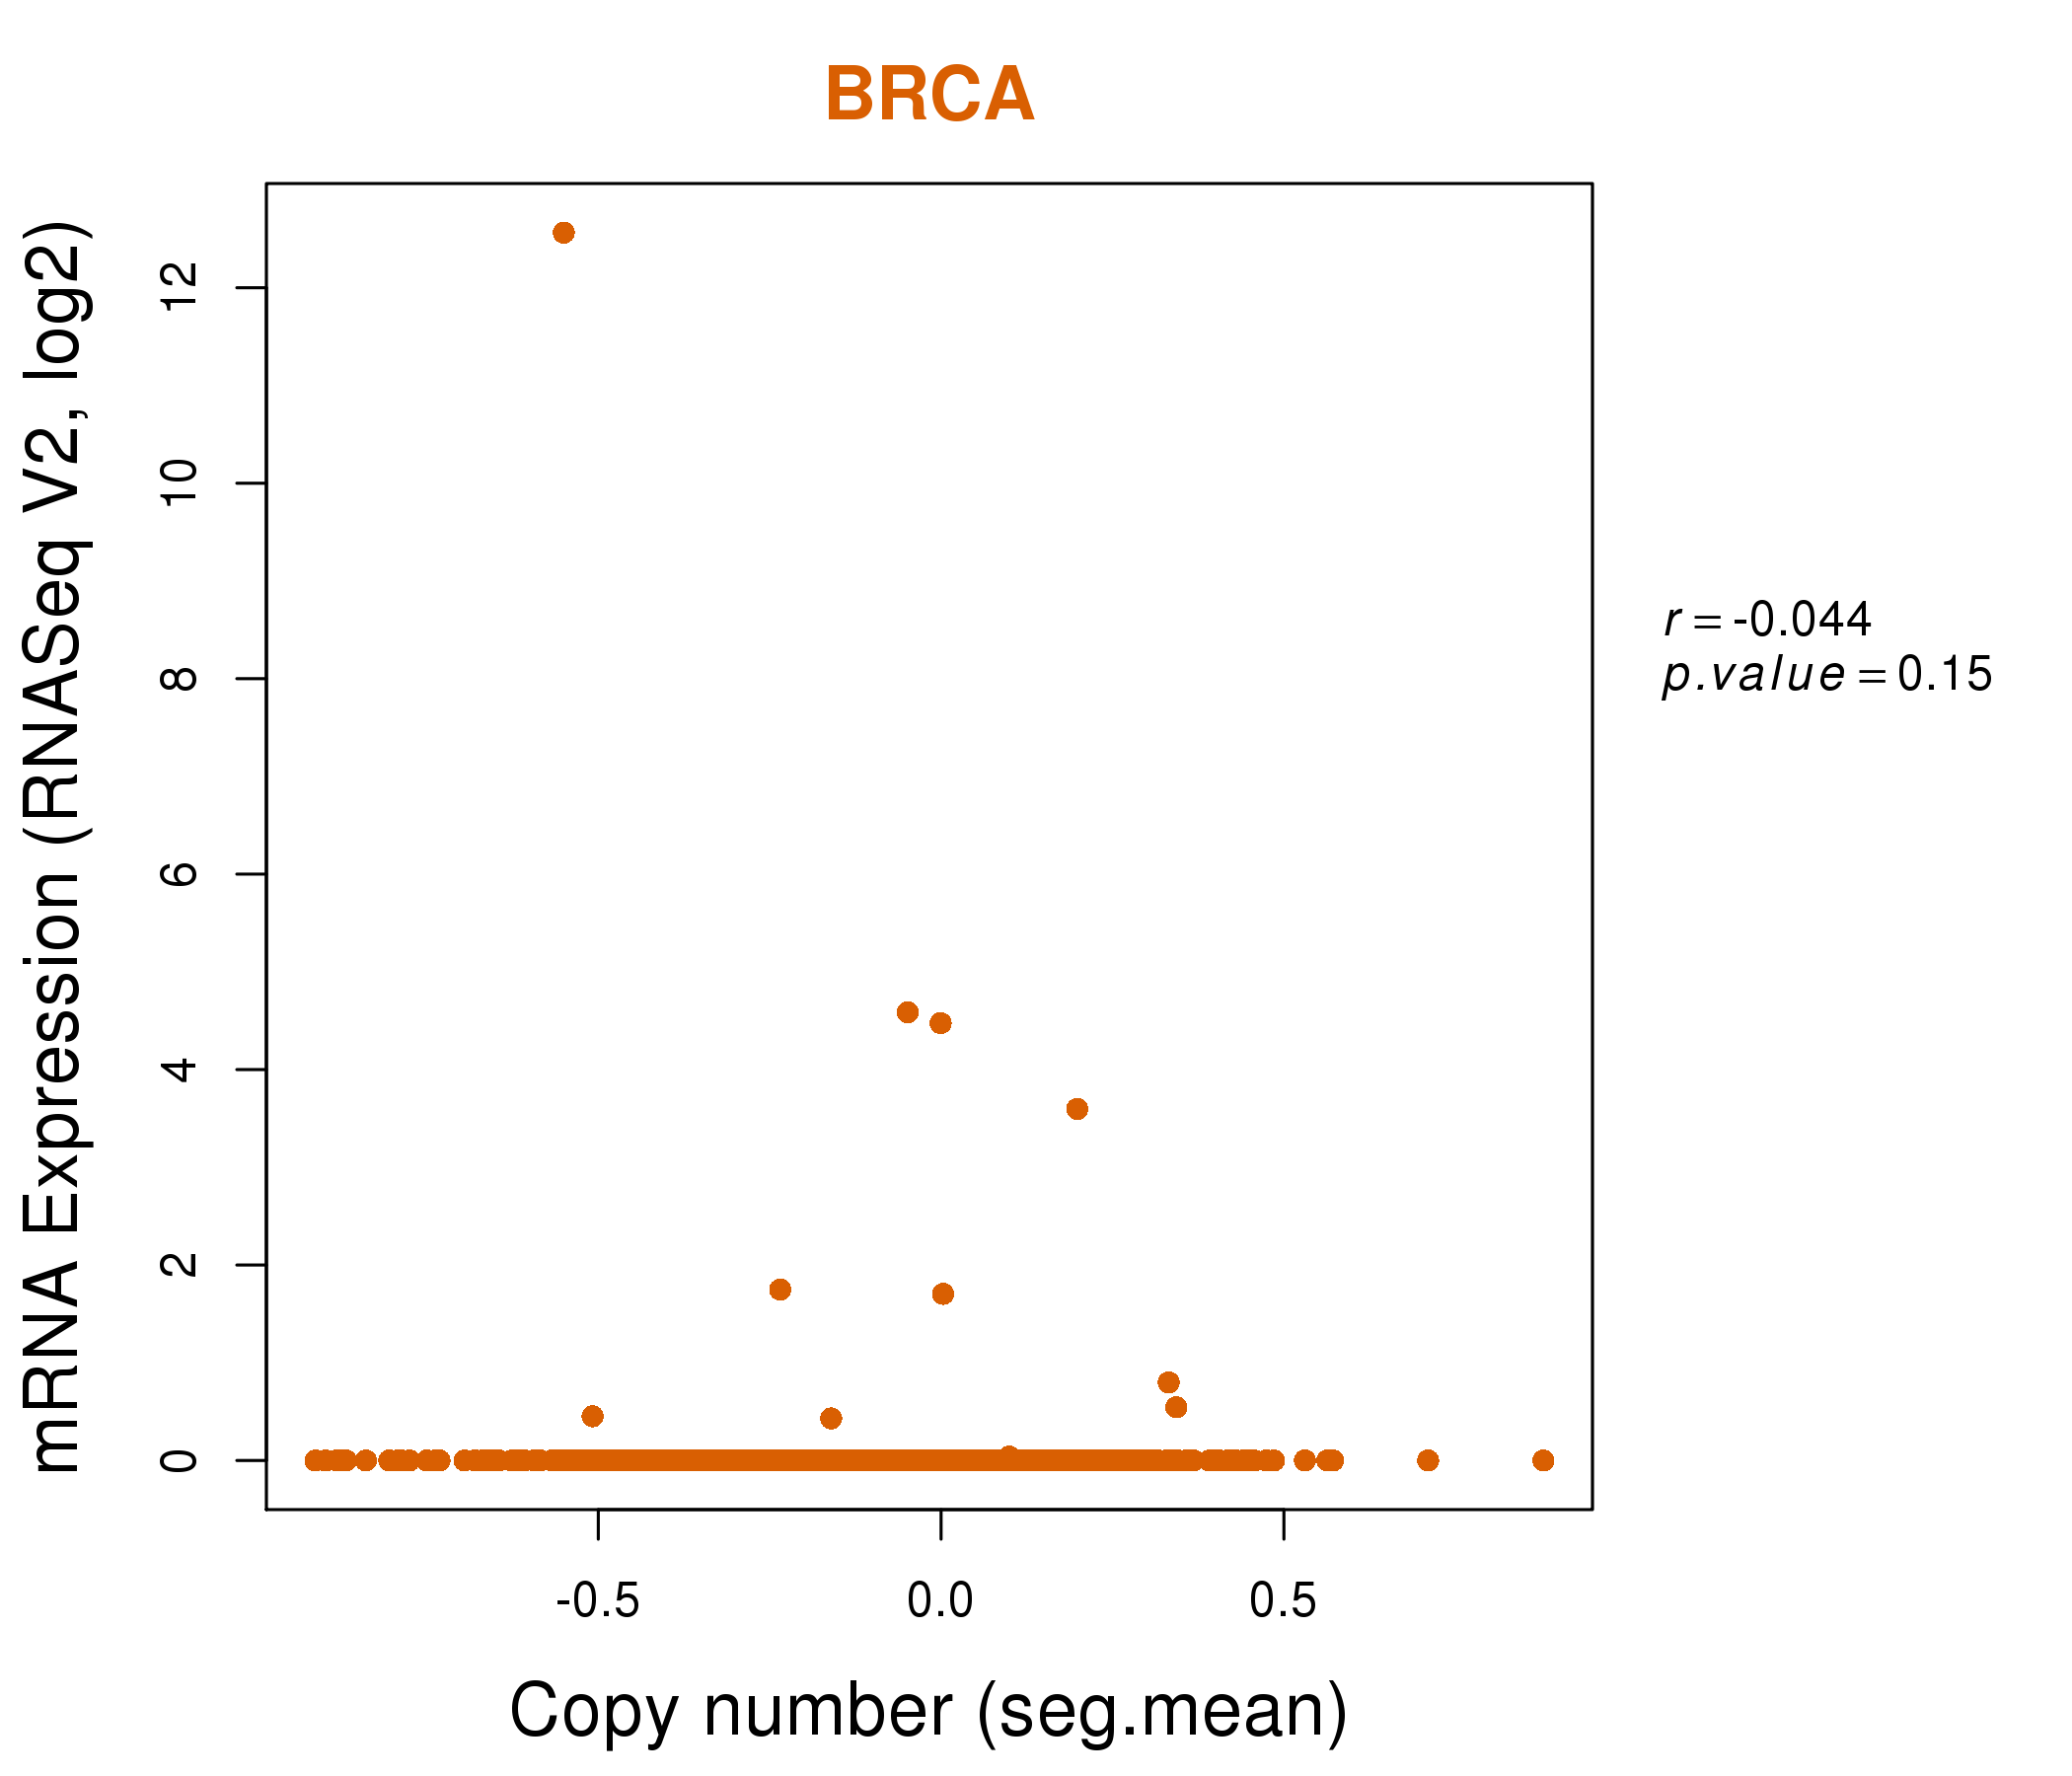
| * This plots show the correlation between CNV and gene expression. |
: Open all plots for all cancer types
 |
|
 |
|

| Top |
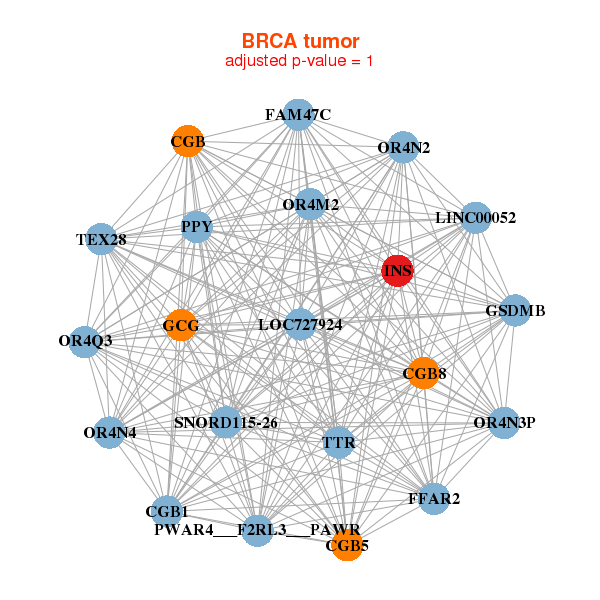
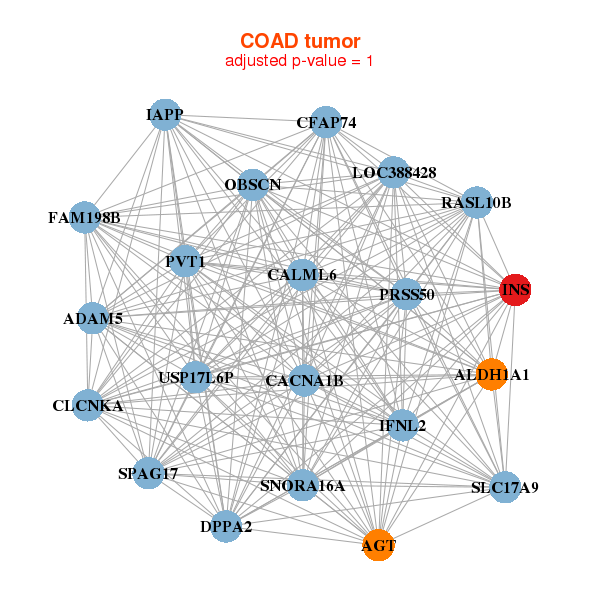
| Gene-Gene Network Information |
| * Co-Expression network figures were drawn using R package igraph. Only the top 20 genes with the highest correlations were shown. Red circle: input gene, orange circle: cell metabolism gene, sky circle: other gene |
: Open all plots for all cancer types
 |
| ||||
| CGB,CGB1,CGB5,CGB8,FAM47C,FFAR2,GCG, GSDMB,INS,LOC727924,LINC00052,OR4M2,OR4N2,OR4N3P, OR4N4,OR4Q3,PWAR4___F2RL3___PAWR,PPY,SNORD115-26,TEX28,TTR | NA,NA,NA,NA,NA,NA,NA, NA,NA,NA,NA,NA,NA,NA, NA,NA,NA,NA,NA,NA,NA | ||||
 |
| ||||
| ADAM5,AGT,ALDH1A1,CACNA1B,CALML6,CLCNKA,DPPA2, FAM198B,IAPP,IFNL2,INS,CFAP74,LOC388428,OBSCN, PRSS50,PVT1,RASL10B,SLC17A9,SNORA16A,SPAG17,USP17L6P | NA,NA,NA,NA,NA,NA,NA, NA,NA,NA,NA,NA,NA,NA, NA,NA,NA,NA,NA,NA,NA |

| * Co-Expression network figures were drawn using R package igraph. Only the top 20 genes with the highest correlations were shown. Red circle: input gene, orange circle: cell metabolism gene, sky circle: other gene |
: Open all plots for all cancer types
| Top |
: Open all interacting genes' information including KEGG pathway for all interacting genes from DAVID
| Top |
| Pharmacological Information for INS |
| DB Category | DB Name | DB's ID and Url link |
| Chemistry | ChEMBL | CHEMBL5881; -. |
| Organism-specific databases | PharmGKB | PA201; -. |
| Organism-specific databases | CTD | 3630; -. |
| * Gene Centered Interaction Network. |
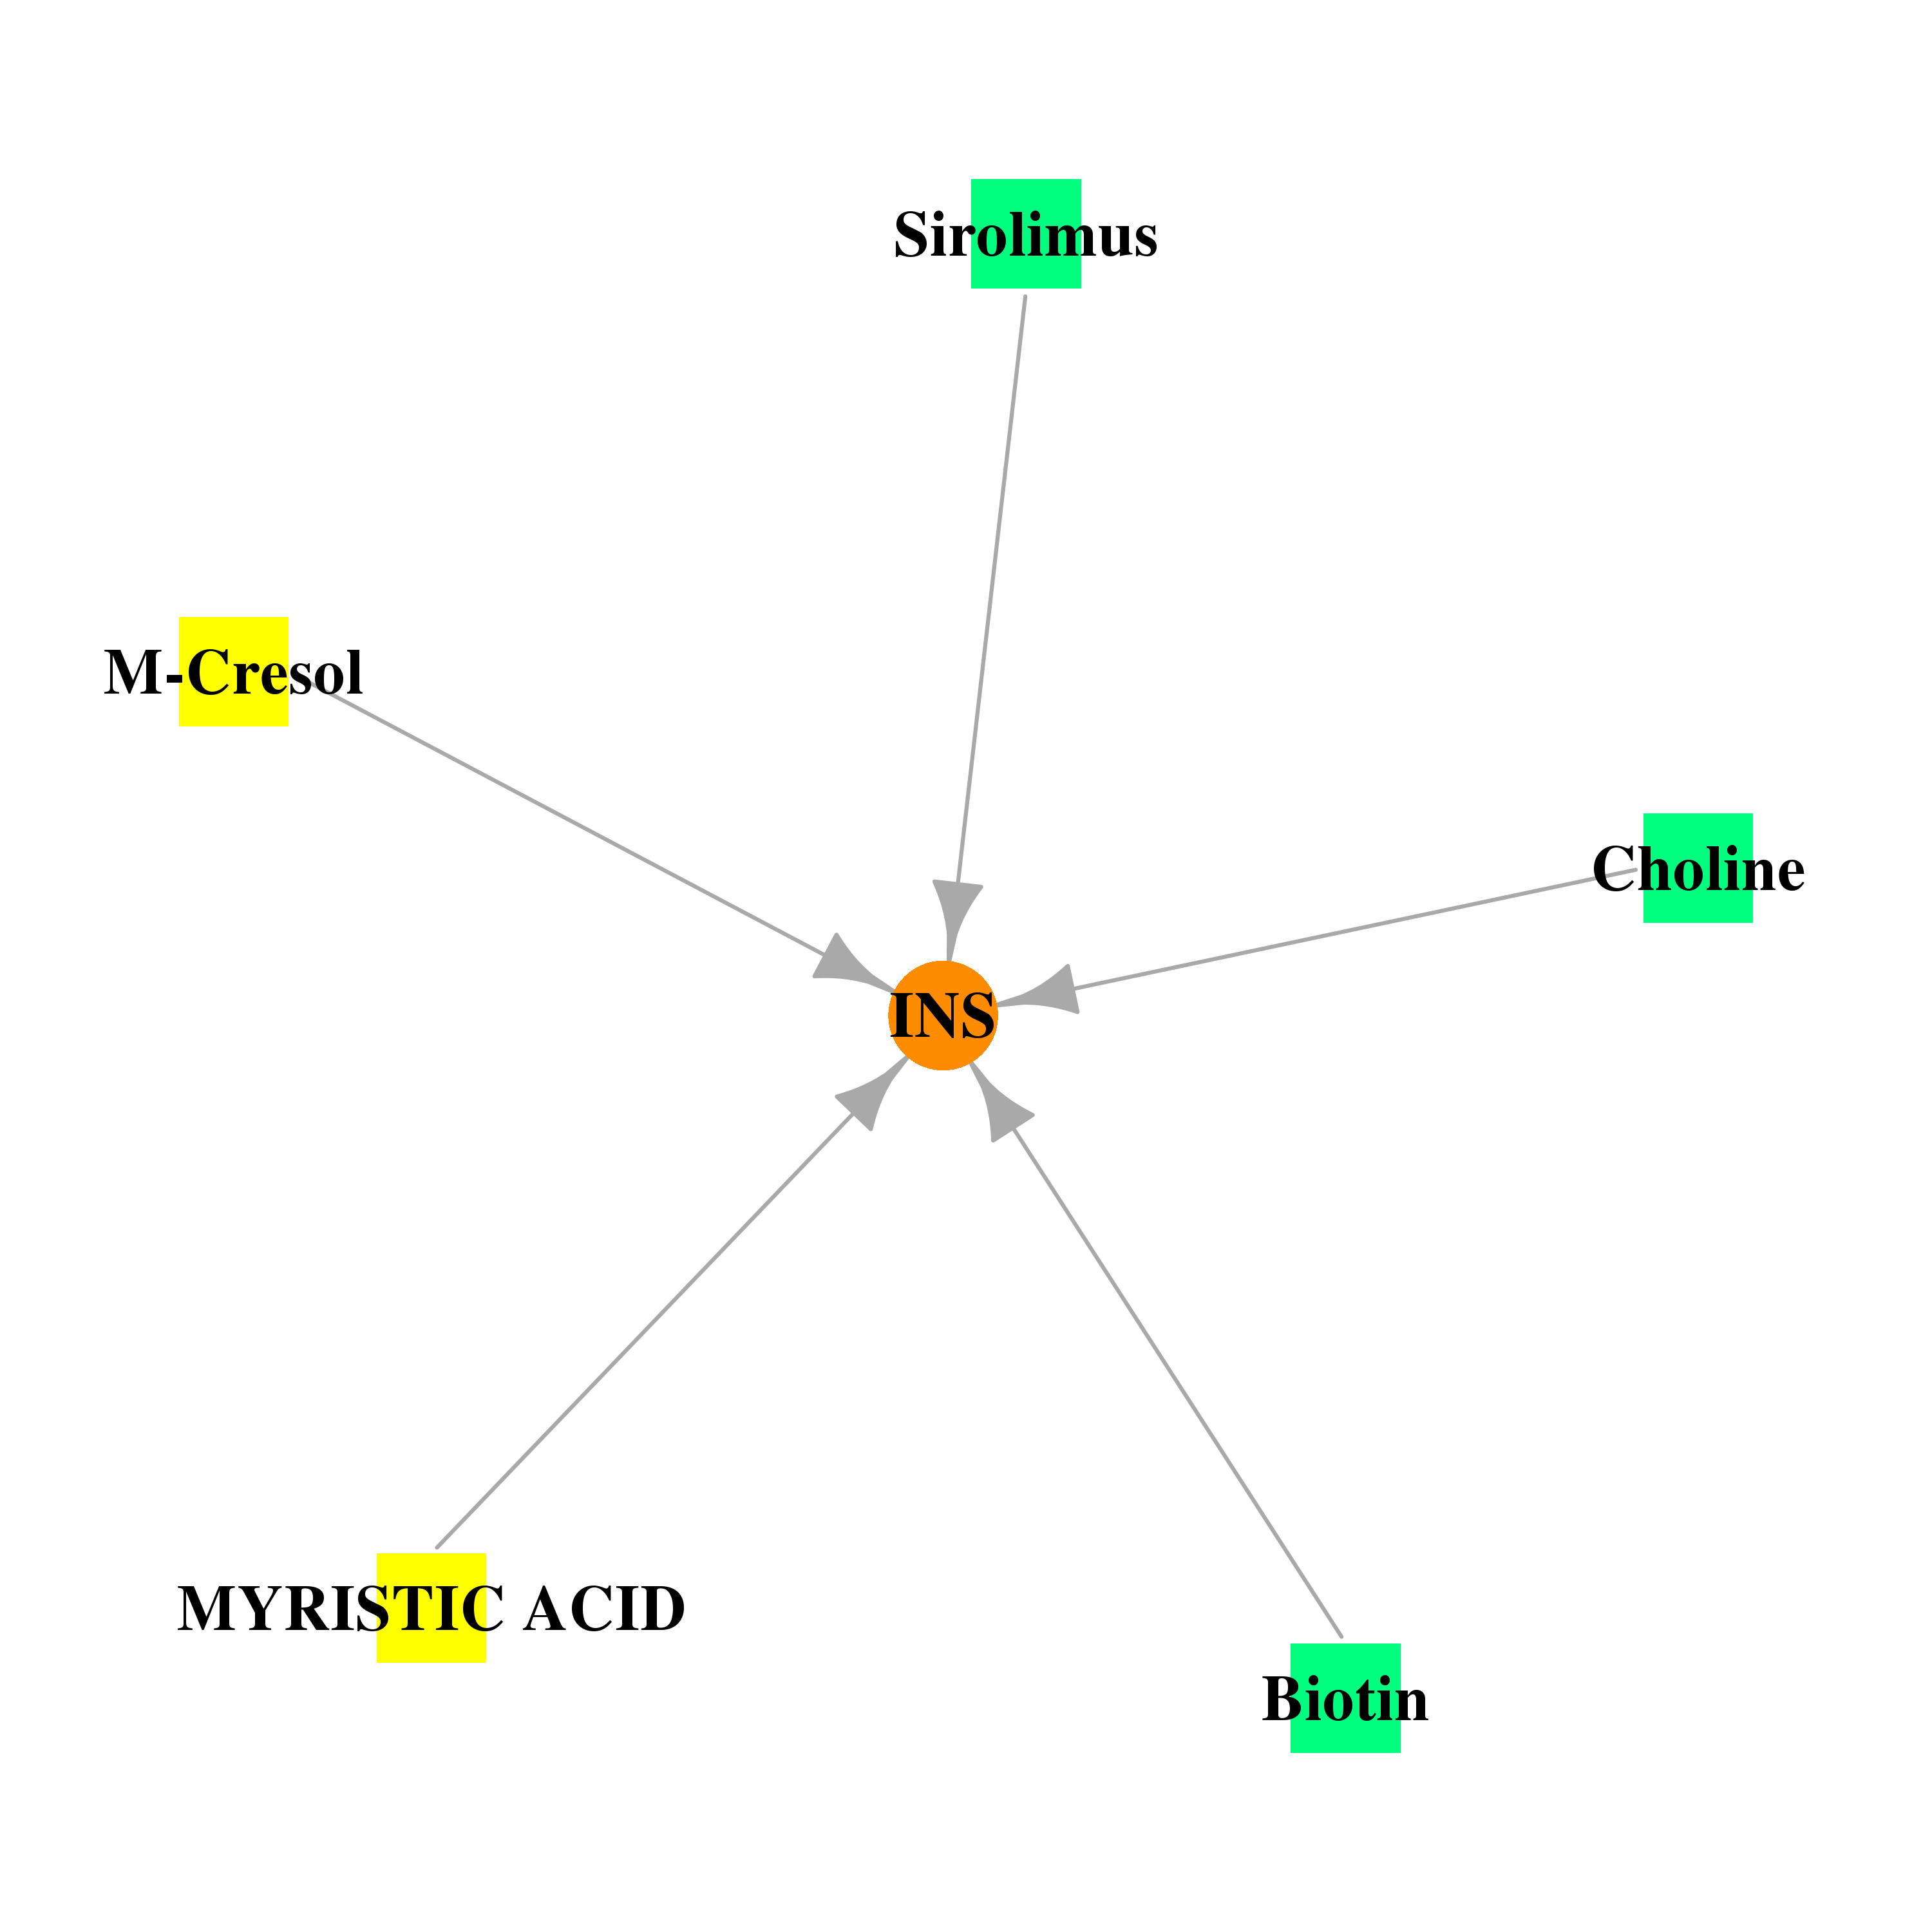 |
| * Drug Centered Interaction Network. |
| DrugBank ID | Target Name | Drug Groups | Generic Name | Drug Centered Network | Drug Structure |
| DB01776 | insulin | experimental | M-Cresol |  |  |
| DB08231 | insulin | experimental | MYRISTIC ACID |  | 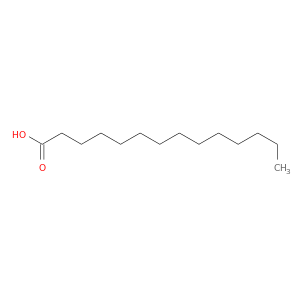 |
| DB00121 | insulin | approved; nutraceutical | Biotin | 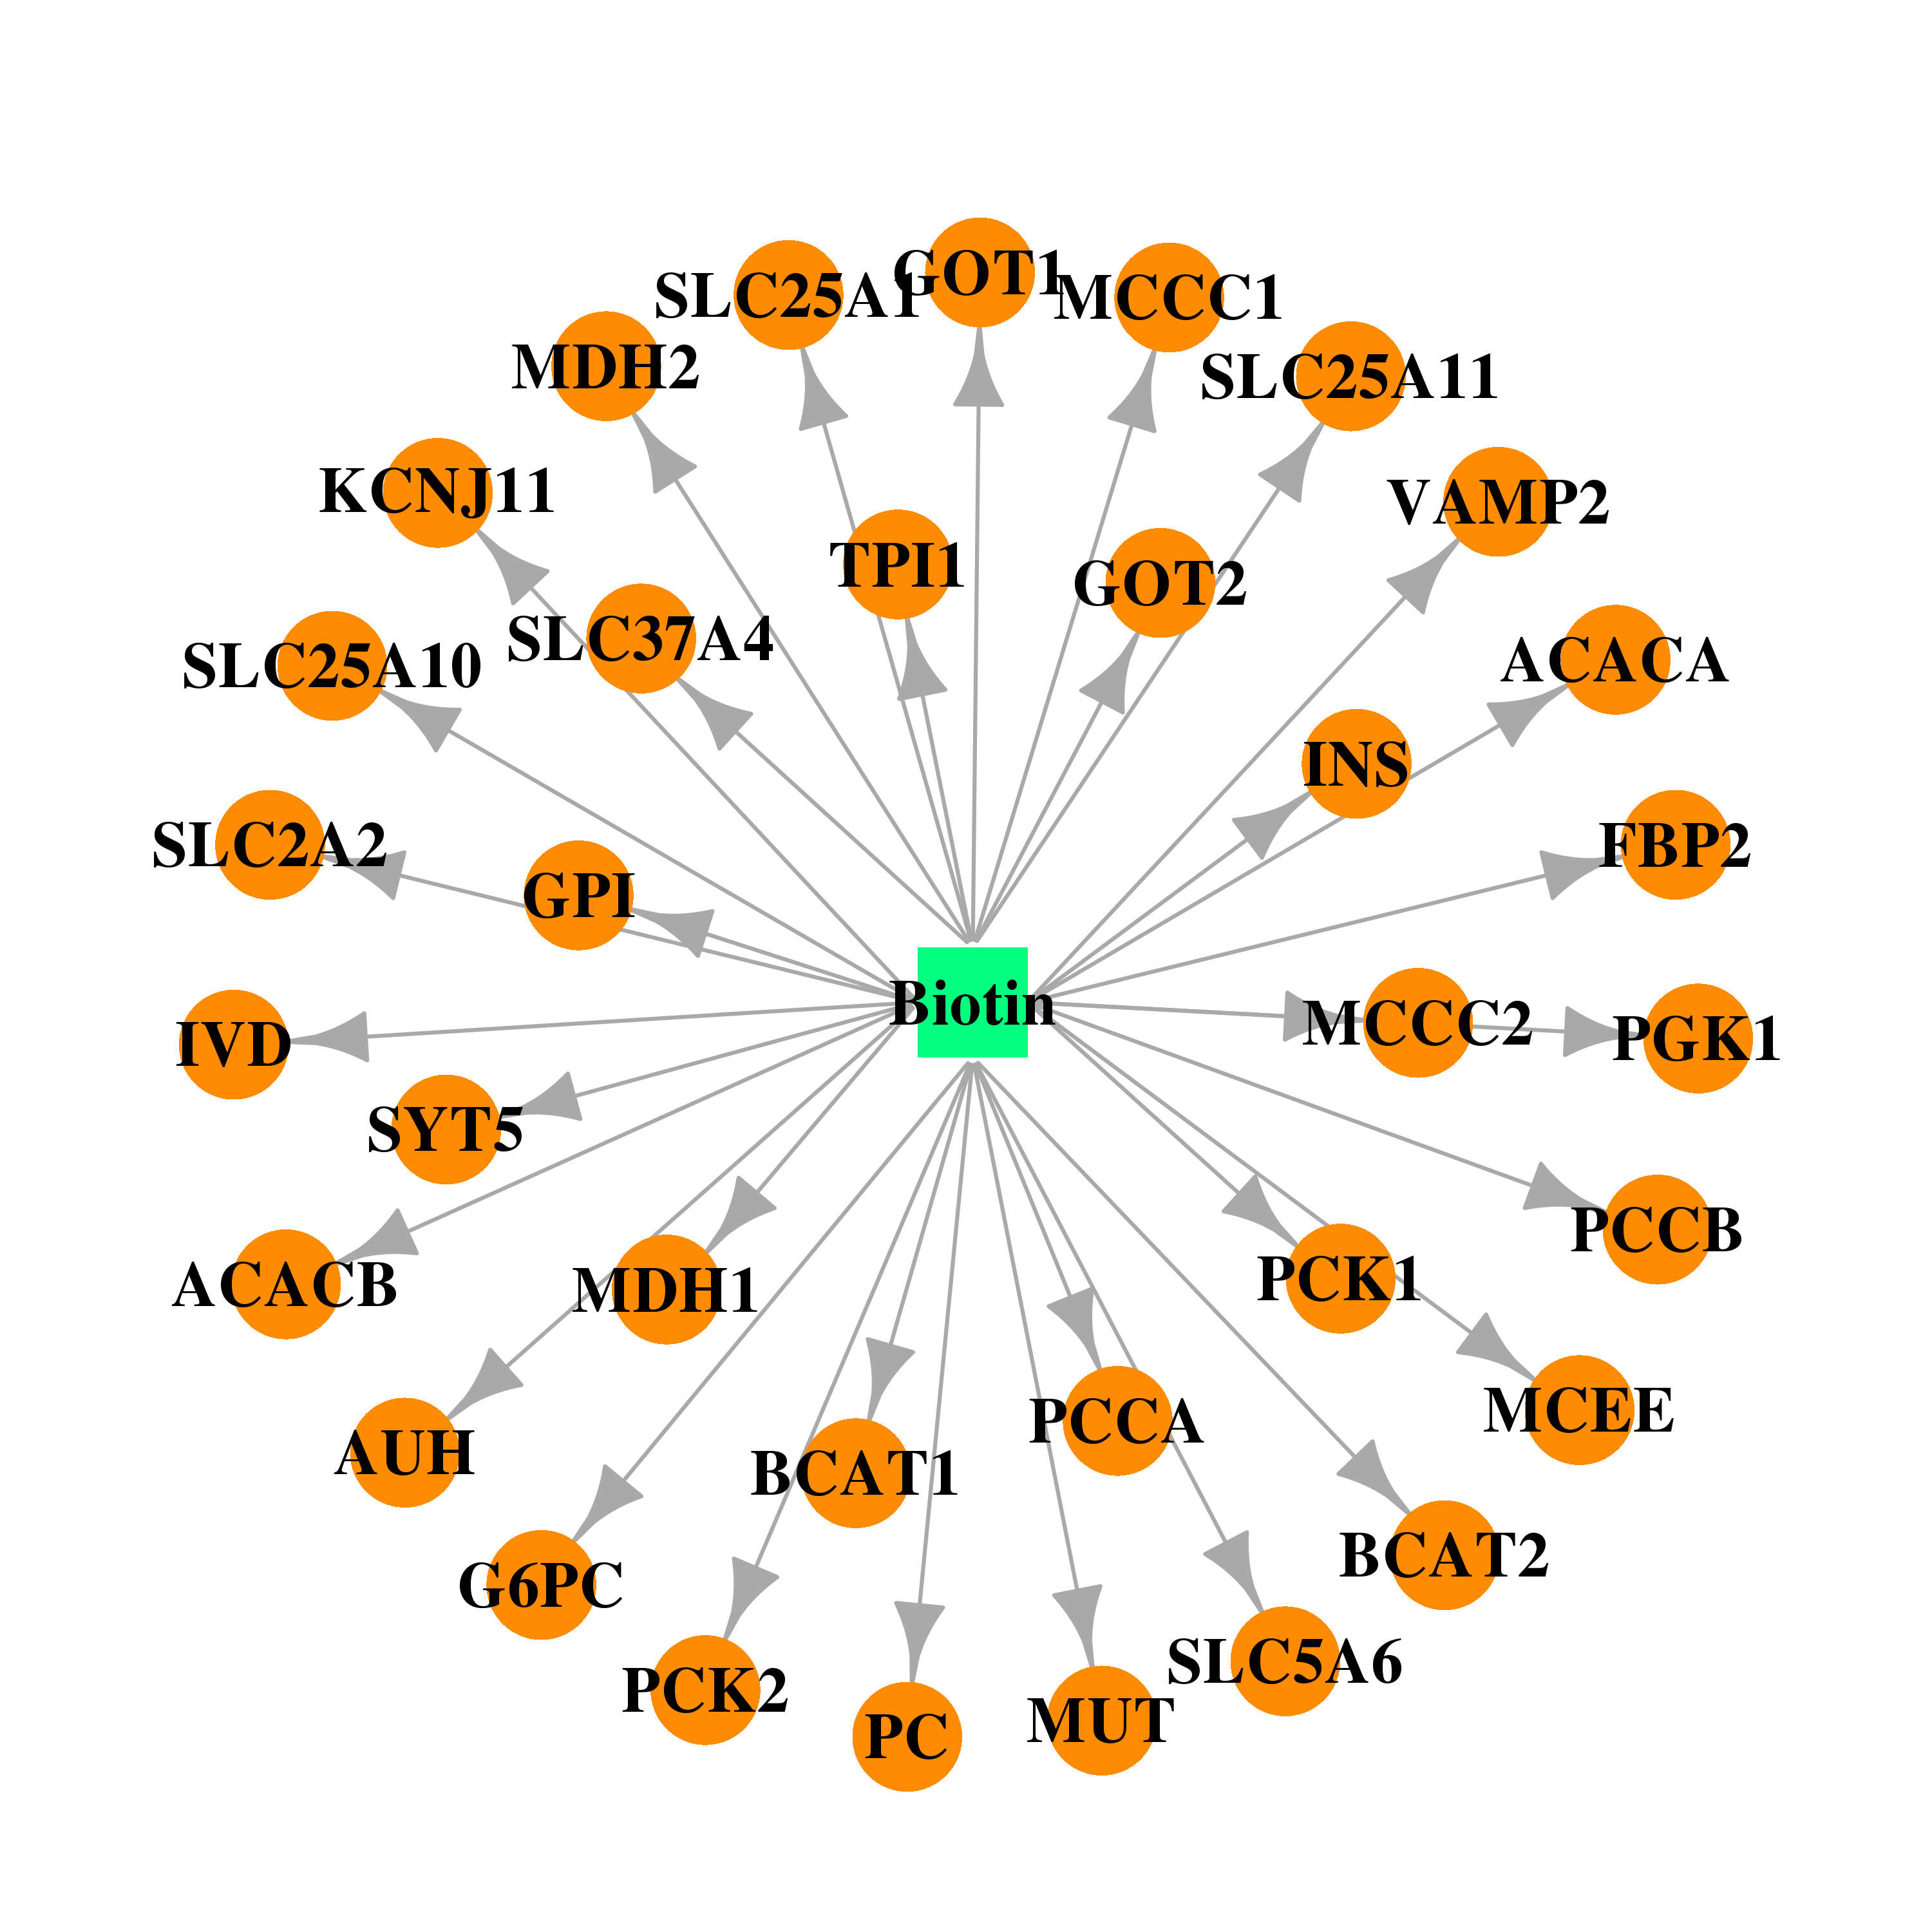 | 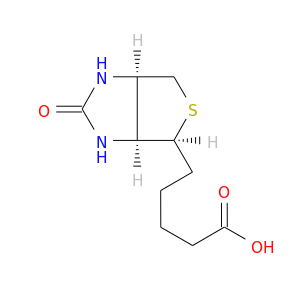 |
| DB00877 | insulin | approved; investigational | Sirolimus | 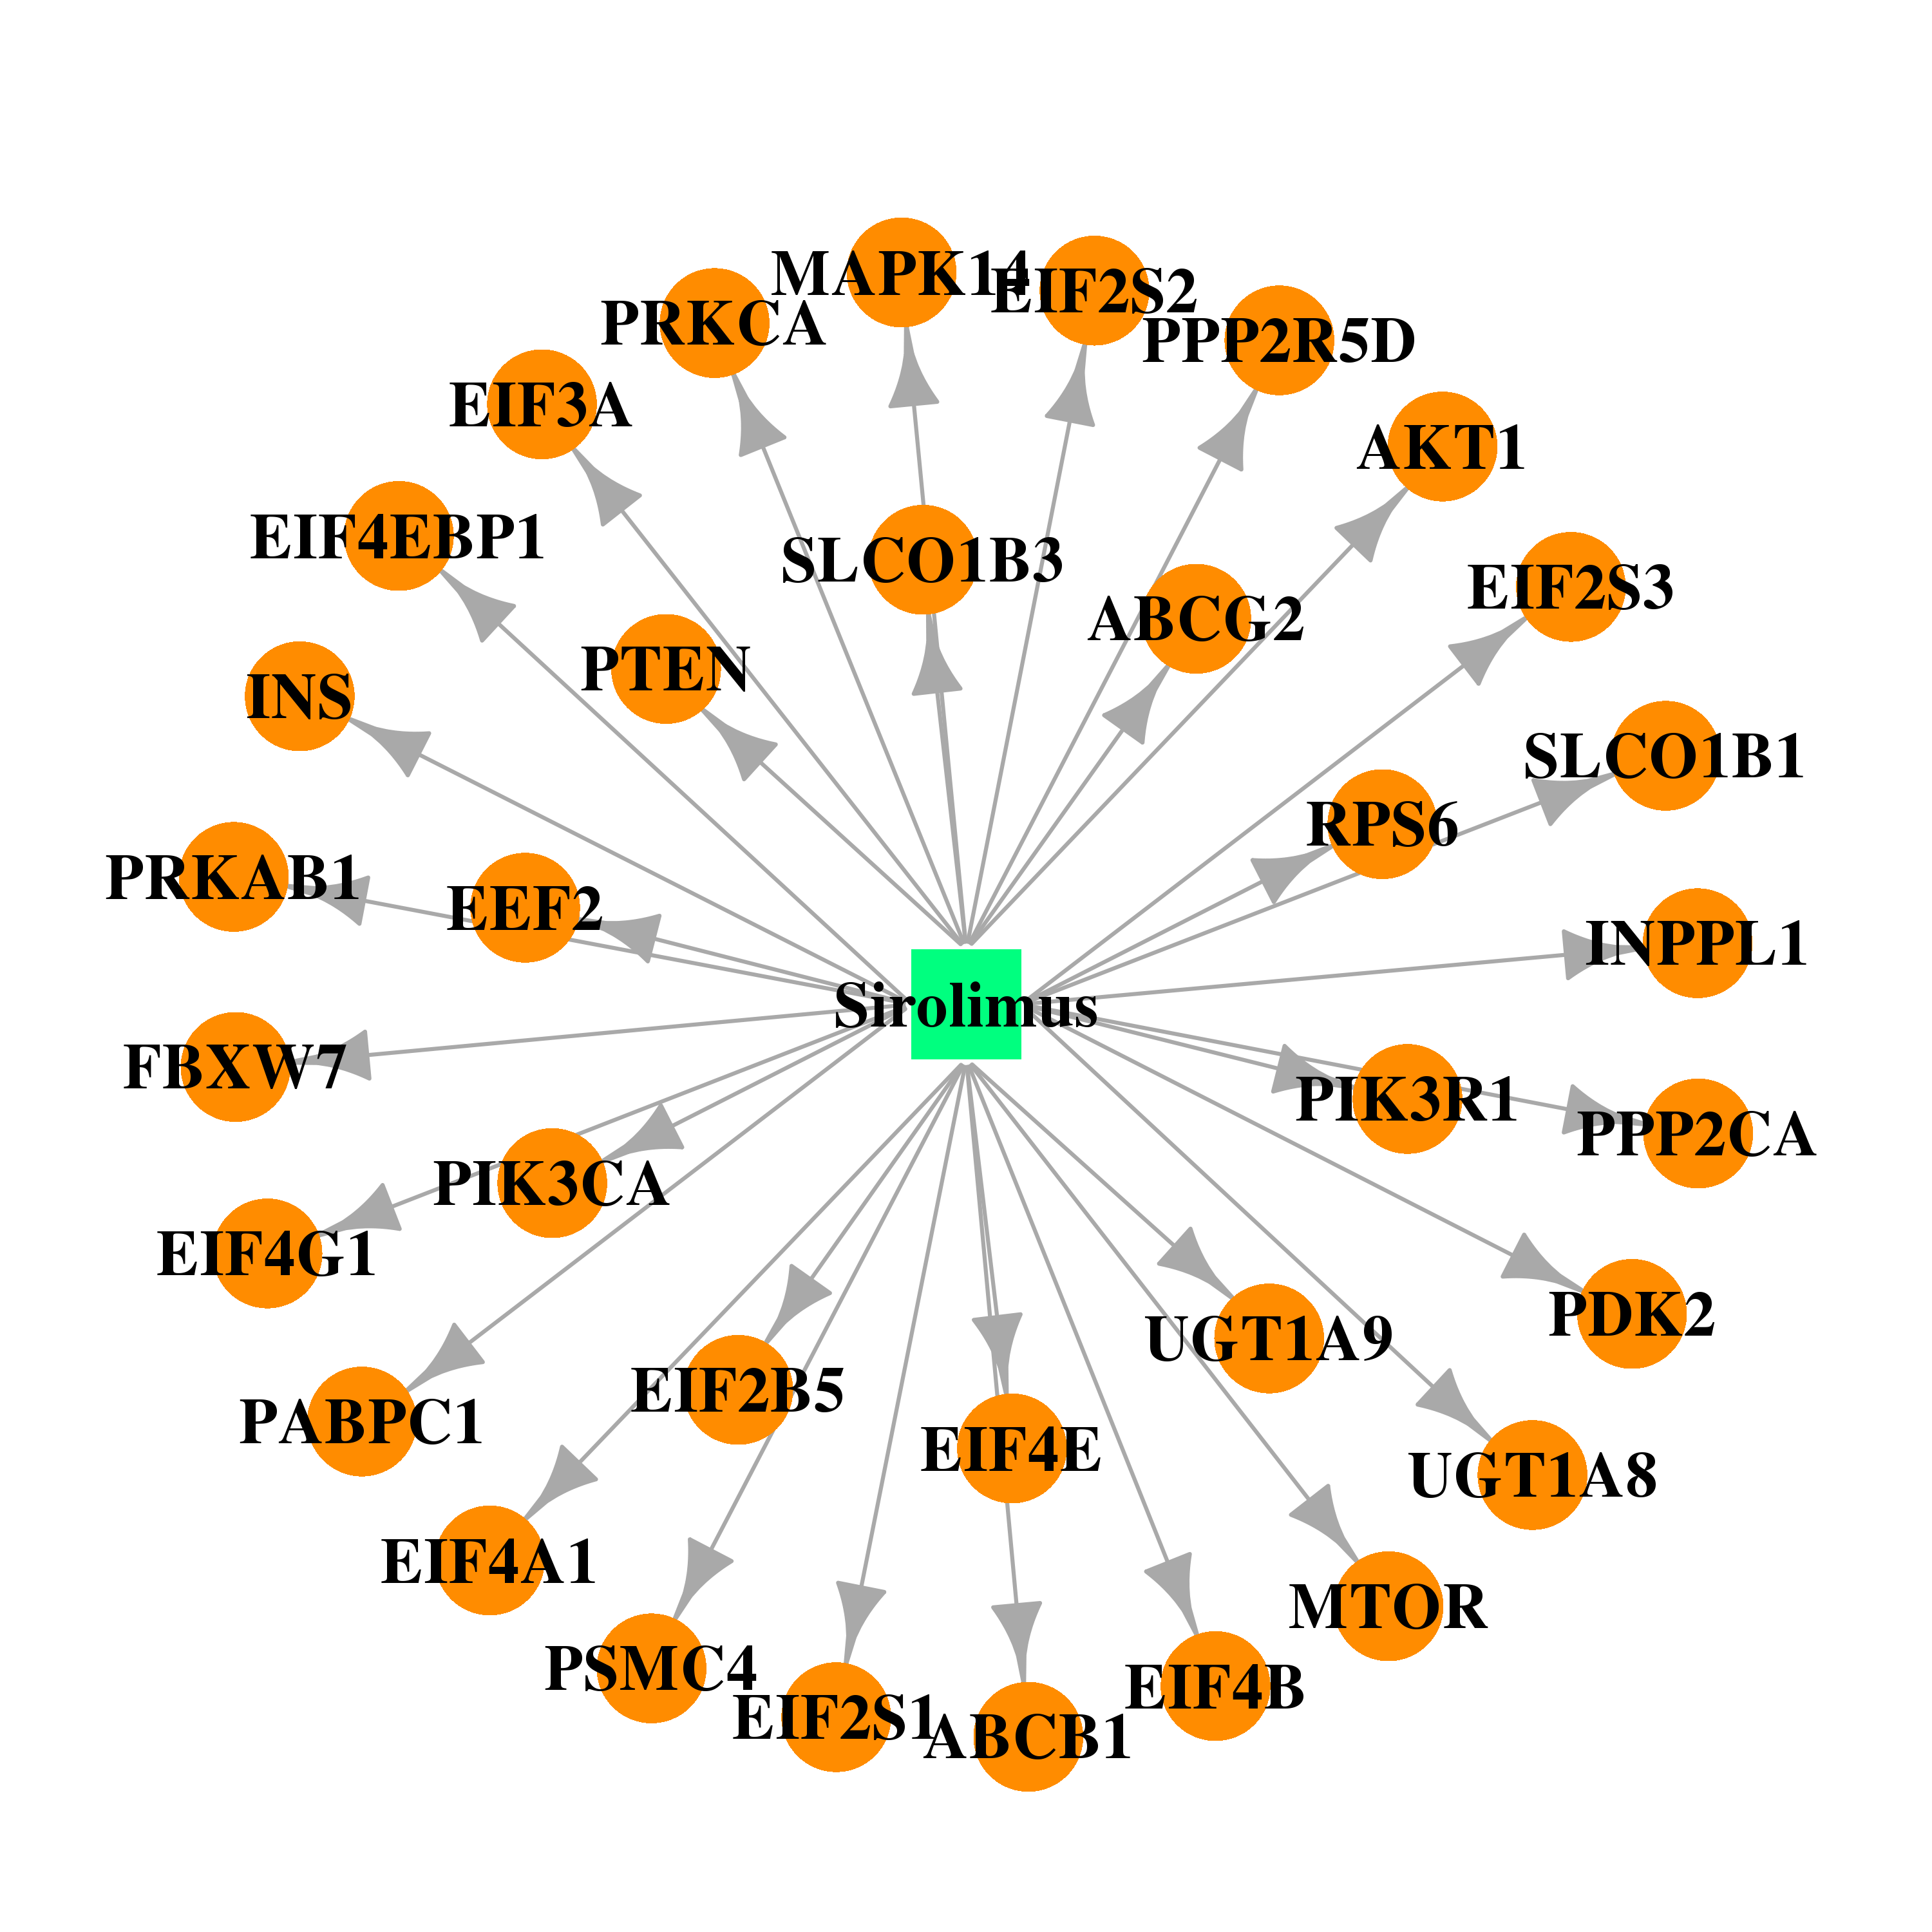 | 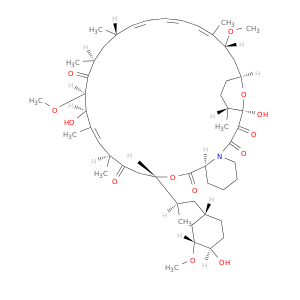 |
| DB00122 | insulin | approved; nutraceutical | Choline | 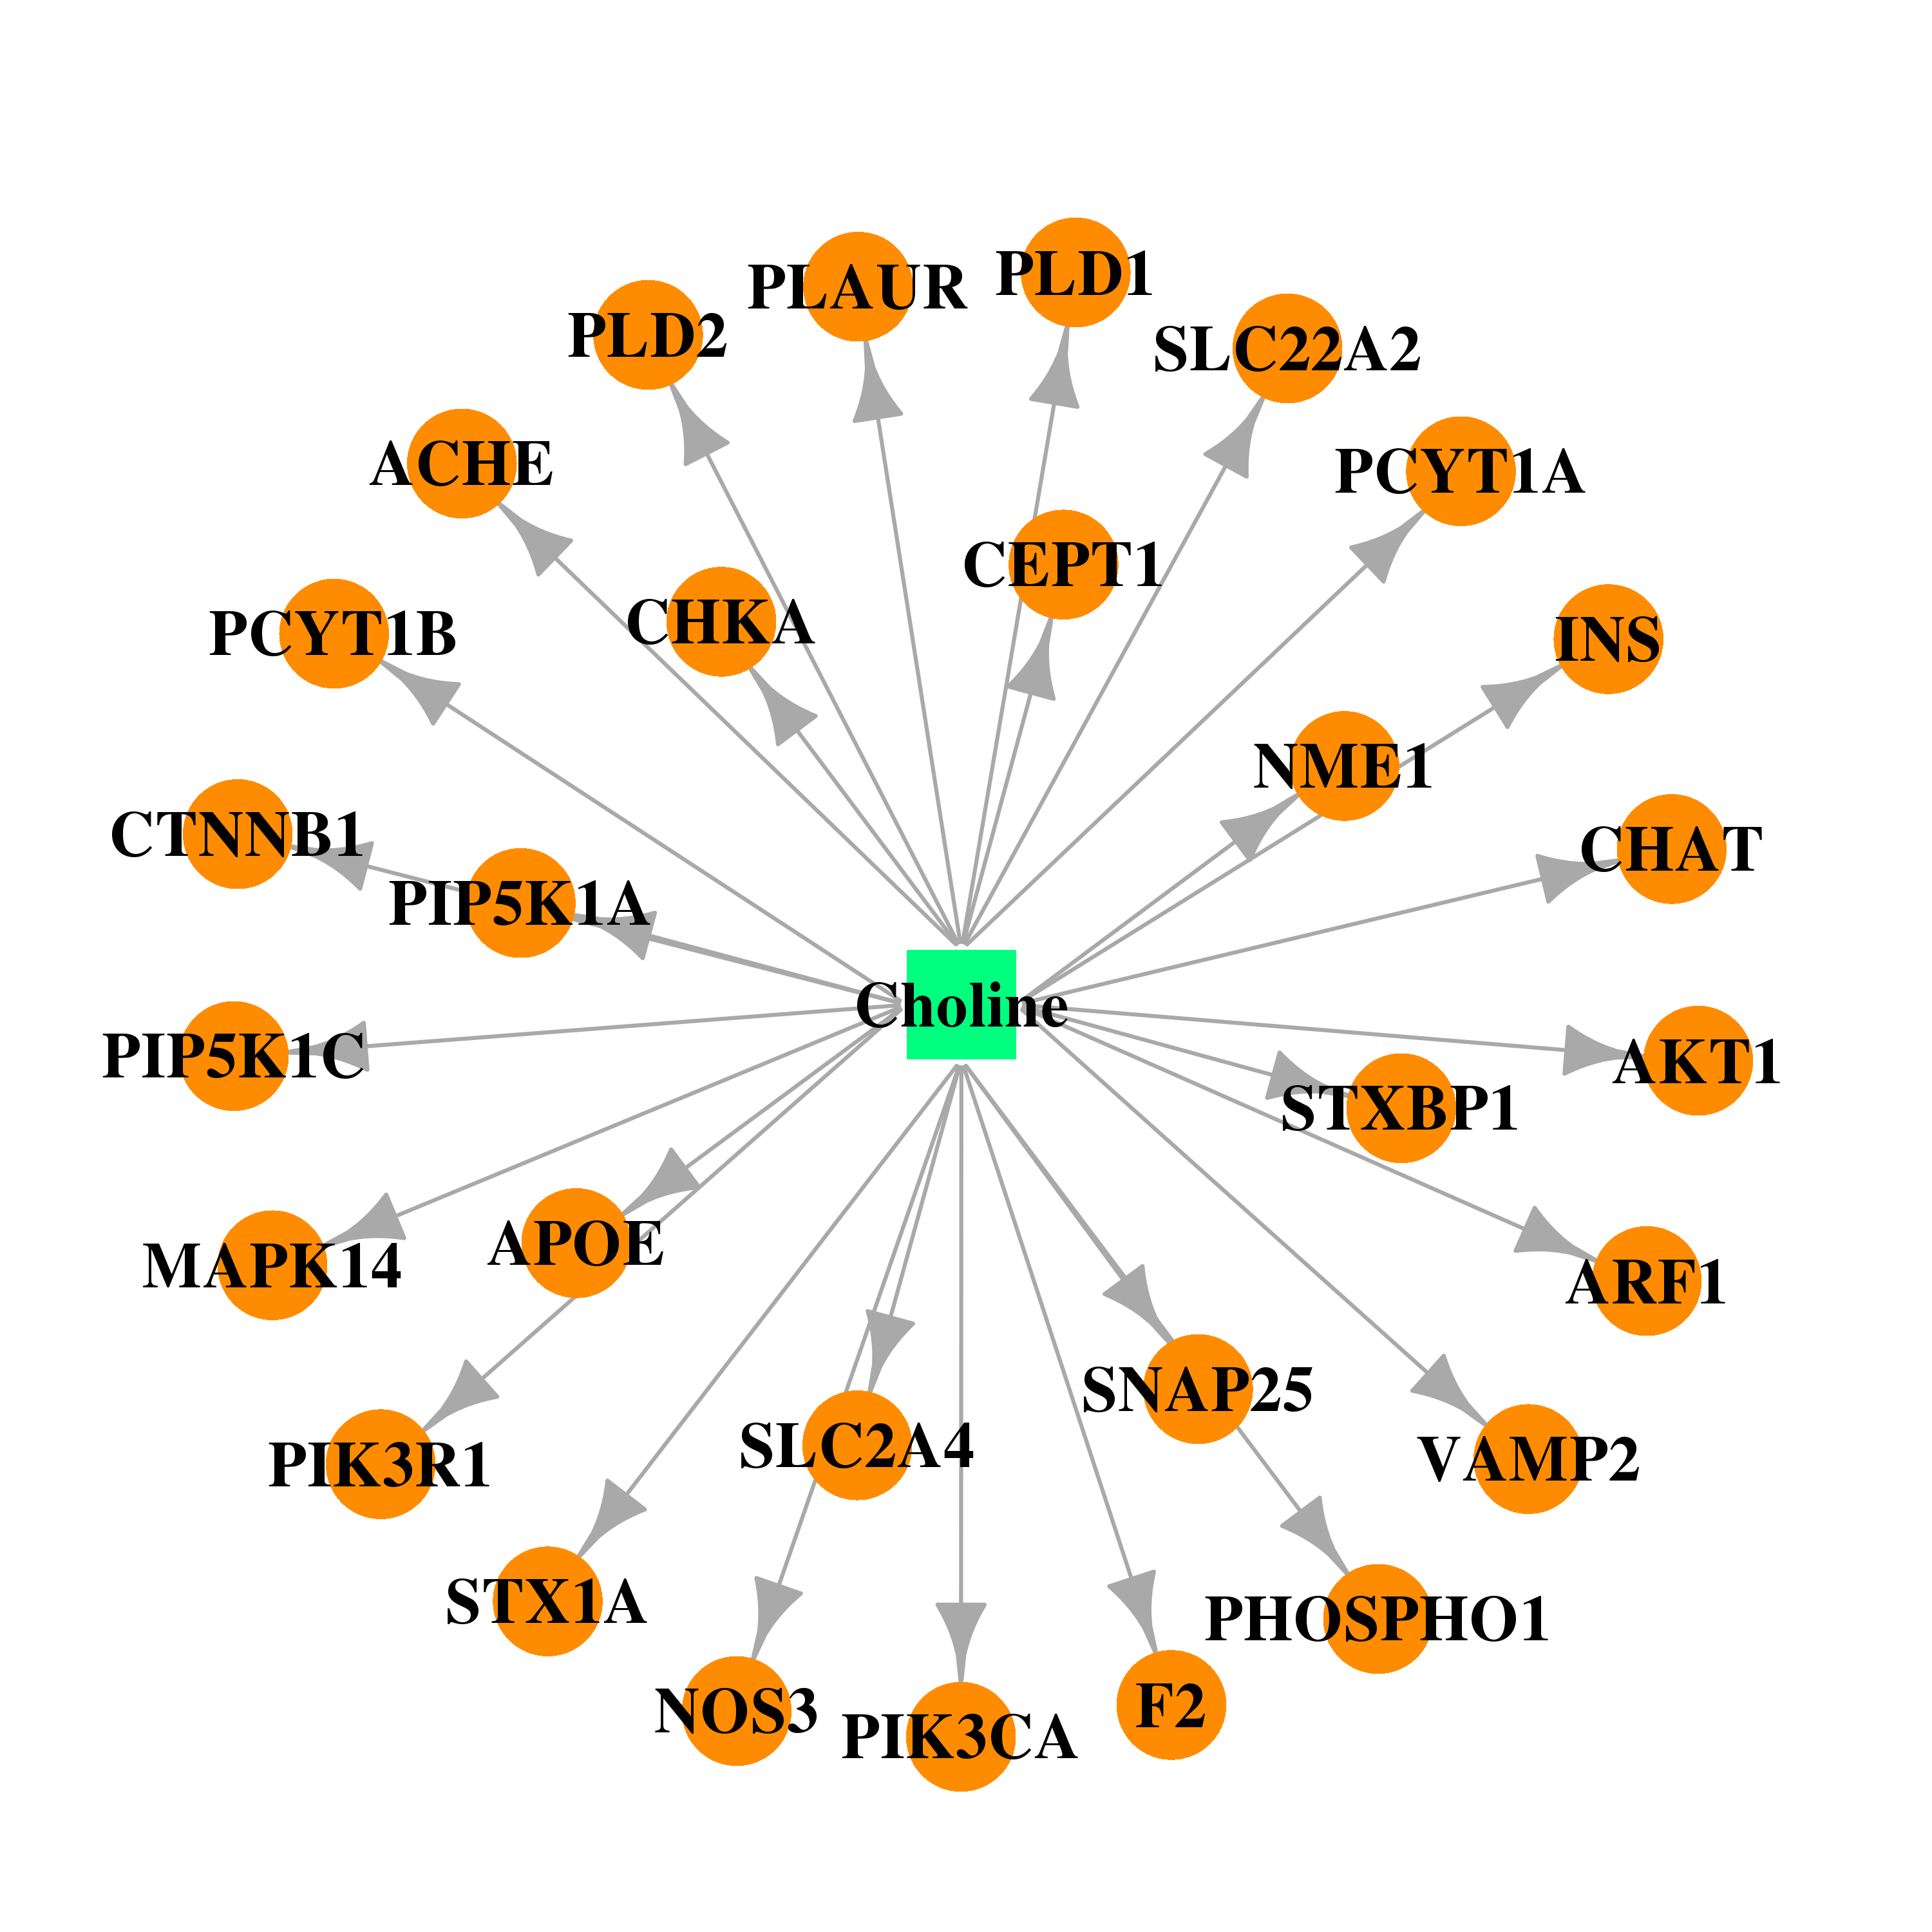 | 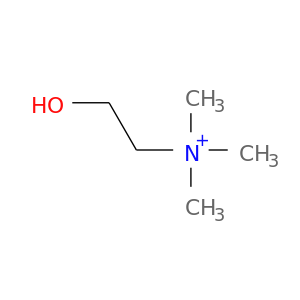 |
| Top |
| Cross referenced IDs for INS |
| * We obtained these cross-references from Uniprot database. It covers 150 different DBs, 18 categories. http://www.uniprot.org/help/cross_references_section |
: Open all cross reference information
|
Copyright © 2016-Present - The Univsersity of Texas Health Science Center at Houston @ |