|
||||||||||||||||||||||||||||||||||||||||||||||||||||||||||||||||||||||||||||||||||||||||||||||||||||||||||||||||||||||||||||||||||||||||||||||||||||||||||||||||||||||||||||||||||||||||||||||||||||||||||||||||||||||||||||||||||||||||||||||||||||||||||||||||||||||||||||||||||||||||||||||||||||||||||||||||||||||||||
| |
| Phenotypic Information (metabolism pathway, cancer, disease, phenome) |
| |
| |
| Gene-Gene Network Information: Co-Expression Network, Interacting Genes & KEGG |
| |
|


| Gene Summary for TNPO1 |
| Top |
| Phenotypic Information for TNPO1(metabolism pathway, cancer, disease, phenome) |
| Cancer | CGAP: TNPO1 |
| Familial Cancer Database: TNPO1 | |
| * This gene is included in those cancer gene databases. |
|
|
|
|
|
| . | ||||||||||||||||||||||||||||||||||||||||||||||||||||||||||||||||||||||||||||||||||||||||||||||||||||||||||||||||||||||||||||||||||||||||||||||||||||||||||||||||||||||||||||||||||||||||||||||||||||||||||||||||||||||||||||||||||||||||||||||||||||||||||||||||||||||||||||||||||||||||||||||||||||||||||||||||||||
Oncogene 1 | Significant driver gene in | |||||||||||||||||||||||||||||||||||||||||||||||||||||||||||||||||||||||||||||||||||||||||||||||||||||||||||||||||||||||||||||||||||||||||||||||||||||||||||||||||||||||||||||||||||||||||||||||||||||||||||||||||||||||||||||||||||||||||||||||||||||||||||||||||||||||||||||||||||||||||||||||||||||||||||||||||||||||||
| cf) number; DB name 1 Oncogene; http://nar.oxfordjournals.org/content/35/suppl_1/D721.long, 2 Tumor Suppressor gene; https://bioinfo.uth.edu/TSGene/, 3 Cancer Gene Census; http://www.nature.com/nrc/journal/v4/n3/abs/nrc1299.html, 4 CancerGenes; http://nar.oxfordjournals.org/content/35/suppl_1/D721.long, 5 Network of Cancer Gene; http://ncg.kcl.ac.uk/index.php, 1Therapeutic Vulnerabilities in Cancer; http://cbio.mskcc.org/cancergenomics/statius/ |
| REACTOME_METABOLISM_OF_MRNA REACTOME_METABOLISM_OF_RNA | |
| OMIM | 602901; gene. |
| Orphanet | |
| Disease | KEGG Disease: TNPO1 |
| MedGen: TNPO1 (Human Medical Genetics with Condition) | |
| ClinVar: TNPO1 | |
| Phenotype | MGI: TNPO1 (International Mouse Phenotyping Consortium) |
| PhenomicDB: TNPO1 | |
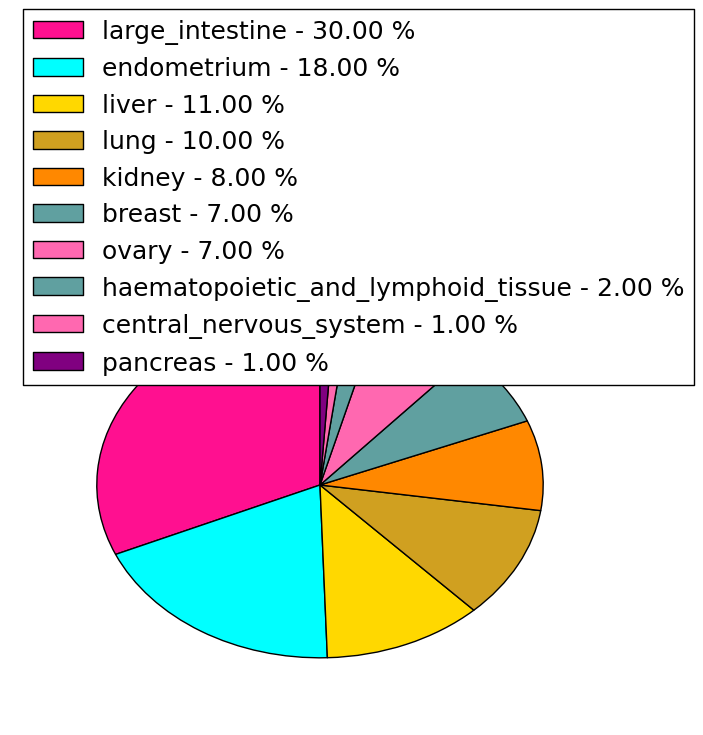
| Mutations for TNPO1 |
| * Under tables are showing count per each tissue to give us broad intuition about tissue specific mutation patterns.You can go to the detailed page for each mutation database's web site. |
| - Statistics for Tissue and Mutation type | Top |
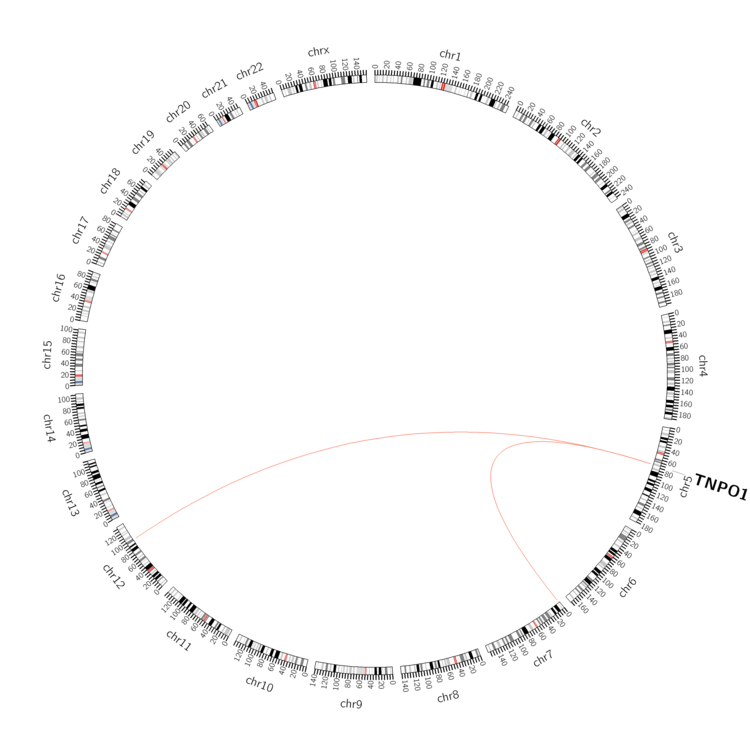 |
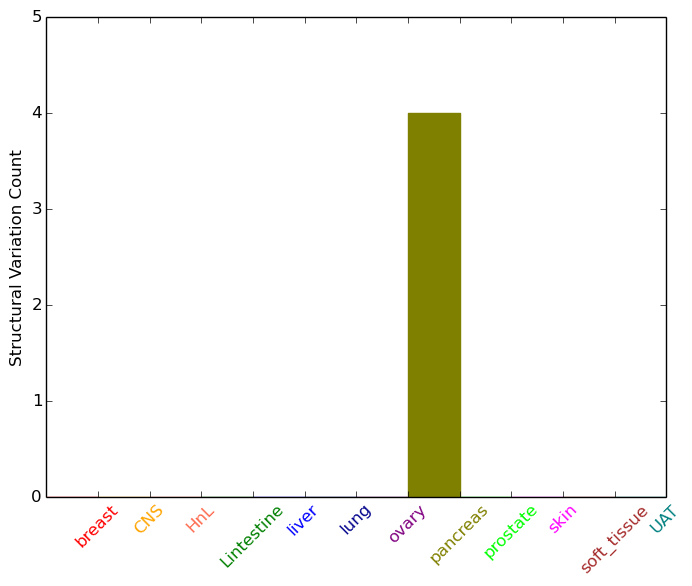
| - For Inter-chromosomal Variations |
| * Inter-chromosomal variantions includes 'interchromosomal amplicon to amplicon', 'interchromosomal amplicon to non-amplified dna', 'interchromosomal insertion', 'Interchromosomal unknown type'. |
 |
| - For Intra-chromosomal Variations |
| There's no intra-chromosomal structural variation. |
| Sample | Symbol_a | Chr_a | Start_a | End_a | Symbol_b | Chr_b | Start_b | End_b |
| pancreas | TNPO1 | chr5 | 72124405 | 72124425 | chr12 | 98693256 | 98693276 | |
| pancreas | TNPO1 | chr5 | 72169894 | 72169914 | chr7 | 1204472 | 1204492 |
| cf) Tissue number; Tissue name (1;Breast, 2;Central_nervous_system, 3;Haematopoietic_and_lymphoid_tissue, 4;Large_intestine, 5;Liver, 6;Lung, 7;Ovary, 8;Pancreas, 9;Prostate, 10;Skin, 11;Soft_tissue, 12;Upper_aerodigestive_tract) |
| * From mRNA Sanger sequences, Chitars2.0 arranged chimeric transcripts. This table shows TNPO1 related fusion information. |
| ID | Head Gene | Tail Gene | Accession | Gene_a | qStart_a | qEnd_a | Chromosome_a | tStart_a | tEnd_a | Gene_a | qStart_a | qEnd_a | Chromosome_a | tStart_a | tEnd_a |
| BQ338374 | TNPO1 | 2 | 186 | 5 | 72185092 | 72185276 | ZFP106 | 182 | 259 | 15 | 42707674 | 42707751 | |
| BQ338570 | TNPO1 | 2 | 158 | 5 | 72185092 | 72185255 | ZFP106 | 154 | 240 | 15 | 42707674 | 42707760 | |
| HM245392 | TNPO1 | 1 | 108 | 5 | 72144294 | 72147146 | IKBKB | 107 | 248 | 8 | 42129599 | 42146168 | |
| BE701928 | ZFP106 | 15 | 101 | 15 | 42707674 | 42707760 | TNPO1 | 97 | 281 | 5 | 72185092 | 72185276 | |
| BQ338378 | ZFP106 | 15 | 101 | 15 | 42707674 | 42707760 | TNPO1 | 97 | 281 | 5 | 72185092 | 72185276 | |
| BQ338569 | ZFP106 | 14 | 100 | 15 | 42707674 | 42707760 | TNPO1 | 96 | 280 | 5 | 72185092 | 72185276 | |
| Top |
| Mutation type/ Tissue ID | brca | cns | cerv | endome | haematopo | kidn | Lintest | liver | lung | ns | ovary | pancre | prost | skin | stoma | thyro | urina | |||
| Total # sample | 1 | |||||||||||||||||||
| GAIN (# sample) | ||||||||||||||||||||
| LOSS (# sample) | 1 |
| cf) Tissue ID; Tissue type (1; Breast, 2; Central_nervous_system, 3; Cervix, 4; Endometrium, 5; Haematopoietic_and_lymphoid_tissue, 6; Kidney, 7; Large_intestine, 8; Liver, 9; Lung, 10; NS, 11; Ovary, 12; Pancreas, 13; Prostate, 14; Skin, 15; Stomach, 16; Thyroid, 17; Urinary_tract) |
| Top |
|
 |
| Top |
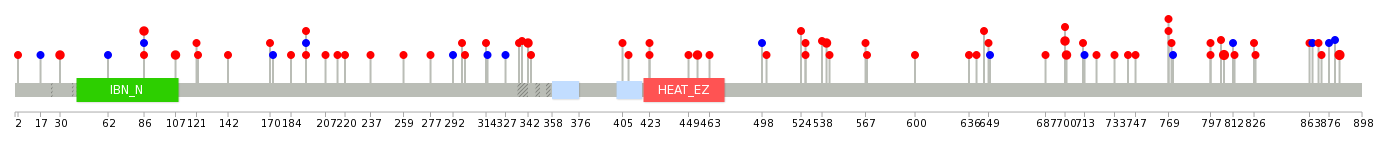
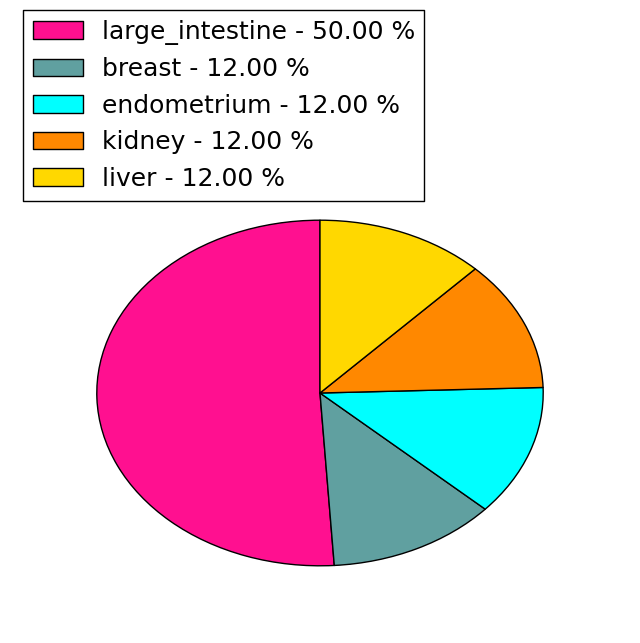
| Stat. for Non-Synonymous SNVs (# total SNVs=69) | (# total SNVs=9) |
 | 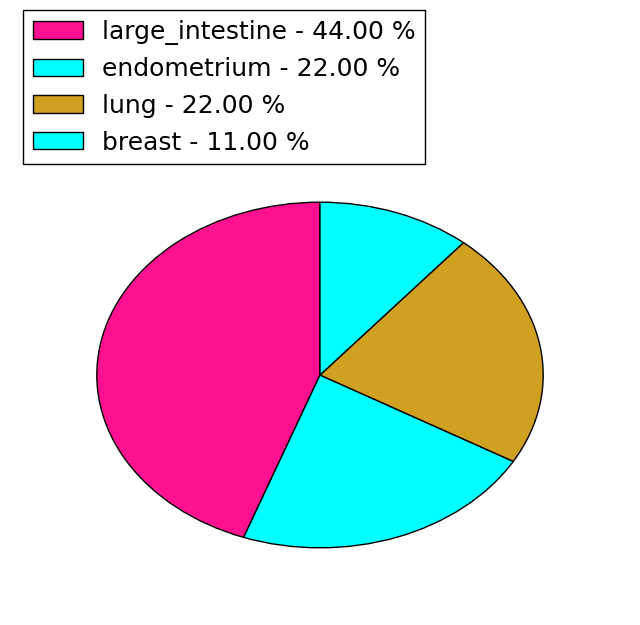 |
(# total SNVs=8) | (# total SNVs=0) |
 |
| Top |
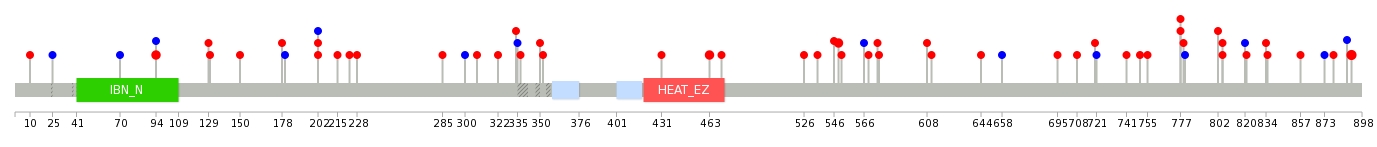
| * When you move the cursor on each content, you can see more deailed mutation information on the Tooltip. Those are primary_site,primary_histology,mutation(aa),pubmedID. |
| GRCh37 position | Mutation(aa) | Unique sampleID count |
| chr5:72199545-72199545 | p.C836fs*45 | 6 |
| chr5:72195908-72195908 | p.W797L | 3 |
| chr5:72196828-72196828 | p.D806E | 3 |
| chr5:72201211-72201211 | p.R883C | 3 |
| chr5:72151675-72151675 | p.G86S | 2 |
| chr5:72192969-72192969 | p.E769K | 2 |
| chr5:72178958-72178958 | p.S342L | 2 |
| chr5:72189511-72189511 | p.Q700H | 2 |
| chr5:72189065-72189065 | p.Q622* | 2 |
| chr5:72189512-72189512 | p.H701Y | 2 |
| Top |
|
 |
| Point Mutation/ Tissue ID | 1 | 2 | 3 | 4 | 5 | 6 | 7 | 8 | 9 | 10 | 11 | 12 | 13 | 14 | 15 | 16 | 17 | 18 | 19 | 20 |
| # sample | 3 | 3 | 19 | 1 | 2 | 2 | 4 | 2 | 2 | 1 | 3 | 8 | 11 | |||||||
| # mutation | 3 | 3 | 19 | 1 | 2 | 2 | 4 | 2 | 2 | 1 | 3 | 10 | 13 | |||||||
| nonsynonymous SNV | 3 | 2 | 15 | 1 | 2 | 2 | 3 | 2 | 2 | 2 | 6 | 11 | ||||||||
| synonymous SNV | 1 | 4 | 1 | 1 | 1 | 4 | 2 |
| cf) Tissue ID; Tissue type (1; BLCA[Bladder Urothelial Carcinoma], 2; BRCA[Breast invasive carcinoma], 3; CESC[Cervical squamous cell carcinoma and endocervical adenocarcinoma], 4; COAD[Colon adenocarcinoma], 5; GBM[Glioblastoma multiforme], 6; Glioma Low Grade, 7; HNSC[Head and Neck squamous cell carcinoma], 8; KICH[Kidney Chromophobe], 9; KIRC[Kidney renal clear cell carcinoma], 10; KIRP[Kidney renal papillary cell carcinoma], 11; LAML[Acute Myeloid Leukemia], 12; LUAD[Lung adenocarcinoma], 13; LUSC[Lung squamous cell carcinoma], 14; OV[Ovarian serous cystadenocarcinoma ], 15; PAAD[Pancreatic adenocarcinoma], 16; PRAD[Prostate adenocarcinoma], 17; SKCM[Skin Cutaneous Melanoma], 18:STAD[Stomach adenocarcinoma], 19:THCA[Thyroid carcinoma], 20:UCEC[Uterine Corpus Endometrial Carcinoma]) |
| Top |
| * We represented just top 10 SNVs. When you move the cursor on each content, you can see more deailed mutation information on the Tooltip. Those are primary_site, primary_histology, mutation(aa), pubmedID. |
| Genomic Position | Mutation(aa) | Unique sampleID count |
| chr5:72201211 | p.R891C,TNPO1 | 3 |
| chr5:72185728 | p.R463C,TNPO1 | 2 |
| chr5:72151675 | p.L549I,TNPO1 | 2 |
| chr5:72183988 | p.E777K,TNPO1 | 2 |
| chr5:72192969 | p.G94S,TNPO1 | 2 |
| chr5:72157667 | p.A202T,TNPO1 | 1 |
| chr5:72189009 | p.Q708R,TNPO1 | 1 |
| chr5:72173153 | p.L857P,TNPO1 | 1 |
| chr5:72192976 | p.A202V,TNPO1 | 1 |
| chr5:72185660 | p.S471G,TNPO1 | 1 |
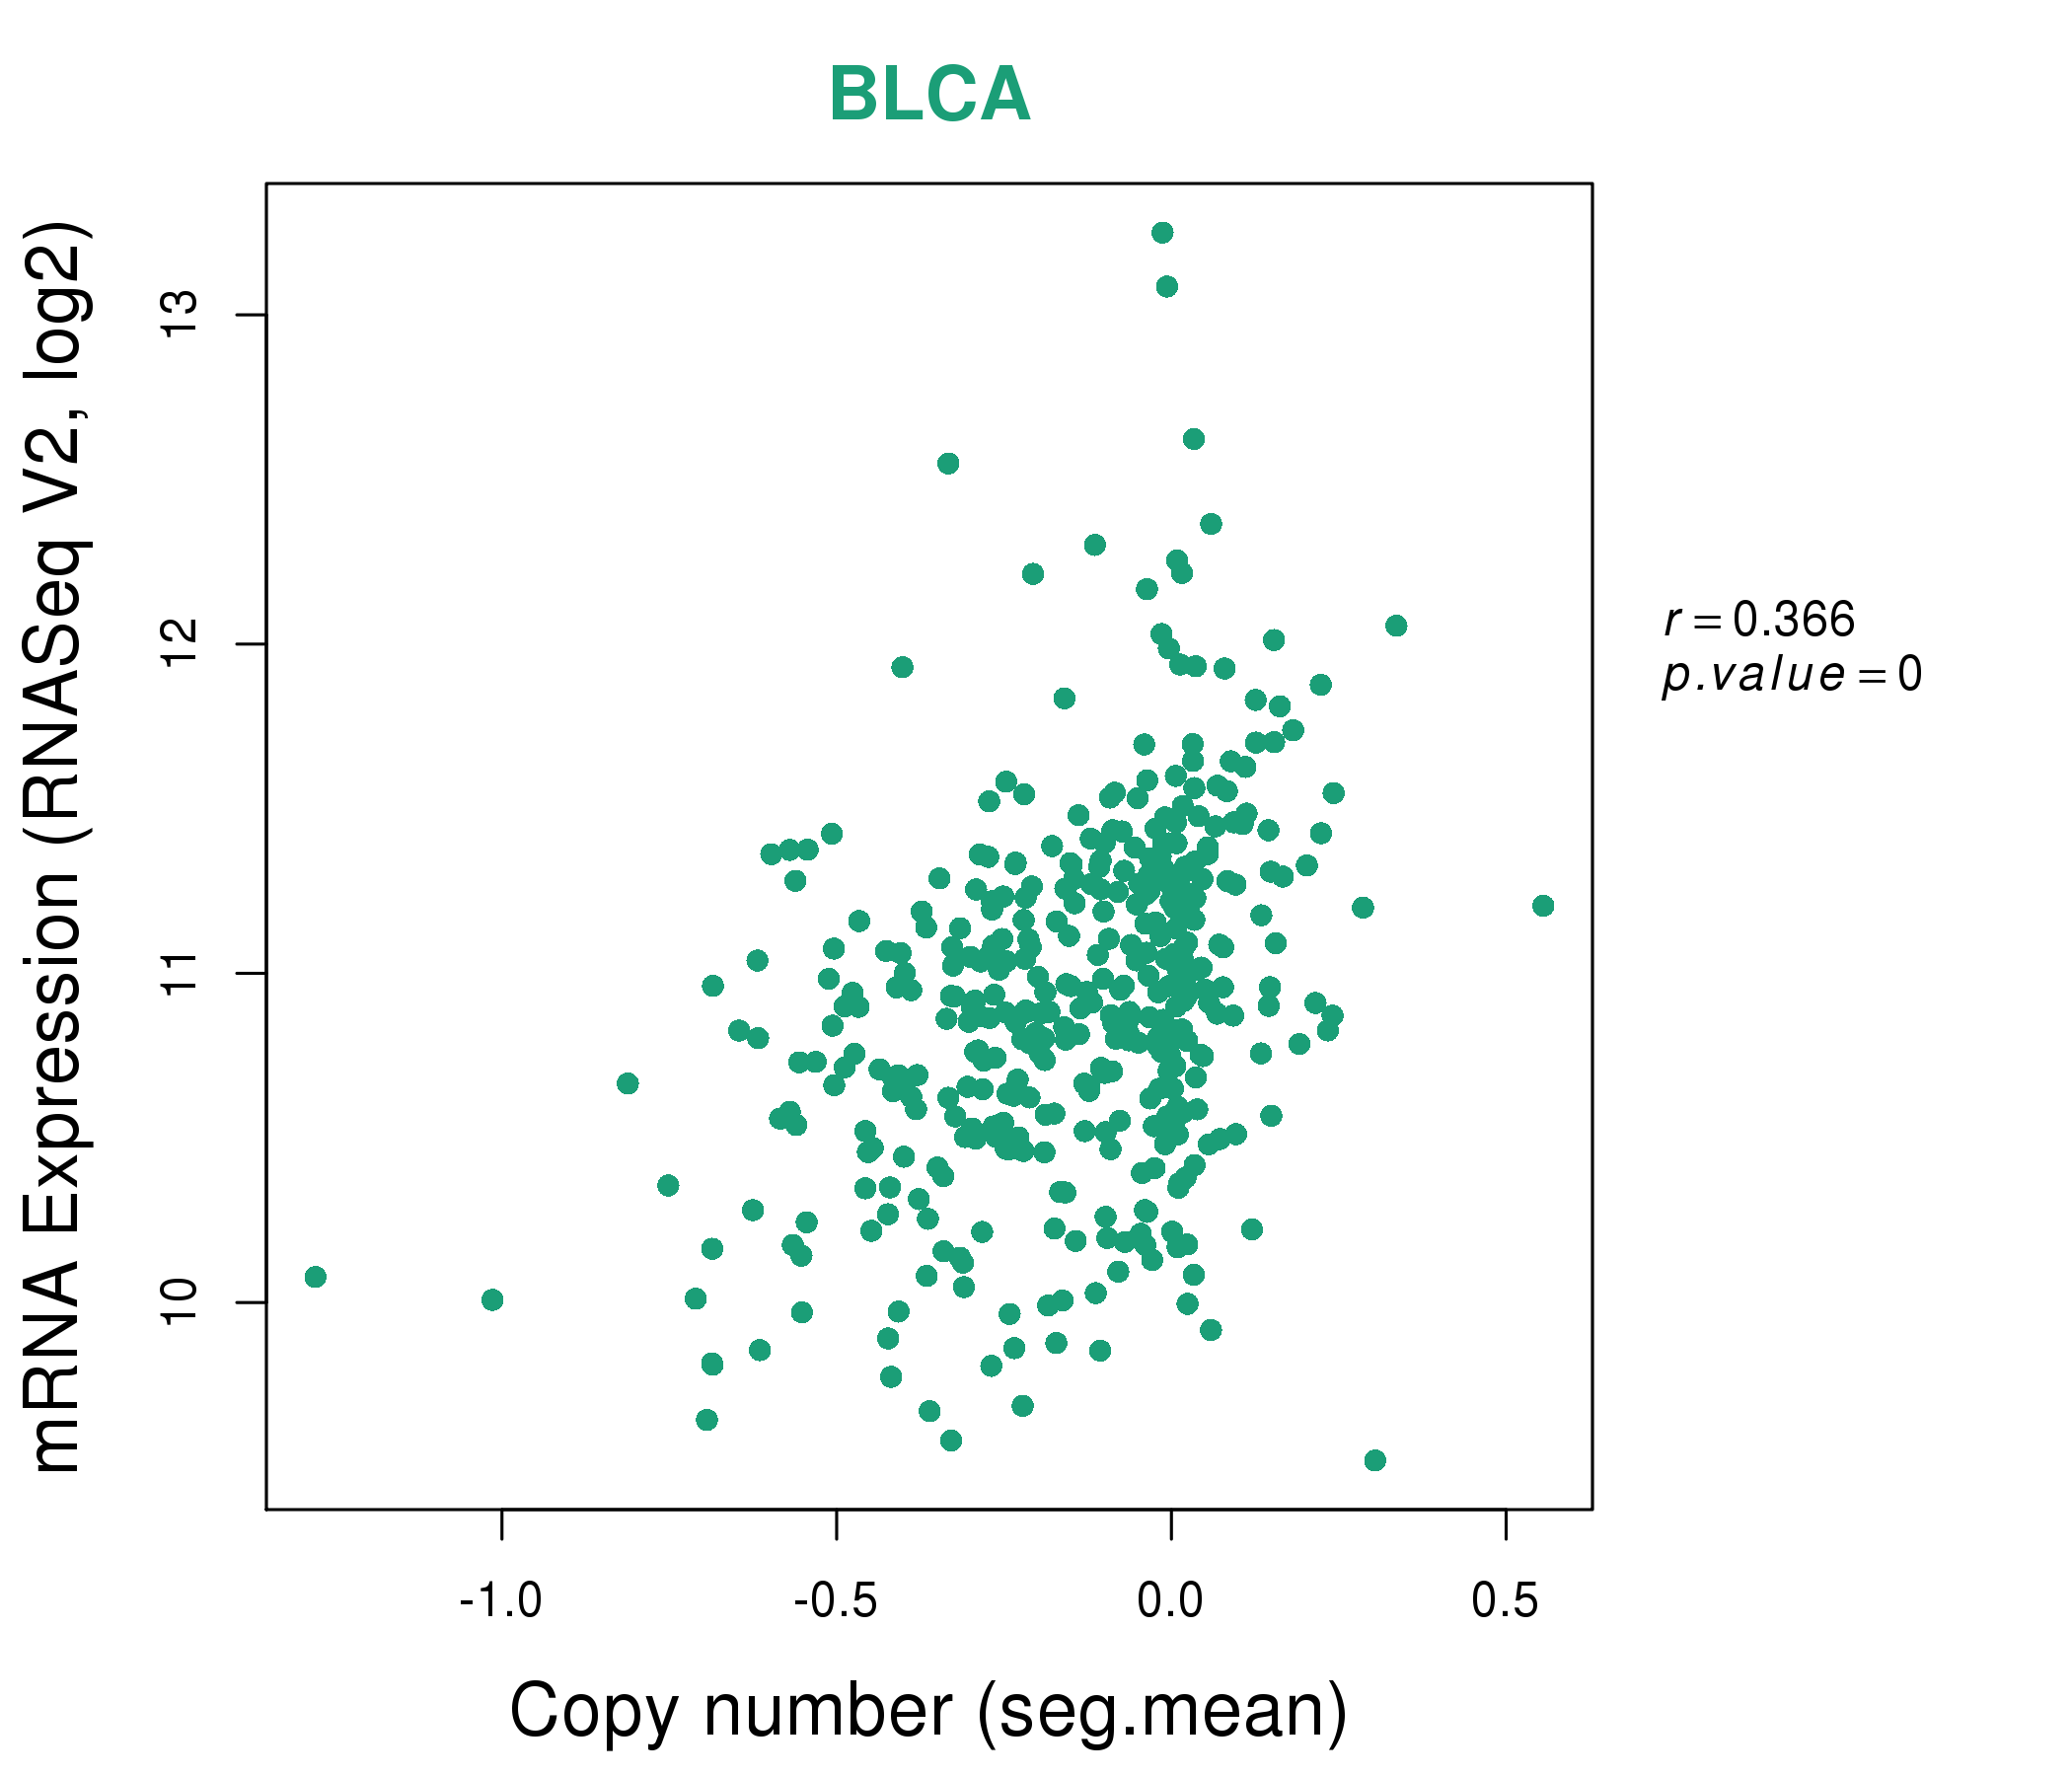
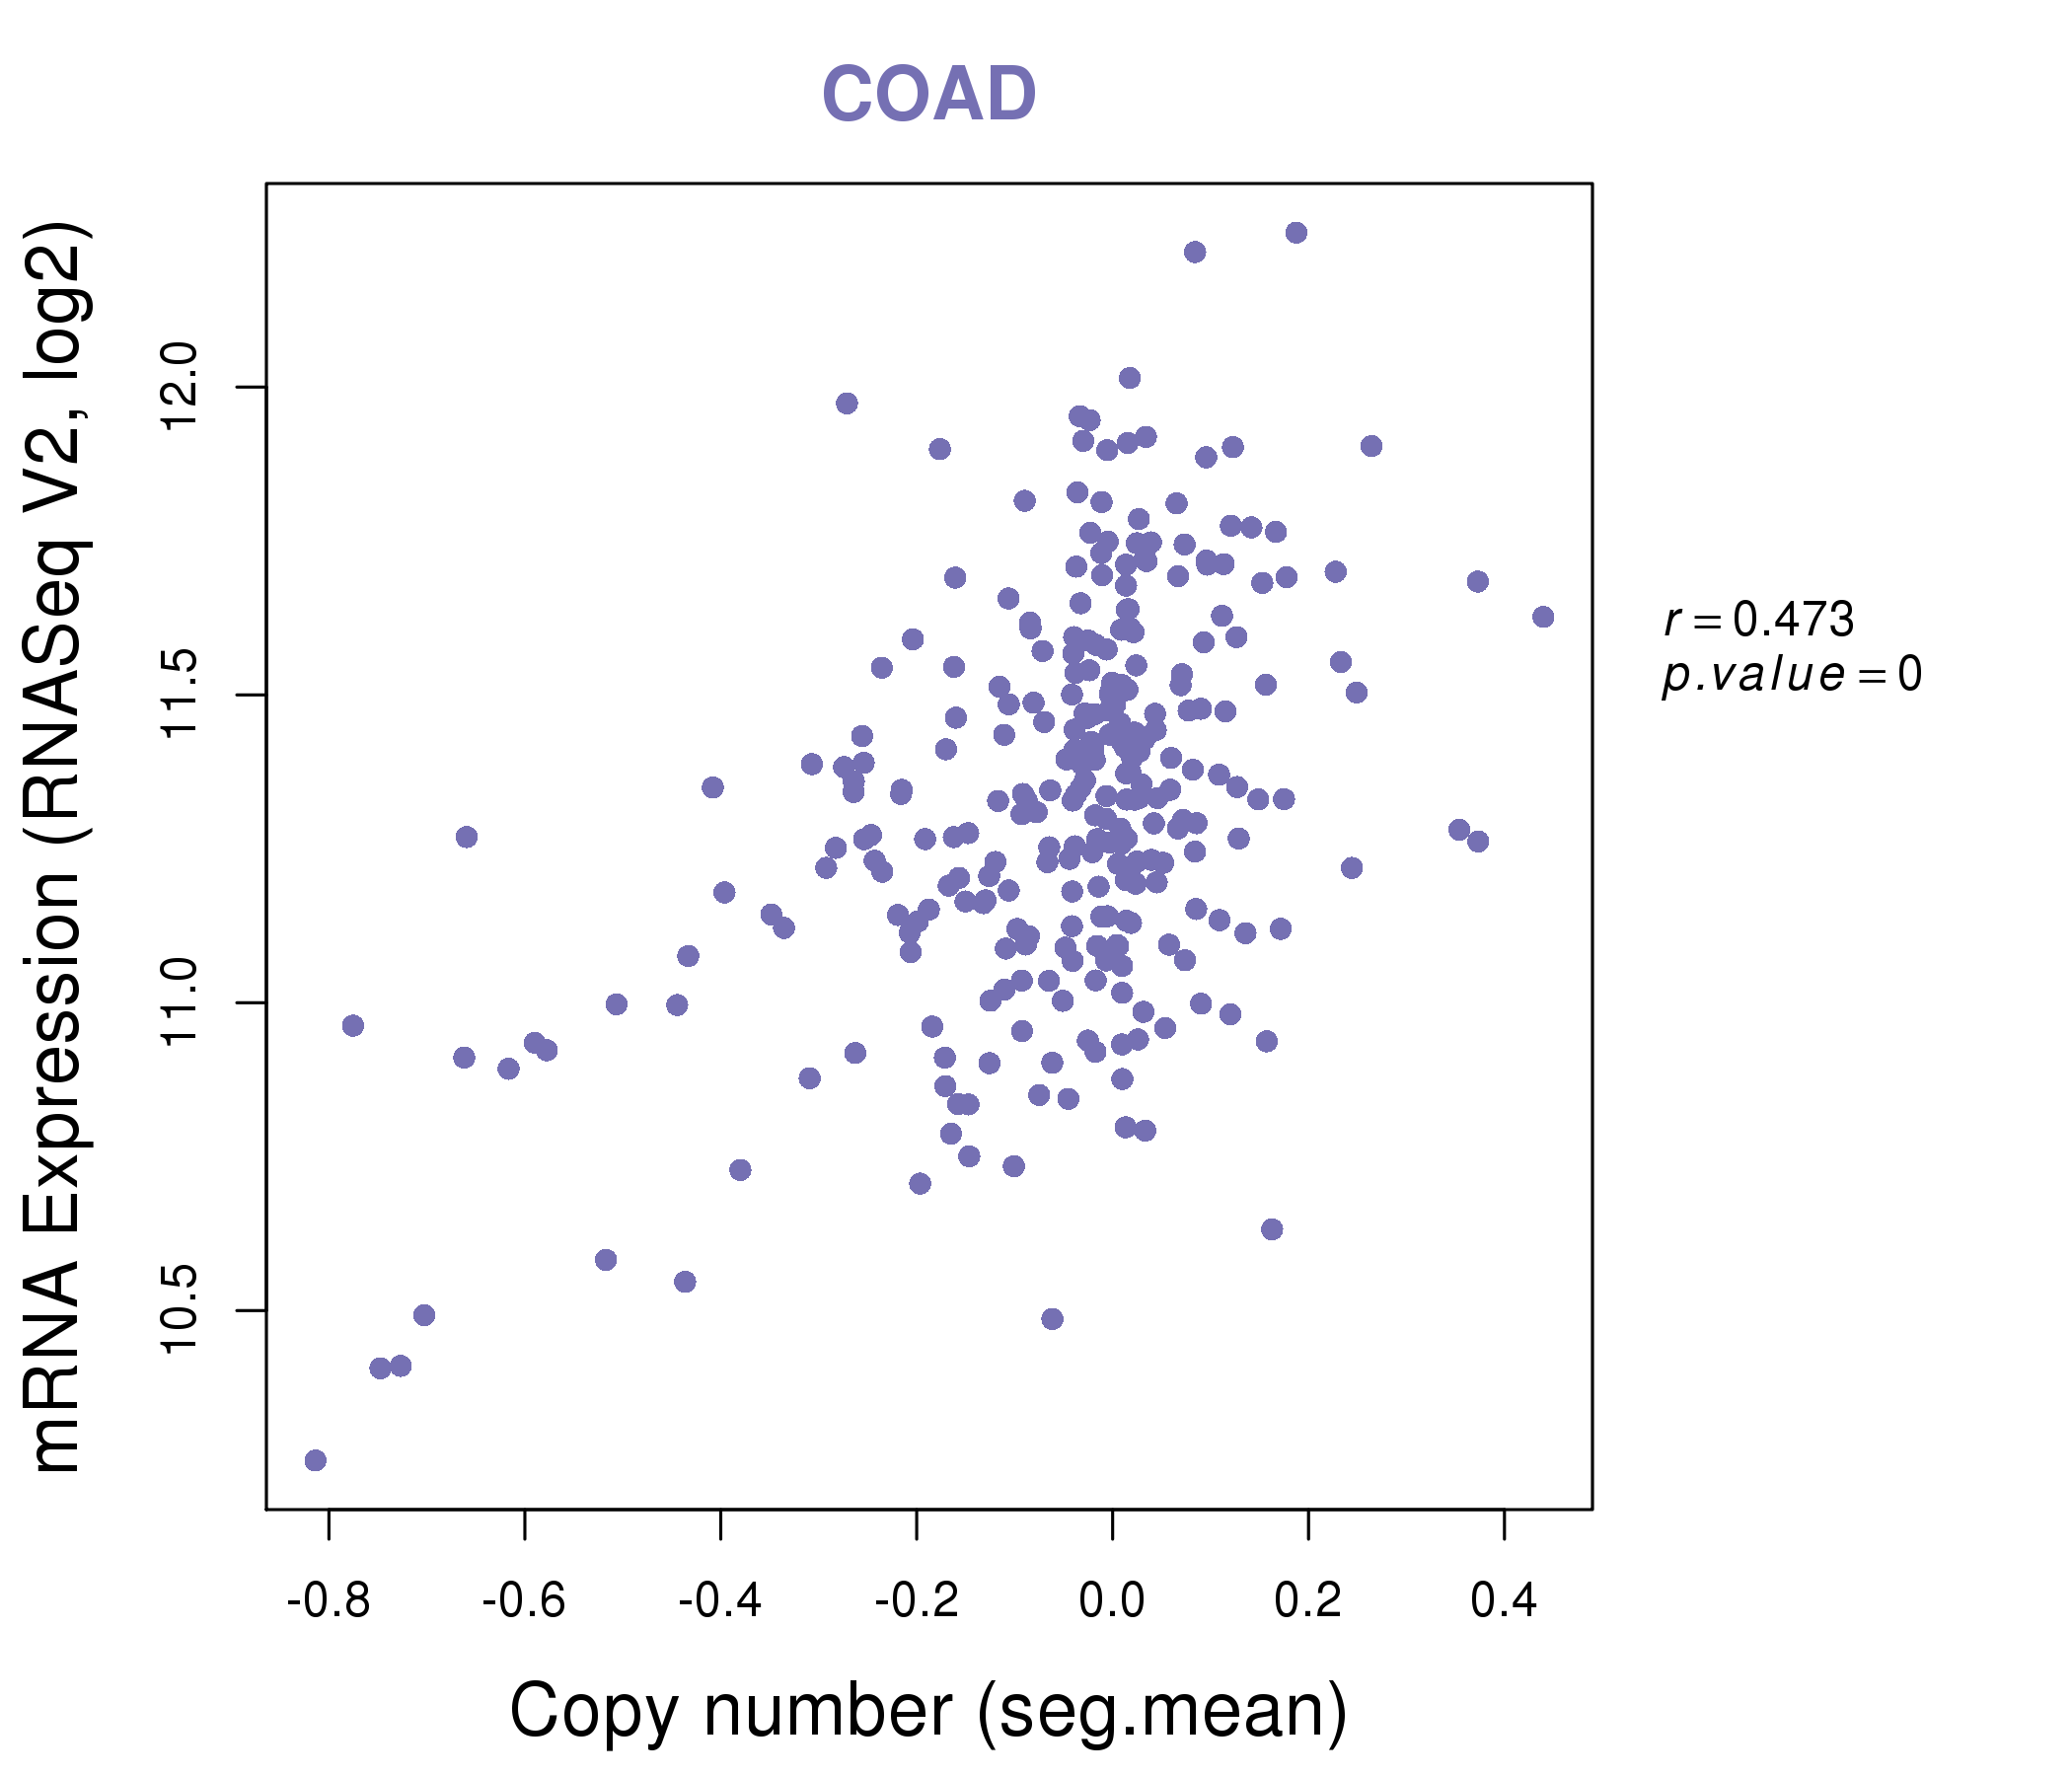
| * Copy number data were extracted from TCGA using R package TCGA-Assembler. The URLs of all public data files on TCGA DCC data server were gathered on Jan-05-2015. Function ProcessCNAData in TCGA-Assembler package was used to obtain gene-level copy number value which is calculated as the average copy number of the genomic region of a gene. |
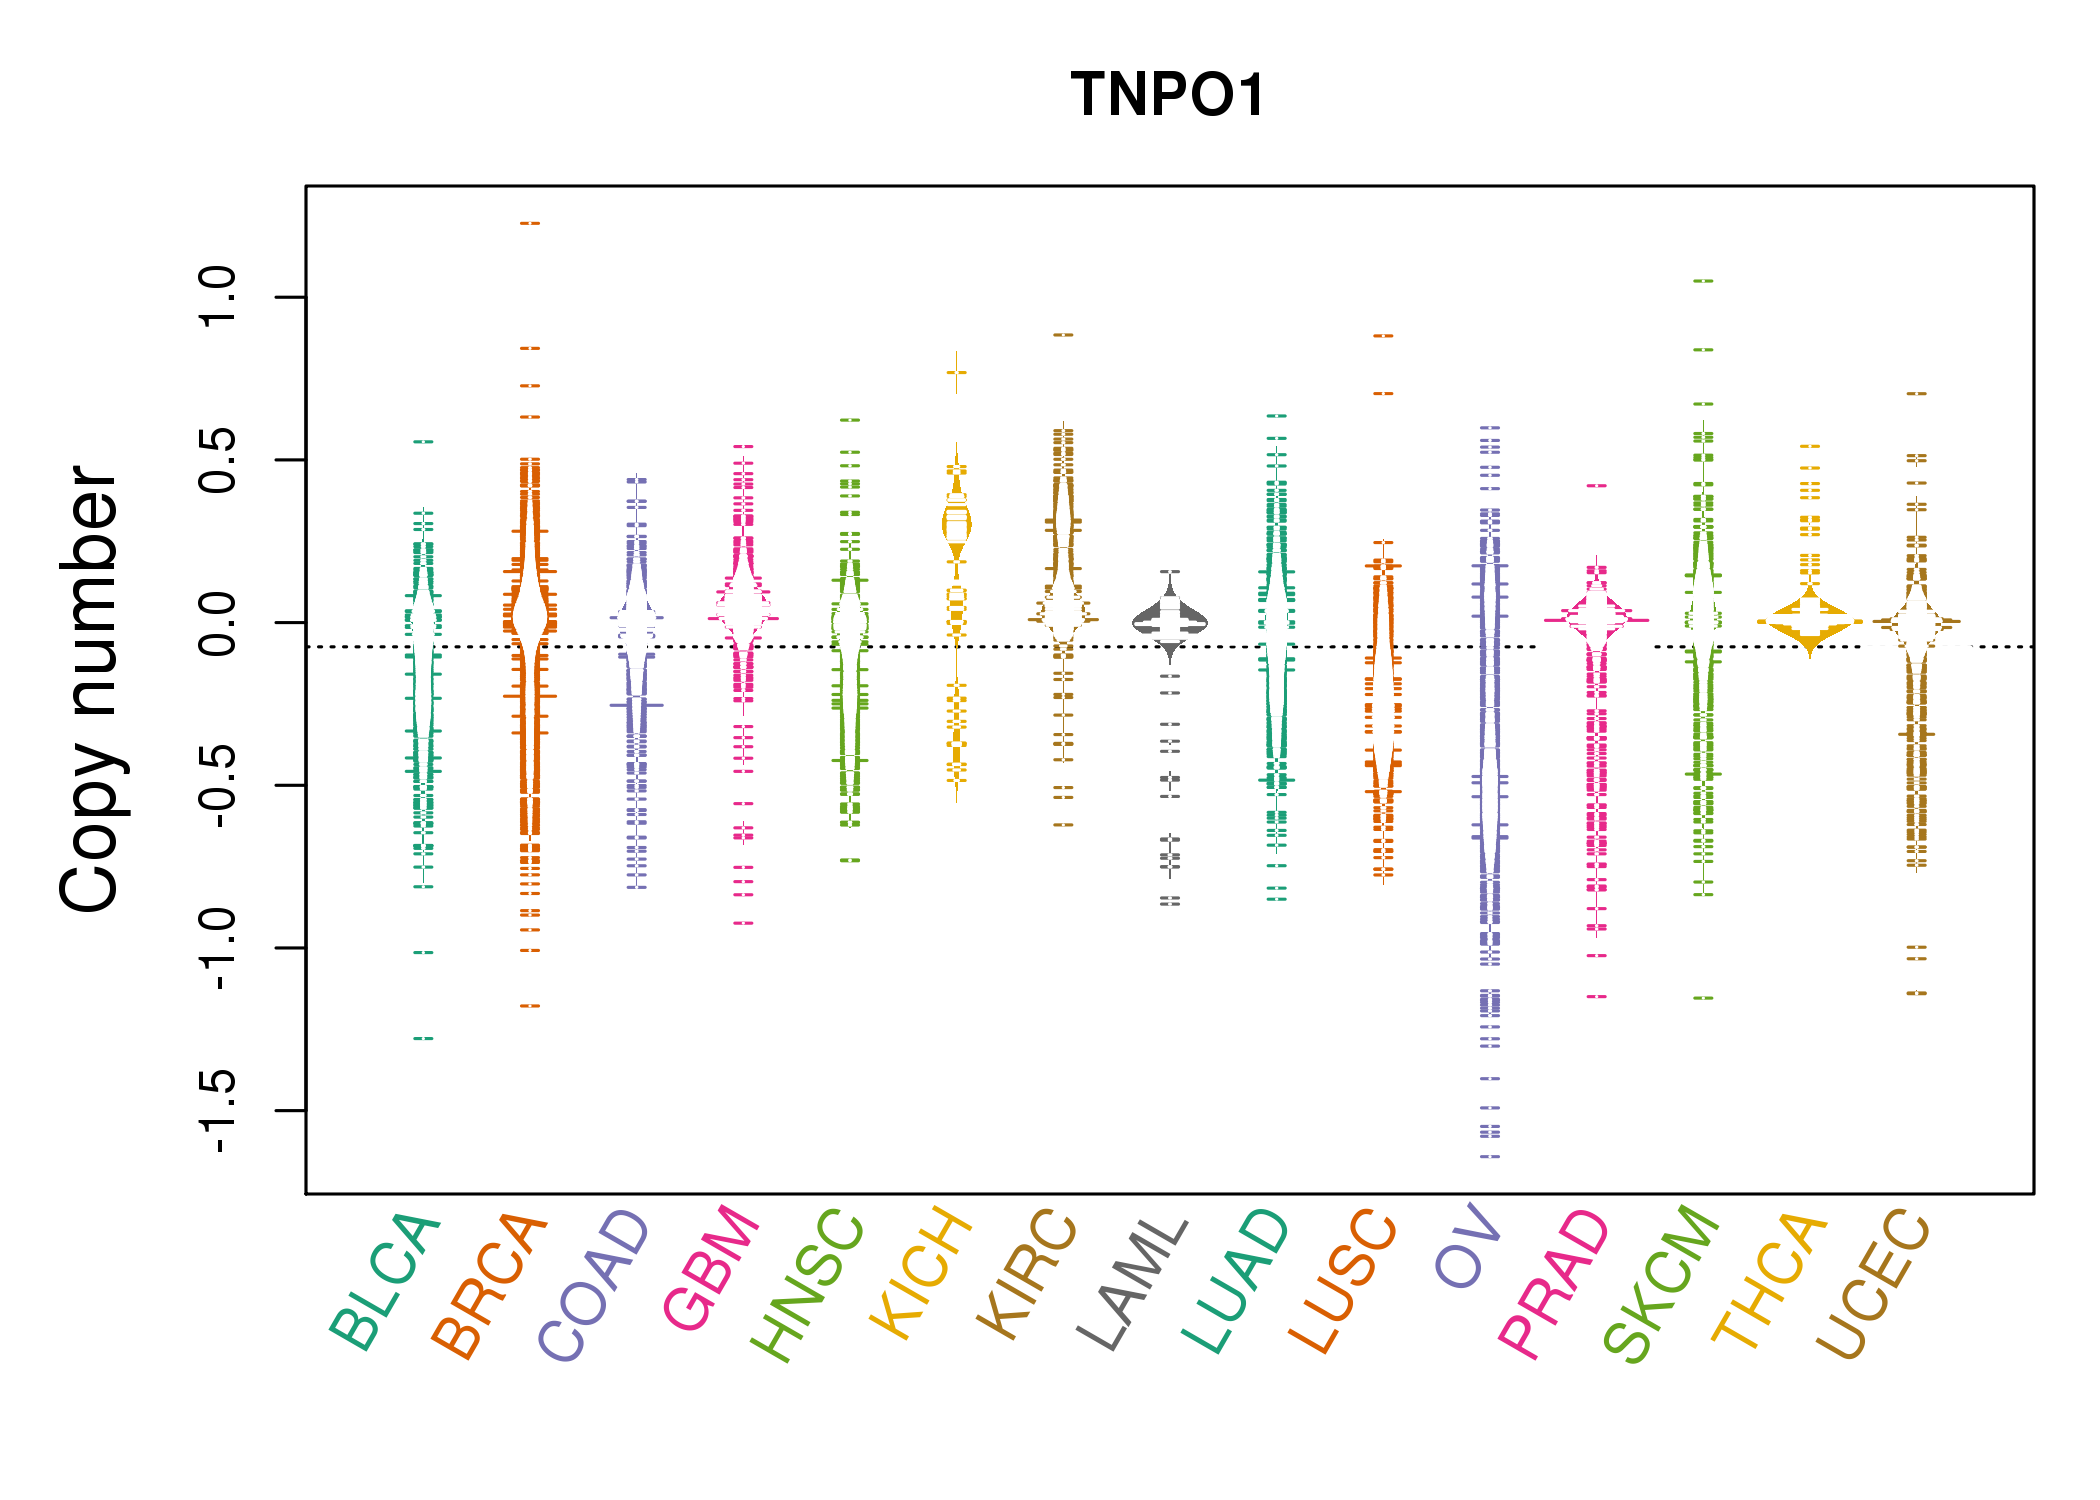 |
| cf) Tissue ID[Tissue type]: BLCA[Bladder Urothelial Carcinoma], BRCA[Breast invasive carcinoma], CESC[Cervical squamous cell carcinoma and endocervical adenocarcinoma], COAD[Colon adenocarcinoma], GBM[Glioblastoma multiforme], Glioma Low Grade, HNSC[Head and Neck squamous cell carcinoma], KICH[Kidney Chromophobe], KIRC[Kidney renal clear cell carcinoma], KIRP[Kidney renal papillary cell carcinoma], LAML[Acute Myeloid Leukemia], LUAD[Lung adenocarcinoma], LUSC[Lung squamous cell carcinoma], OV[Ovarian serous cystadenocarcinoma ], PAAD[Pancreatic adenocarcinoma], PRAD[Prostate adenocarcinoma], SKCM[Skin Cutaneous Melanoma], STAD[Stomach adenocarcinoma], THCA[Thyroid carcinoma], UCEC[Uterine Corpus Endometrial Carcinoma] |
| Top |
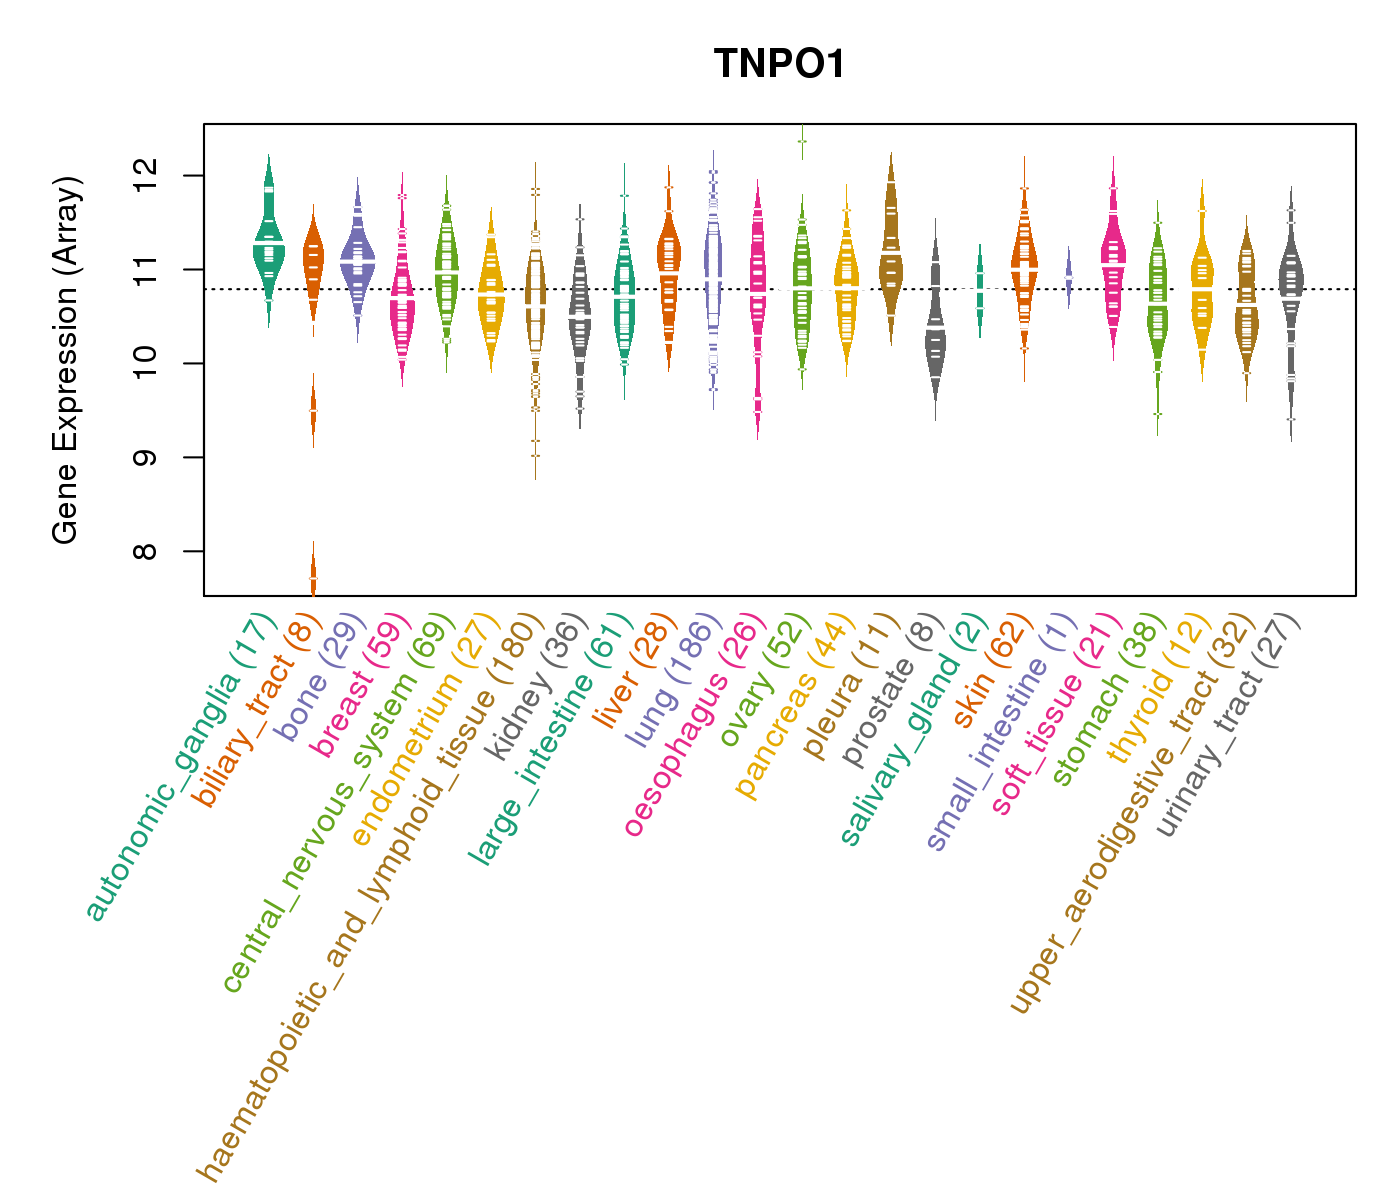
| Gene Expression for TNPO1 |
| * CCLE gene expression data were extracted from CCLE_Expression_Entrez_2012-10-18.res: Gene-centric RMA-normalized mRNA expression data. |
 |
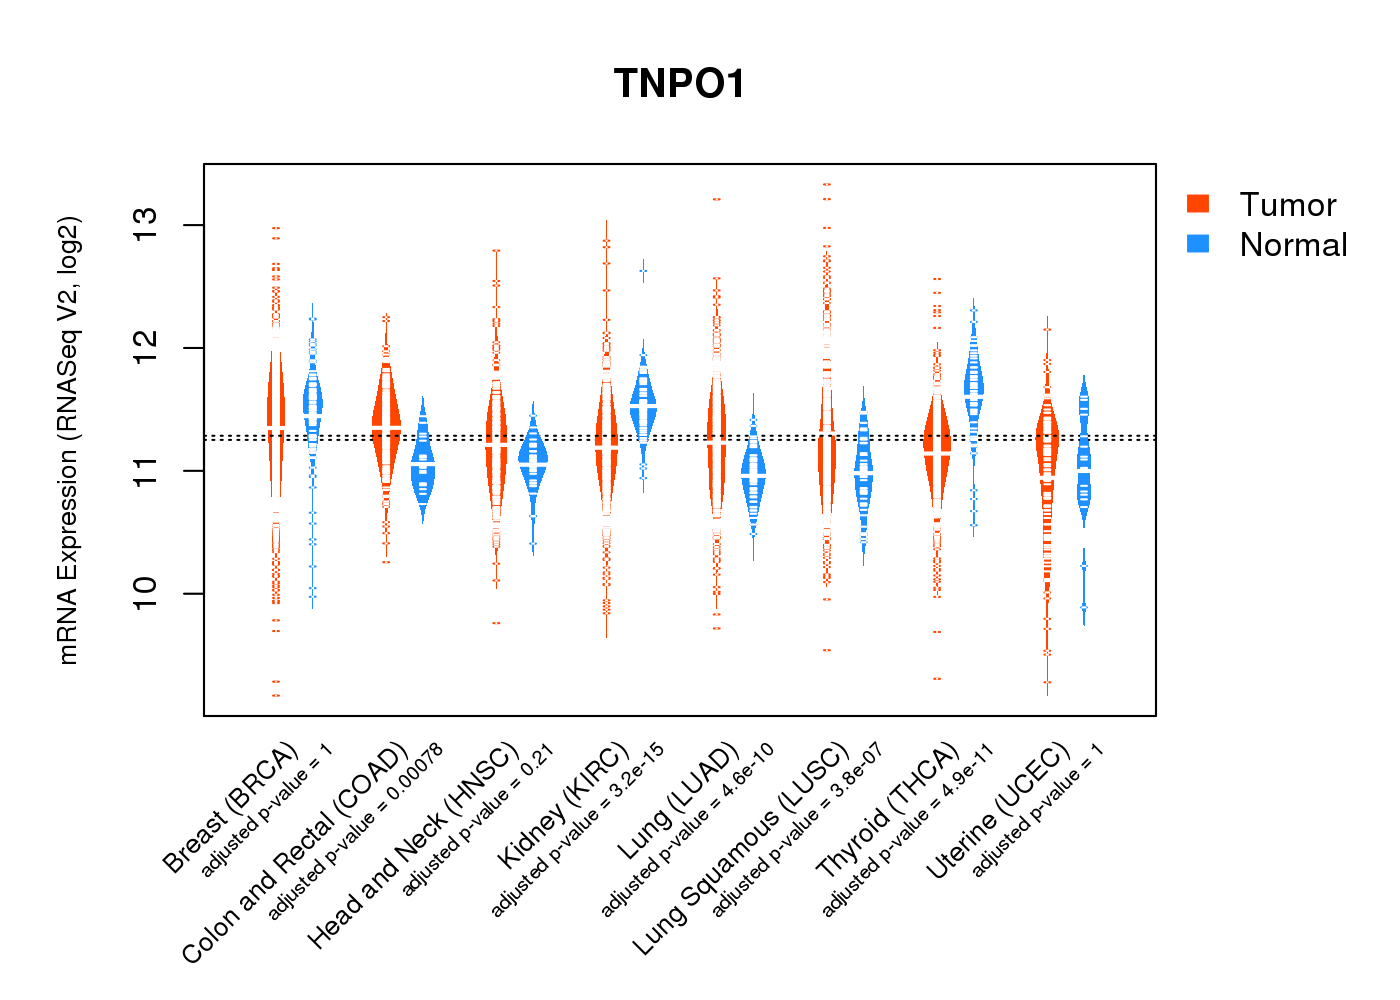
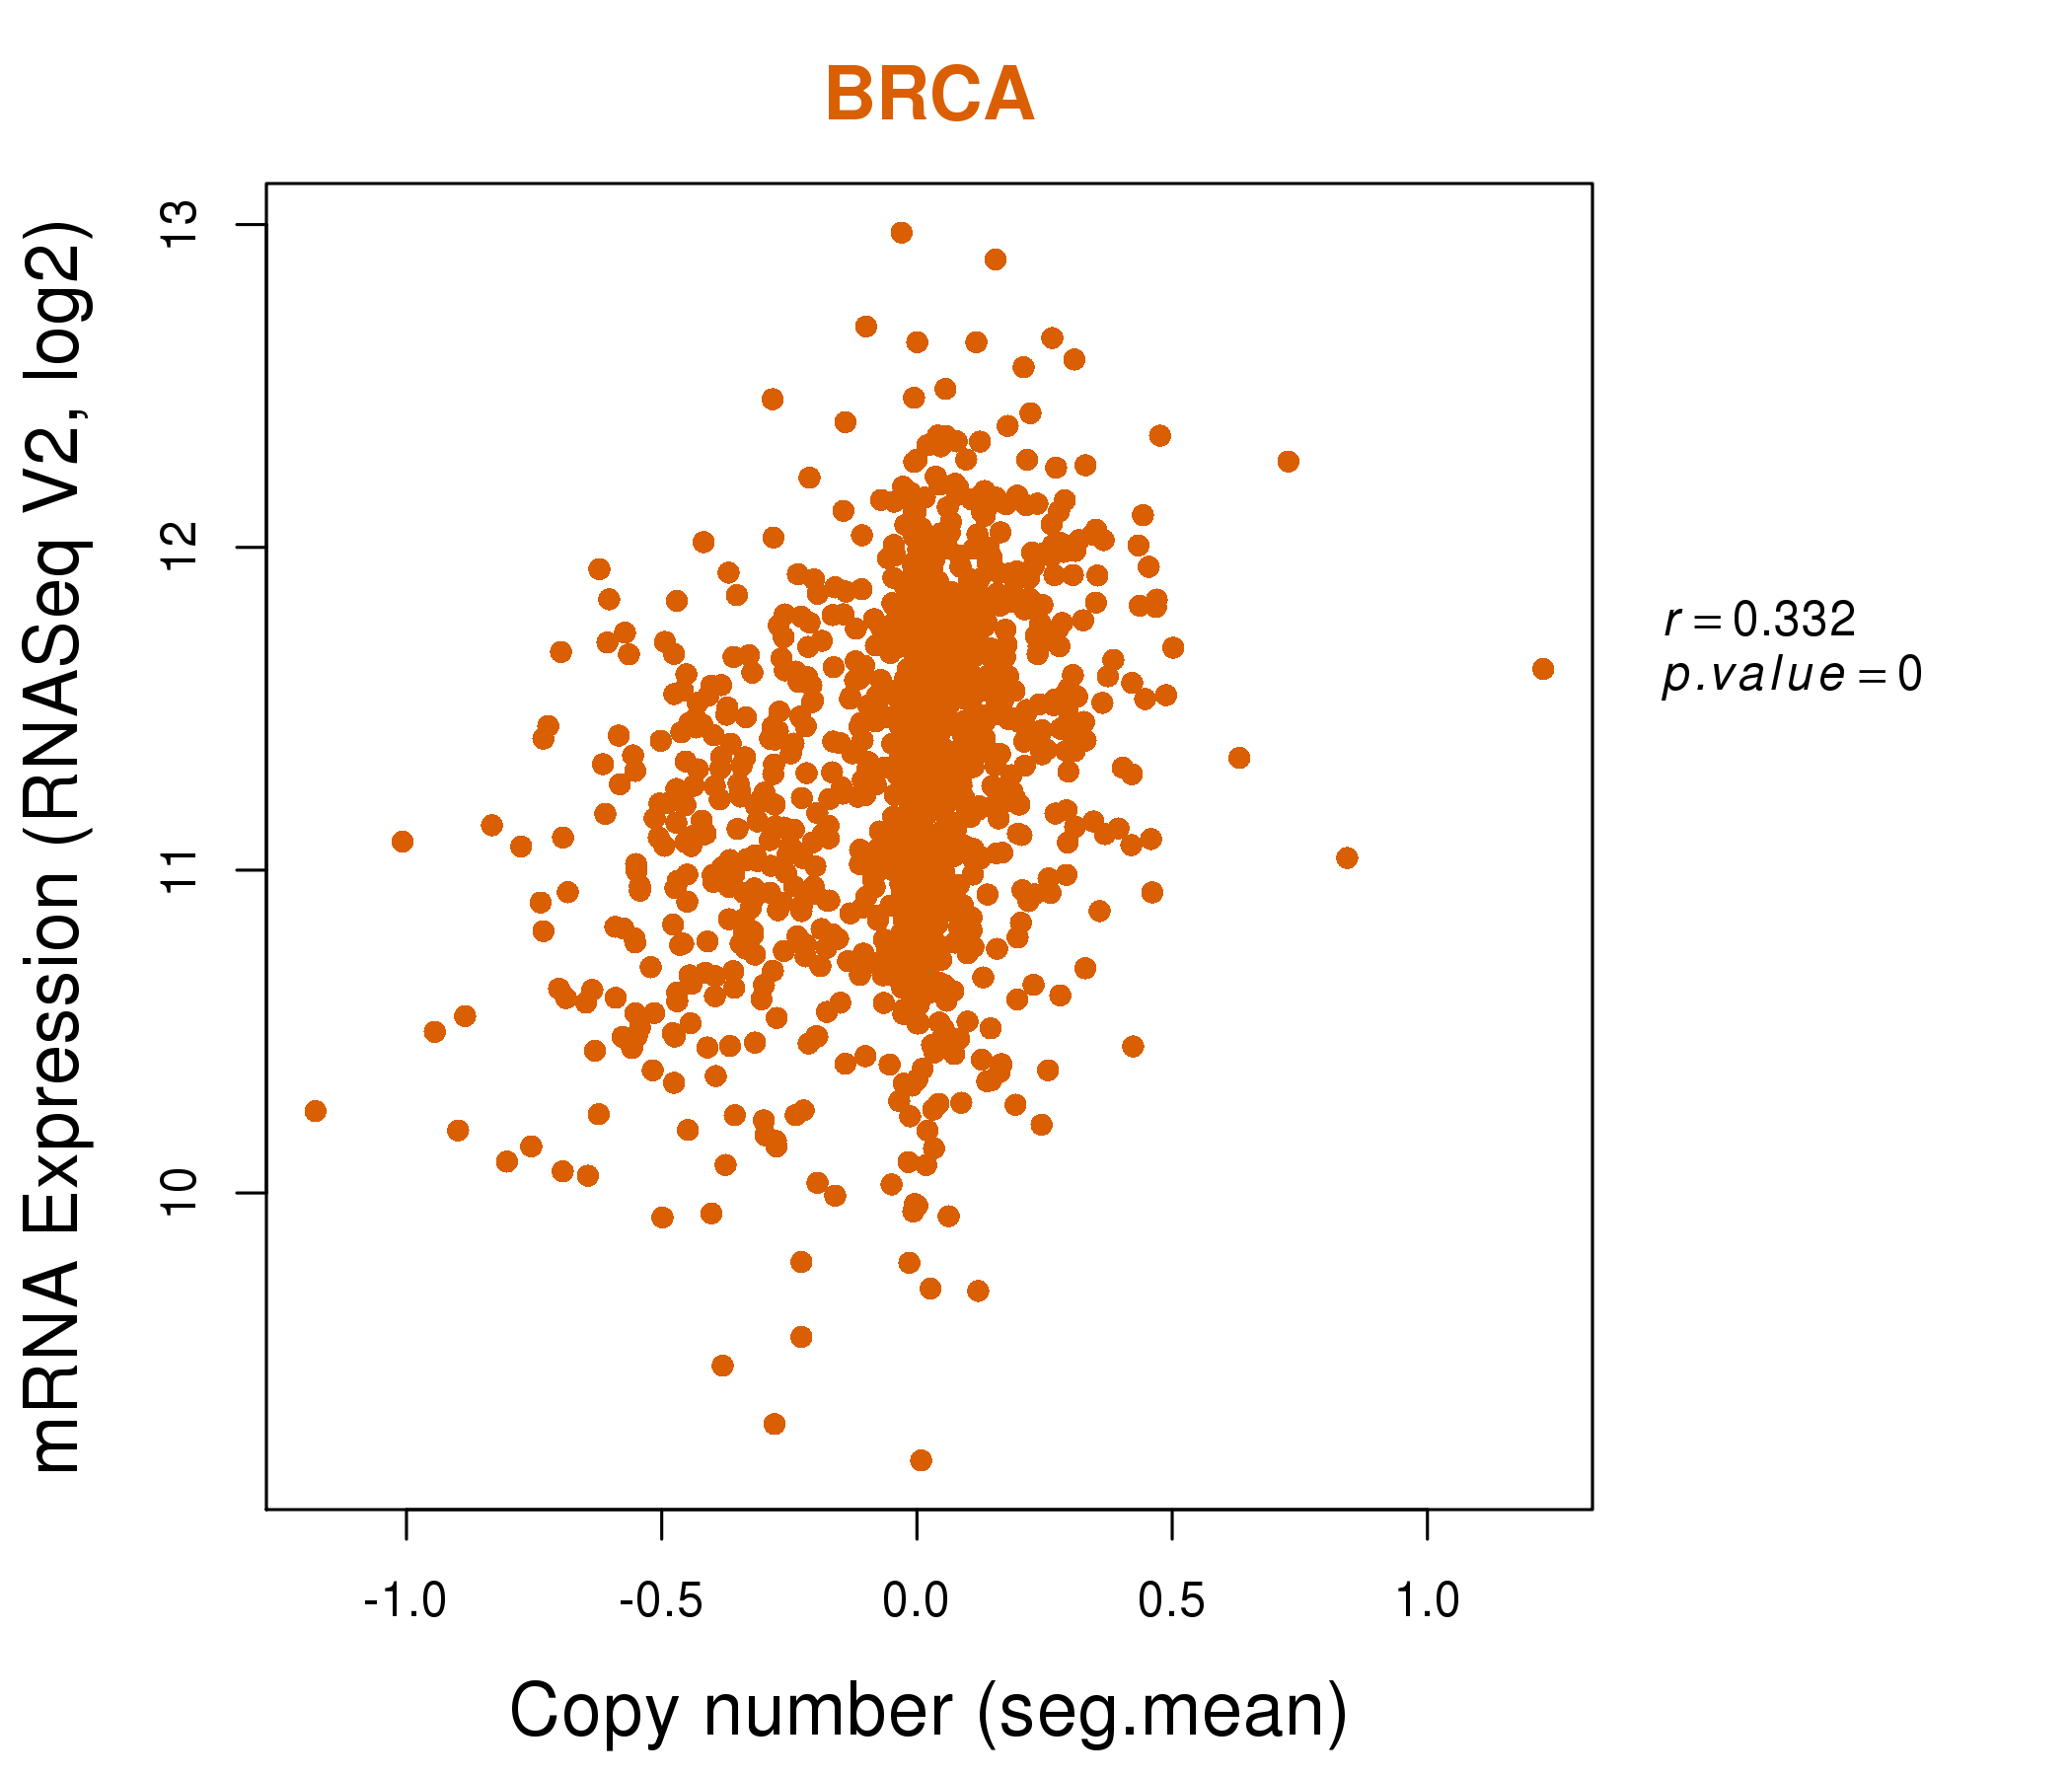
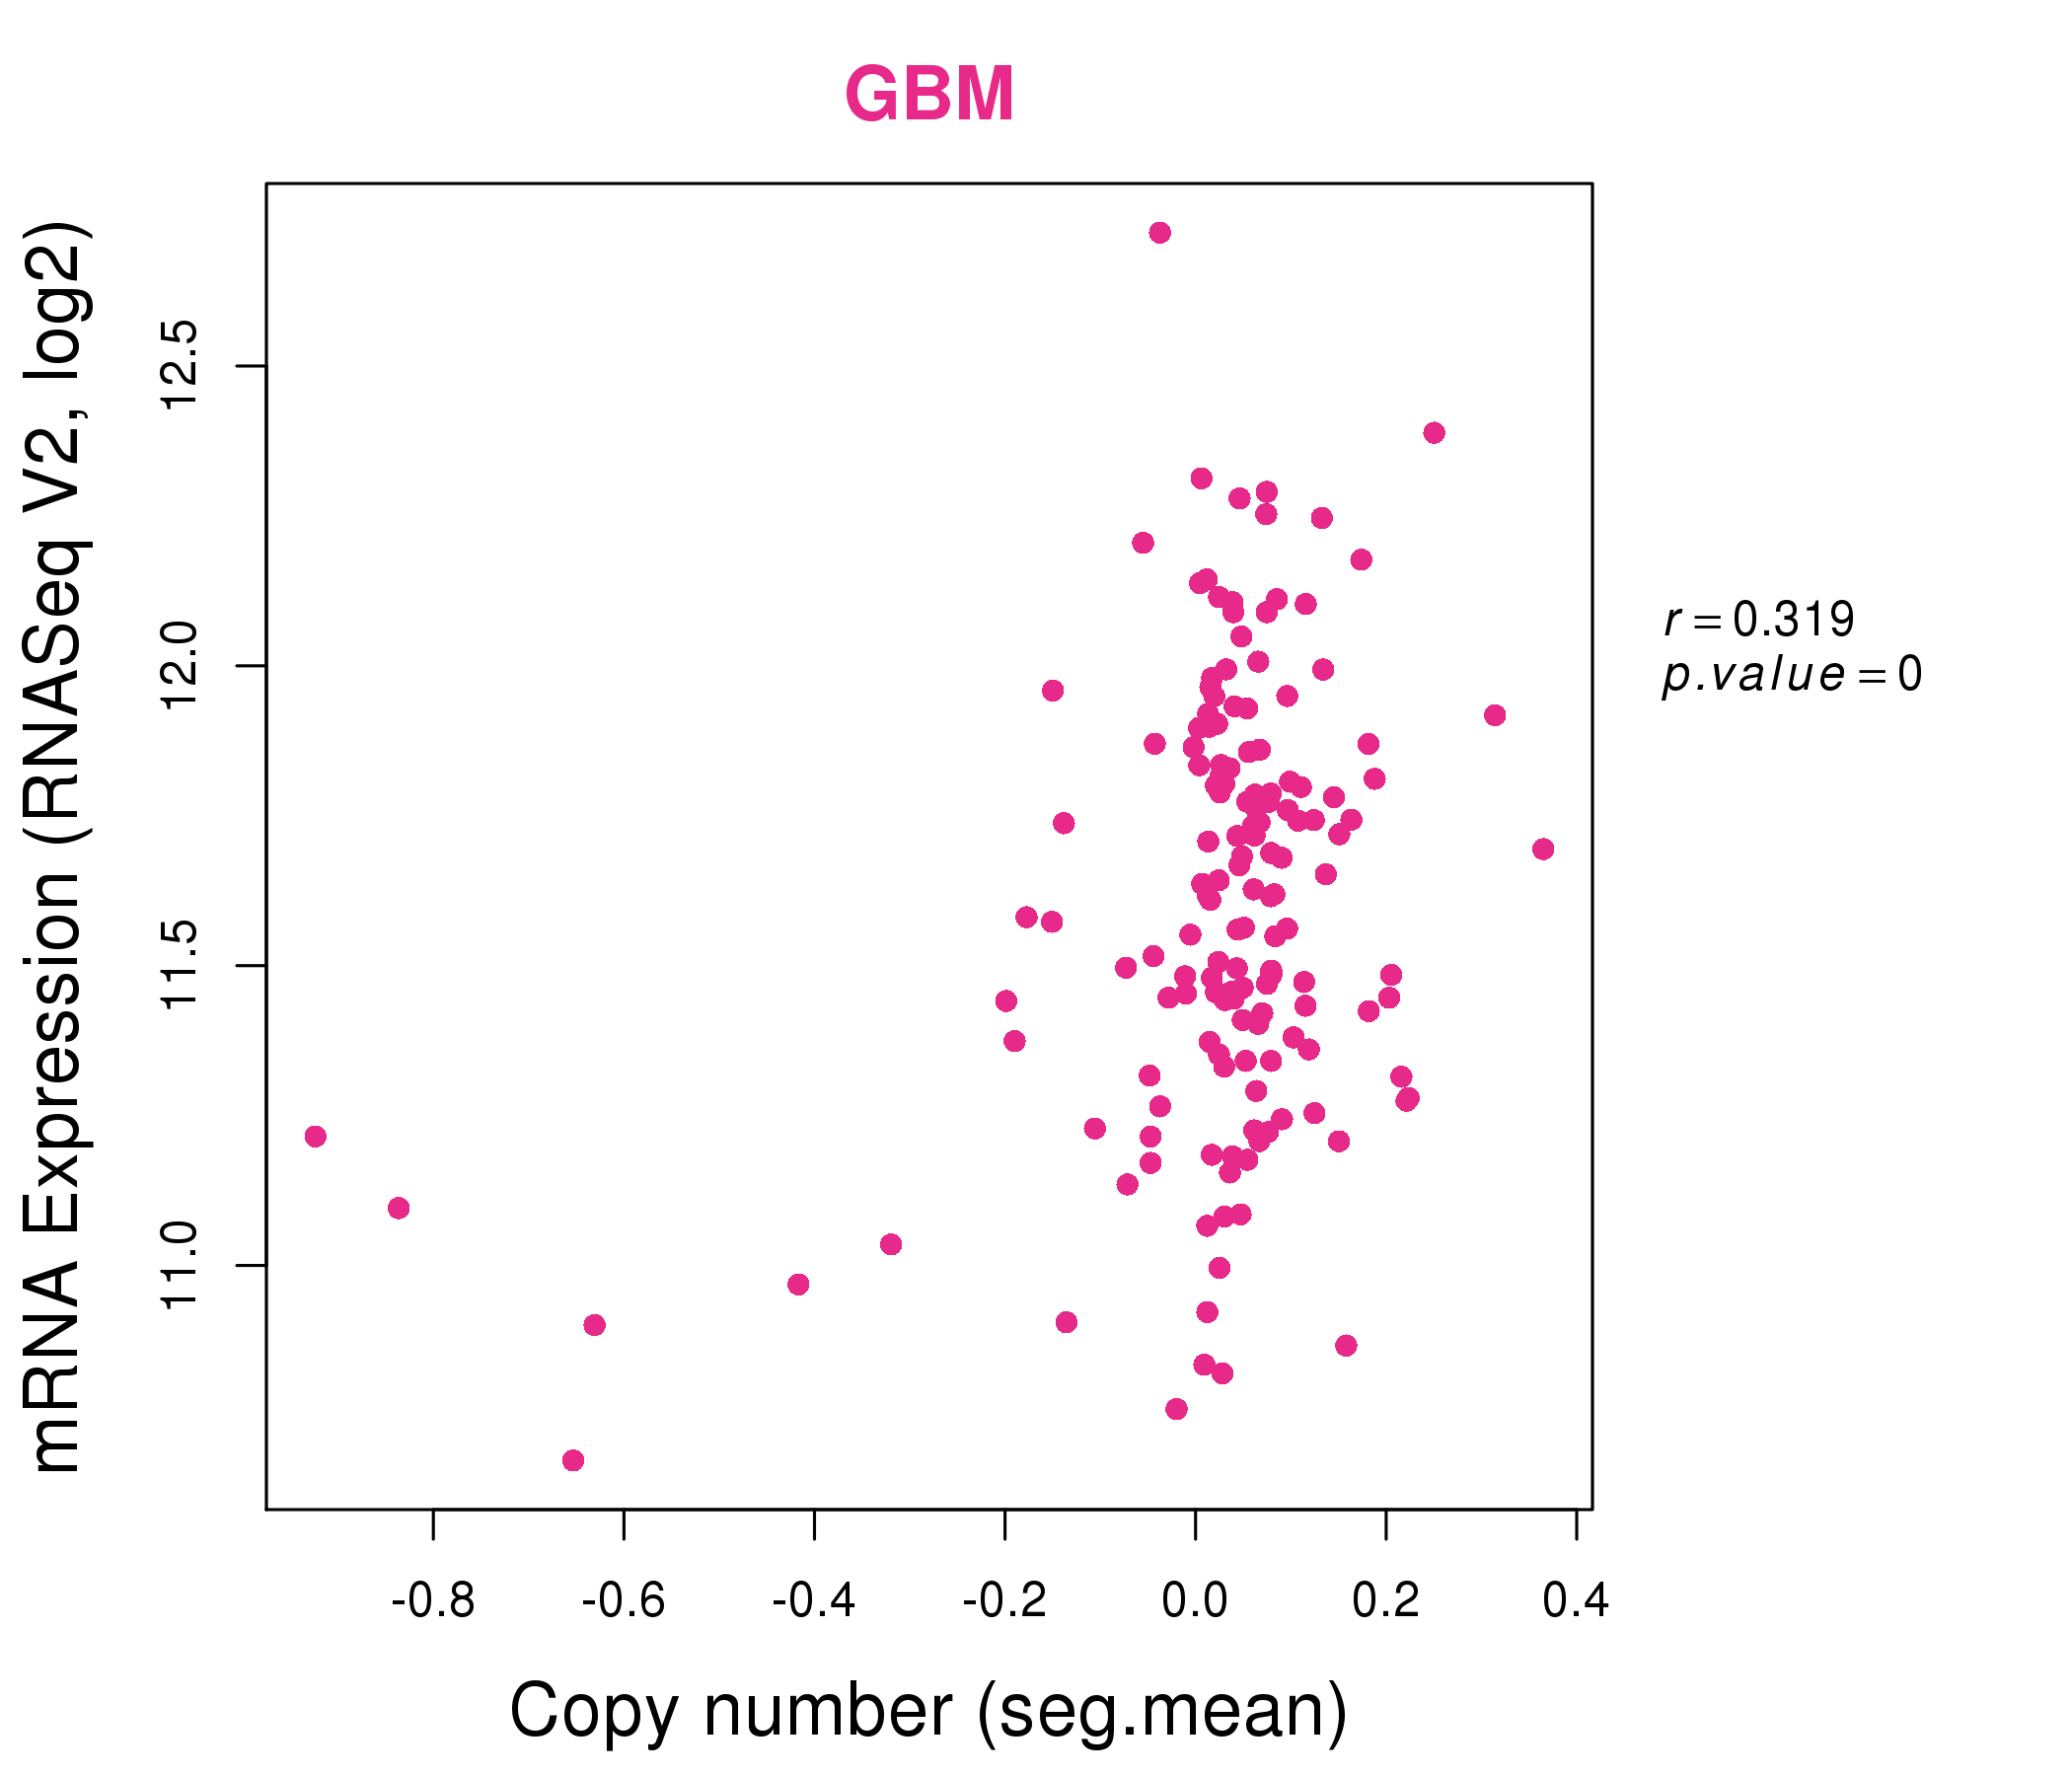
| * Normalized gene expression data of RNASeqV2 was extracted from TCGA using R package TCGA-Assembler. The URLs of all public data files on TCGA DCC data server were gathered at Jan-05-2015. Only eight cancer types have enough normal control samples for differential expression analysis. (t test, adjusted p<0.05 (using Benjamini-Hochberg FDR)) |
 |
| Top |
| * This plots show the correlation between CNV and gene expression. |
: Open all plots for all cancer types
 |
|
 |
|
| Top |
| Gene-Gene Network Information |
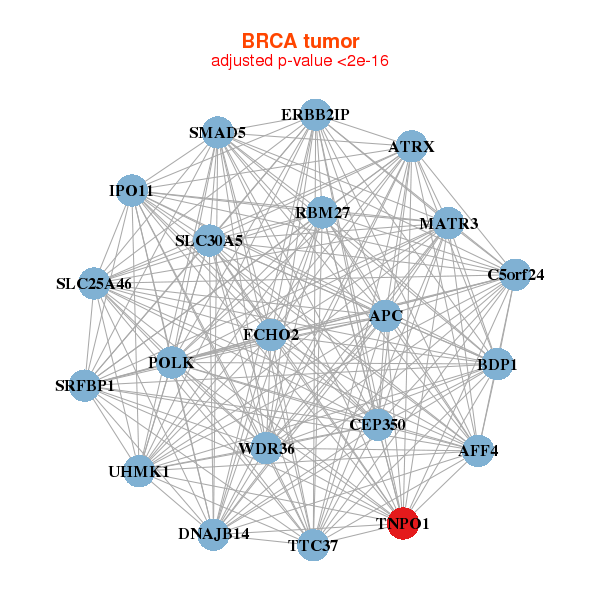
| * Co-Expression network figures were drawn using R package igraph. Only the top 20 genes with the highest correlations were shown. Red circle: input gene, orange circle: cell metabolism gene, sky circle: other gene |
: Open all plots for all cancer types
 |
|
| AFF4,APC,ATRX,BDP1,C5orf24,CEP350,DNAJB14, ERBB2IP,FCHO2,IPO11,MATR3,POLK,RBM27,SLC25A46, SLC30A5,SMAD5,SRFBP1,TNPO1,TTC37,UHMK1,WDR36 | ACAP2,ANKIB1,ATRX,BMPR2,CDC73,DCUN1D1,DICER1, DNAJB14,EDEM3,INTS2,ITCH,TRAPPC8,KIAA1033,MED13, MKLN1,OSBPL8,PIK3C2A,RAB11FIP2,RAB3GAP2,SEC24A,TNPO1 |
 |
|
| AGGF1,AGPS,BDP1,CHD1,DDX46,IPO11,KIF2A, LNPEP,LYSMD3,MAN2A1,MATR3,MBLAC2,NLN,POLK, PPIP5K2,RBM27,SKIV2L2,SLC30A5,TNPO1,UTP15,WDR36 | AP3M1,CSRNP3,DAAM1,EIF5B,INTS2,KIF5B,LUC7L2, MAN1A2,PHIP,PIK3C2A,PREPL,RBM26,ROCK1,NEMF, SEC63,SREK1,SMARCA5,SUZ12,TNPO1,TOP2B,ZBTB11 |

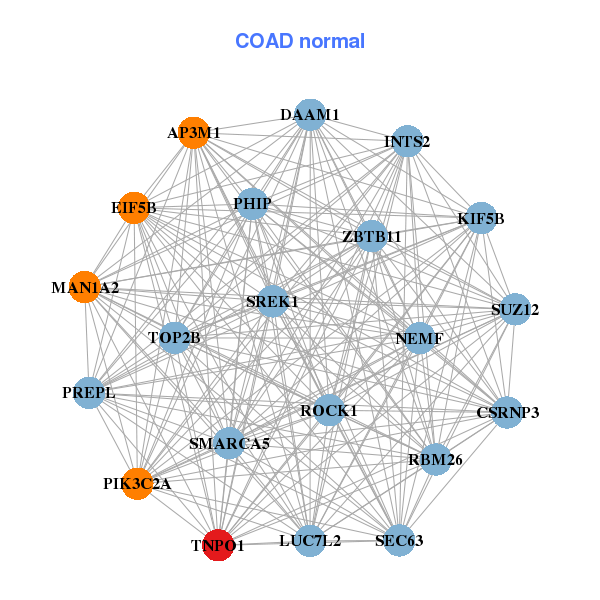
| * Co-Expression network figures were drawn using R package igraph. Only the top 20 genes with the highest correlations were shown. Red circle: input gene, orange circle: cell metabolism gene, sky circle: other gene |
: Open all plots for all cancer types
| Top |
: Open all interacting genes' information including KEGG pathway for all interacting genes from DAVID
| Top |
| Pharmacological Information for TNPO1 |
| There's no related Drug. |
| Top |
| Cross referenced IDs for TNPO1 |
| * We obtained these cross-references from Uniprot database. It covers 150 different DBs, 18 categories. http://www.uniprot.org/help/cross_references_section |
: Open all cross reference information
|
Copyright © 2016-Present - The Univsersity of Texas Health Science Center at Houston @ |