|
||||||||||||||||||||
| |
| Phenotypic Information (metabolism pathway, cancer, disease, phenome) |
| |
| |
| Gene-Gene Network Information: Co-Expression Network, Interacting Genes & KEGG |
| |
|


| Gene Summary for LDHA |
| Basic gene info. | Gene symbol | LDHA |
| Gene name | lactate dehydrogenase A | |
| Synonyms | GSD11|HEL-S-133P|LDH1|LDHM | |
| Cytomap | UCSC genome browser: 11p15.4 | |
| Genomic location | chr11 :18415935-18429765 | |
| Type of gene | protein-coding | |
| RefGenes | NM_001135239.1, NM_001165414.1,NM_001165415.1,NM_001165416.1,NM_005566.3, NR_028500.1, | |
| Ensembl id | ENSG00000134333 | |
| Description | L-lactate dehydrogenase A chainLDH muscle subunitLDH-ALDH-Mcell proliferation-inducing gene 19 proteinepididymis secretory sperm binding protein Li 133Plactate dehydrogenase Mproliferation-inducing gene 19renal carcinoma antigen NY-REN-59 | |
| Modification date | 20141222 | |
| dbXrefs | MIM : 150000 | |
| HGNC : HGNC | ||
| Ensembl : ENSG00000134333 | ||
| HPRD : 01025 | ||
| Vega : OTTHUMG00000167721 | ||
| Protein | UniProt: P00338 go to UniProt's Cross Reference DB Table | |
| Expression | CleanEX: HS_LDHA | |
| BioGPS: 3939 | ||
| Gene Expression Atlas: ENSG00000134333 | ||
| The Human Protein Atlas: ENSG00000134333 | ||
| Pathway | NCI Pathway Interaction Database: LDHA | |
| KEGG: LDHA | ||
| REACTOME: LDHA | ||
| ConsensusPathDB | ||
| Pathway Commons: LDHA | ||
| Metabolism | MetaCyc: LDHA | |
| HUMANCyc: LDHA | ||
| Regulation | Ensembl's Regulation: ENSG00000134333 | |
| miRBase: chr11 :18,415,935-18,429,765 | ||
| TargetScan: NM_001135239 | ||
| cisRED: ENSG00000134333 | ||
| Context | iHOP: LDHA | |
| cancer metabolism search in PubMed: LDHA | ||
| UCL Cancer Institute: LDHA | ||
| Assigned class in ccmGDB | A - This gene has a literature evidence and it belongs to cancer gene. | |
| References showing role of LDHA in cancer cell metabolism | 1. Dai Q, Yin Q, Wei L, Zhou Y, Qiao C, et al. (2015) Oroxylin A regulates glucose metabolism in response to hypoxic stress with the involvement of Hypoxia-inducible factor-1 in human hepatoma HepG2 cells. Mol Carcinog. doi: 10.1002/mc.22369. go to article 2. Intlekofer AM, Dematteo RG, Venneti S, Finley LW, Lu C, et al. (2015) Hypoxia Induces Production of L-2-Hydroxyglutarate. Cell Metab 22: 304-311. doi: 10.1016/j.cmet.2015.06.023. pmid: 4527873. go to article 3. Ooi AT, Gomperts BN (2015) Molecular Pathways: Targeting Cellular Energy Metabolism in Cancer via Inhibition of SLC2A1 and LDHA. Clin Cancer Res 21: 2440-2444. doi: 10.1158/1078-0432.CCR-14-1209. pmid: 4452440. go to article 4. Maiso P, Huynh D, Moschetta M, Sacco A, Aljawai Y, et al. (2015) Metabolic signature identifies novel targets for drug resistance in multiple myeloma. Cancer Res 75: 2071-2082. doi: 10.1158/0008-5472.CAN-14-3400. pmid: 4433568. go to article | |
| Top |
| Phenotypic Information for LDHA(metabolism pathway, cancer, disease, phenome) |
| Cancer | CGAP: LDHA |
| Familial Cancer Database: LDHA | |
| * This gene is included in those cancer gene databases. |
|
|
|
|
|
|
| ||||||||||||||
Oncogene 1 | Significant driver gene in | |||||||||||||||||||
| cf) number; DB name 1 Oncogene; http://nar.oxfordjournals.org/content/35/suppl_1/D721.long, 2 Tumor Suppressor gene; https://bioinfo.uth.edu/TSGene/, 3 Cancer Gene Census; http://www.nature.com/nrc/journal/v4/n3/abs/nrc1299.html, 4 CancerGenes; http://nar.oxfordjournals.org/content/35/suppl_1/D721.long, 5 Network of Cancer Gene; http://ncg.kcl.ac.uk/index.php, 1Therapeutic Vulnerabilities in Cancer; http://cbio.mskcc.org/cancergenomics/statius/ |
| KEGG_GLYCOLYSIS_GLUCONEOGENESIS KEGG_CYSTEINE_AND_METHIONINE_METABOLISM KEGG_PYRUVATE_METABOLISM KEGG_PROPANOATE_METABOLISM REACTOME_PYRUVATE_METABOLISM_AND_CITRIC_ACID_TCA_CYCLE REACTOME_PYRUVATE_METABOLISM | |
| OMIM | 150000; gene. 150000; gene. 612933; phenotype. 612933; phenotype. |
| Orphanet | 284426; Glycogen storage disease due to lactate dehydrogenase M-subunit deficiency. 284426; Glycogen storage disease due to lactate dehydrogenase M-subunit deficiency. |
| Disease | KEGG Disease: LDHA |
| MedGen: LDHA (Human Medical Genetics with Condition) | |
| ClinVar: LDHA | |
| Phenotype | MGI: LDHA (International Mouse Phenotyping Consortium) |
| PhenomicDB: LDHA | |
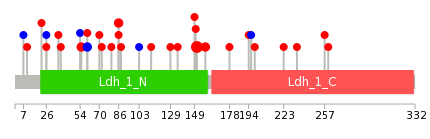
| Mutations for LDHA |
| * Under tables are showing count per each tissue to give us broad intuition about tissue specific mutation patterns.You can go to the detailed page for each mutation database's web site. |
| There's no structural variation information in COSMIC data for this gene. |
| * From mRNA Sanger sequences, Chitars2.0 arranged chimeric transcripts. This table shows LDHA related fusion information. |
| ID | Head Gene | Tail Gene | Accession | Gene_a | qStart_a | qEnd_a | Chromosome_a | tStart_a | tEnd_a | Gene_a | qStart_a | qEnd_a | Chromosome_a | tStart_a | tEnd_a |
| BM044090 | LDHA | 1 | 64 | 11 | 18427043 | 18427106 | WIPI2 | 65 | 875 | 7 | 5262235 | 5270683 | |
| BG179712 | LDHA | 1 | 150 | 11 | 18429031 | 18429180 | MEST | 143 | 802 | 7 | 130145346 | 130146013 | |
| BQ928549 | LDHA | 1 | 62 | 11 | 18427045 | 18427106 | WIPI2 | 63 | 848 | 7 | 5262235 | 5270662 | |
| CA424367 | BOLA2 | 19 | 570 | 16 | 29821934 | 29822485 | LDHA | 571 | 654 | 11 | 18424385 | 18424469 | |
| BM049309 | LDHA | 1 | 64 | 11 | 18427043 | 18427106 | WIPI2 | 65 | 782 | 7 | 5262235 | 5270603 | |
| CA414218 | LDHA | 18 | 339 | 11 | 18429072 | 18429394 | EIF4EBP2 | 338 | 632 | 10 | 72163813 | 72181544 | |
| BG775162 | LDHA | 1 | 64 | 11 | 18427043 | 18427106 | WIPI2 | 65 | 794 | 7 | 5262235 | 5270616 | |
| BC025288 | SKI | 1 | 443 | 1 | 2238670 | 2239112 | LDHA | 436 | 2093 | 11 | 18416115 | 18429394 | |
| BG122659 | PRPF8 | 1 | 183 | 17 | 1579226 | 1579560 | LDHA | 178 | 765 | 11 | 18428658 | 18429243 | |
| BC051361 | SKI | 1 | 443 | 1 | 2238670 | 2239112 | LDHA | 436 | 2093 | 11 | 18416115 | 18429394 | |
| BF893167 | GORASP2 | 1 | 147 | 2 | 171806733 | 171807914 | LDHA | 139 | 460 | 11 | 18416110 | 18421075 | |
| CB143668 | LDHA | 1 | 158 | 11 | 18425250 | 18427044 | ATP5G3 | 150 | 434 | 2 | 176043940 | 176046436 | |
| BC072009 | SKI | 1 | 443 | 1 | 2238670 | 2239112 | LDHA | 436 | 2093 | 11 | 18416115 | 18429394 | |
| Top |
| There's no copy number variation information in COSMIC data for this gene. |
| Top |
|
 |
| Top |
| Stat. for Non-Synonymous SNVs (# total SNVs=38) | (# total SNVs=10) |
 |  |
(# total SNVs=2) | (# total SNVs=0) |
 |
| Top |
| * When you move the cursor on each content, you can see more deailed mutation information on the Tooltip. Those are primary_site,primary_histology,mutation(aa),pubmedID. |
| GRCh37 position | Mutation(aa) | Unique sampleID count |
| chr11:18425274-18425274 | p.V209A | 6 |
| chr11:18424398-18424398 | p.T144A | 3 |
| chr11:18424527-18424527 | p.G187W | 2 |
| chr11:18418496-18418496 | p.A36V | 2 |
| chr11:18421003-18421003 | p.V51G | 2 |
| chr11:18421014-18421014 | p.E55K | 2 |
| chr11:18422487-18422487 | p.I116I | 1 |
| chr11:18418442-18418442 | p.Q20fs*21 | 1 |
| chr11:18424512-18424512 | p.P182S | 1 |
| chr11:18421030-18421030 | p.G60E | 1 |
| Top |
|
 |
| Point Mutation/ Tissue ID | 1 | 2 | 3 | 4 | 5 | 6 | 7 | 8 | 9 | 10 | 11 | 12 | 13 | 14 | 15 | 16 | 17 | 18 | 19 | 20 |
| # sample | 13 | 4 | 1 | 1 | 6 | 1 | 4 | 2 | 2 | 6 | ||||||||||
| # mutation | 7 | 5 | 1 | 1 | 6 | 1 | 4 | 2 | 2 | 8 | ||||||||||
| nonsynonymous SNV | 5 | 3 | 1 | 5 | 1 | 4 | 2 | 2 | 7 | |||||||||||
| synonymous SNV | 2 | 2 | 1 | 1 | 1 |
| cf) Tissue ID; Tissue type (1; BLCA[Bladder Urothelial Carcinoma], 2; BRCA[Breast invasive carcinoma], 3; CESC[Cervical squamous cell carcinoma and endocervical adenocarcinoma], 4; COAD[Colon adenocarcinoma], 5; GBM[Glioblastoma multiforme], 6; Glioma Low Grade, 7; HNSC[Head and Neck squamous cell carcinoma], 8; KICH[Kidney Chromophobe], 9; KIRC[Kidney renal clear cell carcinoma], 10; KIRP[Kidney renal papillary cell carcinoma], 11; LAML[Acute Myeloid Leukemia], 12; LUAD[Lung adenocarcinoma], 13; LUSC[Lung squamous cell carcinoma], 14; OV[Ovarian serous cystadenocarcinoma ], 15; PAAD[Pancreatic adenocarcinoma], 16; PRAD[Prostate adenocarcinoma], 17; SKCM[Skin Cutaneous Melanoma], 18:STAD[Stomach adenocarcinoma], 19:THCA[Thyroid carcinoma], 20:UCEC[Uterine Corpus Endometrial Carcinoma]) |
| Top |
| * We represented just top 10 SNVs. When you move the cursor on each content, you can see more deailed mutation information on the Tooltip. Those are primary_site, primary_histology, mutation(aa), pubmedID. |
| Genomic Position | Mutation(aa) | Unique sampleID count |
| chr11:18425274 | p.V151A,LDHA | 7 |
| chr11:18424398 | p.T86A,LDHA | 2 |
| chr11:18421014 | p.E55K,LDHA | 2 |
| chr11:18421031 | p.G60G,LDHA | 2 |
| chr11:18424527 | p.Y10H,LDHA | 1 |
| chr11:18418417 | p.L260I | 1 |
| chr11:18428876 | p.K22N,LDHA | 1 |
| chr11:18421065 | p.T86I,LDHA | 1 |
| chr11:18425271 | p.V26L,LDHA | 1 |
| chr11:18418455 | p.V88L,LDHA | 1 |
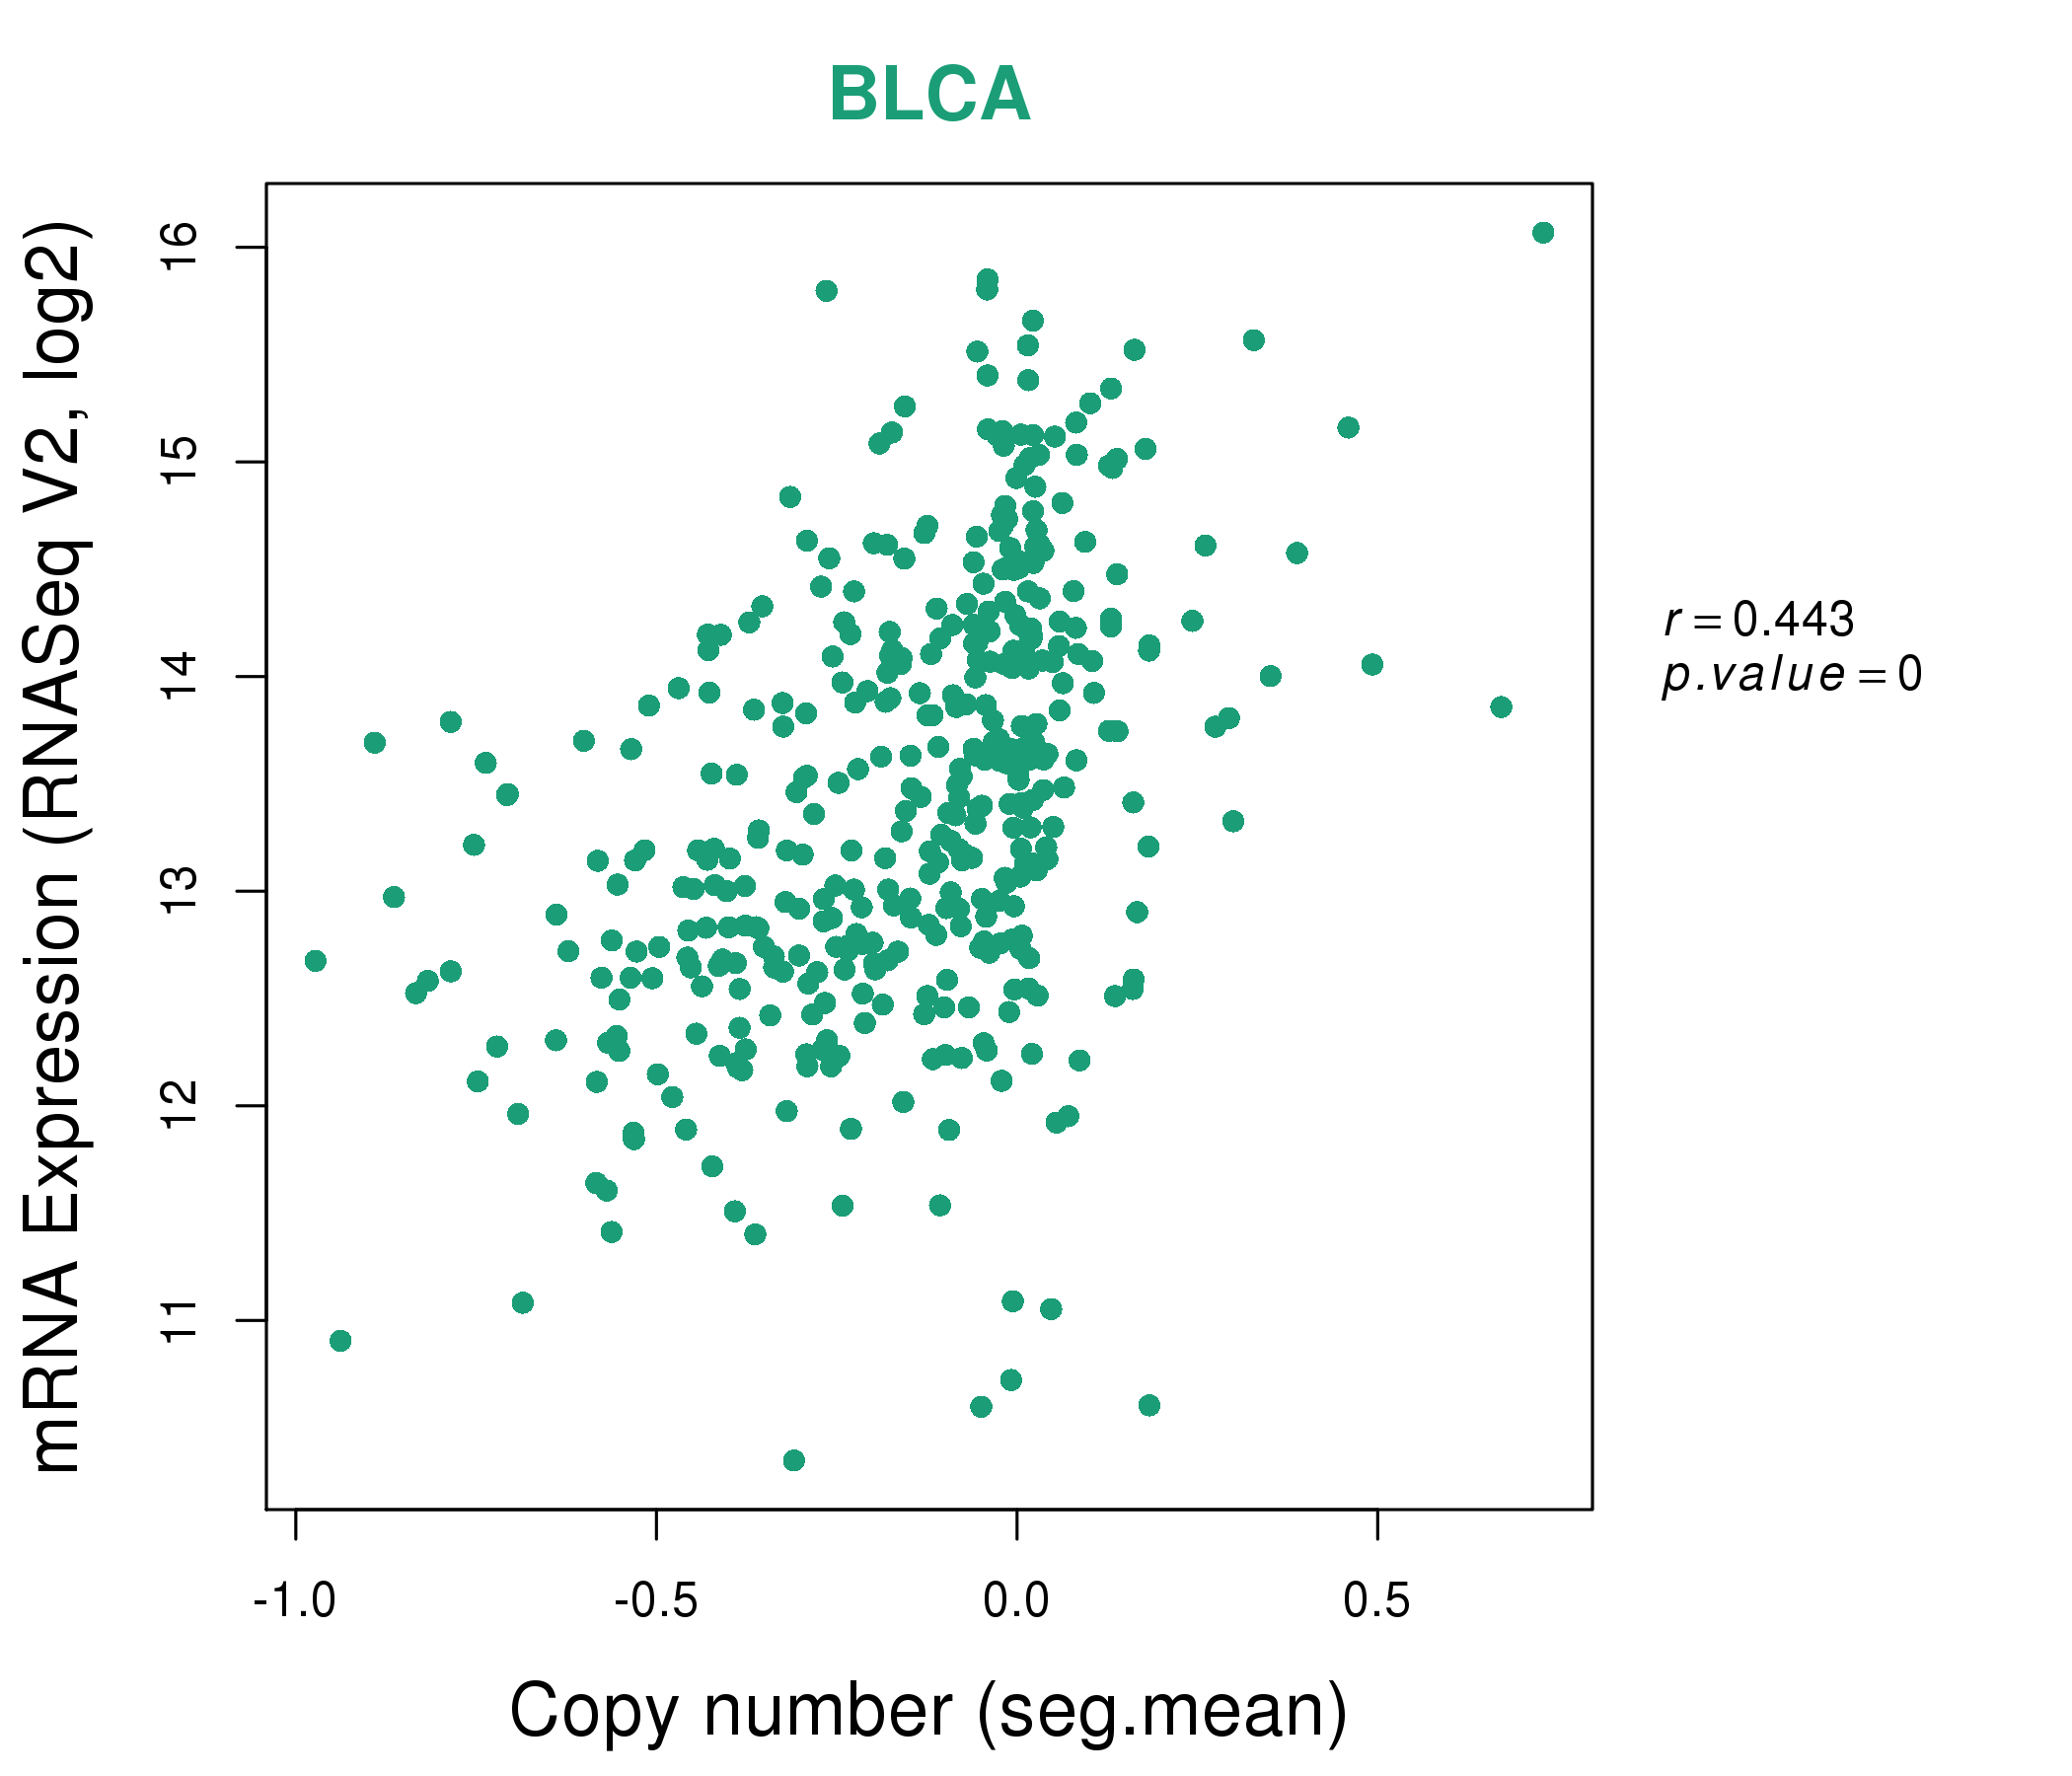
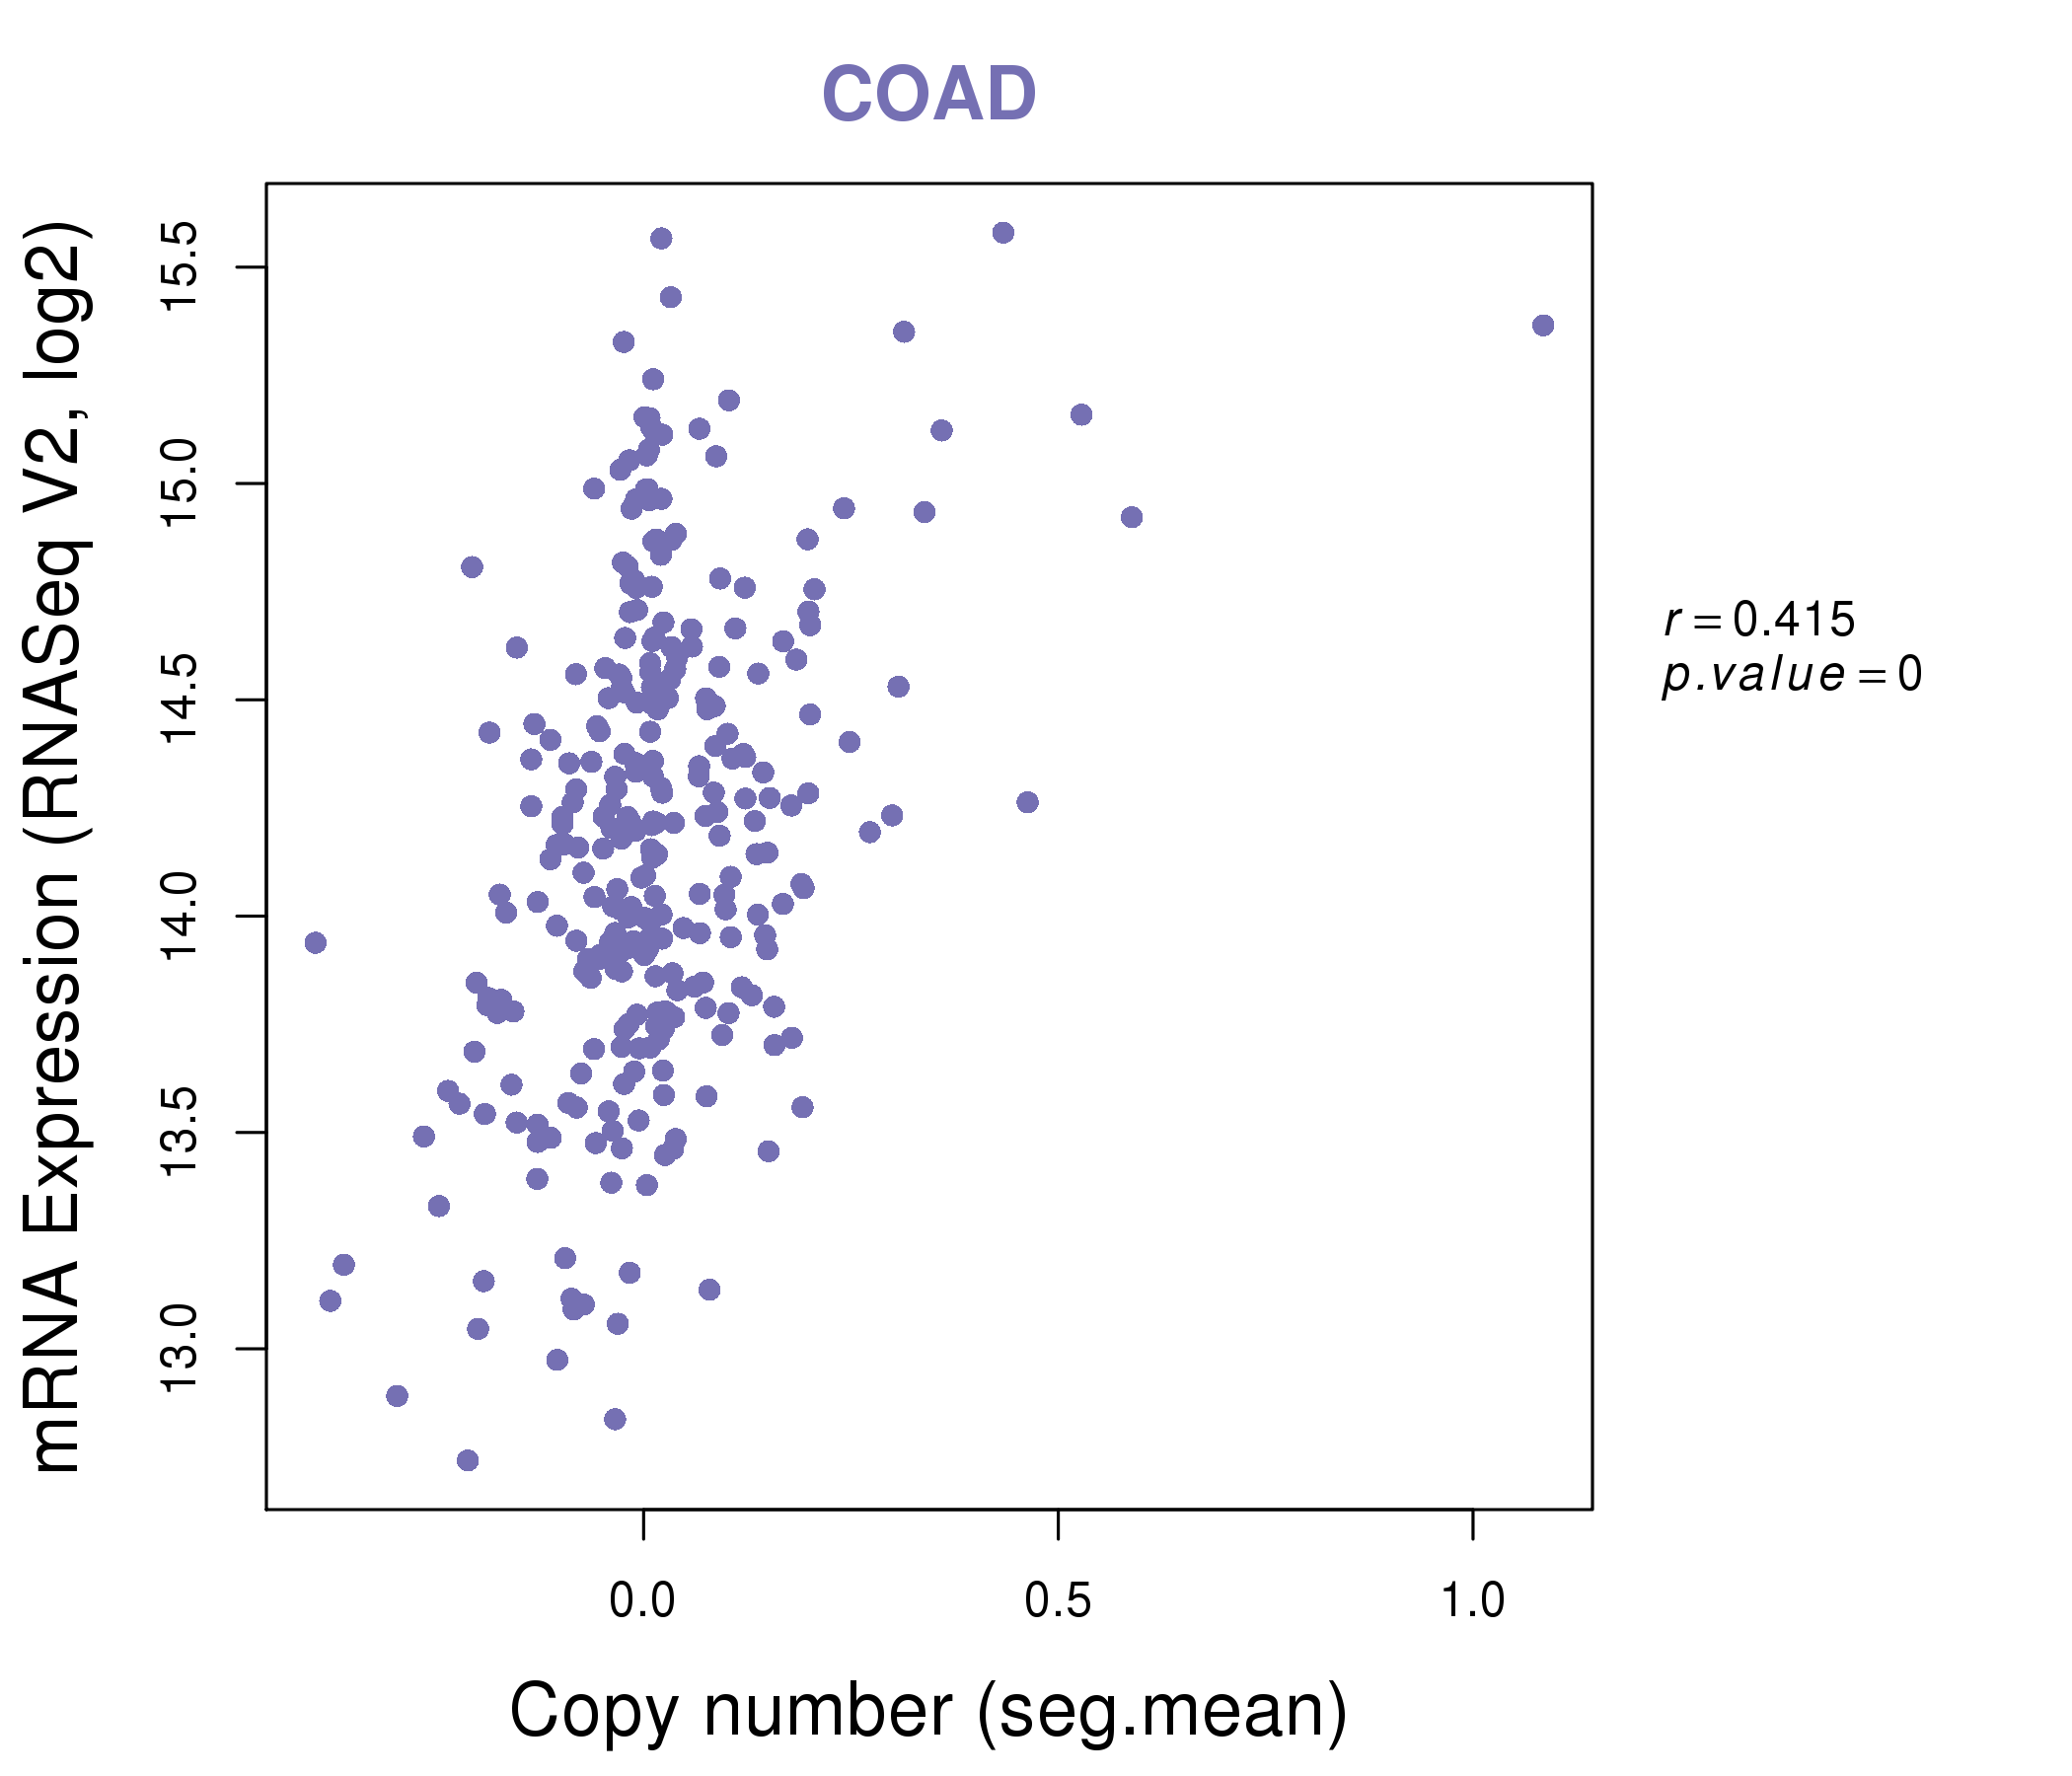
| * Copy number data were extracted from TCGA using R package TCGA-Assembler. The URLs of all public data files on TCGA DCC data server were gathered on Jan-05-2015. Function ProcessCNAData in TCGA-Assembler package was used to obtain gene-level copy number value which is calculated as the average copy number of the genomic region of a gene. |
 |
| cf) Tissue ID[Tissue type]: BLCA[Bladder Urothelial Carcinoma], BRCA[Breast invasive carcinoma], CESC[Cervical squamous cell carcinoma and endocervical adenocarcinoma], COAD[Colon adenocarcinoma], GBM[Glioblastoma multiforme], Glioma Low Grade, HNSC[Head and Neck squamous cell carcinoma], KICH[Kidney Chromophobe], KIRC[Kidney renal clear cell carcinoma], KIRP[Kidney renal papillary cell carcinoma], LAML[Acute Myeloid Leukemia], LUAD[Lung adenocarcinoma], LUSC[Lung squamous cell carcinoma], OV[Ovarian serous cystadenocarcinoma ], PAAD[Pancreatic adenocarcinoma], PRAD[Prostate adenocarcinoma], SKCM[Skin Cutaneous Melanoma], STAD[Stomach adenocarcinoma], THCA[Thyroid carcinoma], UCEC[Uterine Corpus Endometrial Carcinoma] |
| Top |
| Gene Expression for LDHA |
| * CCLE gene expression data were extracted from CCLE_Expression_Entrez_2012-10-18.res: Gene-centric RMA-normalized mRNA expression data. |
 |
| * Normalized gene expression data of RNASeqV2 was extracted from TCGA using R package TCGA-Assembler. The URLs of all public data files on TCGA DCC data server were gathered at Jan-05-2015. Only eight cancer types have enough normal control samples for differential expression analysis. (t test, adjusted p<0.05 (using Benjamini-Hochberg FDR)) |
 |
| Top |
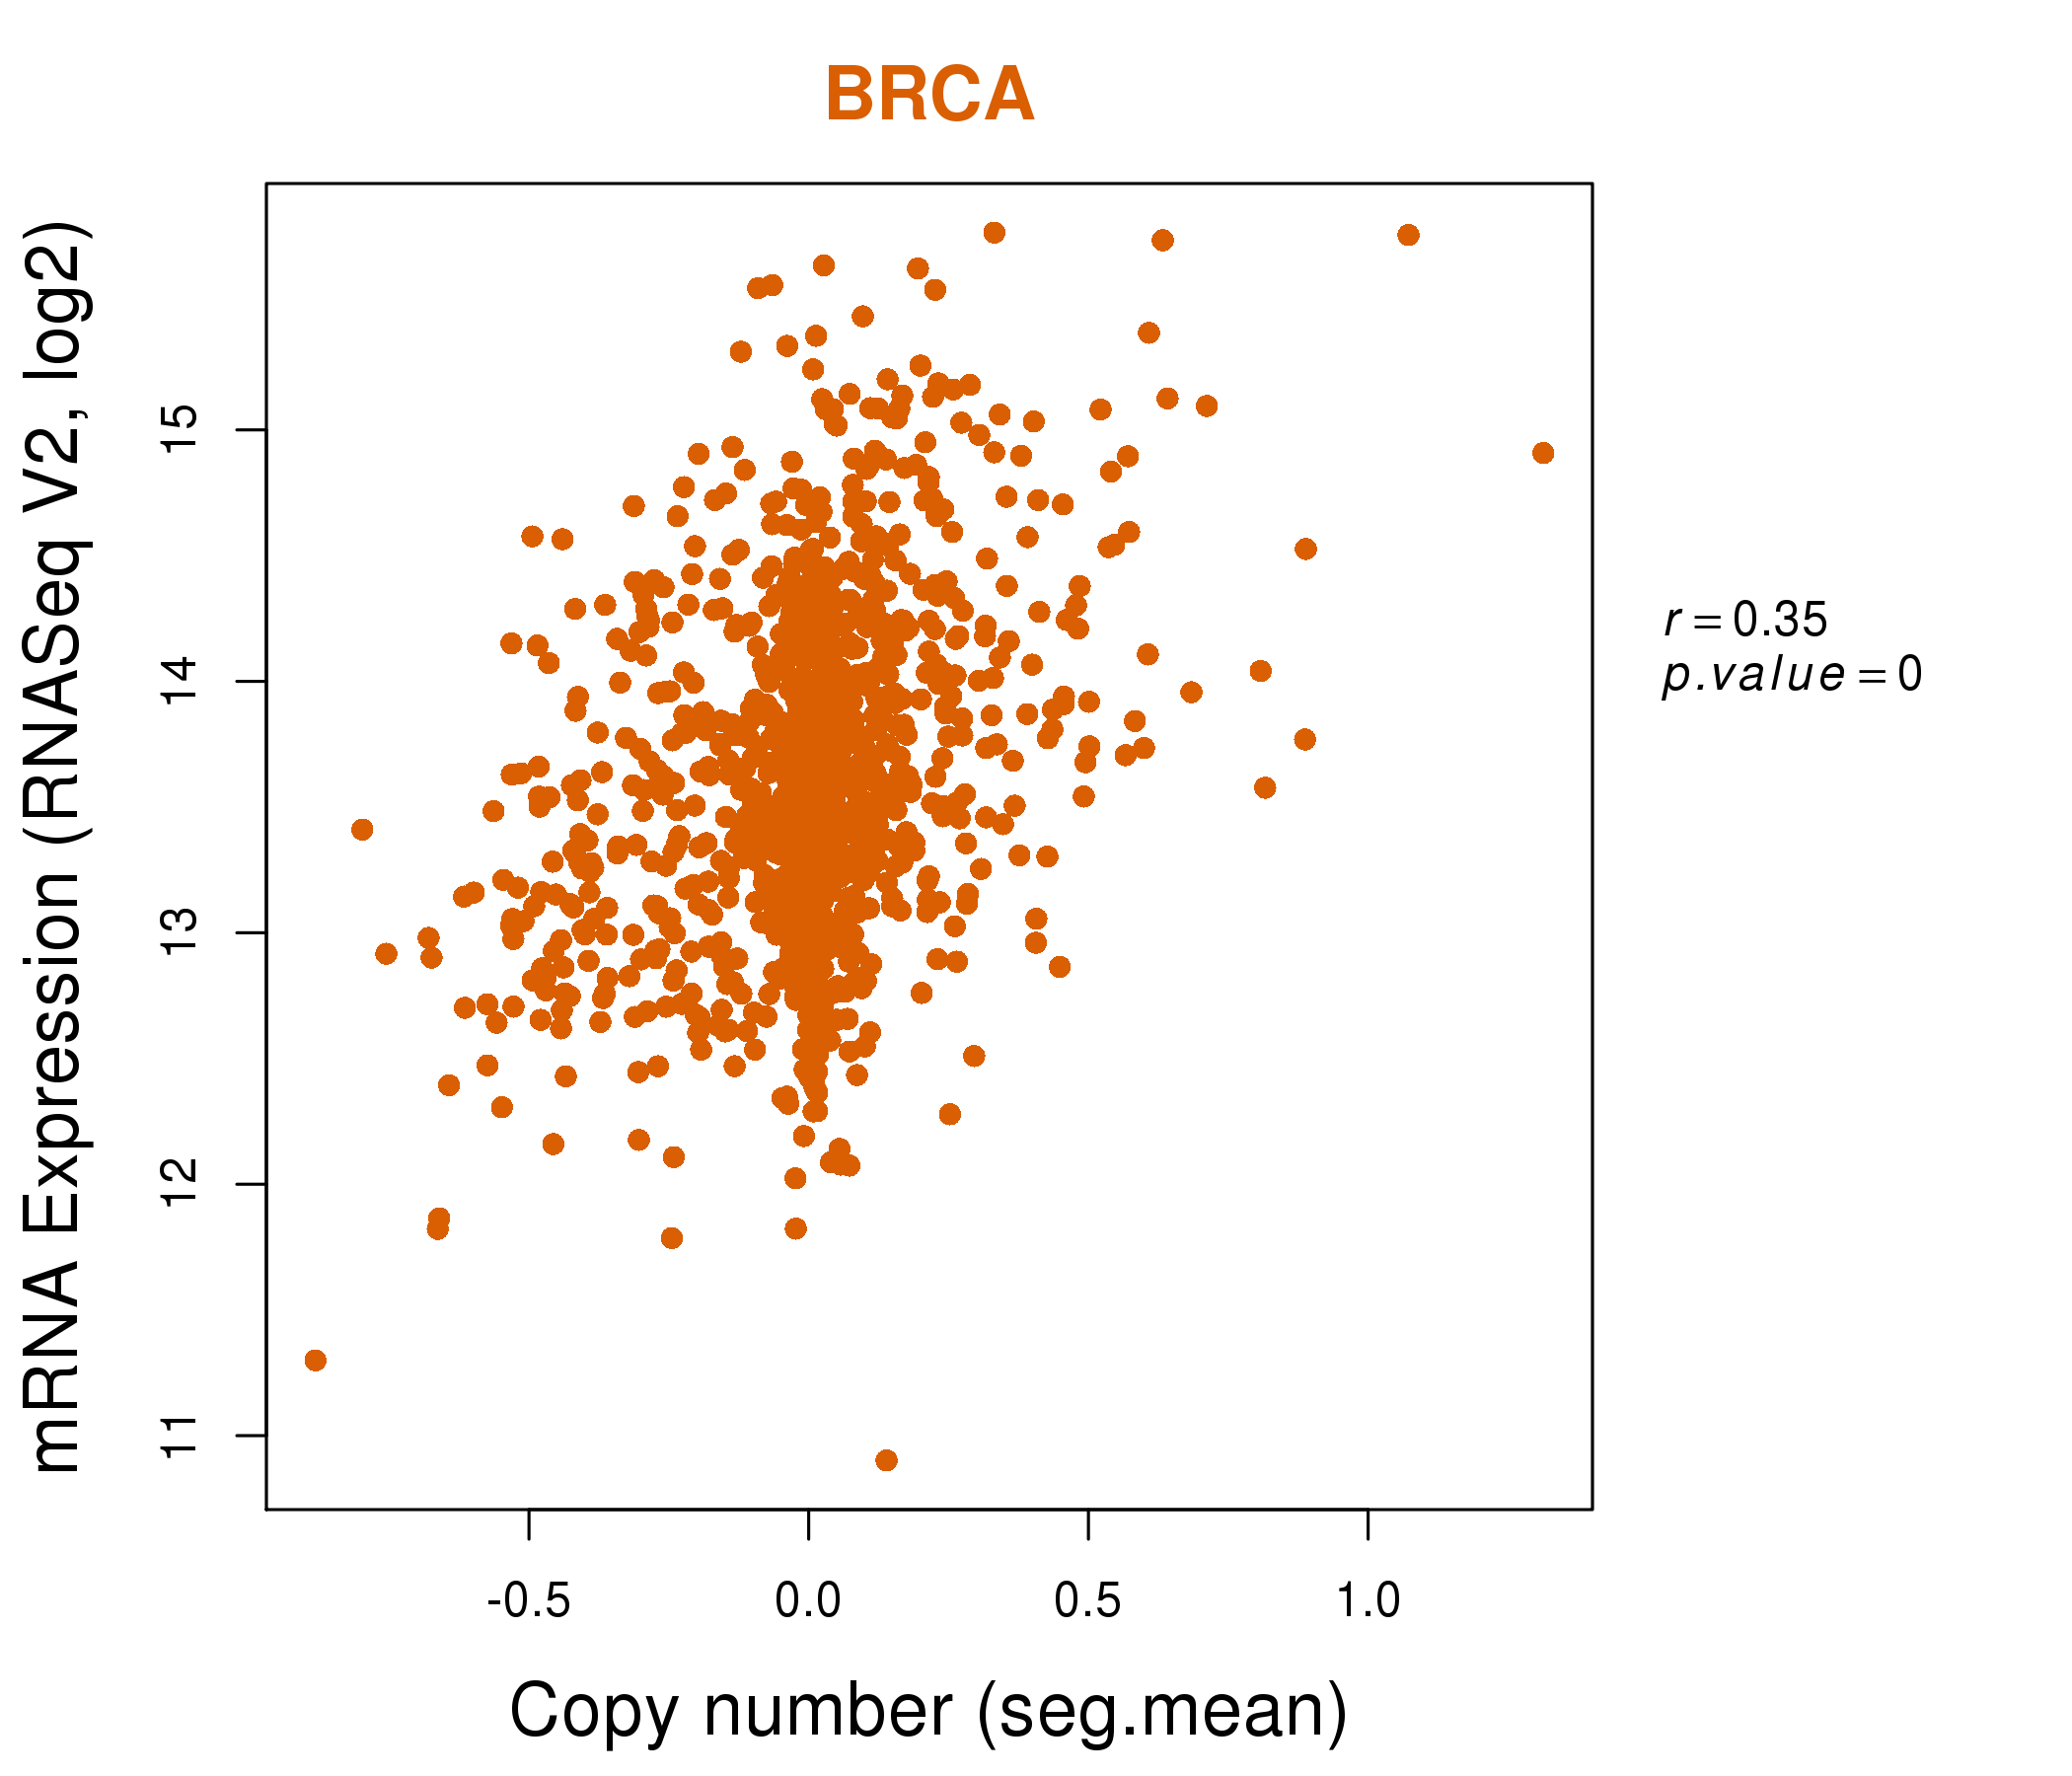
| * This plots show the correlation between CNV and gene expression. |
: Open all plots for all cancer types
 |
|
 |
|

| Top |
| Gene-Gene Network Information |
| * Co-Expression network figures were drawn using R package igraph. Only the top 20 genes with the highest correlations were shown. Red circle: input gene, orange circle: cell metabolism gene, sky circle: other gene |
: Open all plots for all cancer types
 |
| ||||
| AFAP1L1,ARHGAP31,EOGT,AGPAT4-IT1,CAV2,CCDC82,CLIC4, CPNE8,EHBP1,FAM126A,FERMT2,FNDC3B,LATS2,LDHAL6B, LOC400927,MAML2,MYO1E,PLEKHG1,QKI,RBMS1,TMEM43 | ABHD13,ABL2,AHR,TMEM263,CTTNBP2NL,FAM91A1,GNAI3, GNB4,HIAT1,KRAS,LDHAL6B,MAPK1IP1L,NCOA7,PAQR3, PIGA,RIPK2,SERPINB8,SGMS2,SLC25A32,ZNF207,ZBTB21 | ||||
 |
| ||||
| AKAP13,ARL14,ELMSAN1,MIR22HG,DENND3,DOCK5,EHBP1L1, FRMD4B,JOSD1,KDM6B,LDHAL6B,MNT,MXD1,MYO1E, NBEAL1,NEAT1,PTPRH,RREB1,TET2,TLN2,ZZEF1 | AKAP8,BCL3,CFAP45,DGCR11,EPHA2,GADD45A,HRH1, LDHAL6B,LDLR,MAP2K3,MCL1,NRG1,NABP1,SENP2, SKIL,SLC25A44,SLC25A45,TRIM51,TCTE1,TNFRSF12A,ZNF800 |

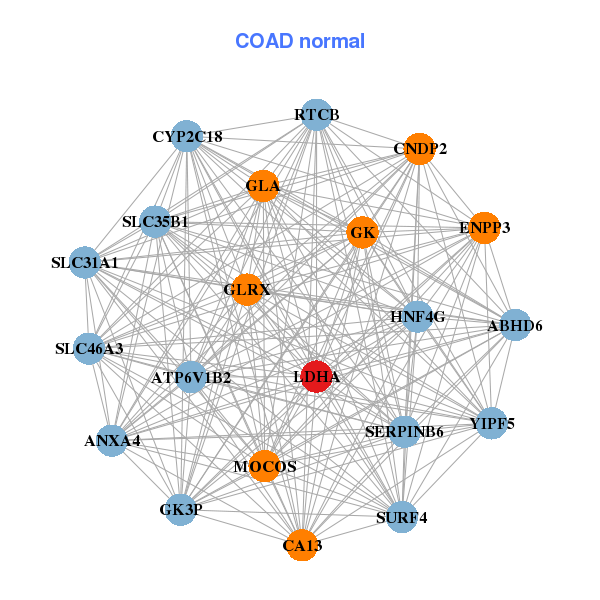
| * Co-Expression network figures were drawn using R package igraph. Only the top 20 genes with the highest correlations were shown. Red circle: input gene, orange circle: cell metabolism gene, sky circle: other gene |
: Open all plots for all cancer types
| Top |
: Open all interacting genes' information including KEGG pathway for all interacting genes from DAVID
| Top |
| Pharmacological Information for LDHA |
| DB Category | DB Name | DB's ID and Url link |
| Chemistry | BindingDB | P00338; -. |
| Chemistry | ChEMBL | CHEMBL4835; -. |
| Chemistry | BindingDB | P00338; -. |
| Chemistry | ChEMBL | CHEMBL4835; -. |
| Organism-specific databases | PharmGKB | PA30319; -. |
| Organism-specific databases | PharmGKB | PA30319; -. |
| Organism-specific databases | CTD | 3939; -. |
| Organism-specific databases | CTD | 3939; -. |
| * Gene Centered Interaction Network. |
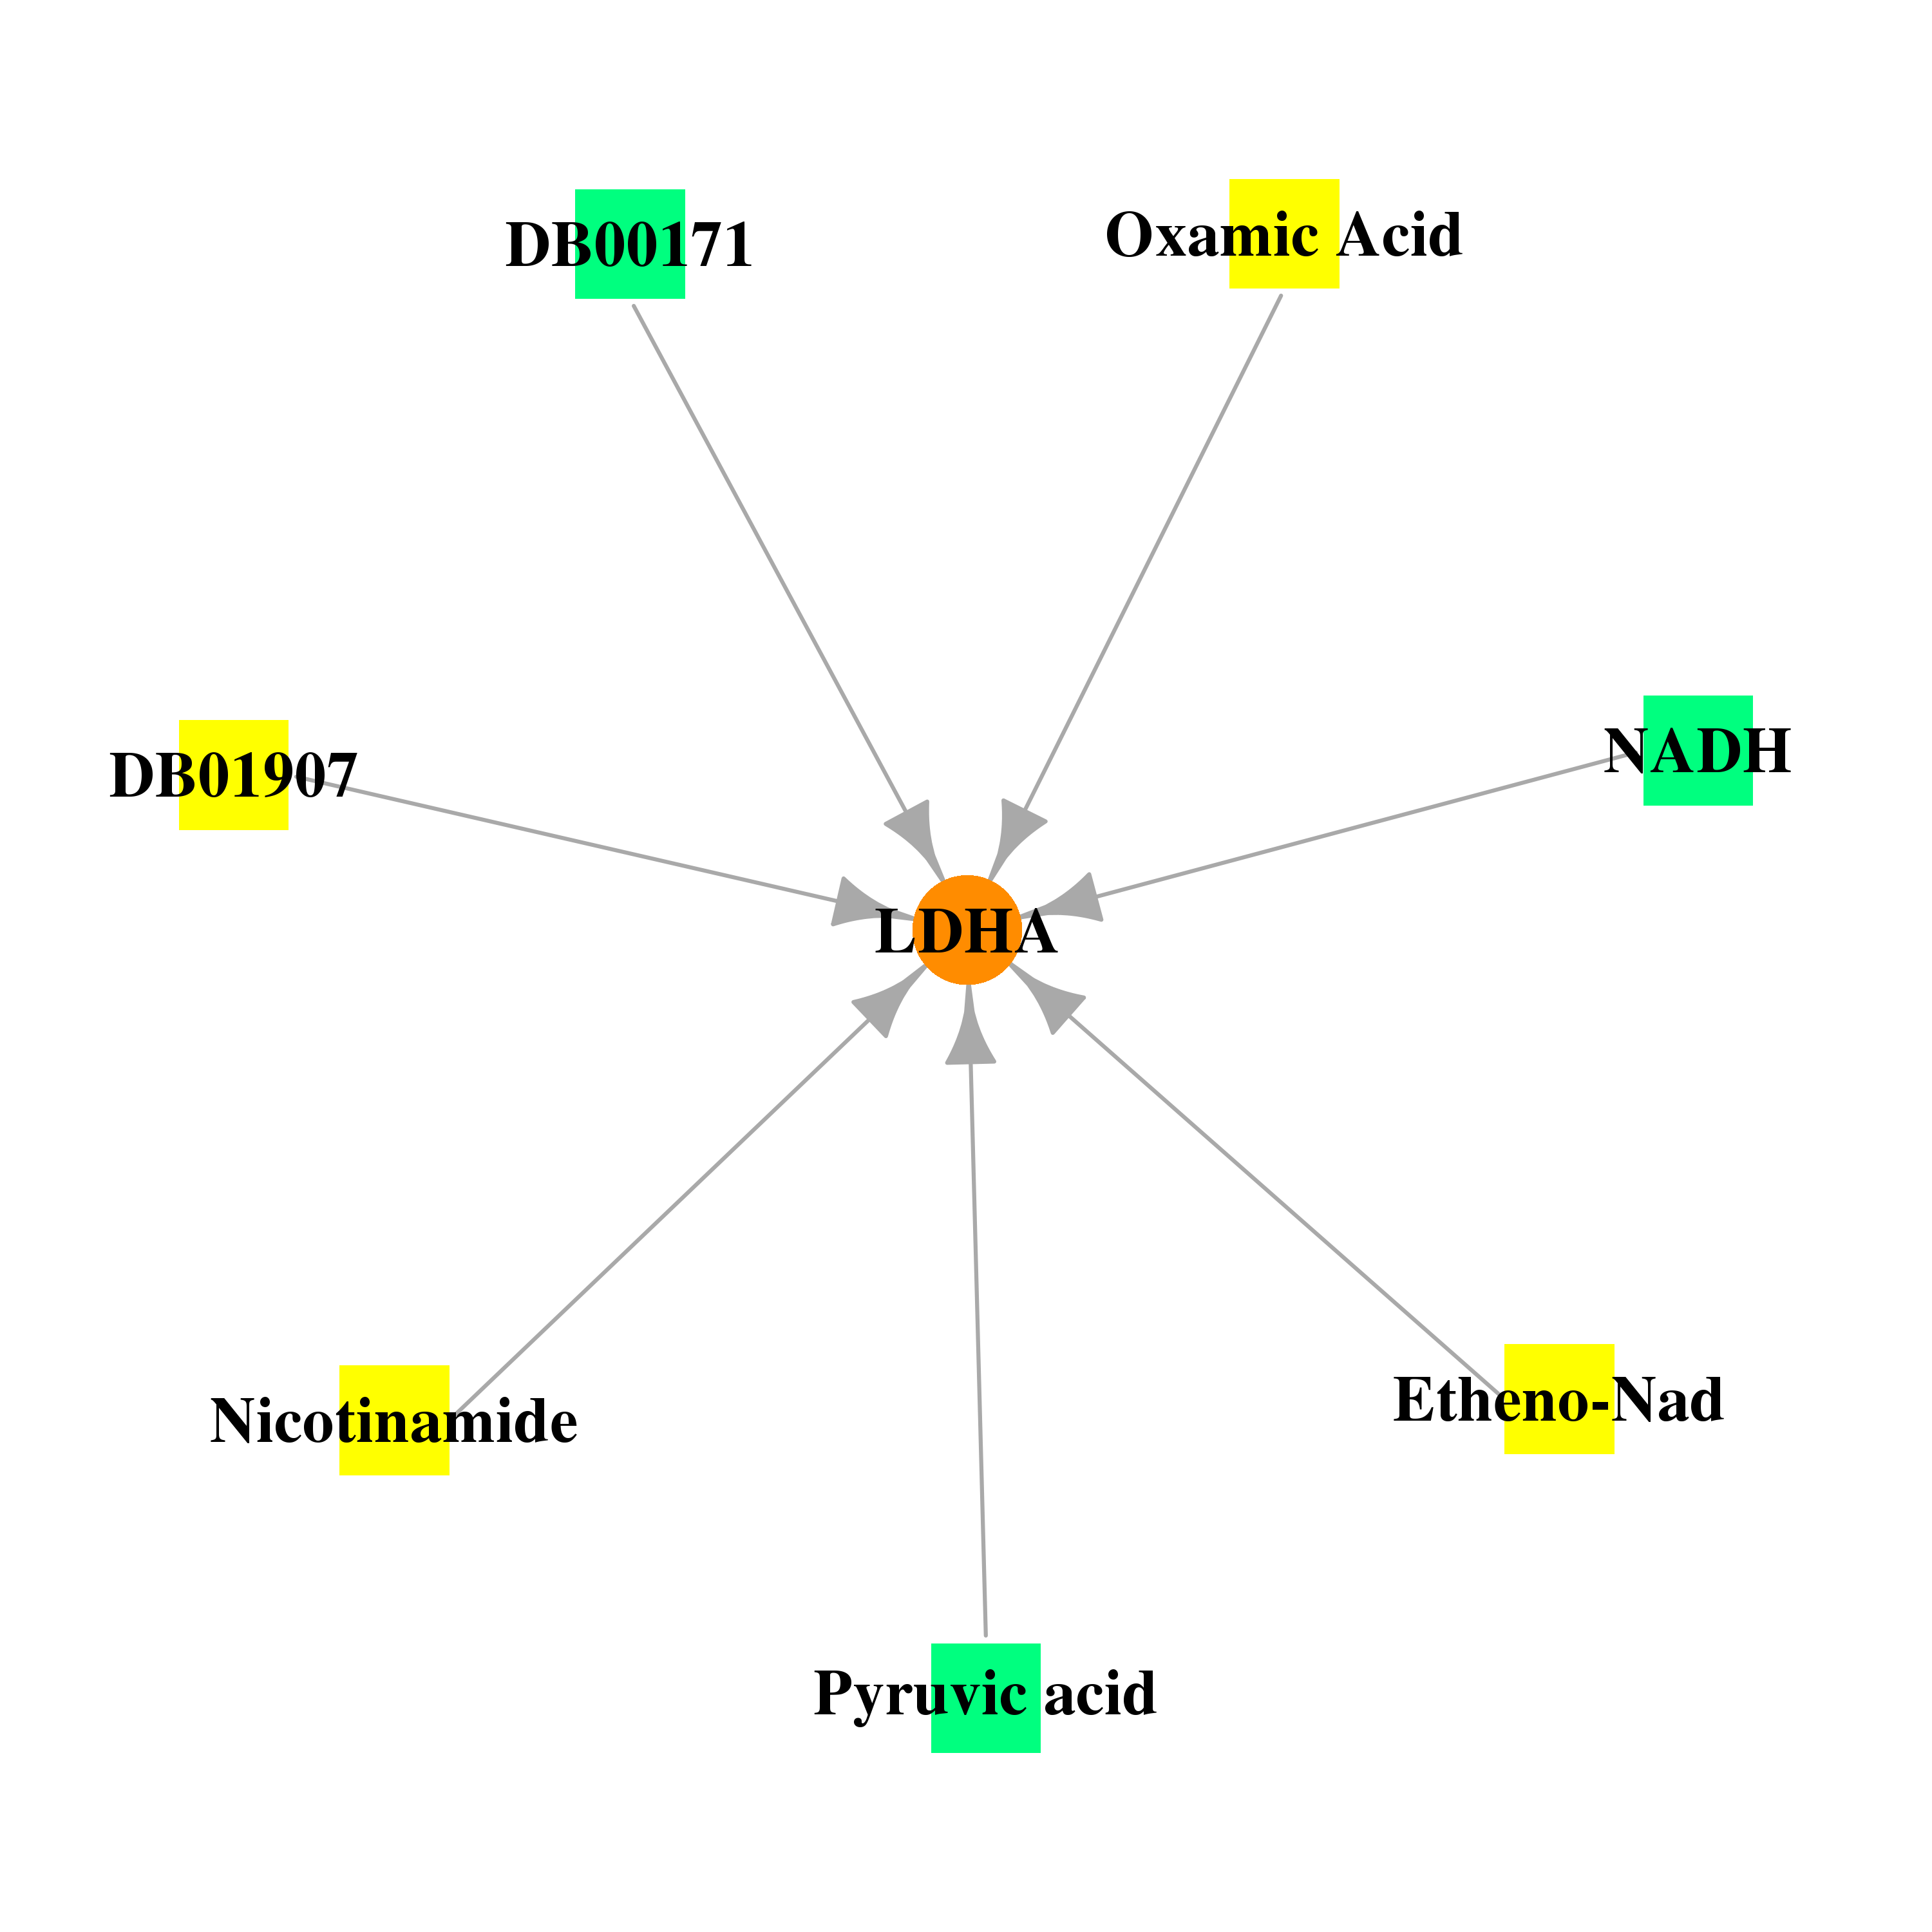 |
| * Drug Centered Interaction Network. |
| DrugBank ID | Target Name | Drug Groups | Generic Name | Drug Centered Network | Drug Structure |
| DB00157 | lactate dehydrogenase A | approved; nutraceutical | NADH |  |  |
| DB01907 | lactate dehydrogenase A | experimental | Nicotinamide-Adenine-Dinucleotide | 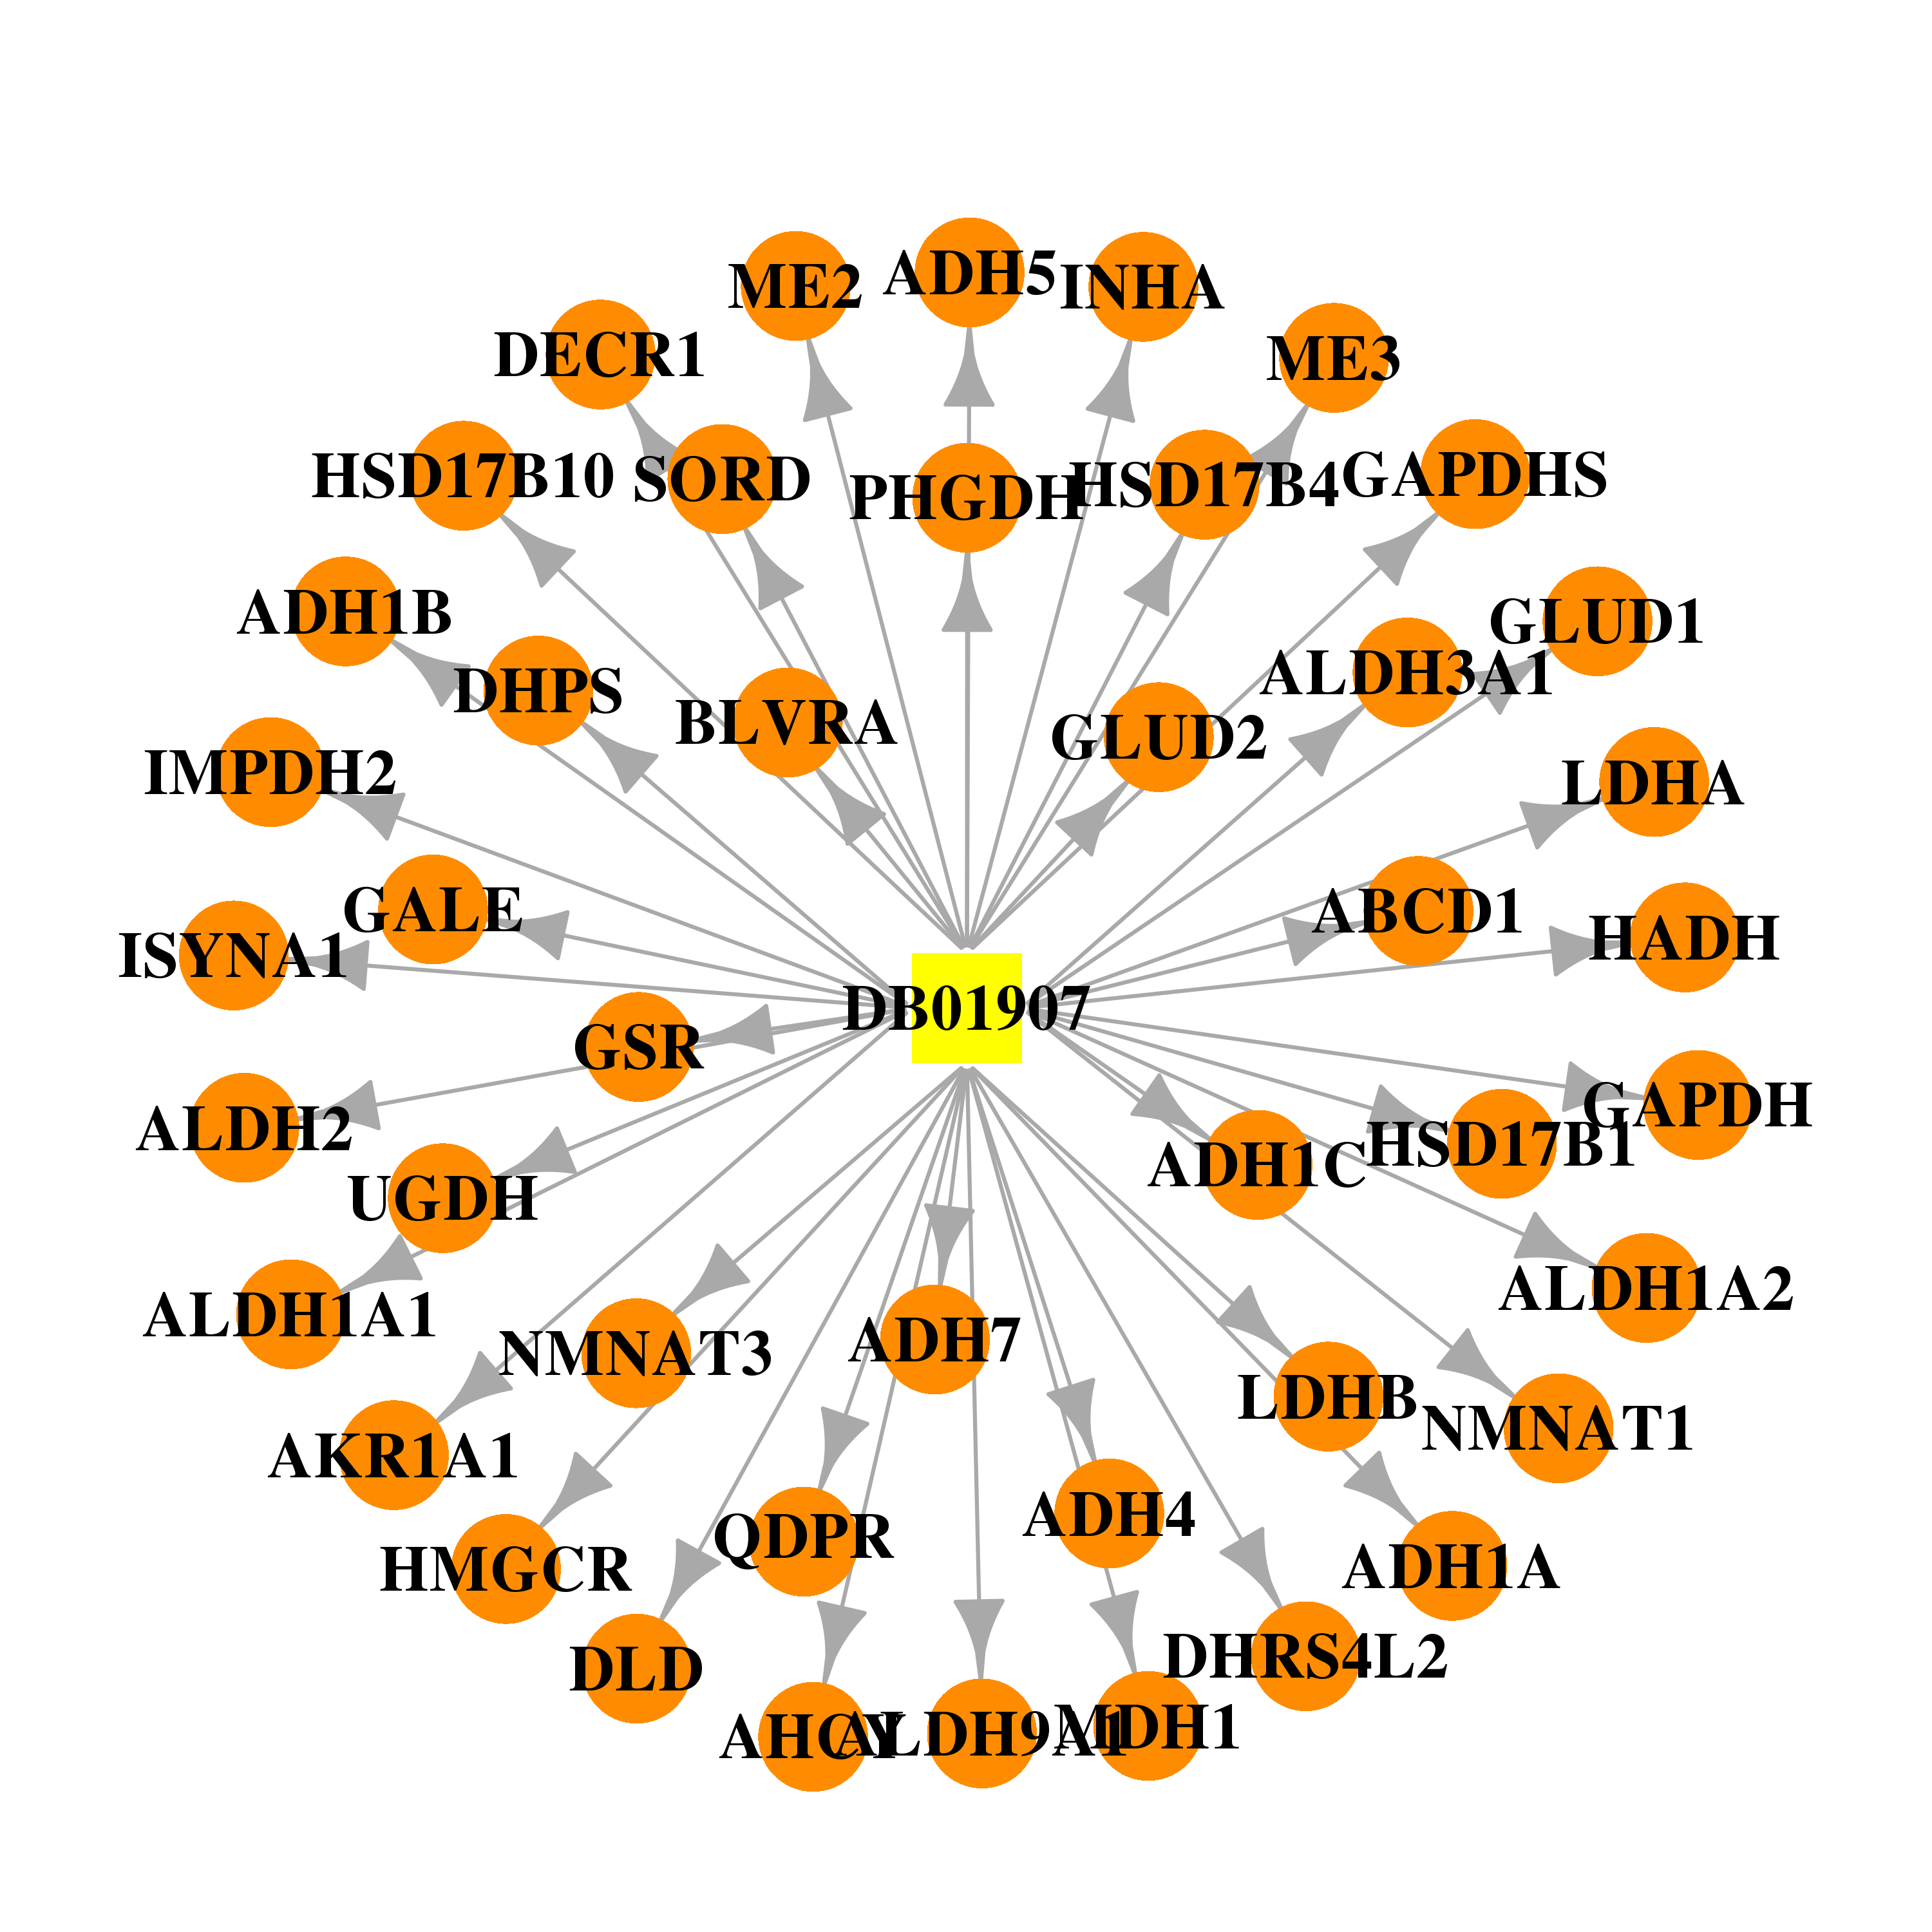 |  |
| DB02483 | lactate dehydrogenase A | experimental | Etheno-Nad | 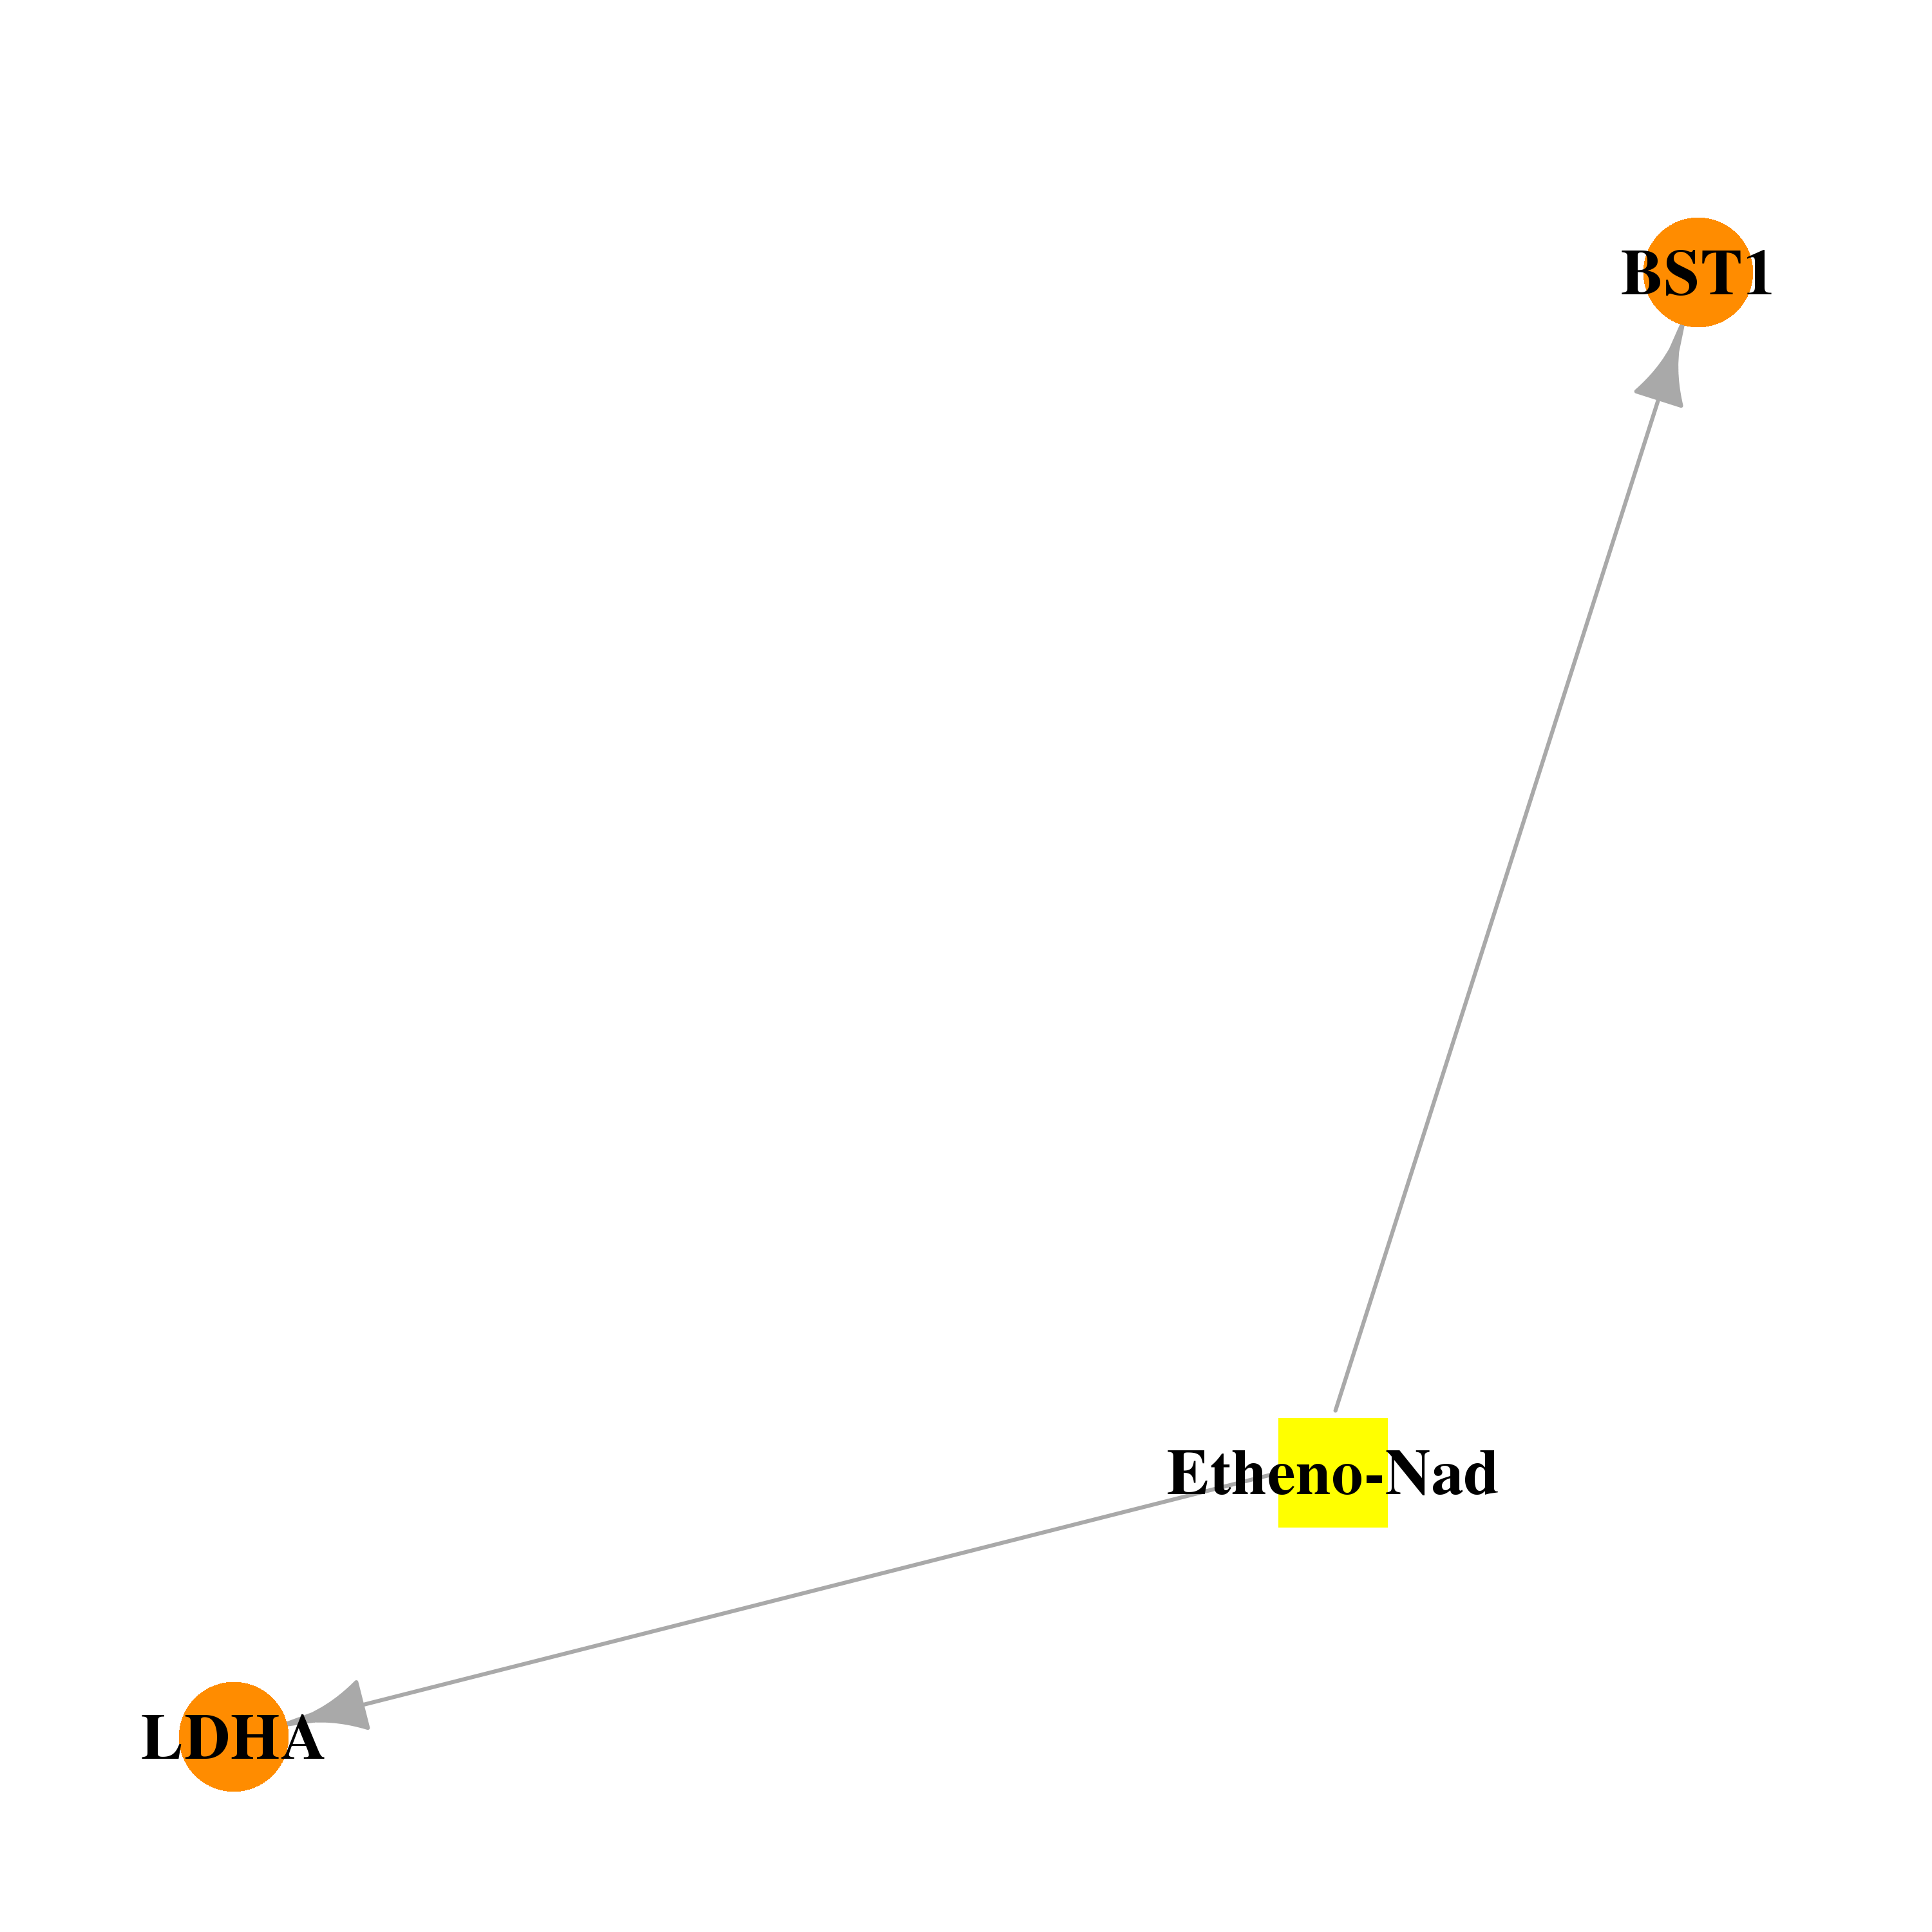 |  |
| DB02701 | lactate dehydrogenase A | experimental | Nicotinamide |  |  |
| DB03940 | lactate dehydrogenase A | experimental | Oxamic Acid | 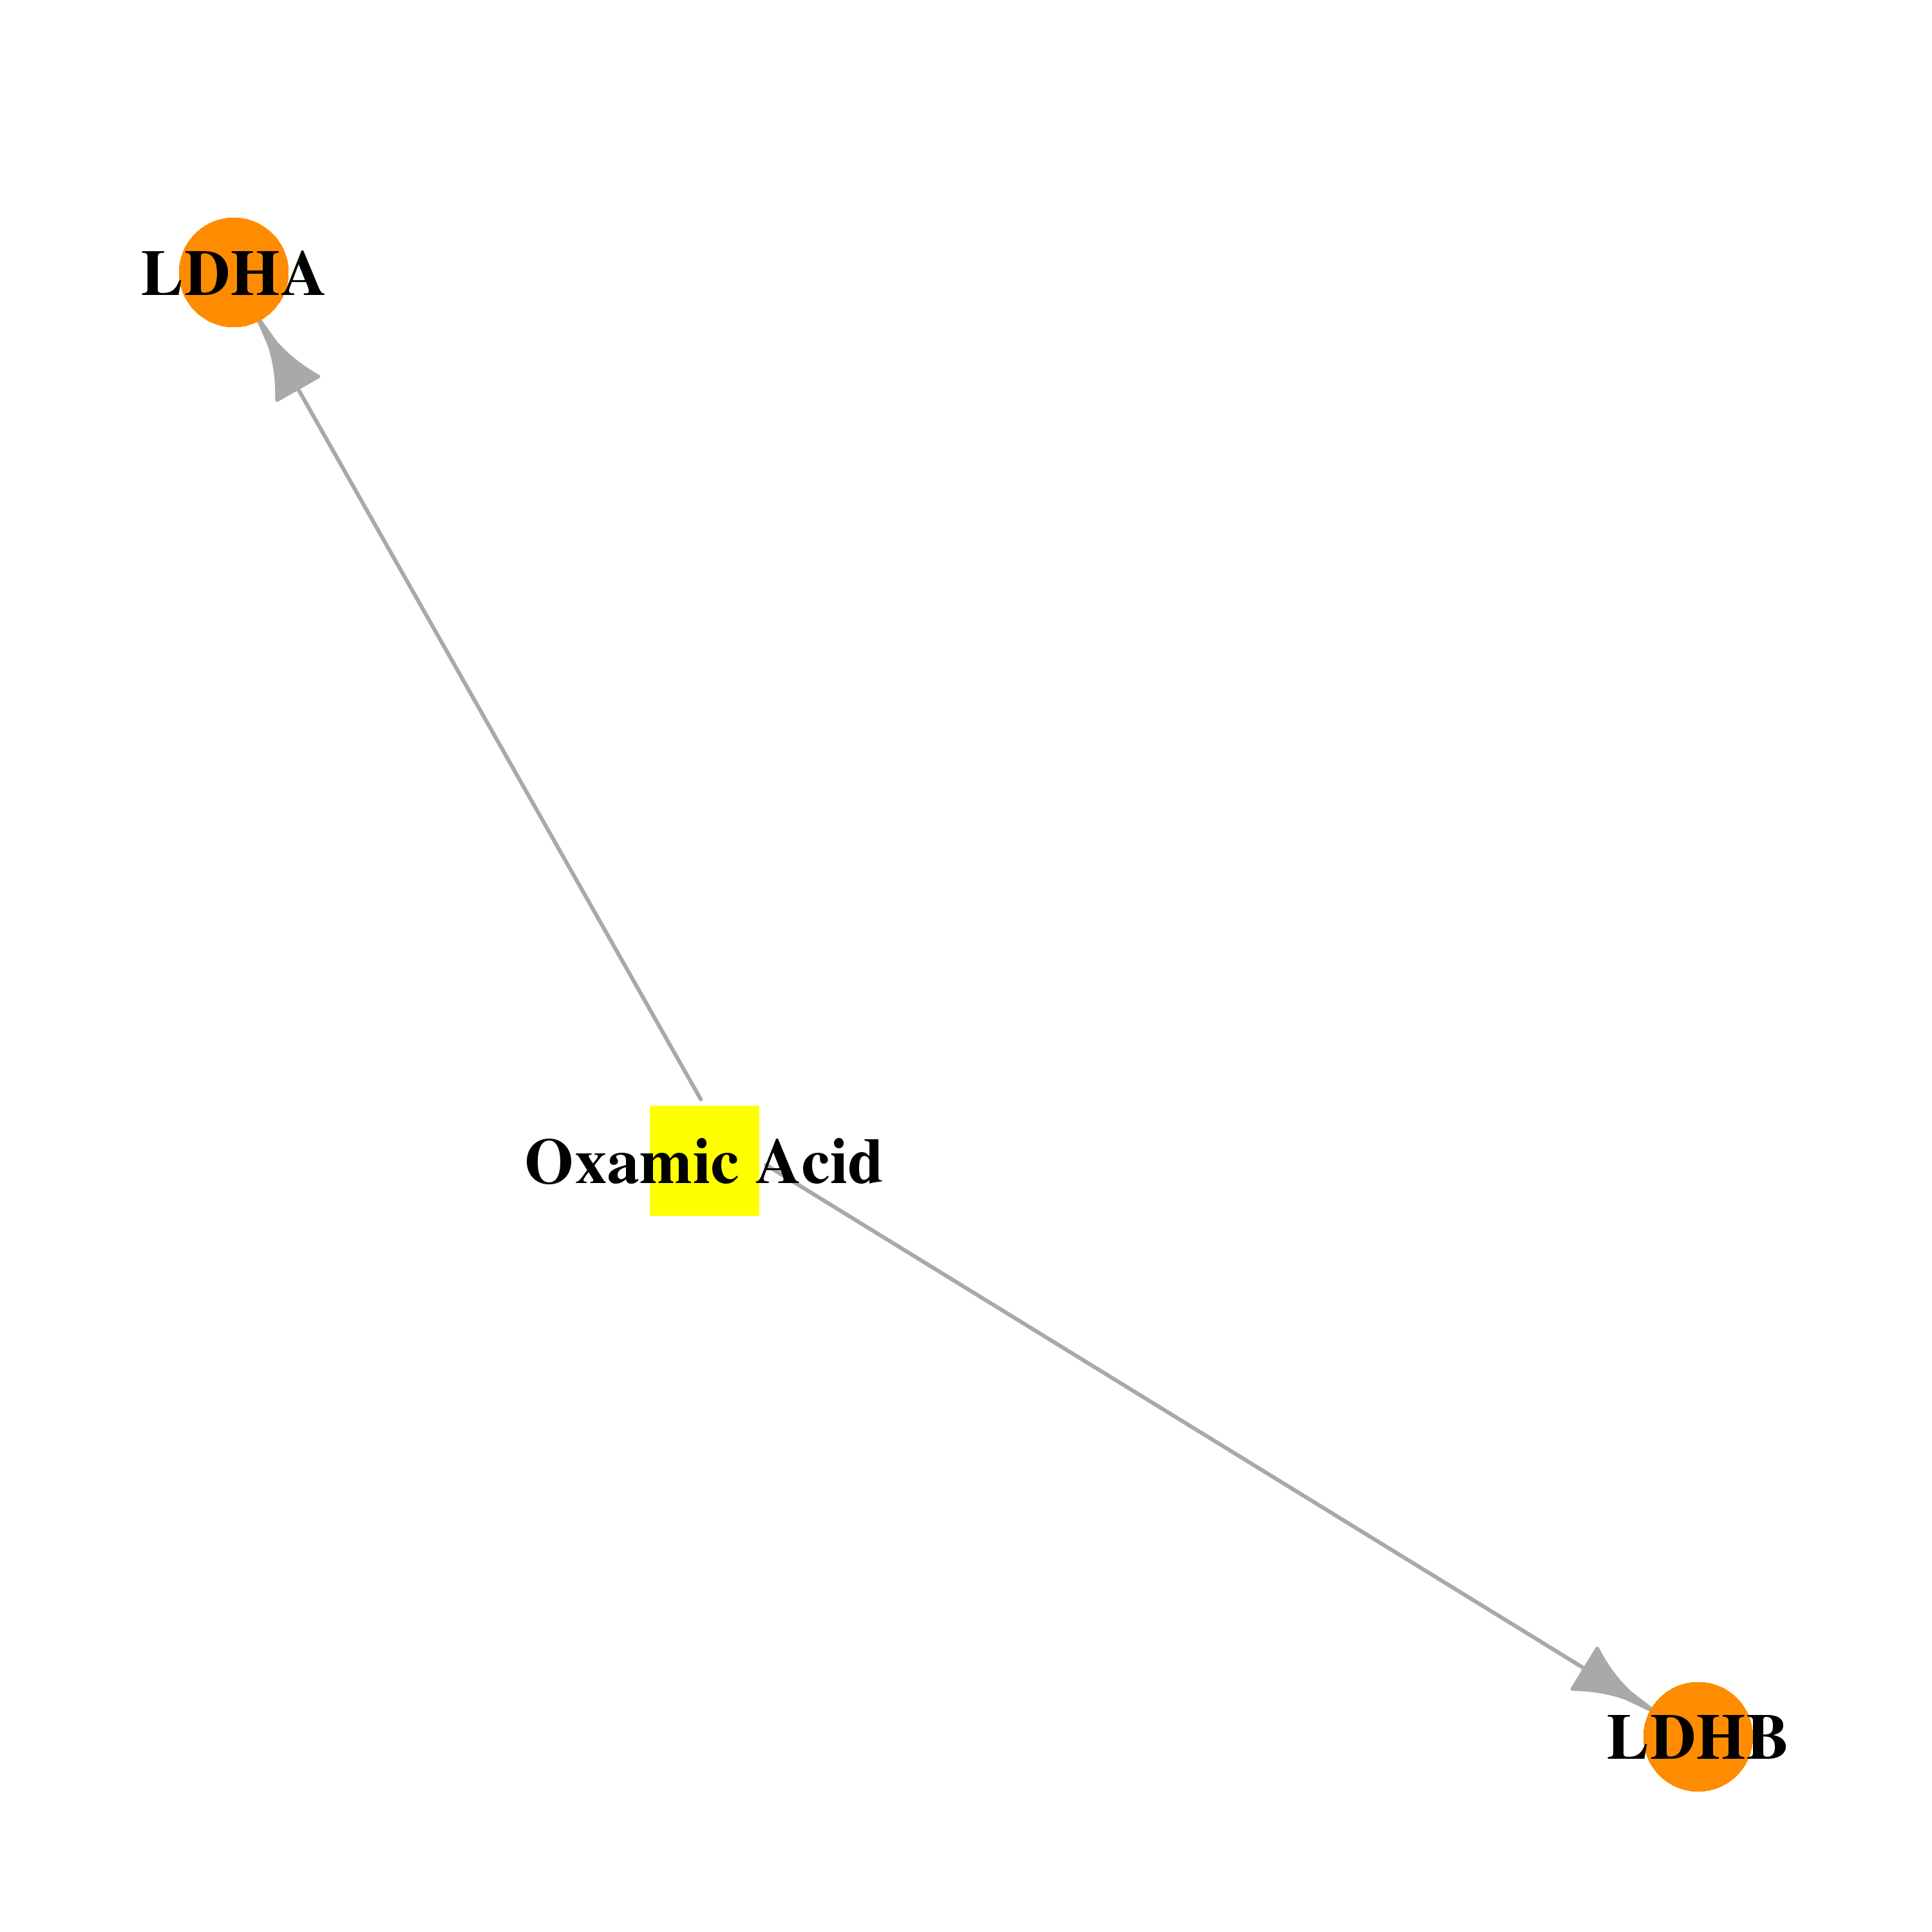 |  |
| DB00171 | lactate dehydrogenase A | approved; nutraceutical | Adenosine triphosphate |  |  |
| DB00119 | lactate dehydrogenase A | approved; nutraceutical | Pyruvic acid | 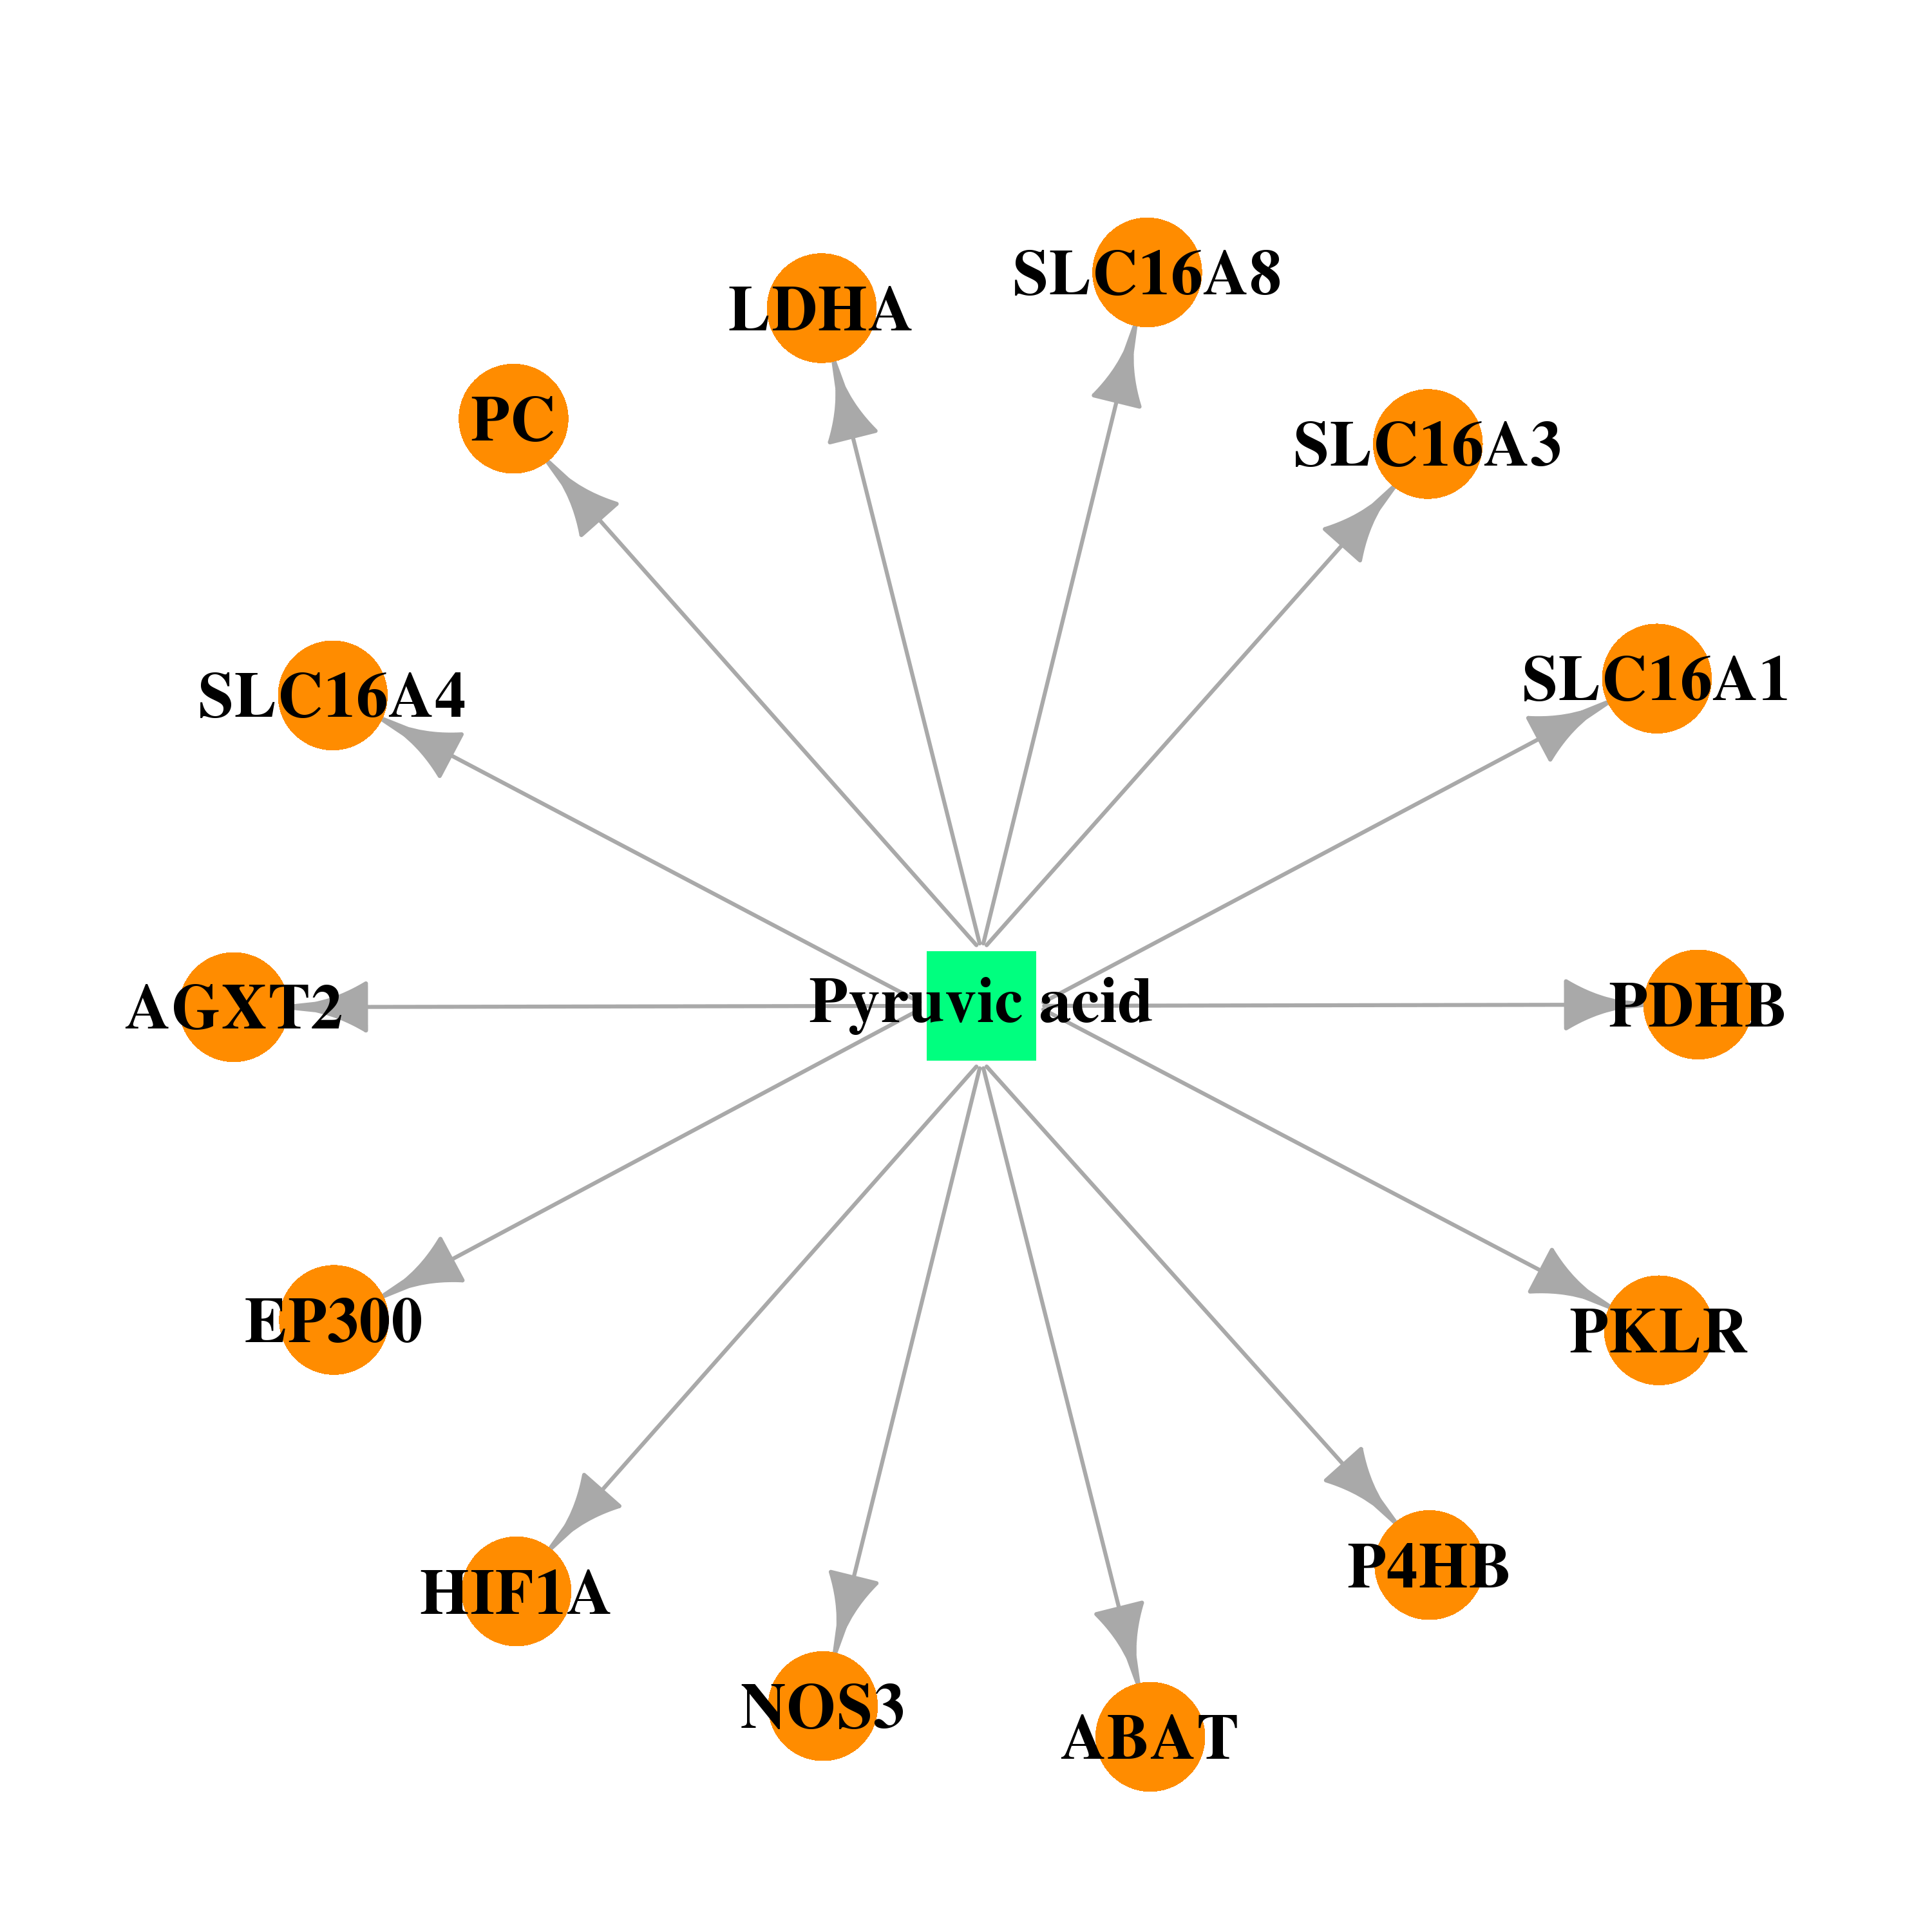 |  |
| Top |
| Cross referenced IDs for LDHA |
| * We obtained these cross-references from Uniprot database. It covers 150 different DBs, 18 categories. http://www.uniprot.org/help/cross_references_section |
: Open all cross reference information
|
Copyright © 2016-Present - The Univsersity of Texas Health Science Center at Houston @ |