|
||||||||||||||||||||||||||||||||||||||||||||||||||||||||||||||||||||||||||||||||||||||||||||||||||||||||||||||||||||||||||||||||||||||||||||||||||||||||||||||||||||||||||||||||||||||||||||||||||||||||||||||||||||||||||||||||||||||||||||||||||||||||||||||||||||||||||||||||||||||||||||||||||||||||||||||||||||||||||
| |
| Phenotypic Information (metabolism pathway, cancer, disease, phenome) |
| |
| |
| Gene-Gene Network Information: Co-Expression Network, Interacting Genes & KEGG |
| |
|


| Gene Summary for ARNTL |
| Basic gene info. | Gene symbol | ARNTL |
| Gene name | aryl hydrocarbon receptor nuclear translocator-like | |
| Synonyms | BMAL1|BMAL1c|JAP3|MOP3|PASD3|TIC|bHLHe5 | |
| Cytomap | UCSC genome browser: 11p15 | |
| Genomic location | chr11 :13299324-13408812 | |
| Type of gene | protein-coding | |
| RefGenes | NM_001030272.2, NM_001030273.2,NM_001178.5,NM_001297719.1,NM_001297722.1, NM_001297724.1, | |
| Ensembl id | ENSG00000133794 | |
| Description | ARNT-like protein 1, brain and musclePAS domain-containing protein 3aryl hydrocarbon receptor nuclear translocator-like protein 1bHLH-PAS protein JAP3basic-helix-loop-helix-PAS orphan MOP3basic-helix-loop-helix-PAS protein MOP3brain and muscle ARNT- | |
| Modification date | 20141207 | |
| dbXrefs | MIM : 602550 | |
| HGNC : HGNC | ||
| Ensembl : ENSG00000133794 | ||
| HPRD : 03973 | ||
| Vega : OTTHUMG00000150623 | ||
| Protein | UniProt: O00327 go to UniProt's Cross Reference DB Table | |
| Expression | CleanEX: HS_ARNTL | |
| BioGPS: 406 | ||
| Gene Expression Atlas: ENSG00000133794 | ||
| The Human Protein Atlas: ENSG00000133794 | ||
| Pathway | NCI Pathway Interaction Database: ARNTL | |
| KEGG: ARNTL | ||
| REACTOME: ARNTL | ||
| ConsensusPathDB | ||
| Pathway Commons: ARNTL | ||
| Metabolism | MetaCyc: ARNTL | |
| HUMANCyc: ARNTL | ||
| Regulation | Ensembl's Regulation: ENSG00000133794 | |
| miRBase: chr11 :13,299,324-13,408,812 | ||
| TargetScan: NM_001030272 | ||
| cisRED: ENSG00000133794 | ||
| Context | iHOP: ARNTL | |
| cancer metabolism search in PubMed: ARNTL | ||
| UCL Cancer Institute: ARNTL | ||
| Assigned class in ccmGDB | B - This gene belongs to cancer gene. | |
| Top |
| Phenotypic Information for ARNTL(metabolism pathway, cancer, disease, phenome) |
| Cancer | CGAP: ARNTL |
| Familial Cancer Database: ARNTL | |
| * This gene is included in those cancer gene databases. |
|
|
|
|
|
| . | ||||||||||||||||||||||||||||||||||||||||||||||||||||||||||||||||||||||||||||||||||||||||||||||||||||||||||||||||||||||||||||||||||||||||||||||||||||||||||||||||||||||||||||||||||||||||||||||||||||||||||||||||||||||||||||||||||||||||||||||||||||||||||||||||||||||||||||||||||||||||||||||||||||||||||||||||||||
Oncogene 1 | Significant driver gene in | |||||||||||||||||||||||||||||||||||||||||||||||||||||||||||||||||||||||||||||||||||||||||||||||||||||||||||||||||||||||||||||||||||||||||||||||||||||||||||||||||||||||||||||||||||||||||||||||||||||||||||||||||||||||||||||||||||||||||||||||||||||||||||||||||||||||||||||||||||||||||||||||||||||||||||||||||||||||||
| cf) number; DB name 1 Oncogene; http://nar.oxfordjournals.org/content/35/suppl_1/D721.long, 2 Tumor Suppressor gene; https://bioinfo.uth.edu/TSGene/, 3 Cancer Gene Census; http://www.nature.com/nrc/journal/v4/n3/abs/nrc1299.html, 4 CancerGenes; http://nar.oxfordjournals.org/content/35/suppl_1/D721.long, 5 Network of Cancer Gene; http://ncg.kcl.ac.uk/index.php, 1Therapeutic Vulnerabilities in Cancer; http://cbio.mskcc.org/cancergenomics/statius/ |
| REACTOME_METABOLISM_OF_LIPIDS_AND_LIPOPROTEINS | |
| OMIM | 602550; gene. 602550; gene. |
| Orphanet | |
| Disease | KEGG Disease: ARNTL |
| MedGen: ARNTL (Human Medical Genetics with Condition) | |
| ClinVar: ARNTL | |
| Phenotype | MGI: ARNTL (International Mouse Phenotyping Consortium) |
| PhenomicDB: ARNTL | |
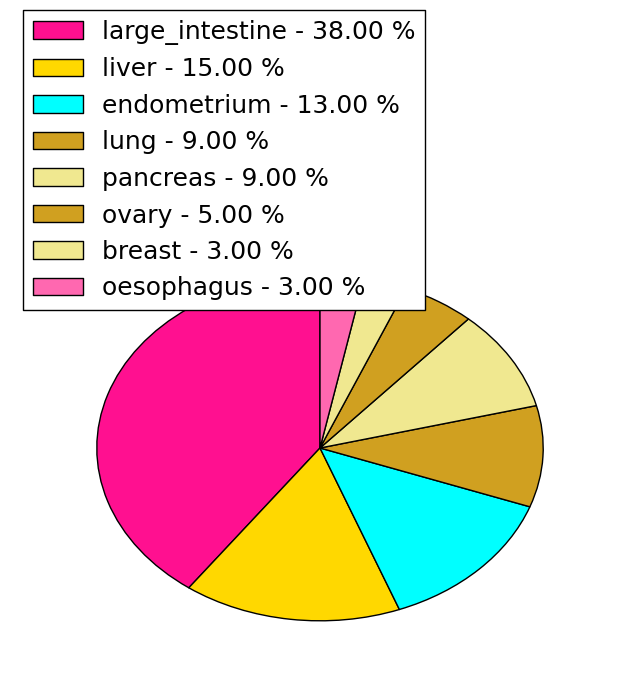
| Mutations for ARNTL |
| * Under tables are showing count per each tissue to give us broad intuition about tissue specific mutation patterns.You can go to the detailed page for each mutation database's web site. |
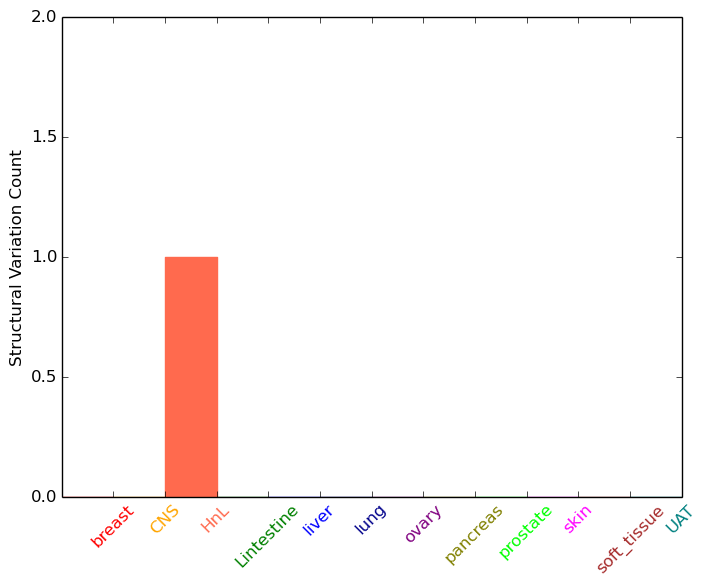
| - Statistics for Tissue and Mutation type | Top |
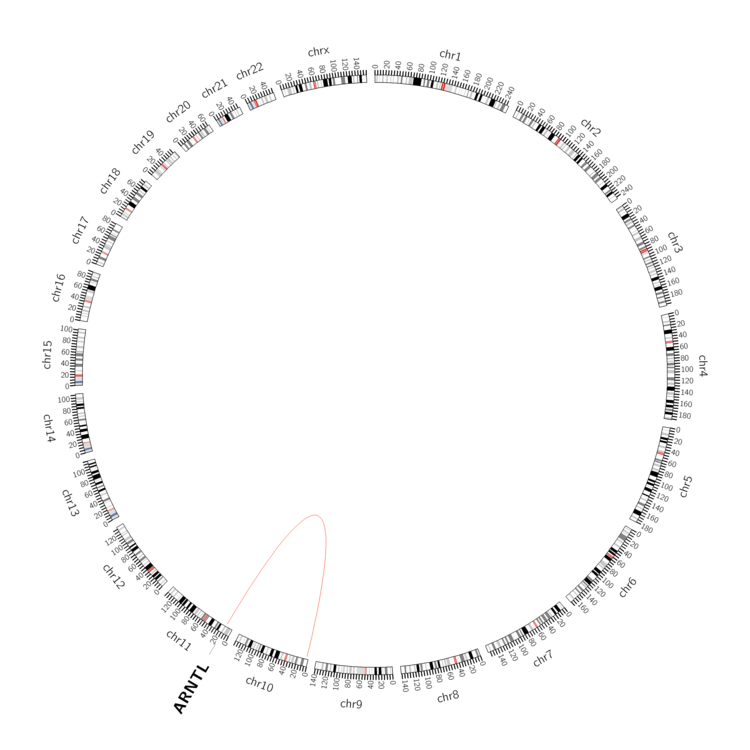 |
| - For Inter-chromosomal Variations |
| * Inter-chromosomal variantions includes 'interchromosomal amplicon to amplicon', 'interchromosomal amplicon to non-amplified dna', 'interchromosomal insertion', 'Interchromosomal unknown type'. |
 |
| - For Intra-chromosomal Variations |
| There's no intra-chromosomal structural variation. |
| Sample | Symbol_a | Chr_a | Start_a | End_a | Symbol_b | Chr_b | Start_b | End_b |
| cf) Tissue number; Tissue name (1;Breast, 2;Central_nervous_system, 3;Haematopoietic_and_lymphoid_tissue, 4;Large_intestine, 5;Liver, 6;Lung, 7;Ovary, 8;Pancreas, 9;Prostate, 10;Skin, 11;Soft_tissue, 12;Upper_aerodigestive_tract) |
| * From mRNA Sanger sequences, Chitars2.0 arranged chimeric transcripts. This table shows ARNTL related fusion information. |
| ID | Head Gene | Tail Gene | Accession | Gene_a | qStart_a | qEnd_a | Chromosome_a | tStart_a | tEnd_a | Gene_a | qStart_a | qEnd_a | Chromosome_a | tStart_a | tEnd_a |
| DB346797 | AGXT2L2 | 1 | 481 | 5 | 177647769 | 177648249 | ARNTL | 476 | 534 | 11 | 13363241 | 13363299 | |
| BU615448 | ARNTL | 14 | 357 | 11 | 13406350 | 13406694 | ARNTL | 342 | 570 | 11 | 13406875 | 13407103 | |
| CA310696 | ARNTL | 16 | 317 | 11 | 13408512 | 13408813 | ARNTL | 313 | 489 | 11 | 13408336 | 13408512 | |
| Top |
| Mutation type/ Tissue ID | brca | cns | cerv | endome | haematopo | kidn | Lintest | liver | lung | ns | ovary | pancre | prost | skin | stoma | thyro | urina | |||
| Total # sample | 2 | 3 | 3 | 1 | 1 | |||||||||||||||
| GAIN (# sample) | 1 | 3 | ||||||||||||||||||
| LOSS (# sample) | 1 | 3 | 1 | 1 |
| cf) Tissue ID; Tissue type (1; Breast, 2; Central_nervous_system, 3; Cervix, 4; Endometrium, 5; Haematopoietic_and_lymphoid_tissue, 6; Kidney, 7; Large_intestine, 8; Liver, 9; Lung, 10; NS, 11; Ovary, 12; Pancreas, 13; Prostate, 14; Skin, 15; Stomach, 16; Thyroid, 17; Urinary_tract) |
| Top |
|
 |
| Top |
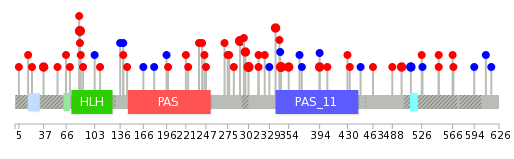
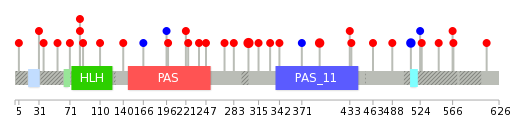
| Stat. for Non-Synonymous SNVs (# total SNVs=52) | (# total SNVs=11) |
 |  |
(# total SNVs=0) | (# total SNVs=0) |
| Top |
| * When you move the cursor on each content, you can see more deailed mutation information on the Tooltip. Those are primary_site,primary_histology,mutation(aa),pubmedID. |
| GRCh37 position | Mutation(aa) | Unique sampleID count |
| chr11:13380010-13380010 | p.R84H | 3 |
| chr11:13393763-13393763 | p.P291T | 3 |
| chr11:13393922-13393922 | p.A344T | 3 |
| chr11:13393796-13393796 | p.E302K | 3 |
| chr11:13381976-13381976 | p.? | 2 |
| chr11:13399971-13399971 | p.E500A | 2 |
| chr11:13375965-13375965 | p.R37H | 2 |
| chr11:13397168-13397168 | p.T394M | 2 |
| chr11:13402723-13402723 | p.S512S | 2 |
| chr11:13393901-13393901 | p.M337V | 2 |
| Top |
|
 |
| Point Mutation/ Tissue ID | 1 | 2 | 3 | 4 | 5 | 6 | 7 | 8 | 9 | 10 | 11 | 12 | 13 | 14 | 15 | 16 | 17 | 18 | 19 | 20 |
| # sample | 1 | 10 | 1 | 2 | 1 | 2 | 1 | 3 | 9 | 6 | ||||||||||
| # mutation | 1 | 11 | 1 | 2 | 2 | 2 | 1 | 3 | 8 | 6 | ||||||||||
| nonsynonymous SNV | 1 | 11 | 1 | 1 | 1 | 2 | 1 | 3 | 6 | 5 | ||||||||||
| synonymous SNV | 1 | 1 | 2 | 1 |
| cf) Tissue ID; Tissue type (1; BLCA[Bladder Urothelial Carcinoma], 2; BRCA[Breast invasive carcinoma], 3; CESC[Cervical squamous cell carcinoma and endocervical adenocarcinoma], 4; COAD[Colon adenocarcinoma], 5; GBM[Glioblastoma multiforme], 6; Glioma Low Grade, 7; HNSC[Head and Neck squamous cell carcinoma], 8; KICH[Kidney Chromophobe], 9; KIRC[Kidney renal clear cell carcinoma], 10; KIRP[Kidney renal papillary cell carcinoma], 11; LAML[Acute Myeloid Leukemia], 12; LUAD[Lung adenocarcinoma], 13; LUSC[Lung squamous cell carcinoma], 14; OV[Ovarian serous cystadenocarcinoma ], 15; PAAD[Pancreatic adenocarcinoma], 16; PRAD[Prostate adenocarcinoma], 17; SKCM[Skin Cutaneous Melanoma], 18:STAD[Stomach adenocarcinoma], 19:THCA[Thyroid carcinoma], 20:UCEC[Uterine Corpus Endometrial Carcinoma]) |
| Top |
| * We represented just top 10 SNVs. When you move the cursor on each content, you can see more deailed mutation information on the Tooltip. Those are primary_site, primary_histology, mutation(aa), pubmedID. |
| Genomic Position | Mutation(aa) | Unique sampleID count |
| chr11:13393796 | p.E302K,ARNTL | 3 |
| chr11:13397168 | p.T394M,ARNTL | 2 |
| chr11:13402723 | p.S512S,ARNTL | 2 |
| chr11:13407320 | p.K271N,ARNTL | 1 |
| chr11:13375965 | p.S566P,ARNTL | 1 |
| chr11:13388320 | p.S31G,ARNTL | 1 |
| chr11:13408253 | p.S283I,ARNTL | 1 |
| chr11:13378308 | p.D567H,ARNTL | 1 |
| chr11:13388329 | p.R37H,ARNTL | 1 |
| chr11:13397284 | p.A610T,ARNTL | 1 |
| * Copy number data were extracted from TCGA using R package TCGA-Assembler. The URLs of all public data files on TCGA DCC data server were gathered on Jan-05-2015. Function ProcessCNAData in TCGA-Assembler package was used to obtain gene-level copy number value which is calculated as the average copy number of the genomic region of a gene. |
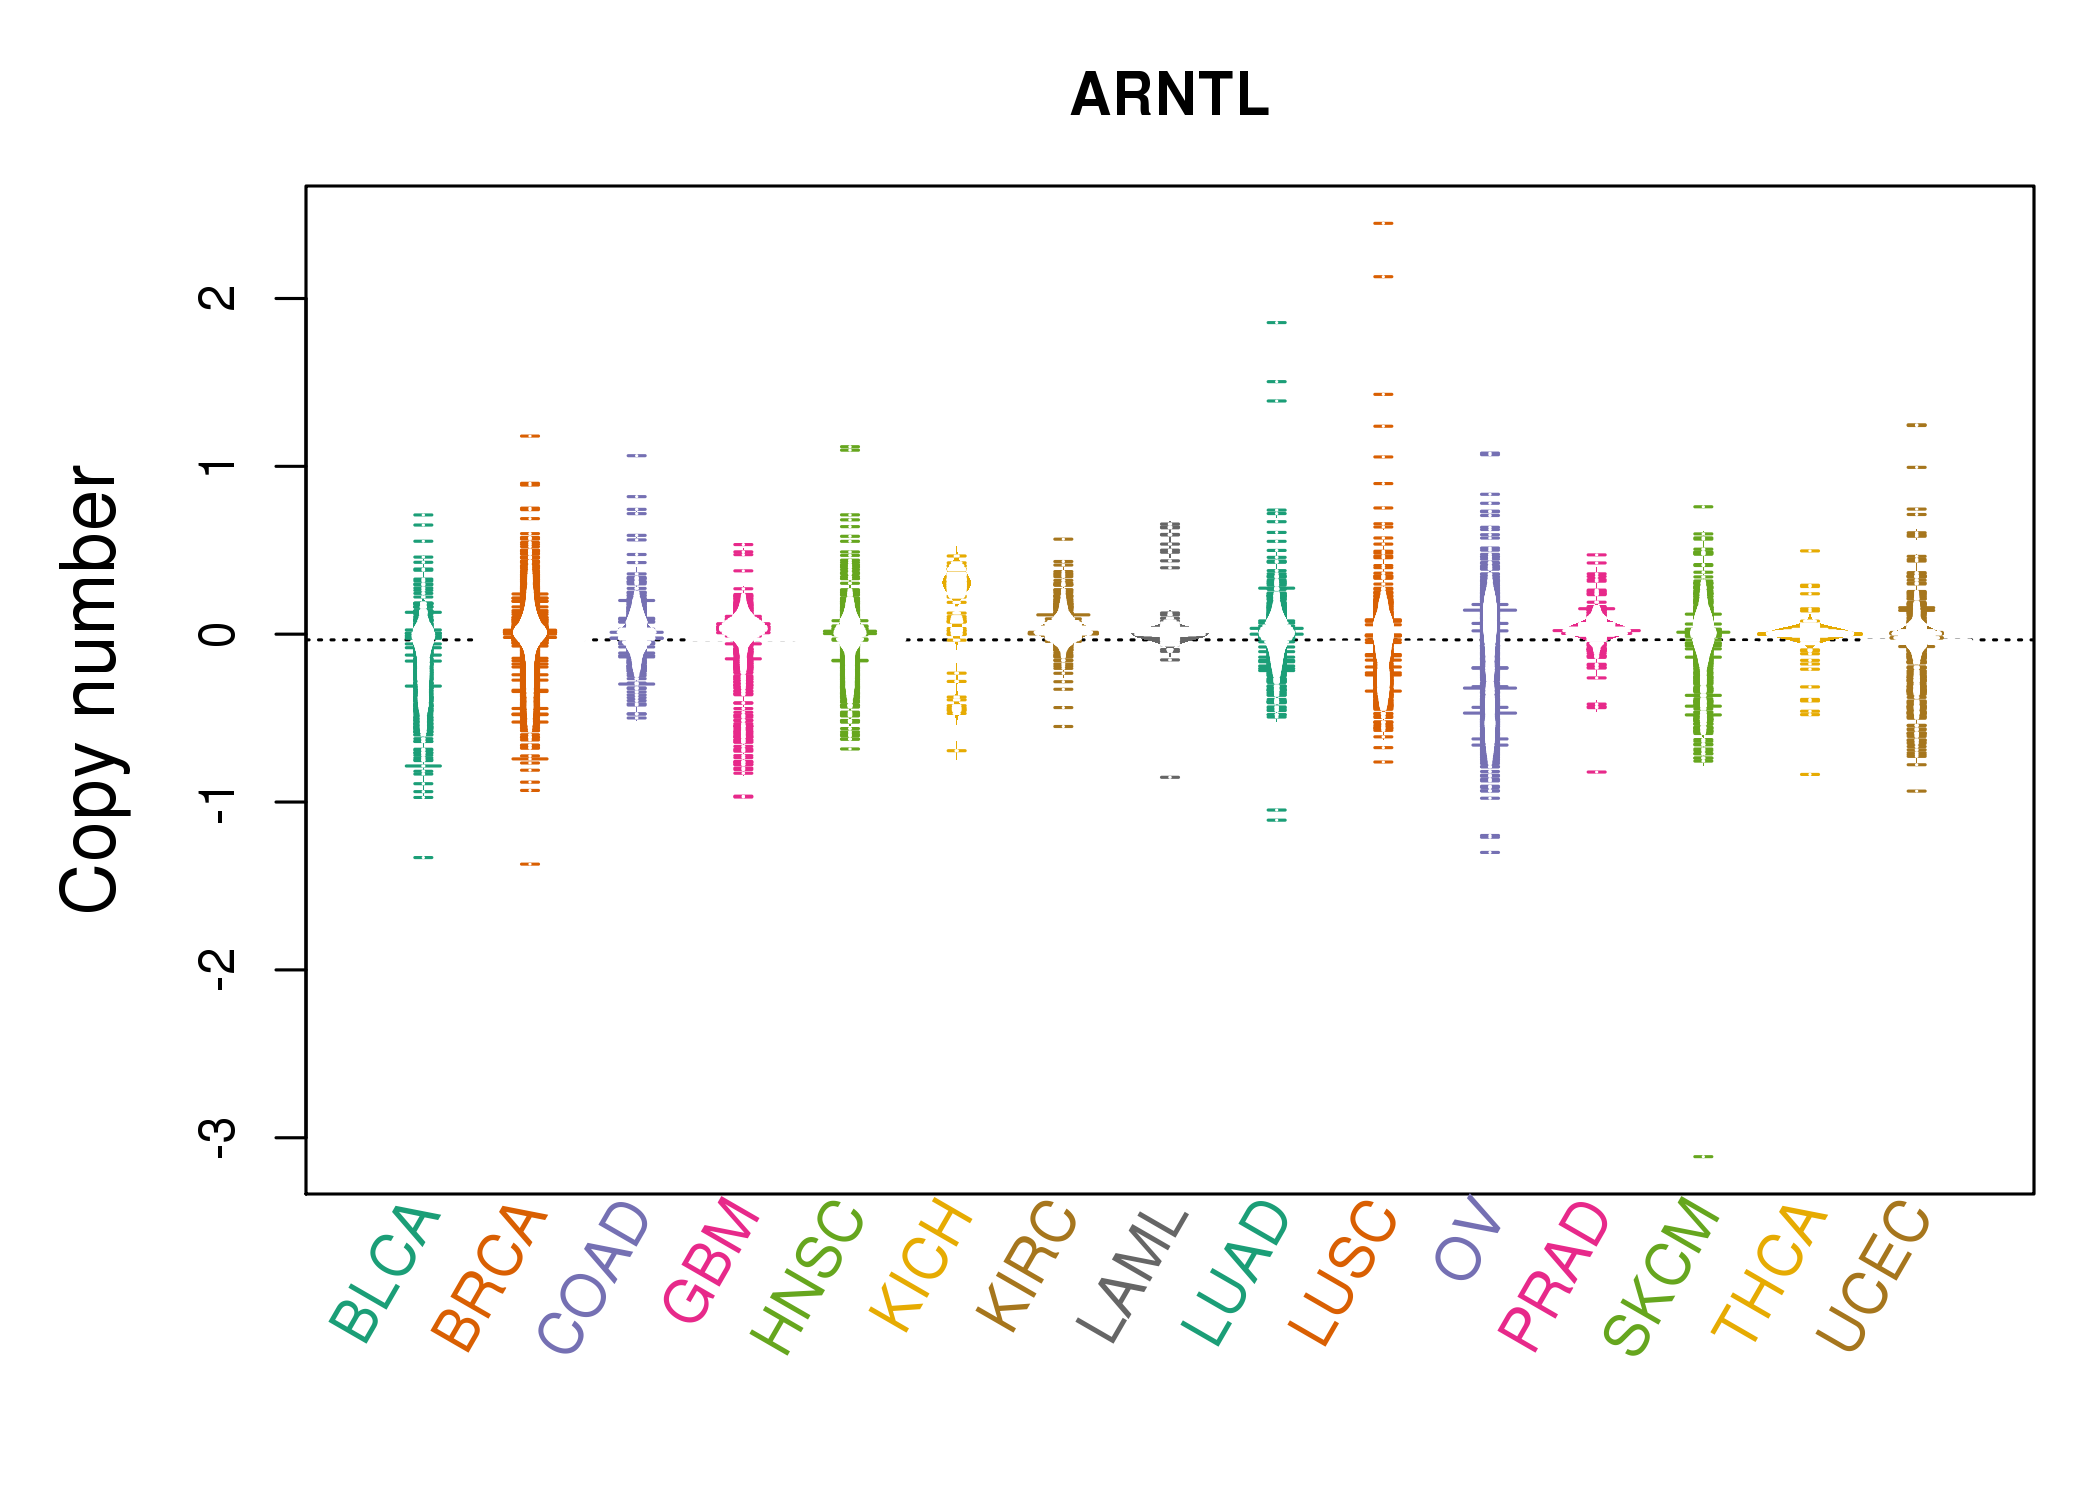 |
| cf) Tissue ID[Tissue type]: BLCA[Bladder Urothelial Carcinoma], BRCA[Breast invasive carcinoma], CESC[Cervical squamous cell carcinoma and endocervical adenocarcinoma], COAD[Colon adenocarcinoma], GBM[Glioblastoma multiforme], Glioma Low Grade, HNSC[Head and Neck squamous cell carcinoma], KICH[Kidney Chromophobe], KIRC[Kidney renal clear cell carcinoma], KIRP[Kidney renal papillary cell carcinoma], LAML[Acute Myeloid Leukemia], LUAD[Lung adenocarcinoma], LUSC[Lung squamous cell carcinoma], OV[Ovarian serous cystadenocarcinoma ], PAAD[Pancreatic adenocarcinoma], PRAD[Prostate adenocarcinoma], SKCM[Skin Cutaneous Melanoma], STAD[Stomach adenocarcinoma], THCA[Thyroid carcinoma], UCEC[Uterine Corpus Endometrial Carcinoma] |
| Top |
| Gene Expression for ARNTL |
| * CCLE gene expression data were extracted from CCLE_Expression_Entrez_2012-10-18.res: Gene-centric RMA-normalized mRNA expression data. |
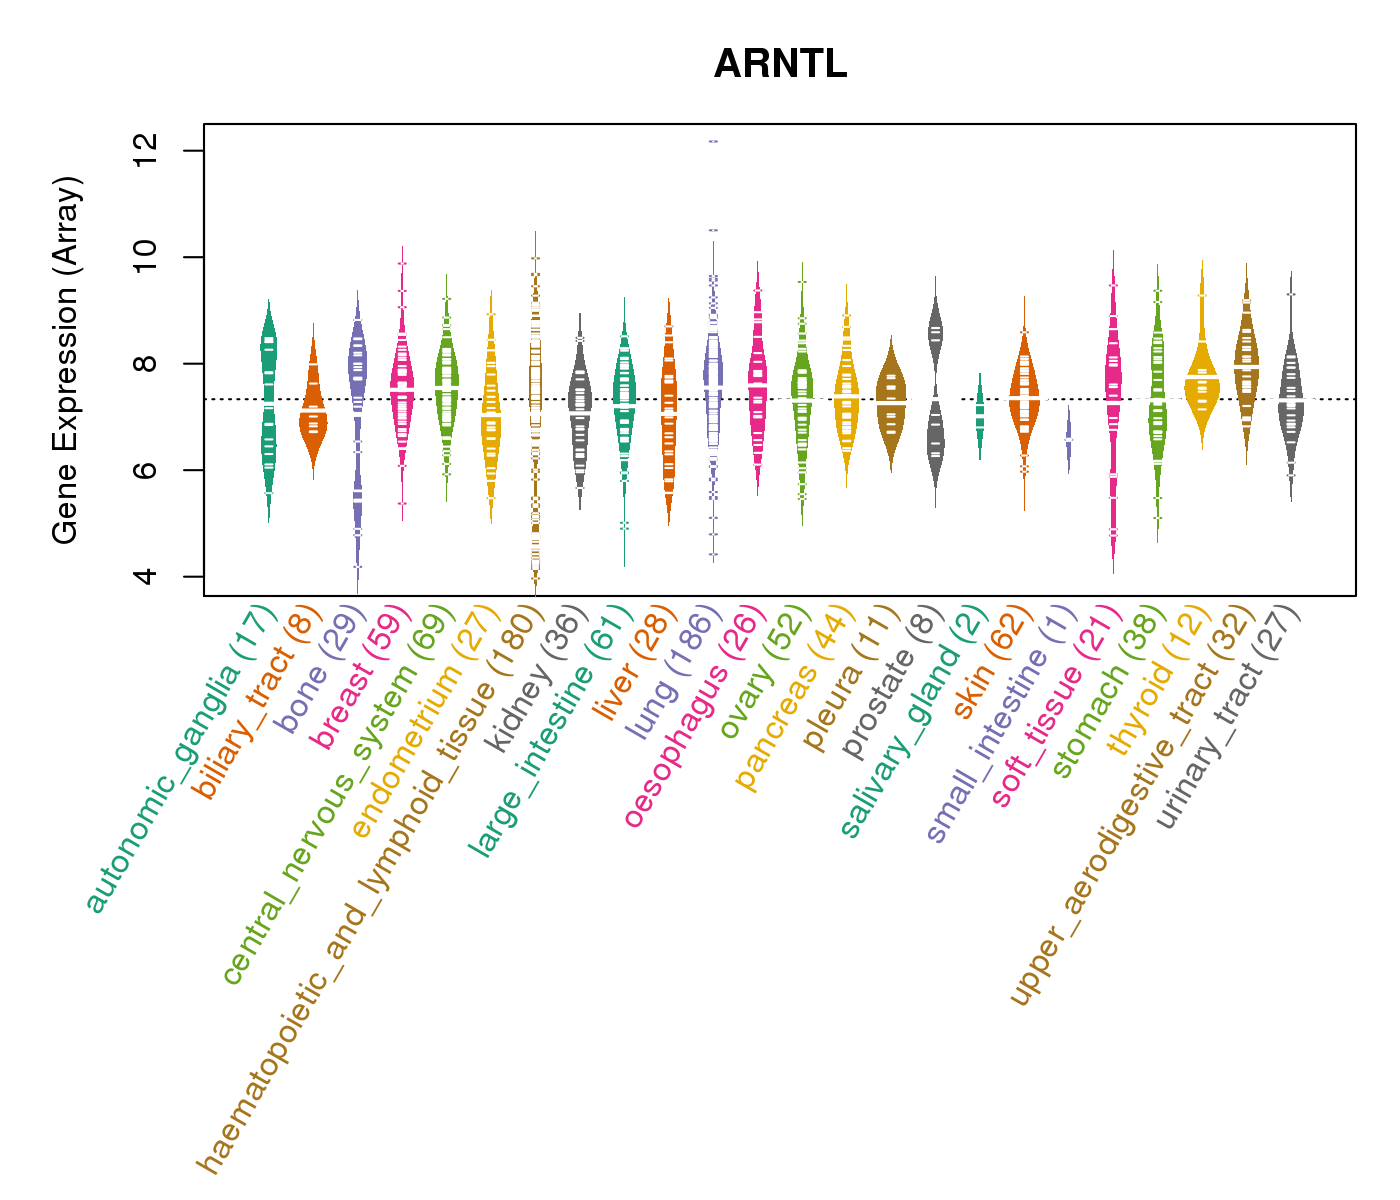 |
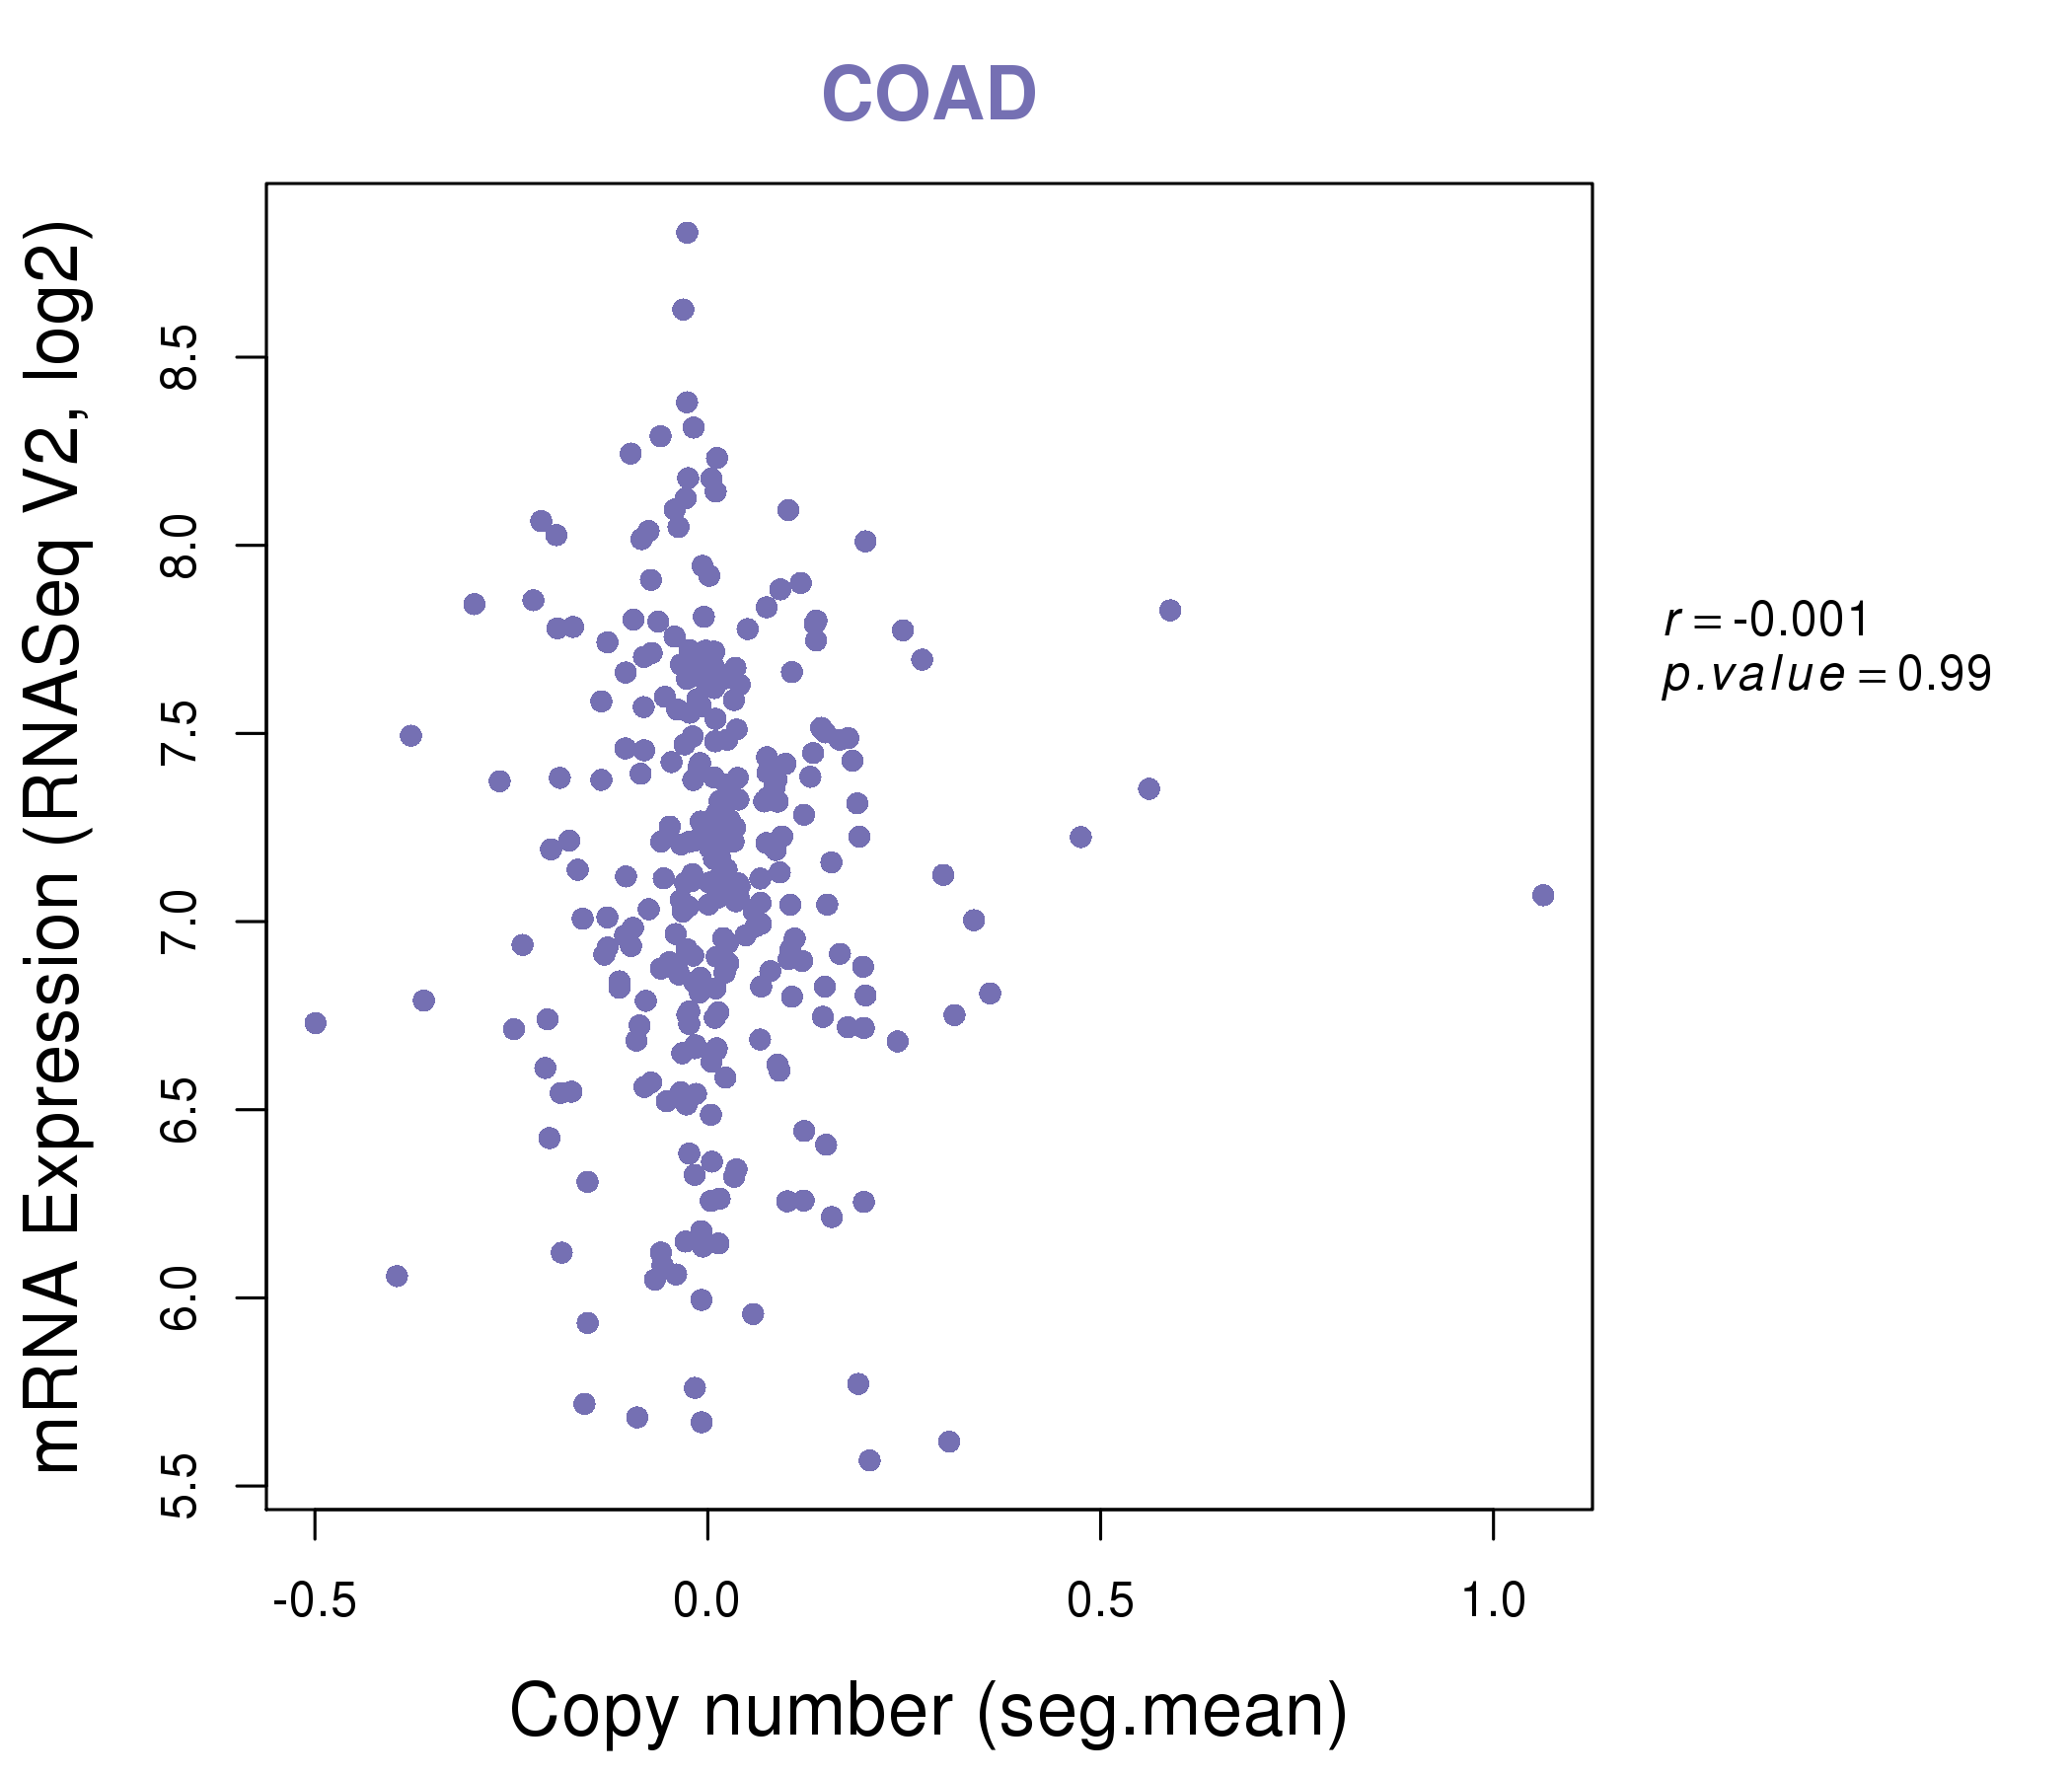
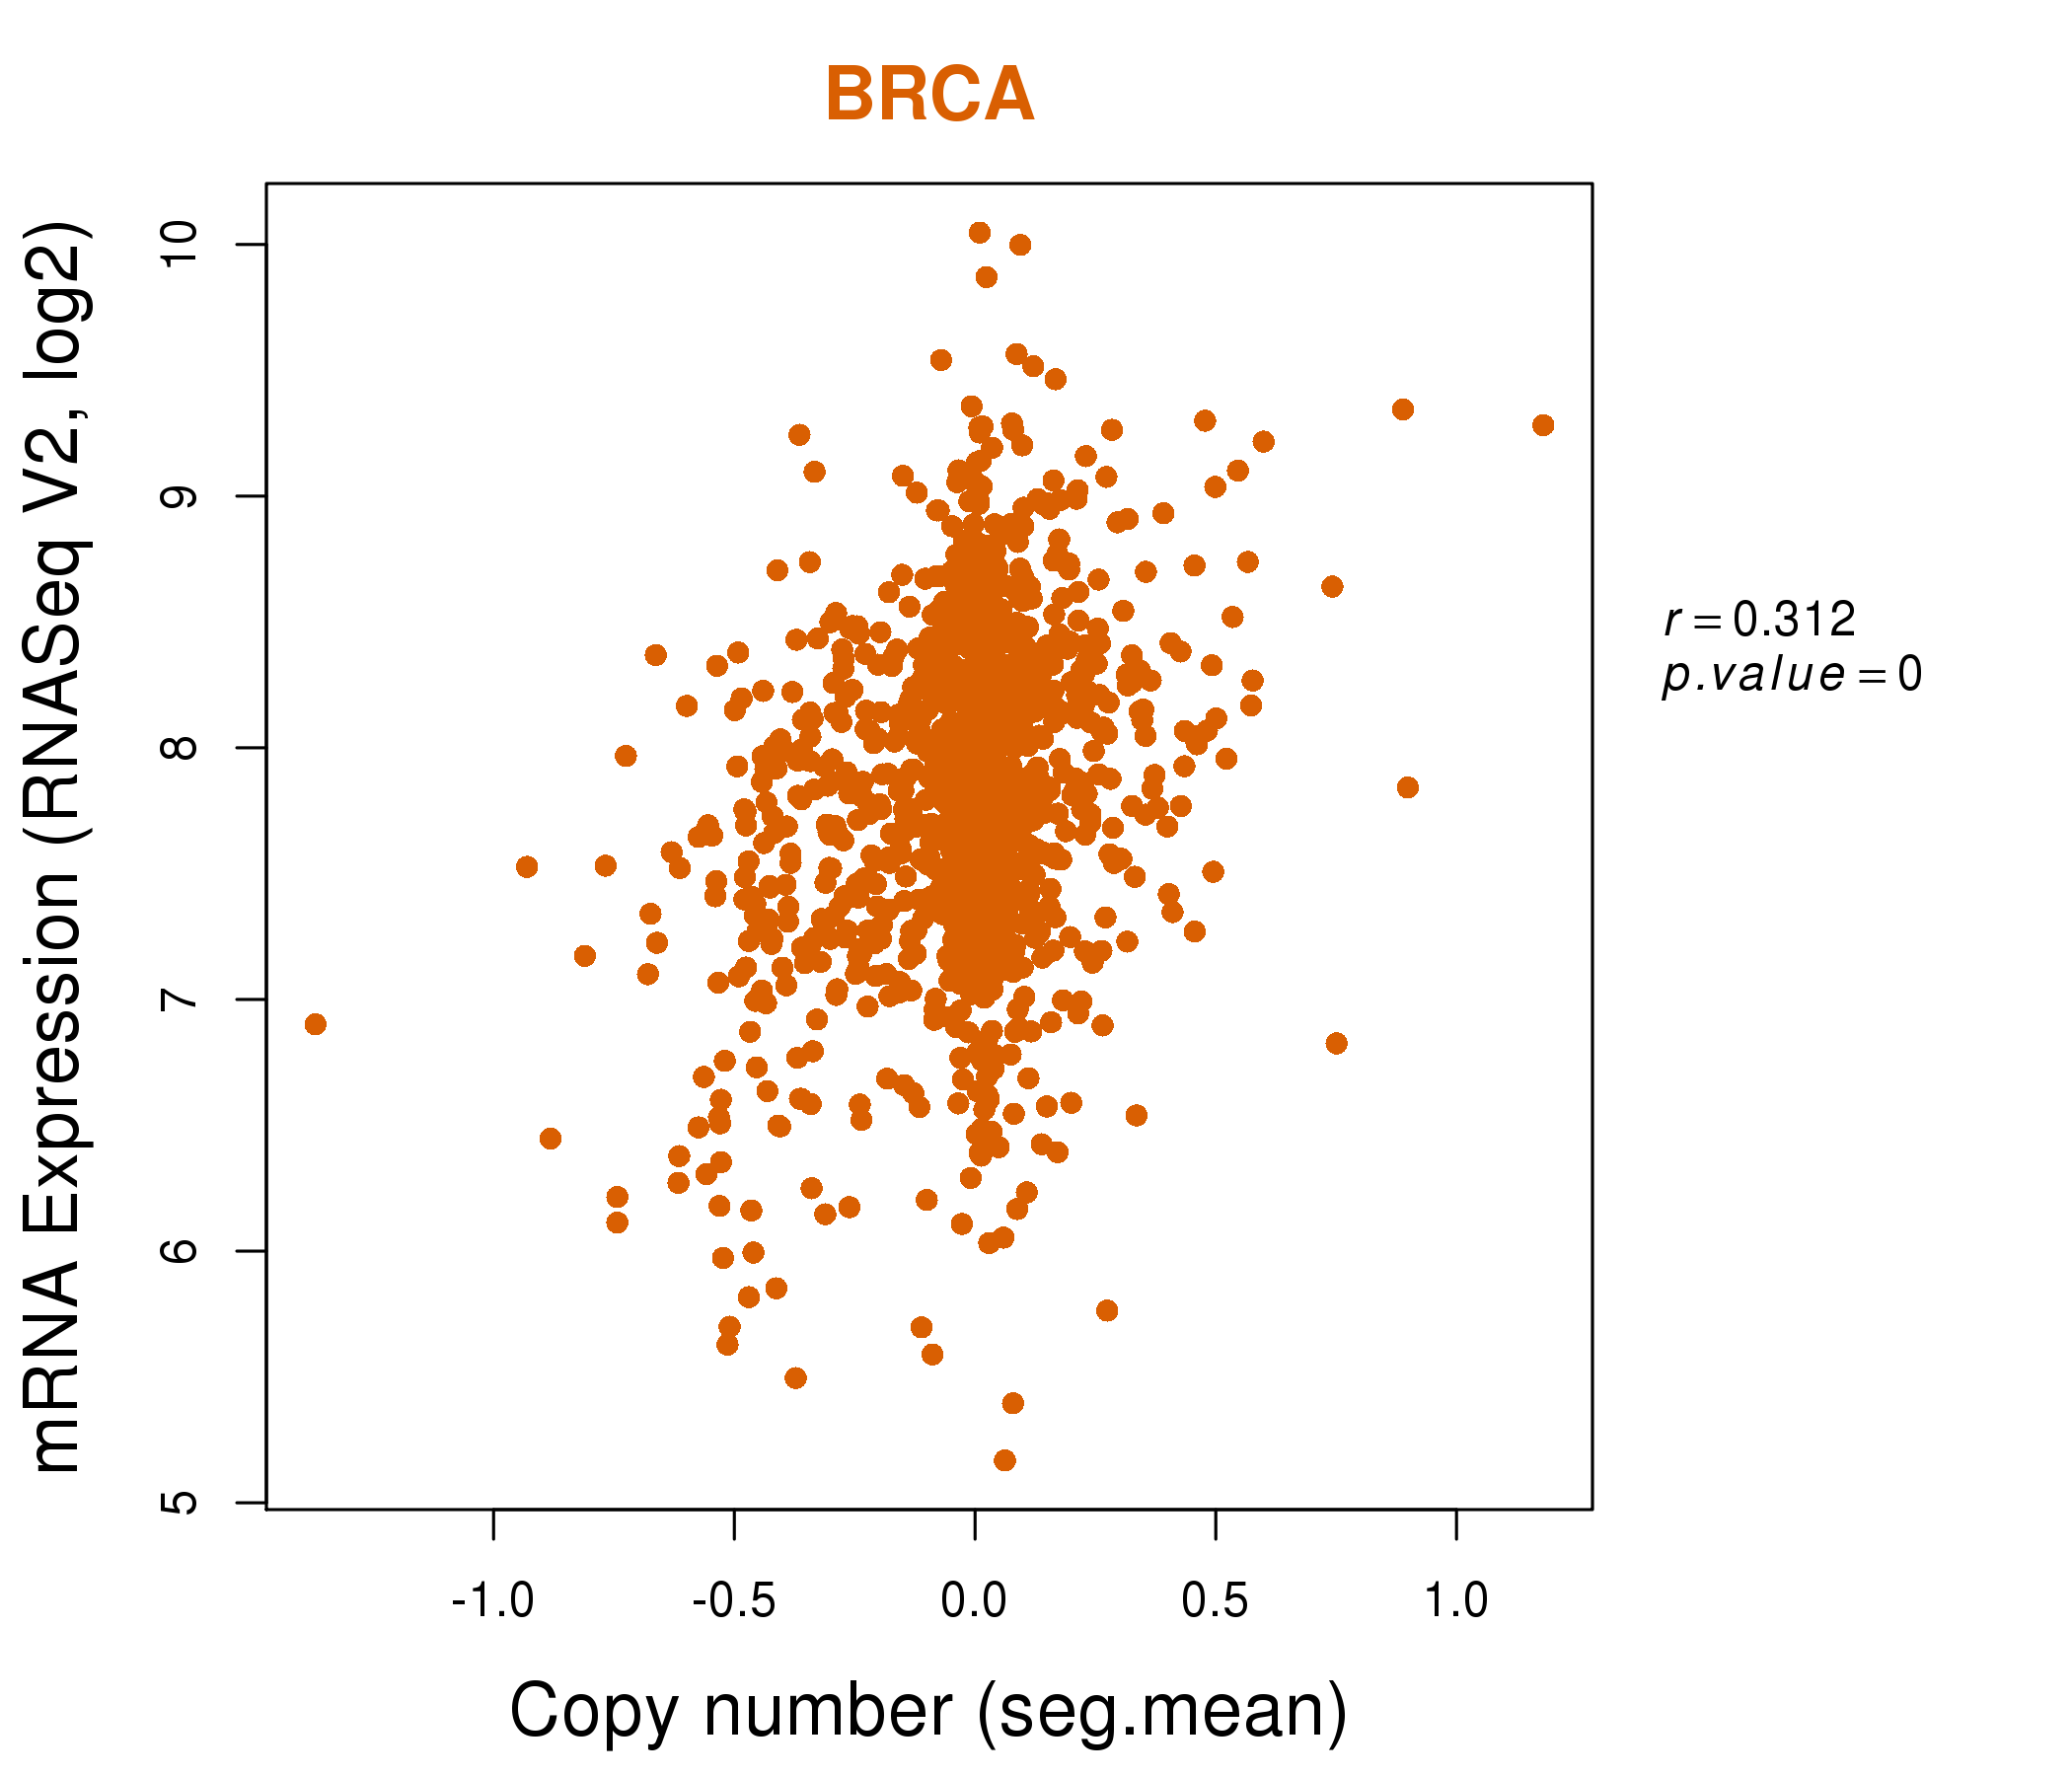
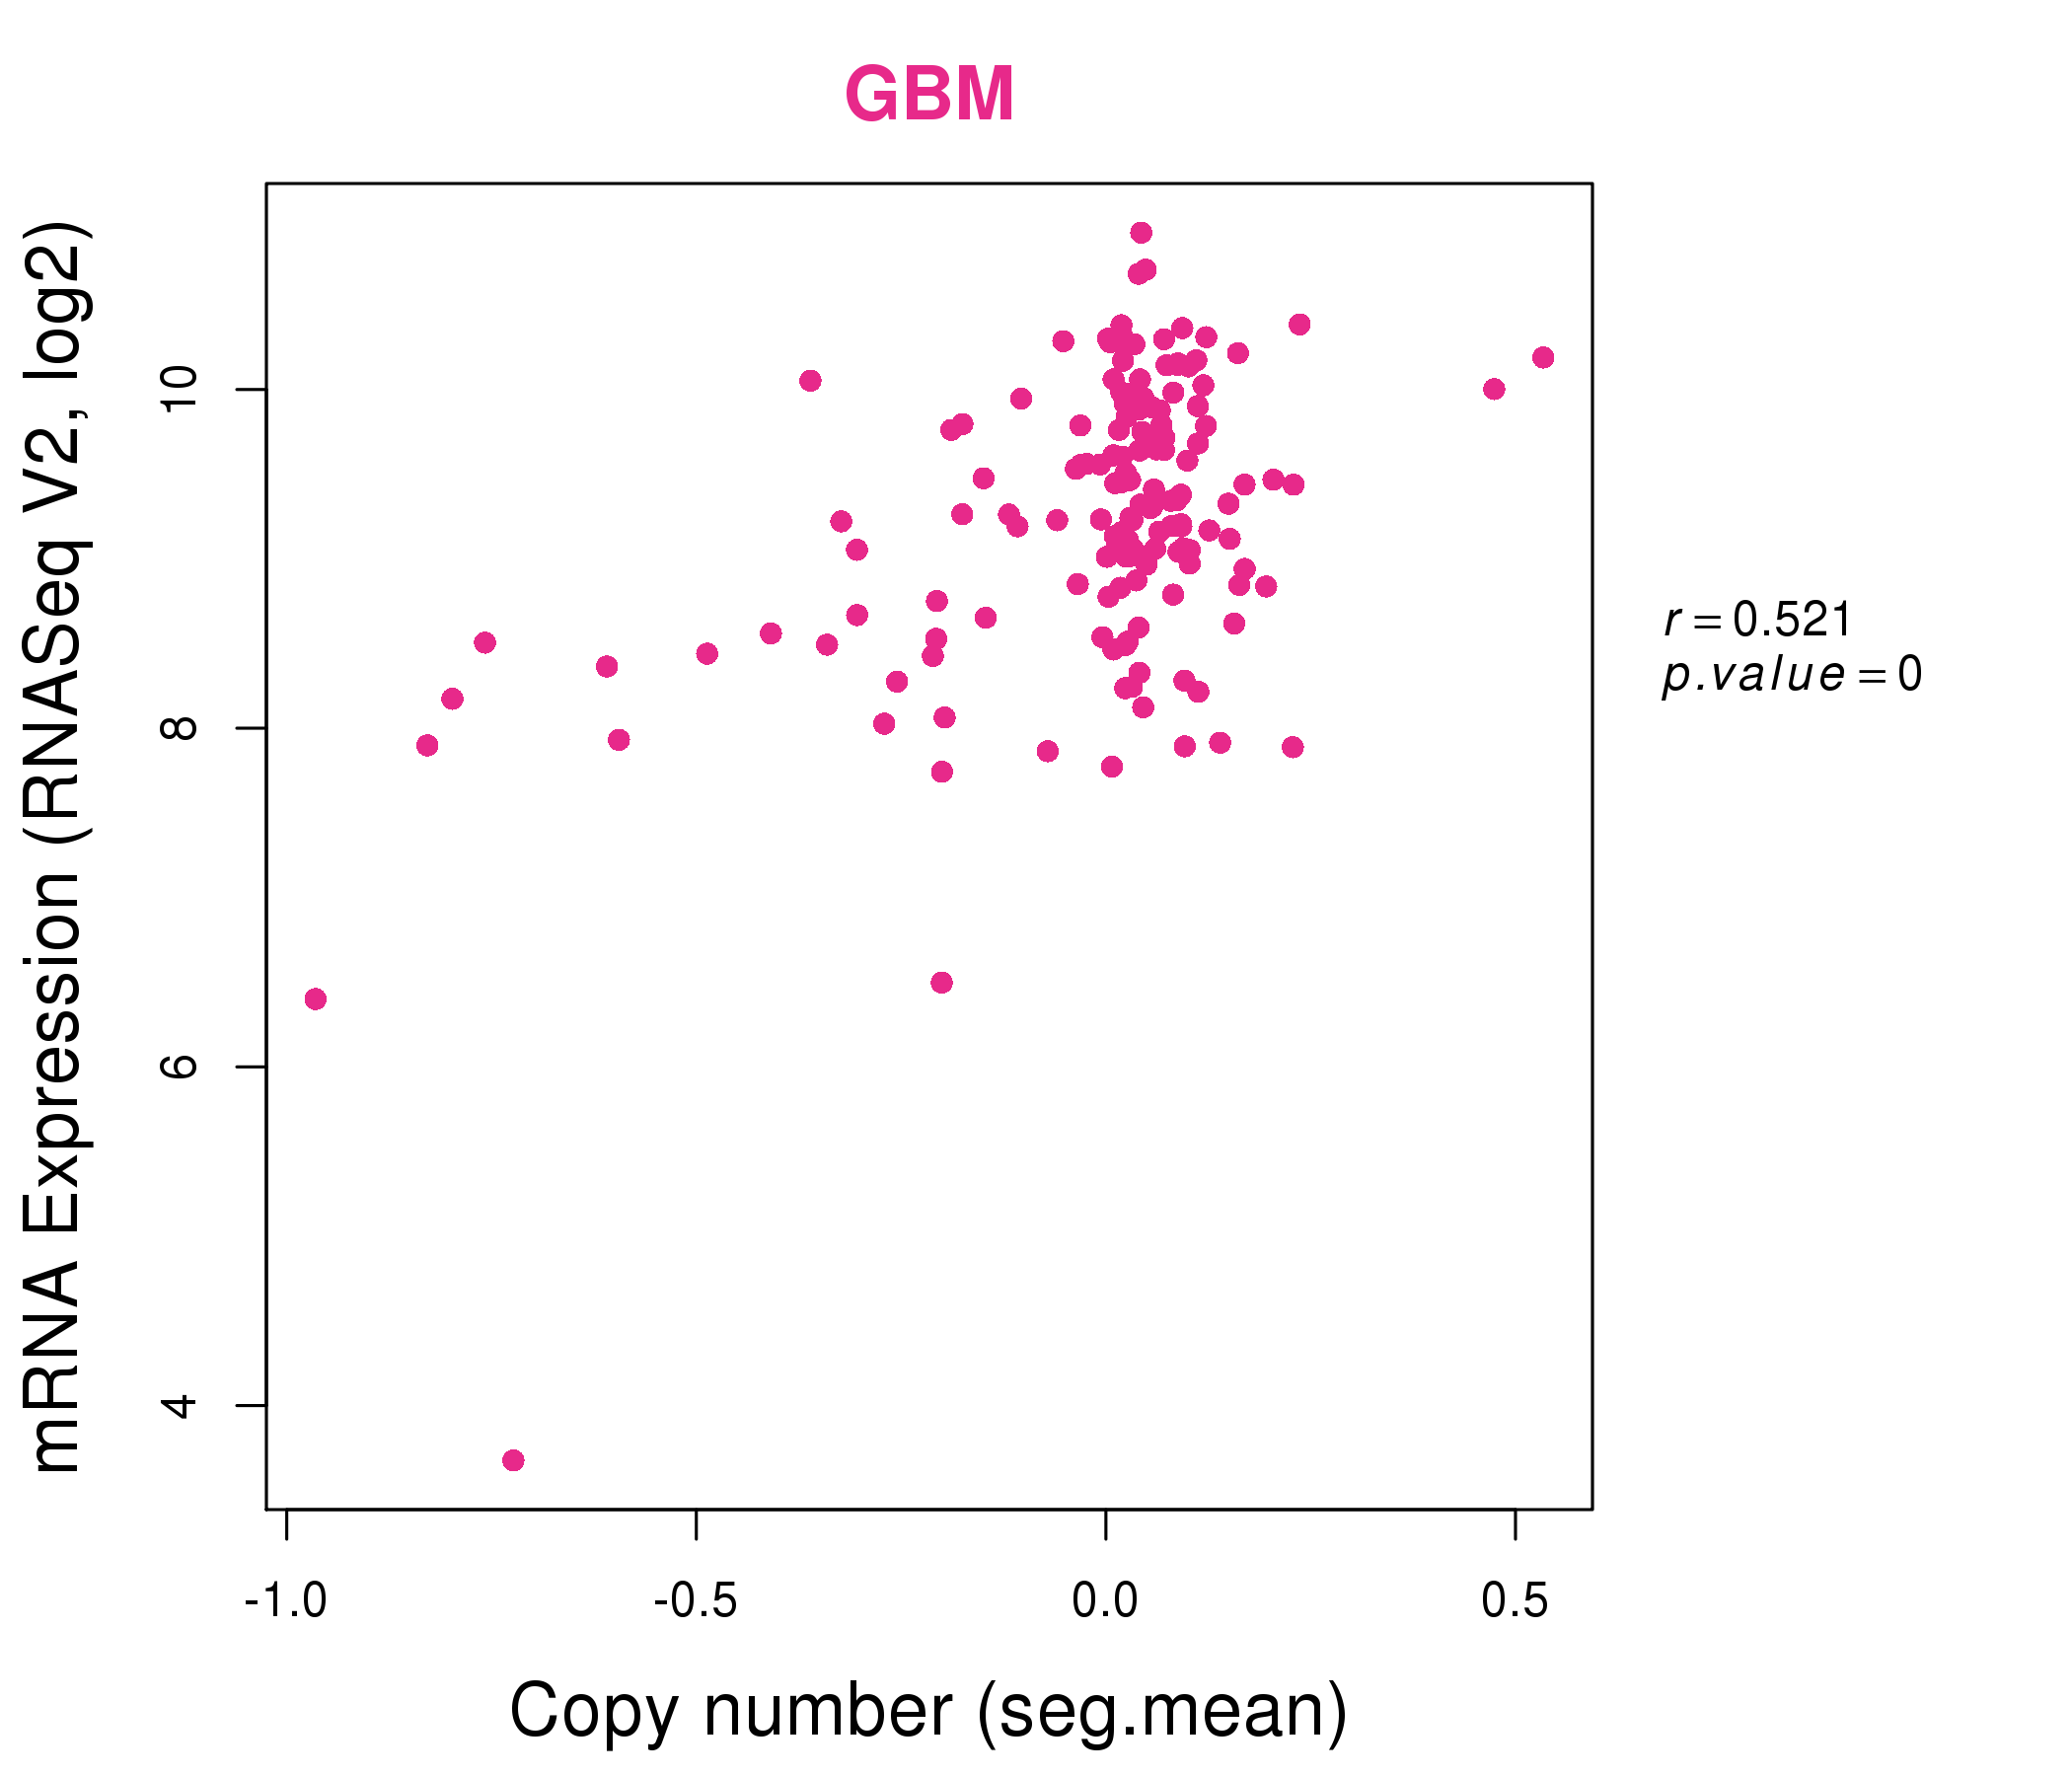
| * Normalized gene expression data of RNASeqV2 was extracted from TCGA using R package TCGA-Assembler. The URLs of all public data files on TCGA DCC data server were gathered at Jan-05-2015. Only eight cancer types have enough normal control samples for differential expression analysis. (t test, adjusted p<0.05 (using Benjamini-Hochberg FDR)) |
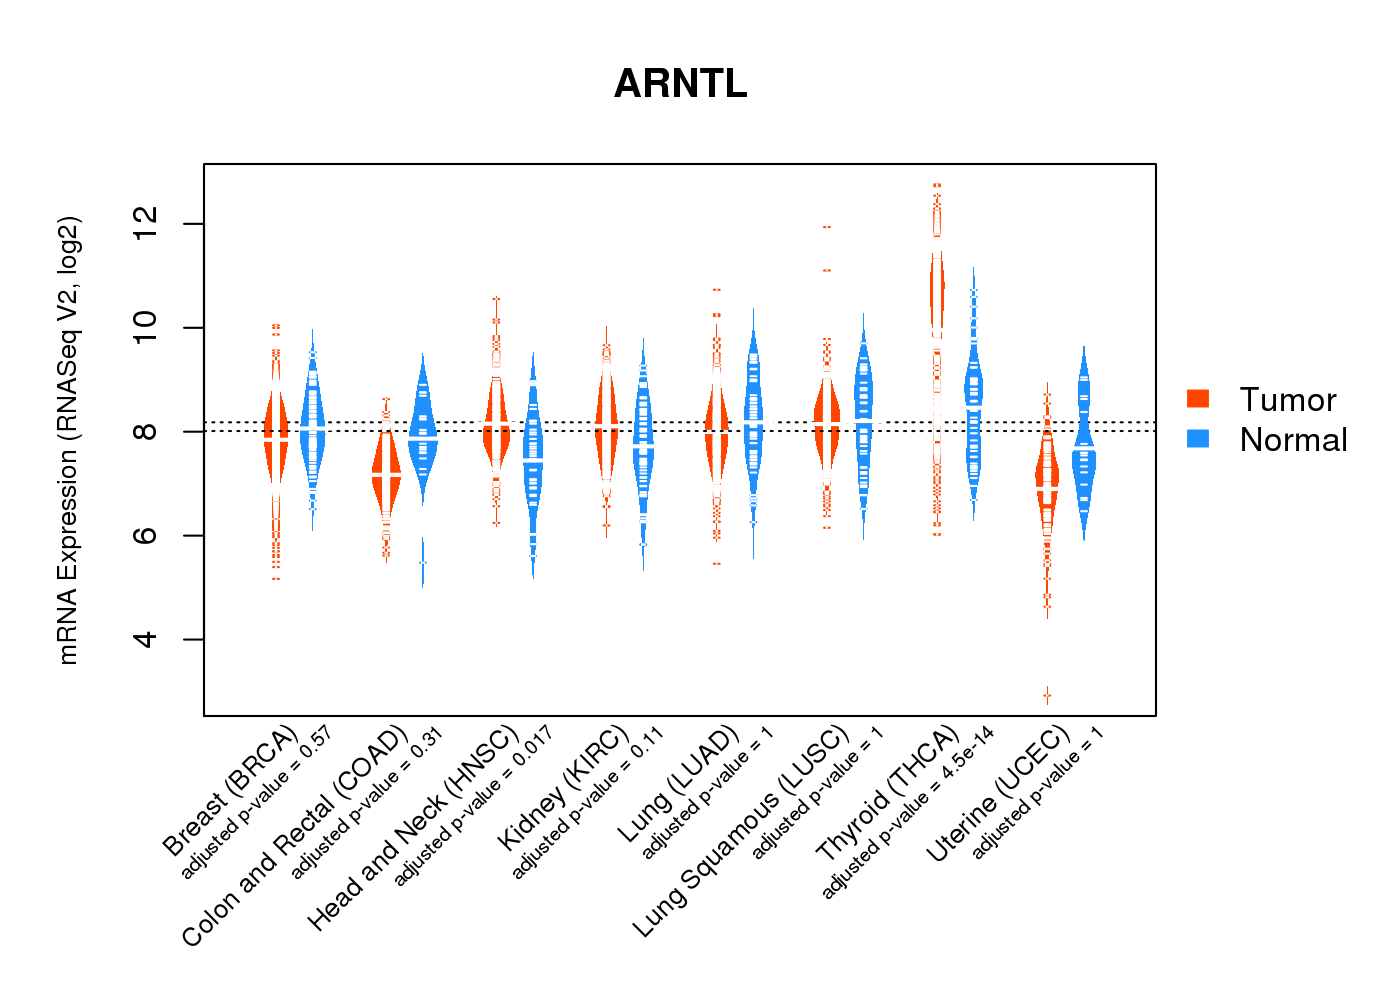 |
| Top |
| * This plots show the correlation between CNV and gene expression. |
: Open all plots for all cancer types
 |
|
 |
|
| Top |
| Gene-Gene Network Information |
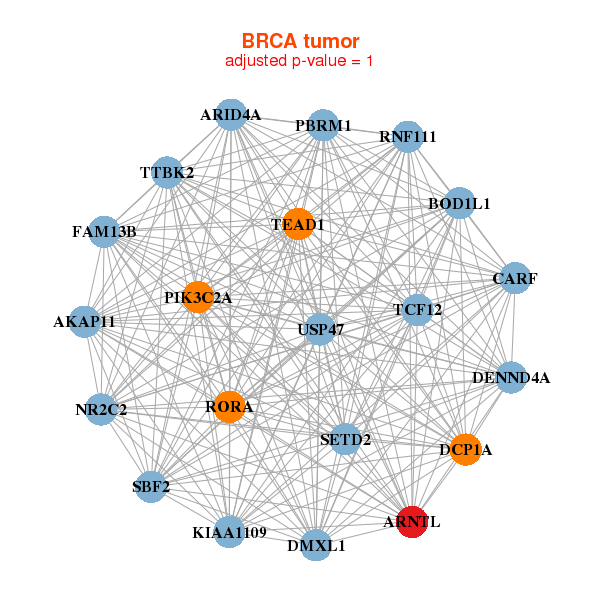
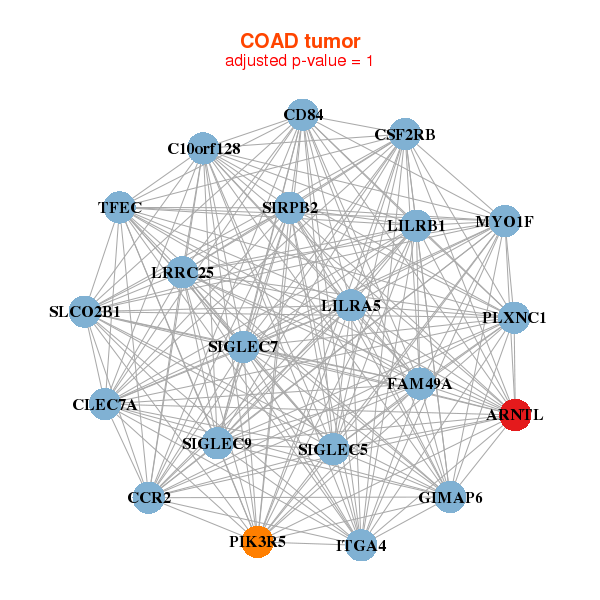
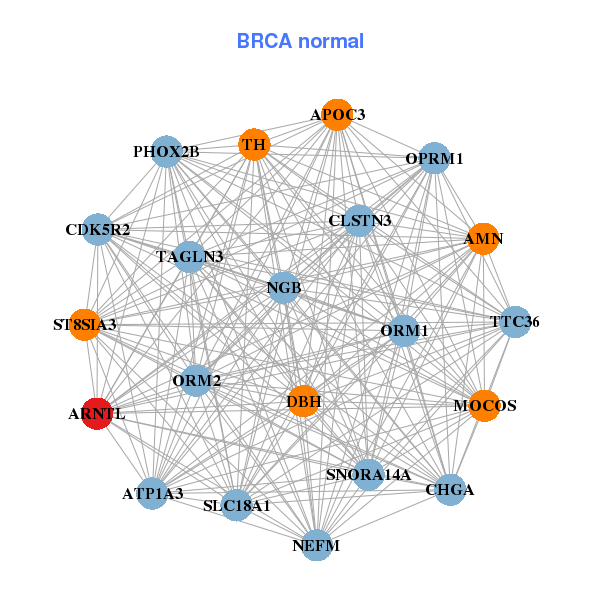
| * Co-Expression network figures were drawn using R package igraph. Only the top 20 genes with the highest correlations were shown. Red circle: input gene, orange circle: cell metabolism gene, sky circle: other gene |
: Open all plots for all cancer types
 |
|
| AKAP11,CARF,ARID4A,ARNTL,BOD1L1,DCP1A,DENND4A, DMXL1,FAM13B,KIAA1109,NR2C2,PBRM1,PIK3C2A,RNF111, RORA,SBF2,SETD2,TCF12,TEAD1,TTBK2,USP47 | AMN,APOC3,ARNTL,ATP1A3,CDK5R2,CHGA,CLSTN3, DBH,MOCOS,NEFM,NGB,OPRM1,ORM1,ORM2, PHOX2B,SLC18A1,SNORA14A,ST8SIA3,TAGLN3,TH,TTC36 |
 |
|
| ARNTL,C10orf128,CCR2,CD84,CLEC7A,CSF2RB,FAM49A, GIMAP6,ITGA4,LILRA5,LILRB1,LRRC25,MYO1F,PIK3R5, PLXNC1,SIGLEC5,SIGLEC7,SIGLEC9,SIRPB2,SLCO2B1,TFEC | APOL6,ARNTL,BAK1,CALCOCO2,CASP3,CASP7,CASP8, CSNK1G3,CTSS,DECR1,EPSTI1,GSDMB,LEPROTL1,MMAA, MS4A12,NT5C3A,OAS1,PARP14,TAP1,TEX11,USP38 |
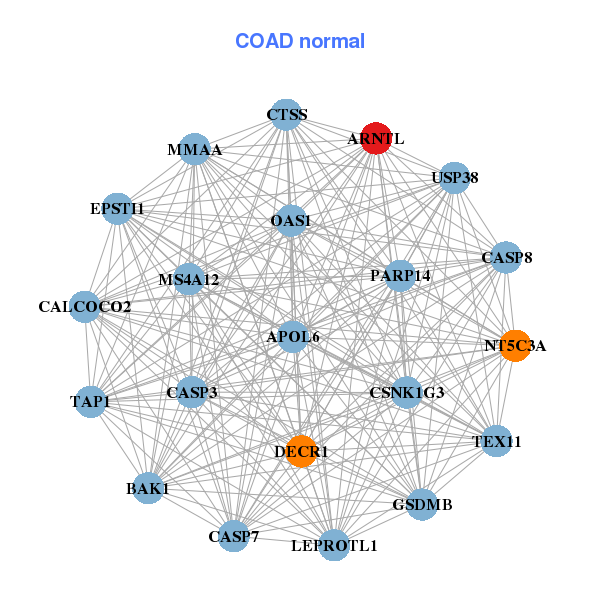
| * Co-Expression network figures were drawn using R package igraph. Only the top 20 genes with the highest correlations were shown. Red circle: input gene, orange circle: cell metabolism gene, sky circle: other gene |
: Open all plots for all cancer types
| Top |
: Open all interacting genes' information including KEGG pathway for all interacting genes from DAVID
| Top |
| Pharmacological Information for ARNTL |
| There's no related Drug. |
| Top |
| Cross referenced IDs for ARNTL |
| * We obtained these cross-references from Uniprot database. It covers 150 different DBs, 18 categories. http://www.uniprot.org/help/cross_references_section |
: Open all cross reference information
|
Copyright © 2016-Present - The Univsersity of Texas Health Science Center at Houston @ |