|
||||||||||||||||||||||||||||||||||||||||||||||||||||||||||||||||||||||||||||||||||||||||||||||||||||||||||||||||||||||||||||||||||||||||||||||||||||||||||||||||||||||||||||||||||||||||||||||||||||||||||||||||||||||||||||||||||||||||||||||||||||||||||||||||||||||||||||||||||||||||||||||||||||||||||||||||||||||||||
| |
| Phenotypic Information (metabolism pathway, cancer, disease, phenome) |
| |
| |
| Gene-Gene Network Information: Co-Expression Network, Interacting Genes & KEGG |
| |
|


| Gene Summary for CNOT4 |
| Basic gene info. | Gene symbol | CNOT4 |
| Gene name | CCR4-NOT transcription complex, subunit 4 | |
| Synonyms | CLONE243|NOT4|NOT4H | |
| Cytomap | UCSC genome browser: 7q33 | |
| Genomic location | chr7 :135071821-135194875 | |
| Type of gene | protein-coding | |
| RefGenes | NM_001008225.2, NM_001190847.1,NM_001190848.1,NM_001190849.1,NM_001190850.1, NM_013316.3, | |
| Ensembl id | ENSG00000080802 | |
| Description | CCR4-NOT transcription complex subunit 4CCR4-associated factor 4E3 ubiquitin-protein ligase CNOT4NOT4 (negative regulator of transcription 4, yeast) homologpotential transcriptional repressor NOT4Hp | |
| Modification date | 20141207 | |
| dbXrefs | MIM : 604911 | |
| HGNC : HGNC | ||
| Ensembl : ENSG00000080802 | ||
| HPRD : 05369 | ||
| Vega : OTTHUMG00000155568 | ||
| Protein | UniProt: O95628 go to UniProt's Cross Reference DB Table | |
| Expression | CleanEX: HS_CNOT4 | |
| BioGPS: 4850 | ||
| Gene Expression Atlas: ENSG00000080802 | ||
| The Human Protein Atlas: ENSG00000080802 | ||
| Pathway | NCI Pathway Interaction Database: CNOT4 | |
| KEGG: CNOT4 | ||
| REACTOME: CNOT4 | ||
| ConsensusPathDB | ||
| Pathway Commons: CNOT4 | ||
| Metabolism | MetaCyc: CNOT4 | |
| HUMANCyc: CNOT4 | ||
| Regulation | Ensembl's Regulation: ENSG00000080802 | |
| miRBase: chr7 :135,071,821-135,194,875 | ||
| TargetScan: NM_001008225 | ||
| cisRED: ENSG00000080802 | ||
| Context | iHOP: CNOT4 | |
| cancer metabolism search in PubMed: CNOT4 | ||
| UCL Cancer Institute: CNOT4 | ||
| Assigned class in ccmGDB | B - This gene belongs to cancer gene. | |
| Top |
| Phenotypic Information for CNOT4(metabolism pathway, cancer, disease, phenome) |
| Cancer | CGAP: CNOT4 |
| Familial Cancer Database: CNOT4 | |
| * This gene is included in those cancer gene databases. |
|
|
|
|
|
| . | ||||||||||||||||||||||||||||||||||||||||||||||||||||||||||||||||||||||||||||||||||||||||||||||||||||||||||||||||||||||||||||||||||||||||||||||||||||||||||||||||||||||||||||||||||||||||||||||||||||||||||||||||||||||||||||||||||||||||||||||||||||||||||||||||||||||||||||||||||||||||||||||||||||||||||||||||||||
Oncogene 1 | Significant driver gene in | |||||||||||||||||||||||||||||||||||||||||||||||||||||||||||||||||||||||||||||||||||||||||||||||||||||||||||||||||||||||||||||||||||||||||||||||||||||||||||||||||||||||||||||||||||||||||||||||||||||||||||||||||||||||||||||||||||||||||||||||||||||||||||||||||||||||||||||||||||||||||||||||||||||||||||||||||||||||||
| cf) number; DB name 1 Oncogene; http://nar.oxfordjournals.org/content/35/suppl_1/D721.long, 2 Tumor Suppressor gene; https://bioinfo.uth.edu/TSGene/, 3 Cancer Gene Census; http://www.nature.com/nrc/journal/v4/n3/abs/nrc1299.html, 4 CancerGenes; http://nar.oxfordjournals.org/content/35/suppl_1/D721.long, 5 Network of Cancer Gene; http://ncg.kcl.ac.uk/index.php, 1Therapeutic Vulnerabilities in Cancer; http://cbio.mskcc.org/cancergenomics/statius/ |
| REACTOME_METABOLISM_OF_MRNA REACTOME_METABOLISM_OF_RNA | |
| OMIM | 604911; gene. 604911; gene. |
| Orphanet | |
| Disease | KEGG Disease: CNOT4 |
| MedGen: CNOT4 (Human Medical Genetics with Condition) | |
| ClinVar: CNOT4 | |
| Phenotype | MGI: CNOT4 (International Mouse Phenotyping Consortium) |
| PhenomicDB: CNOT4 | |
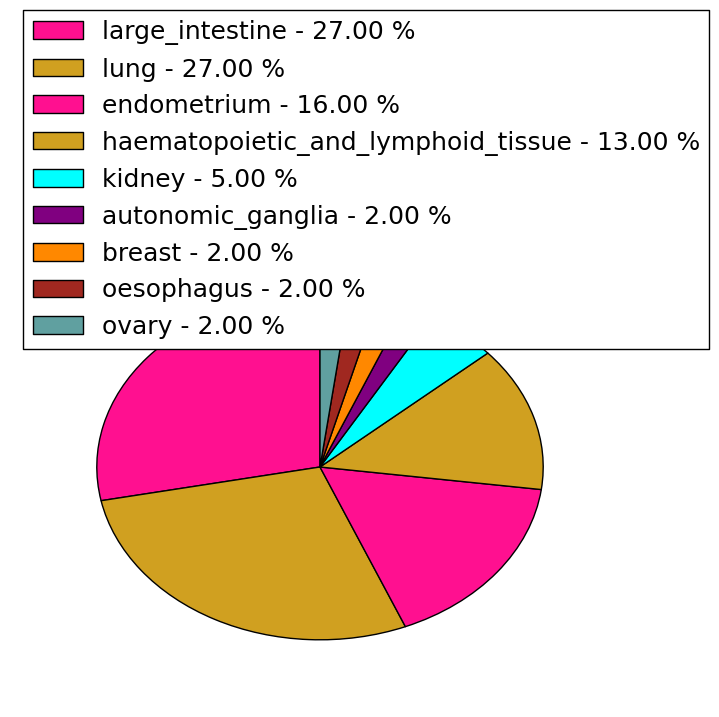
| Mutations for CNOT4 |
| * Under tables are showing count per each tissue to give us broad intuition about tissue specific mutation patterns.You can go to the detailed page for each mutation database's web site. |
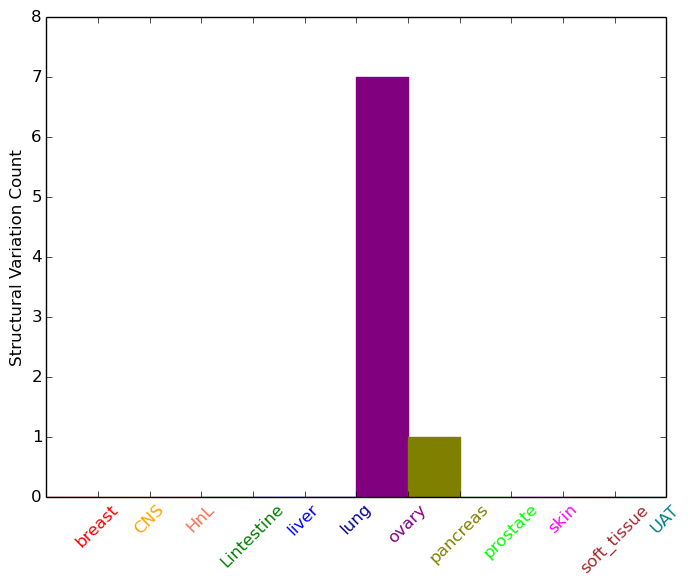
| - Statistics for Tissue and Mutation type | Top |
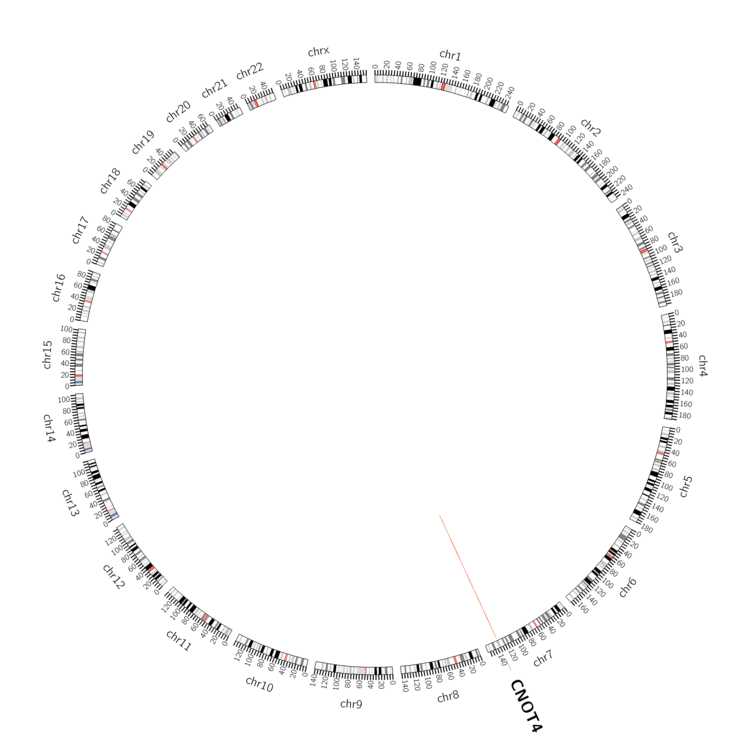 |
| - For Inter-chromosomal Variations |
| There's no inter-chromosomal structural variation. |
| - For Intra-chromosomal Variations |
| * Intra-chromosomal variantions includes 'intrachromosomal amplicon to amplicon', 'intrachromosomal amplicon to non-amplified dna', 'intrachromosomal deletion', 'intrachromosomal fold-back inversion', 'intrachromosomal inversion', 'intrachromosomal tandem duplication', 'Intrachromosomal unknown type', 'intrachromosomal with inverted orientation', 'intrachromosomal with non-inverted orientation'. |
 |
| Sample | Symbol_a | Chr_a | Start_a | End_a | Symbol_b | Chr_b | Start_b | End_b |
| ovary | CNOT4 | chr7 | 135101194 | 135101214 | CNOT4 | chr7 | 135078401 | 135078421 |
| ovary | CNOT4 | chr7 | 135138101 | 135138121 | CNOT4 | chr7 | 135051715 | 135051735 |
| ovary | CNOT4 | chr7 | 135159132 | 135159152 | CNOT4 | chr7 | 135159306 | 135159326 |
| pancreas | CNOT4 | chr7 | 135189205 | 135189225 | CNOT4 | chr7 | 135189524 | 135189544 |
| cf) Tissue number; Tissue name (1;Breast, 2;Central_nervous_system, 3;Haematopoietic_and_lymphoid_tissue, 4;Large_intestine, 5;Liver, 6;Lung, 7;Ovary, 8;Pancreas, 9;Prostate, 10;Skin, 11;Soft_tissue, 12;Upper_aerodigestive_tract) |
| * From mRNA Sanger sequences, Chitars2.0 arranged chimeric transcripts. This table shows CNOT4 related fusion information. |
| ID | Head Gene | Tail Gene | Accession | Gene_a | qStart_a | qEnd_a | Chromosome_a | tStart_a | tEnd_a | Gene_a | qStart_a | qEnd_a | Chromosome_a | tStart_a | tEnd_a |
| Top |
| Mutation type/ Tissue ID | brca | cns | cerv | endome | haematopo | kidn | Lintest | liver | lung | ns | ovary | pancre | prost | skin | stoma | thyro | urina | |||
| Total # sample | 1 | 1 | ||||||||||||||||||
| GAIN (# sample) | 1 | 1 | ||||||||||||||||||
| LOSS (# sample) |
| cf) Tissue ID; Tissue type (1; Breast, 2; Central_nervous_system, 3; Cervix, 4; Endometrium, 5; Haematopoietic_and_lymphoid_tissue, 6; Kidney, 7; Large_intestine, 8; Liver, 9; Lung, 10; NS, 11; Ovary, 12; Pancreas, 13; Prostate, 14; Skin, 15; Stomach, 16; Thyroid, 17; Urinary_tract) |
| Top |
|
 |
| Top |
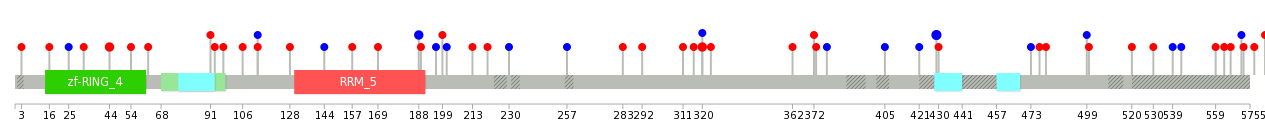
| Stat. for Non-Synonymous SNVs (# total SNVs=37) | (# total SNVs=12) |
 | 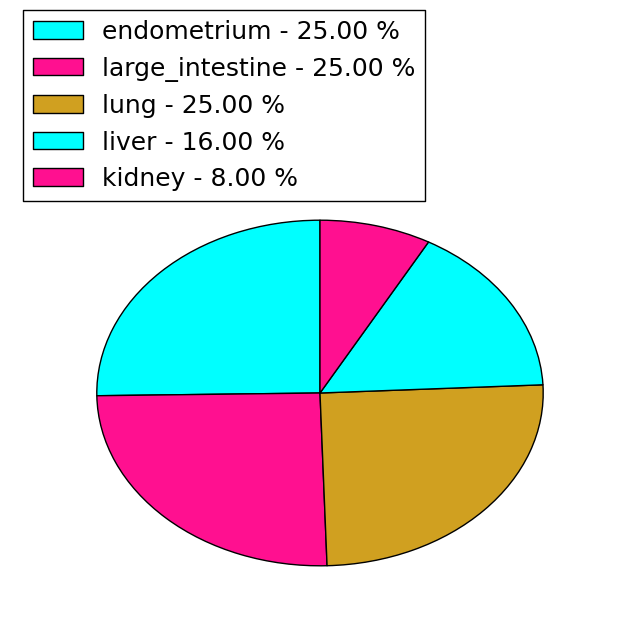 |
(# total SNVs=2) | (# total SNVs=0) |
 |
| Top |
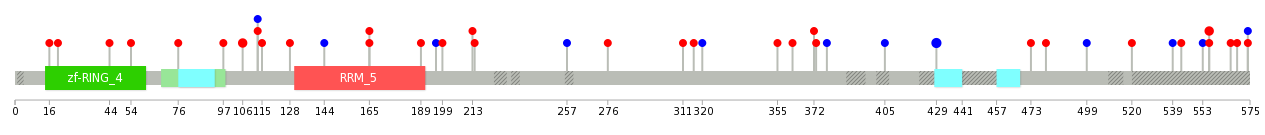
| * When you move the cursor on each content, you can see more deailed mutation information on the Tooltip. Those are primary_site,primary_histology,mutation(aa),pubmedID. |
| GRCh37 position | Mutation(aa) | Unique sampleID count |
| chr7:135079001-135079001 | p.S429S | 3 |
| chr7:135047695-135047695 | p.R621T | 2 |
| chr7:135122949-135122949 | p.R44Q | 2 |
| chr7:135080547-135080547 | p.R320Q | 2 |
| chr7:135098360-135098360 | p.A188A | 2 |
| chr7:135047693-135047693 | p.P622S | 1 |
| chr7:135080421-135080421 | p.P362L | 1 |
| chr7:135122919-135122919 | p.P54H | 1 |
| chr7:135047860-135047860 | p.A566V | 1 |
| chr7:135098265-135098265 | p.A220V | 1 |
| Top |
|
 |
| Point Mutation/ Tissue ID | 1 | 2 | 3 | 4 | 5 | 6 | 7 | 8 | 9 | 10 | 11 | 12 | 13 | 14 | 15 | 16 | 17 | 18 | 19 | 20 |
| # sample | 2 | 5 | 3 | 2 | 6 | 5 | 1 | 11 | 7 | 7 | ||||||||||
| # mutation | 2 | 7 | 3 | 2 | 6 | 5 | 1 | 11 | 6 | 9 | ||||||||||
| nonsynonymous SNV | 2 | 4 | 3 | 1 | 6 | 4 | 9 | 3 | 7 | |||||||||||
| synonymous SNV | 3 | 1 | 1 | 1 | 2 | 3 | 2 |
| cf) Tissue ID; Tissue type (1; BLCA[Bladder Urothelial Carcinoma], 2; BRCA[Breast invasive carcinoma], 3; CESC[Cervical squamous cell carcinoma and endocervical adenocarcinoma], 4; COAD[Colon adenocarcinoma], 5; GBM[Glioblastoma multiforme], 6; Glioma Low Grade, 7; HNSC[Head and Neck squamous cell carcinoma], 8; KICH[Kidney Chromophobe], 9; KIRC[Kidney renal clear cell carcinoma], 10; KIRP[Kidney renal papillary cell carcinoma], 11; LAML[Acute Myeloid Leukemia], 12; LUAD[Lung adenocarcinoma], 13; LUSC[Lung squamous cell carcinoma], 14; OV[Ovarian serous cystadenocarcinoma ], 15; PAAD[Pancreatic adenocarcinoma], 16; PRAD[Prostate adenocarcinoma], 17; SKCM[Skin Cutaneous Melanoma], 18:STAD[Stomach adenocarcinoma], 19:THCA[Thyroid carcinoma], 20:UCEC[Uterine Corpus Endometrial Carcinoma]) |
| Top |
| * We represented just top 10 SNVs. When you move the cursor on each content, you can see more deailed mutation information on the Tooltip. Those are primary_site, primary_histology, mutation(aa), pubmedID. |
| Genomic Position | Mutation(aa) | Unique sampleID count |
| chr7:135079001 | p.S429S,CNOT4 | 3 |
| chr7:135048771 | p.V106I,CNOT4 | 2 |
| chr7:135106961 | p.G556W,CNOT4 | 2 |
| chr7:135047791 | p.P355Q,CNOT4 | 1 |
| chr7:135099147 | p.V113V,CNOT4 | 1 |
| chr7:135078728 | p.S574Y,CNOT4 | 1 |
| chr7:135122949 | p.R320R,CNOT4 | 1 |
| chr7:135080546 | p.V113I,CNOT4 | 1 |
| chr7:135047807 | p.G556V,CNOT4 | 1 |
| chr7:135099148 | p.N316T,CNOT4 | 1 |
| * Copy number data were extracted from TCGA using R package TCGA-Assembler. The URLs of all public data files on TCGA DCC data server were gathered on Jan-05-2015. Function ProcessCNAData in TCGA-Assembler package was used to obtain gene-level copy number value which is calculated as the average copy number of the genomic region of a gene. |
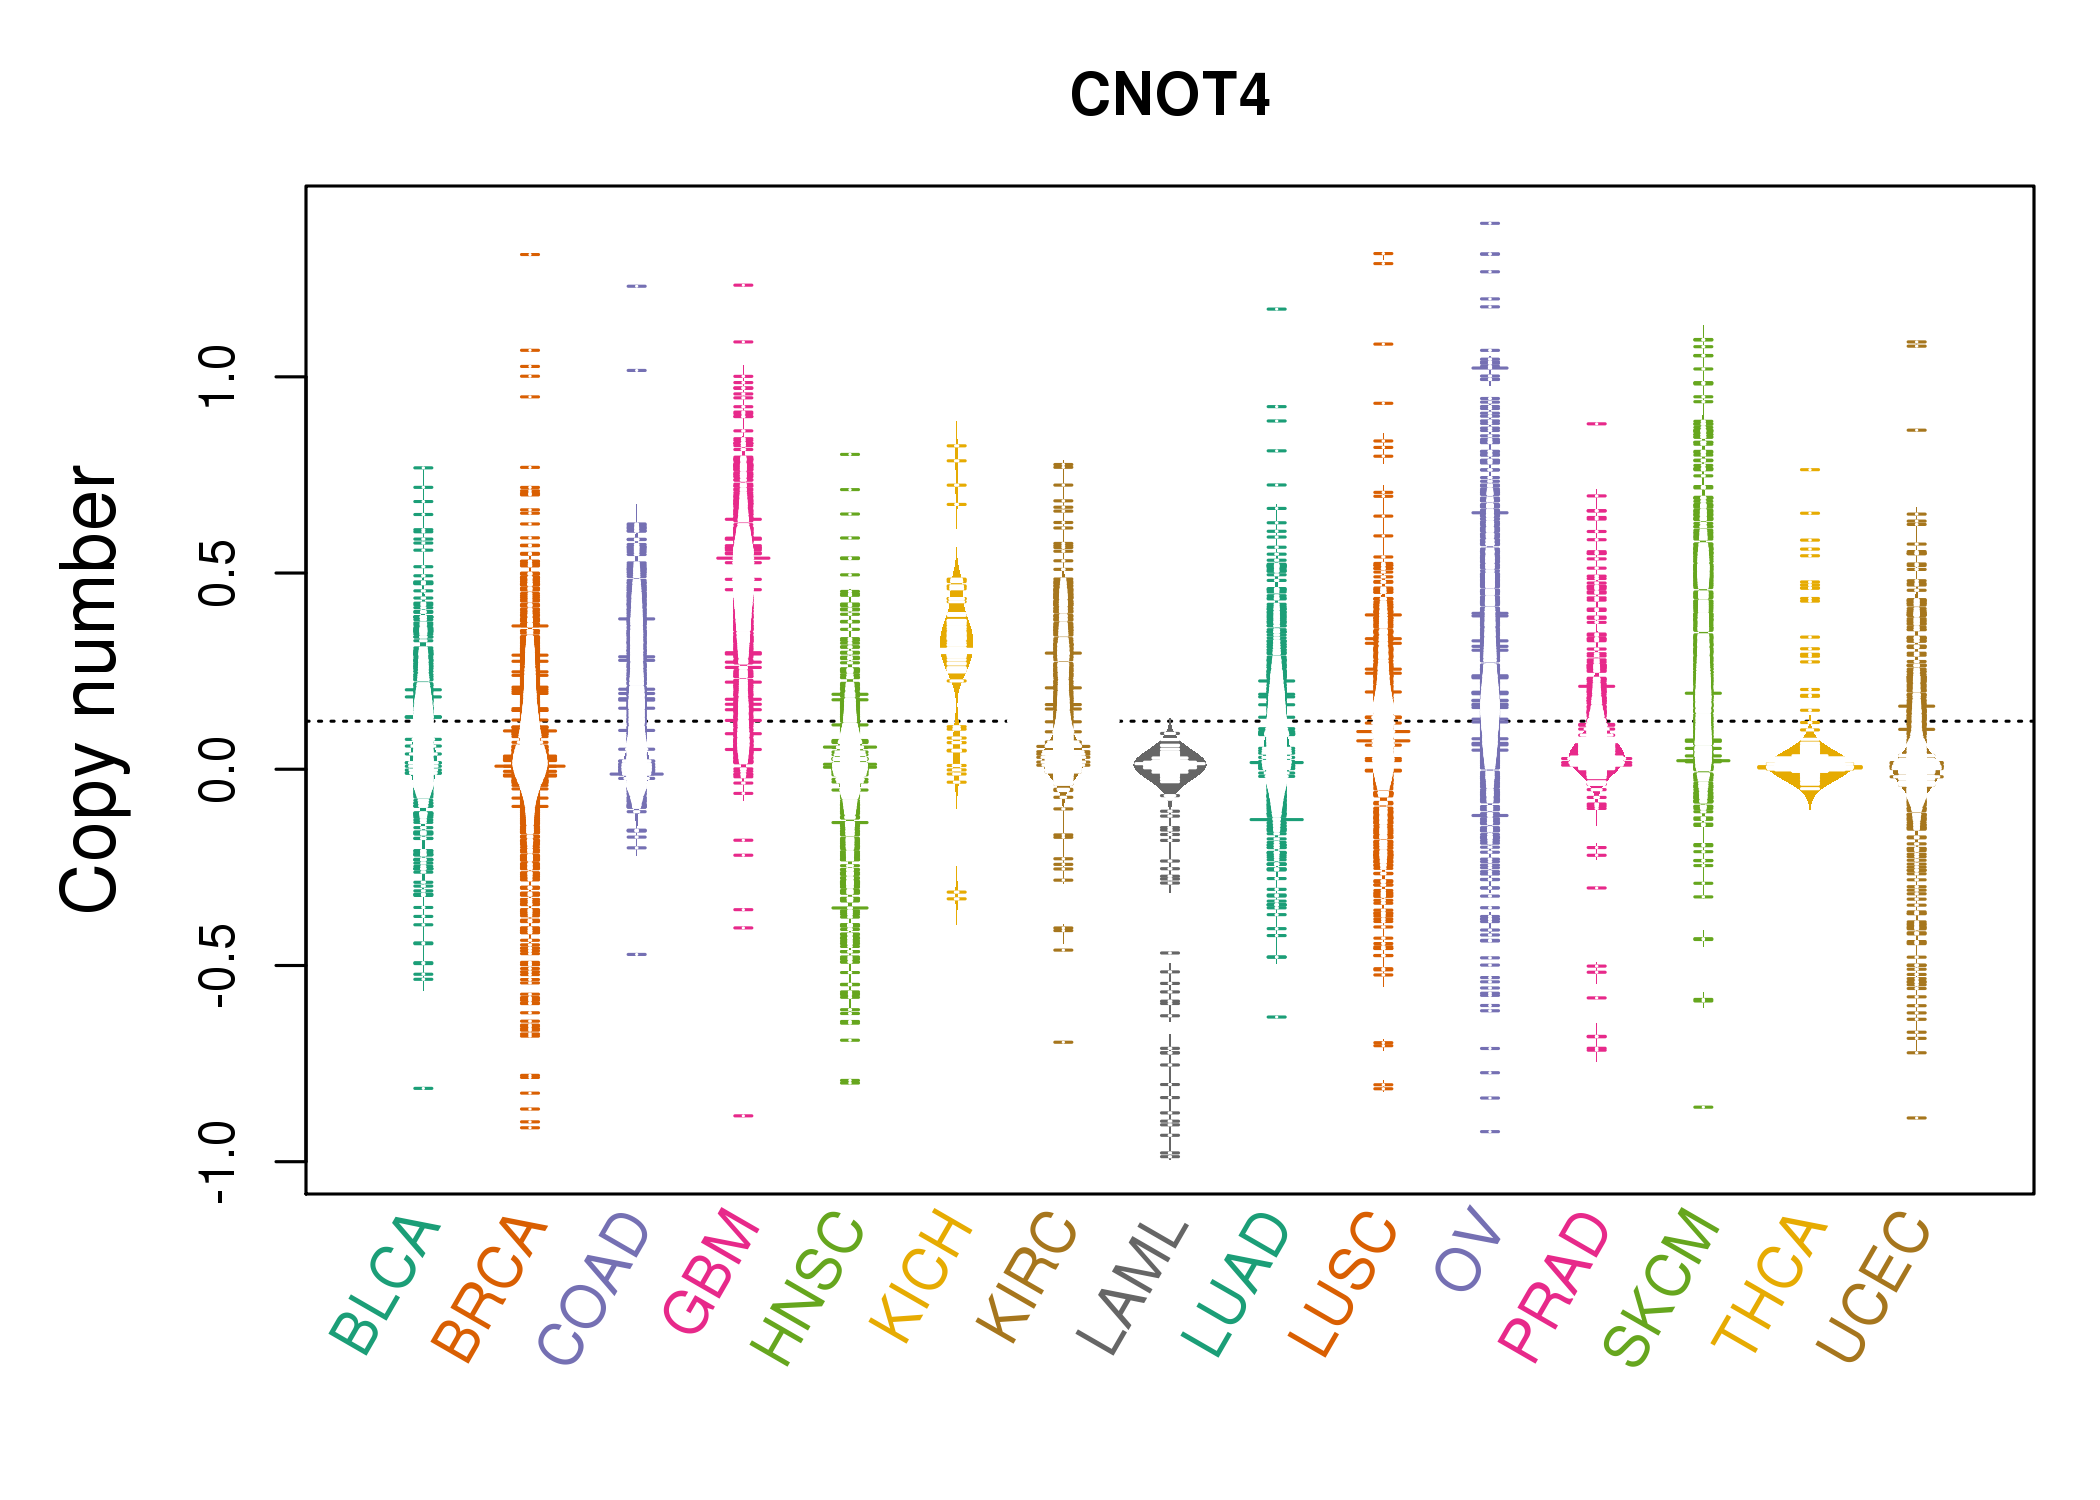 |
| cf) Tissue ID[Tissue type]: BLCA[Bladder Urothelial Carcinoma], BRCA[Breast invasive carcinoma], CESC[Cervical squamous cell carcinoma and endocervical adenocarcinoma], COAD[Colon adenocarcinoma], GBM[Glioblastoma multiforme], Glioma Low Grade, HNSC[Head and Neck squamous cell carcinoma], KICH[Kidney Chromophobe], KIRC[Kidney renal clear cell carcinoma], KIRP[Kidney renal papillary cell carcinoma], LAML[Acute Myeloid Leukemia], LUAD[Lung adenocarcinoma], LUSC[Lung squamous cell carcinoma], OV[Ovarian serous cystadenocarcinoma ], PAAD[Pancreatic adenocarcinoma], PRAD[Prostate adenocarcinoma], SKCM[Skin Cutaneous Melanoma], STAD[Stomach adenocarcinoma], THCA[Thyroid carcinoma], UCEC[Uterine Corpus Endometrial Carcinoma] |
| Top |
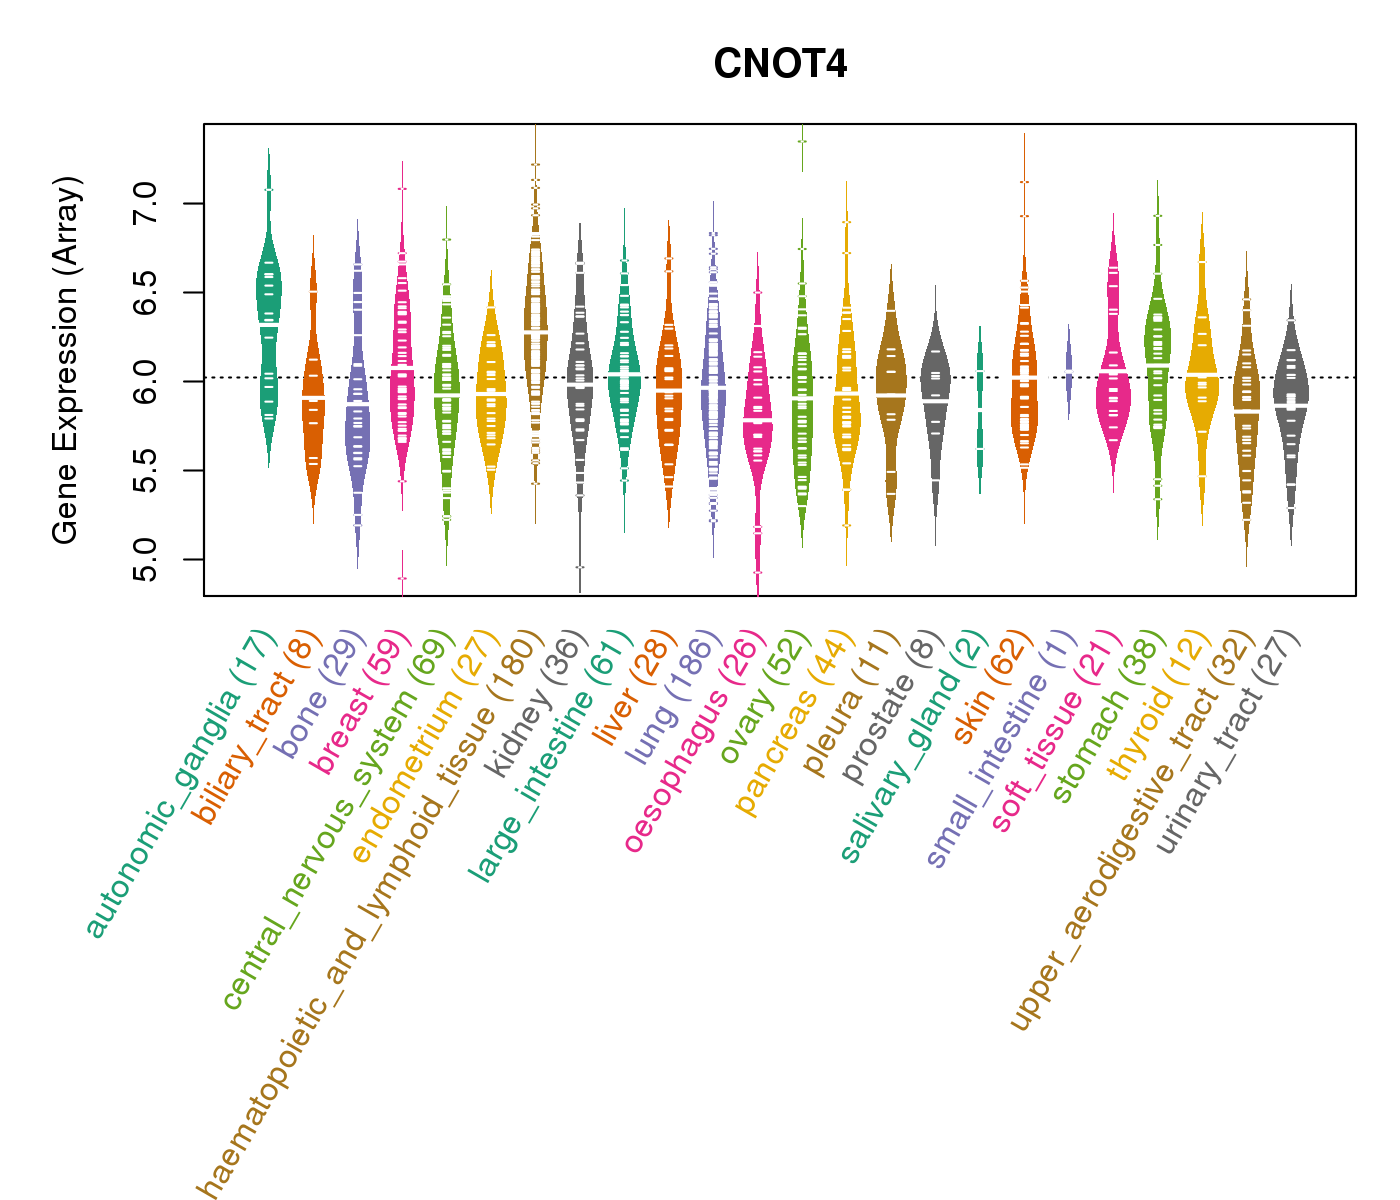
| Gene Expression for CNOT4 |
| * CCLE gene expression data were extracted from CCLE_Expression_Entrez_2012-10-18.res: Gene-centric RMA-normalized mRNA expression data. |
 |
| * Normalized gene expression data of RNASeqV2 was extracted from TCGA using R package TCGA-Assembler. The URLs of all public data files on TCGA DCC data server were gathered at Jan-05-2015. Only eight cancer types have enough normal control samples for differential expression analysis. (t test, adjusted p<0.05 (using Benjamini-Hochberg FDR)) |
 |
| Top |
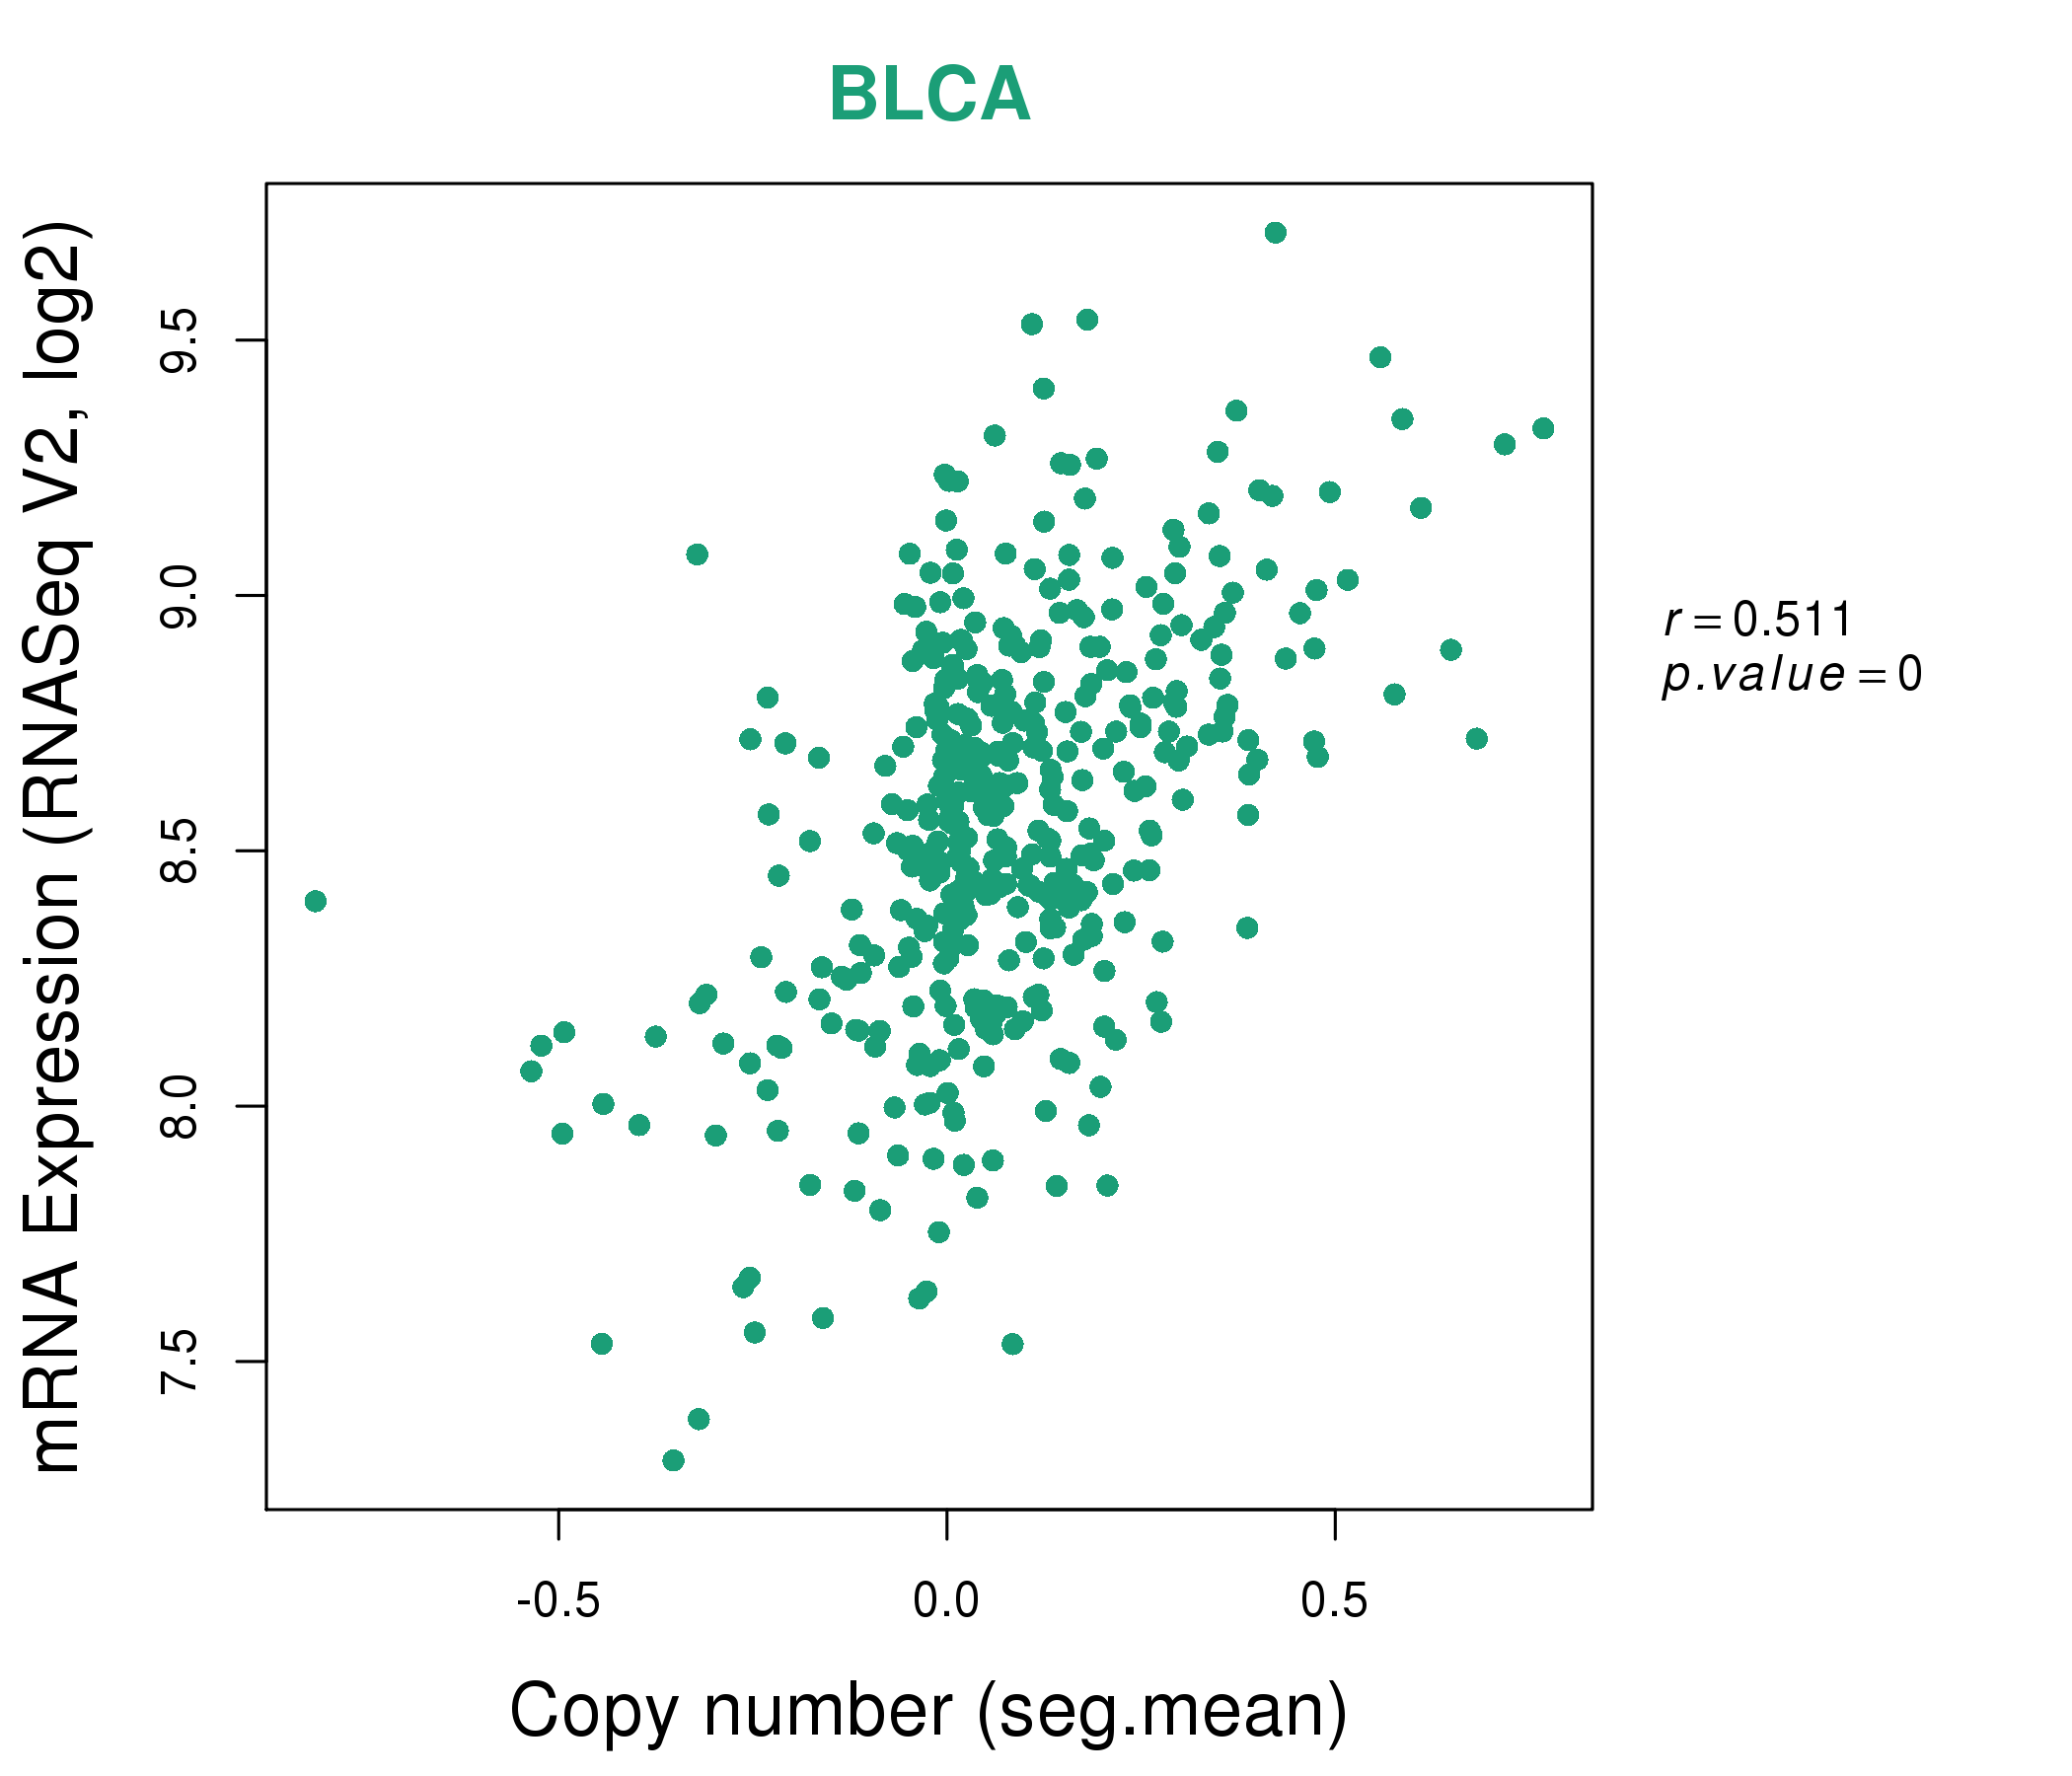
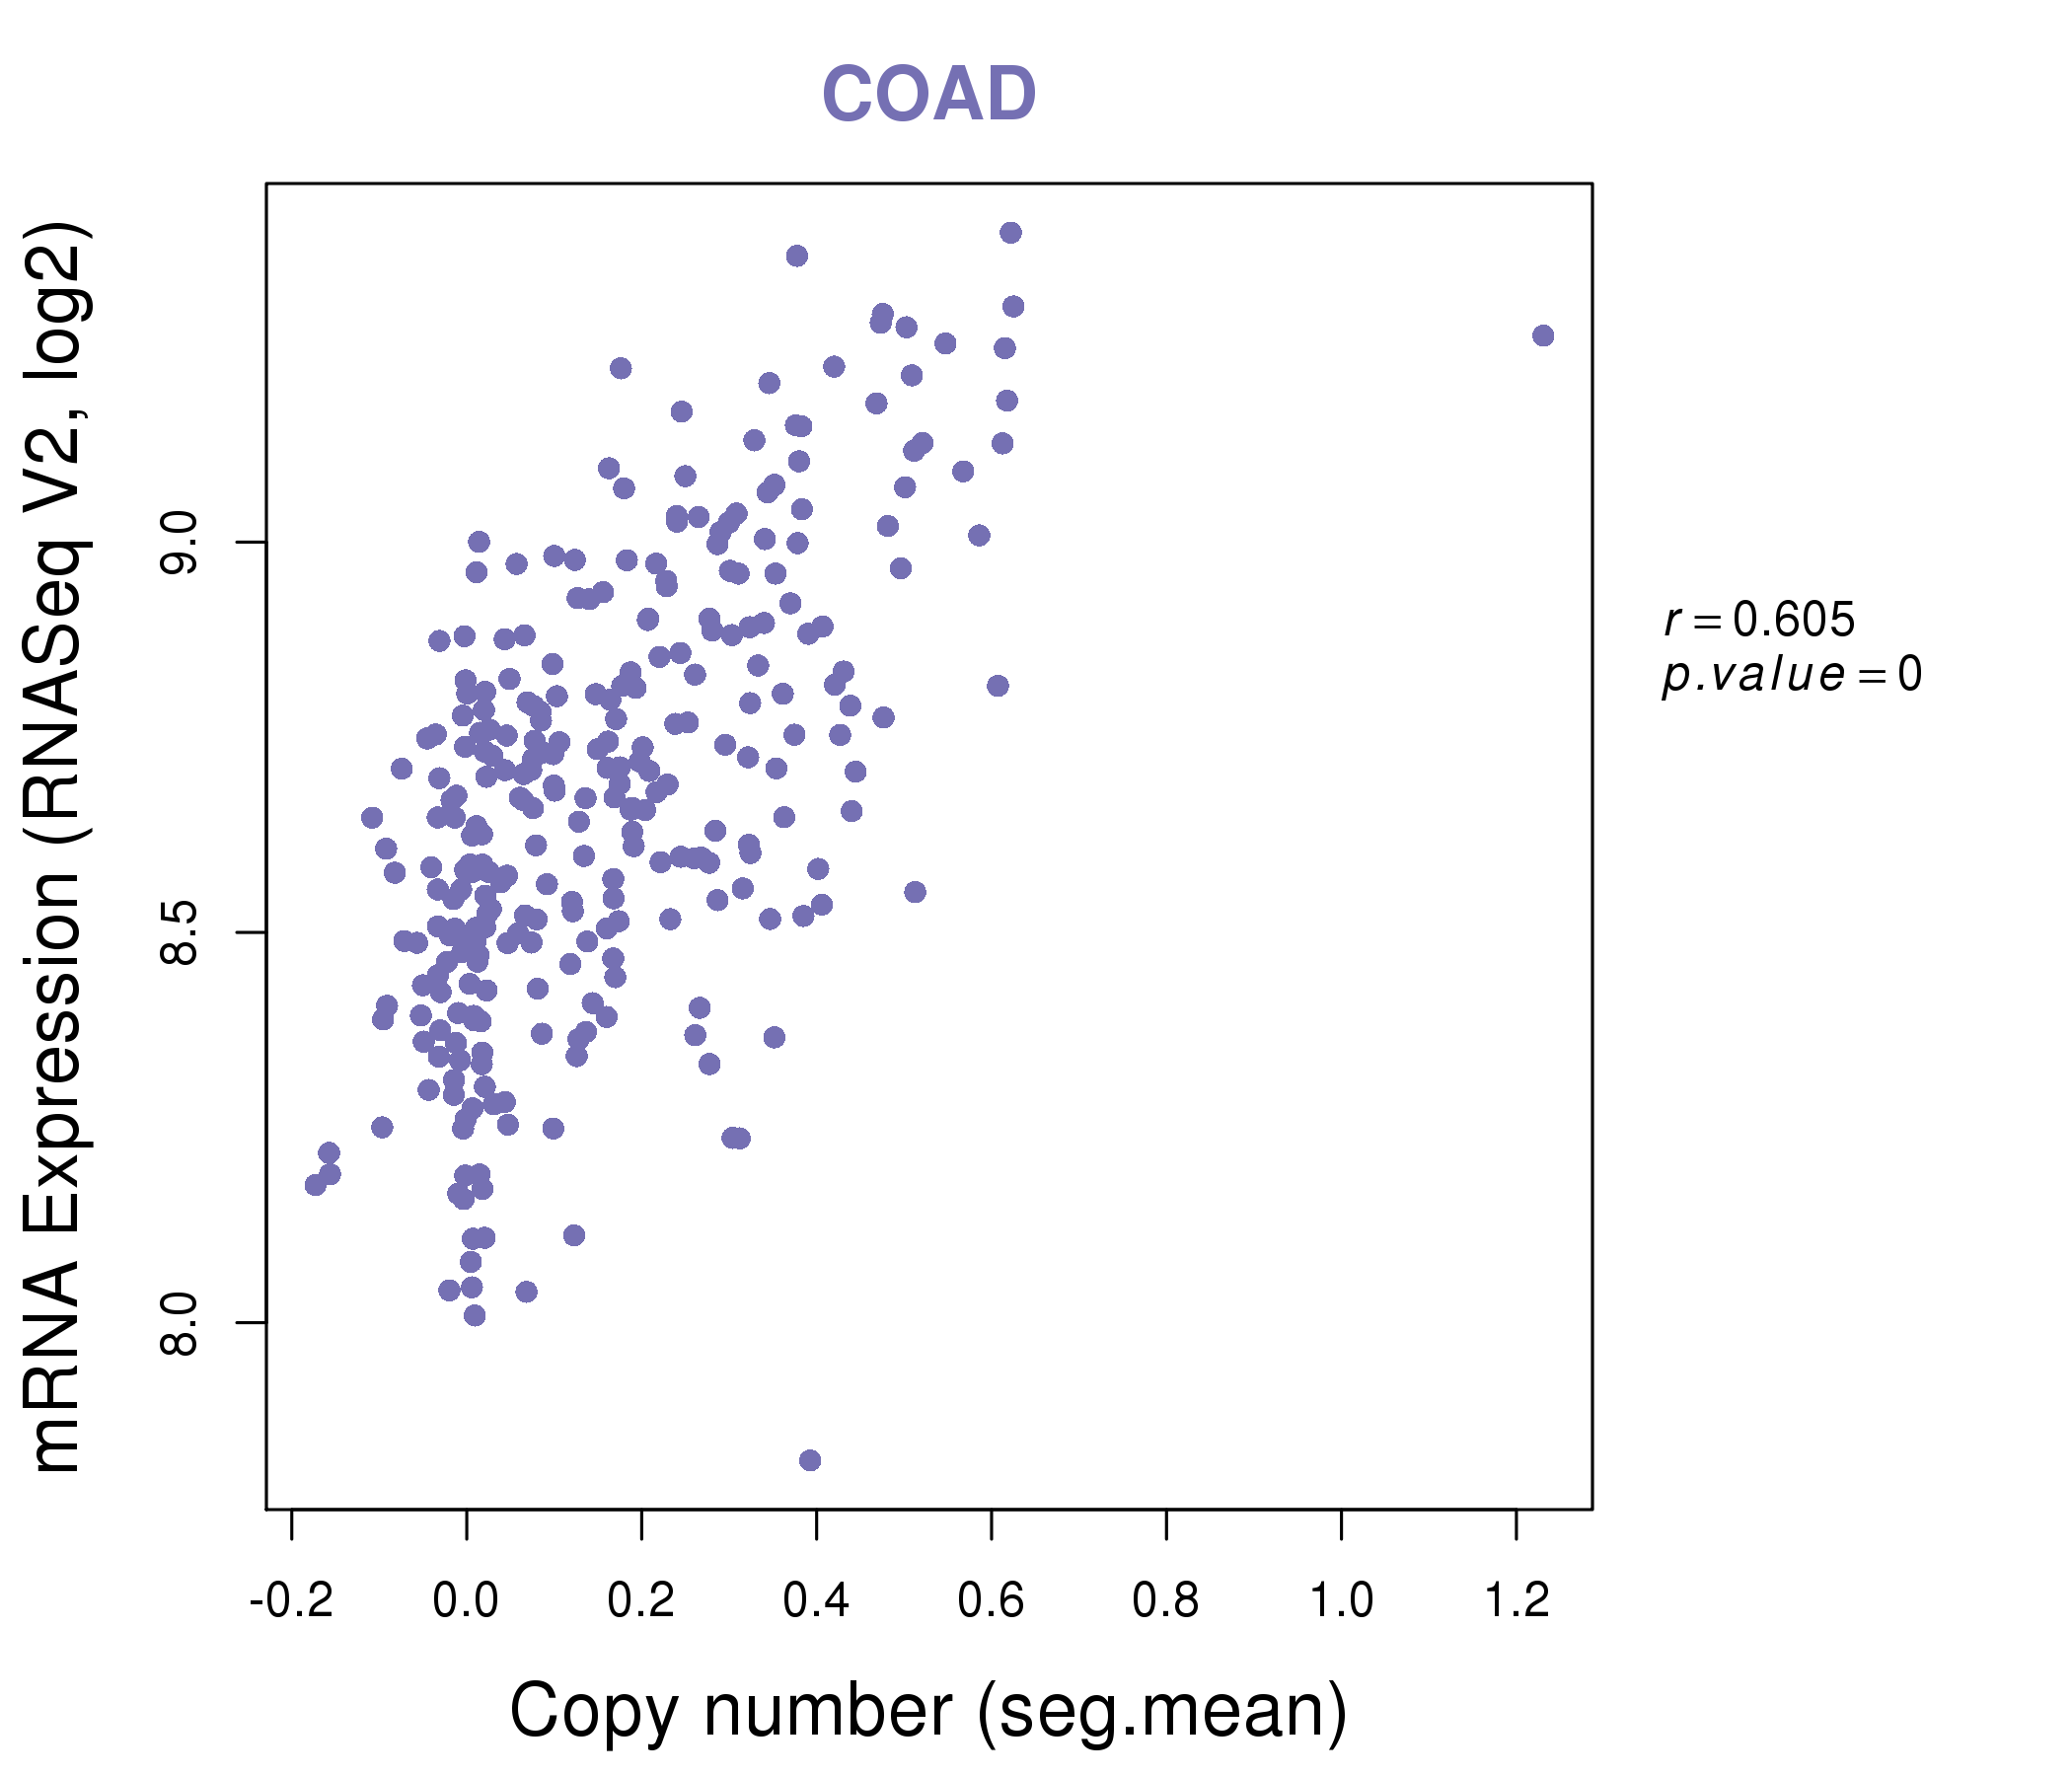
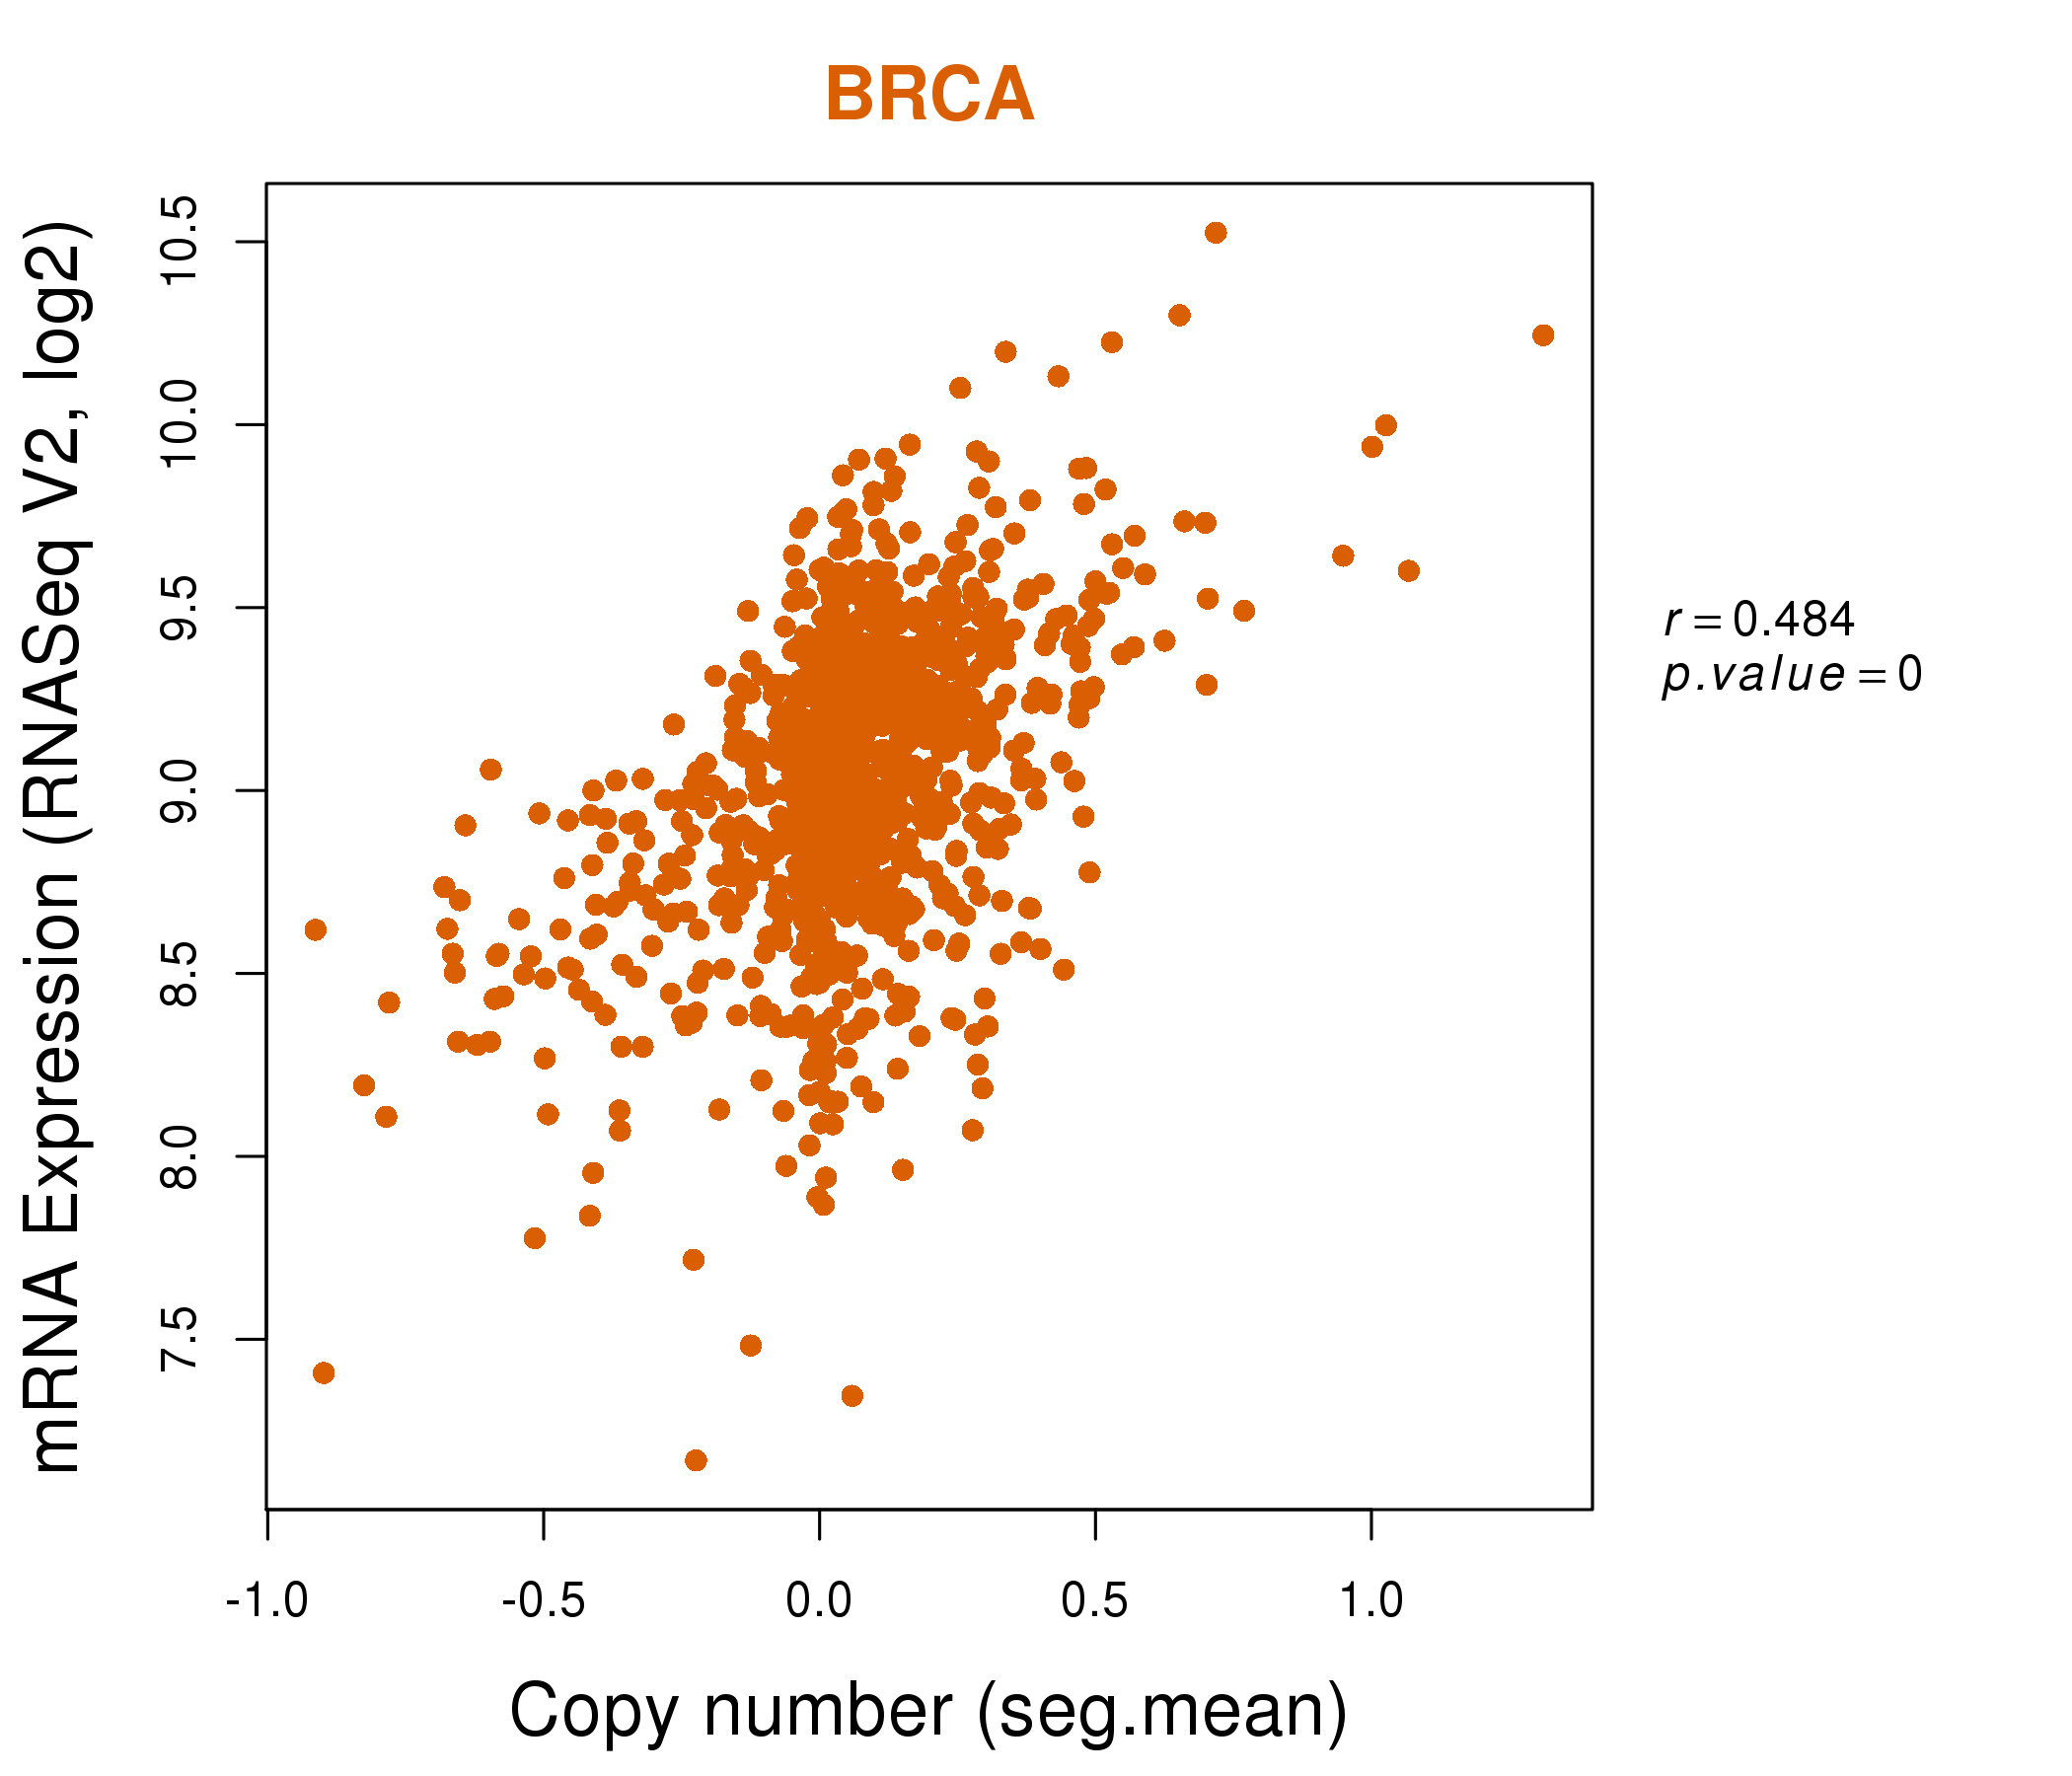
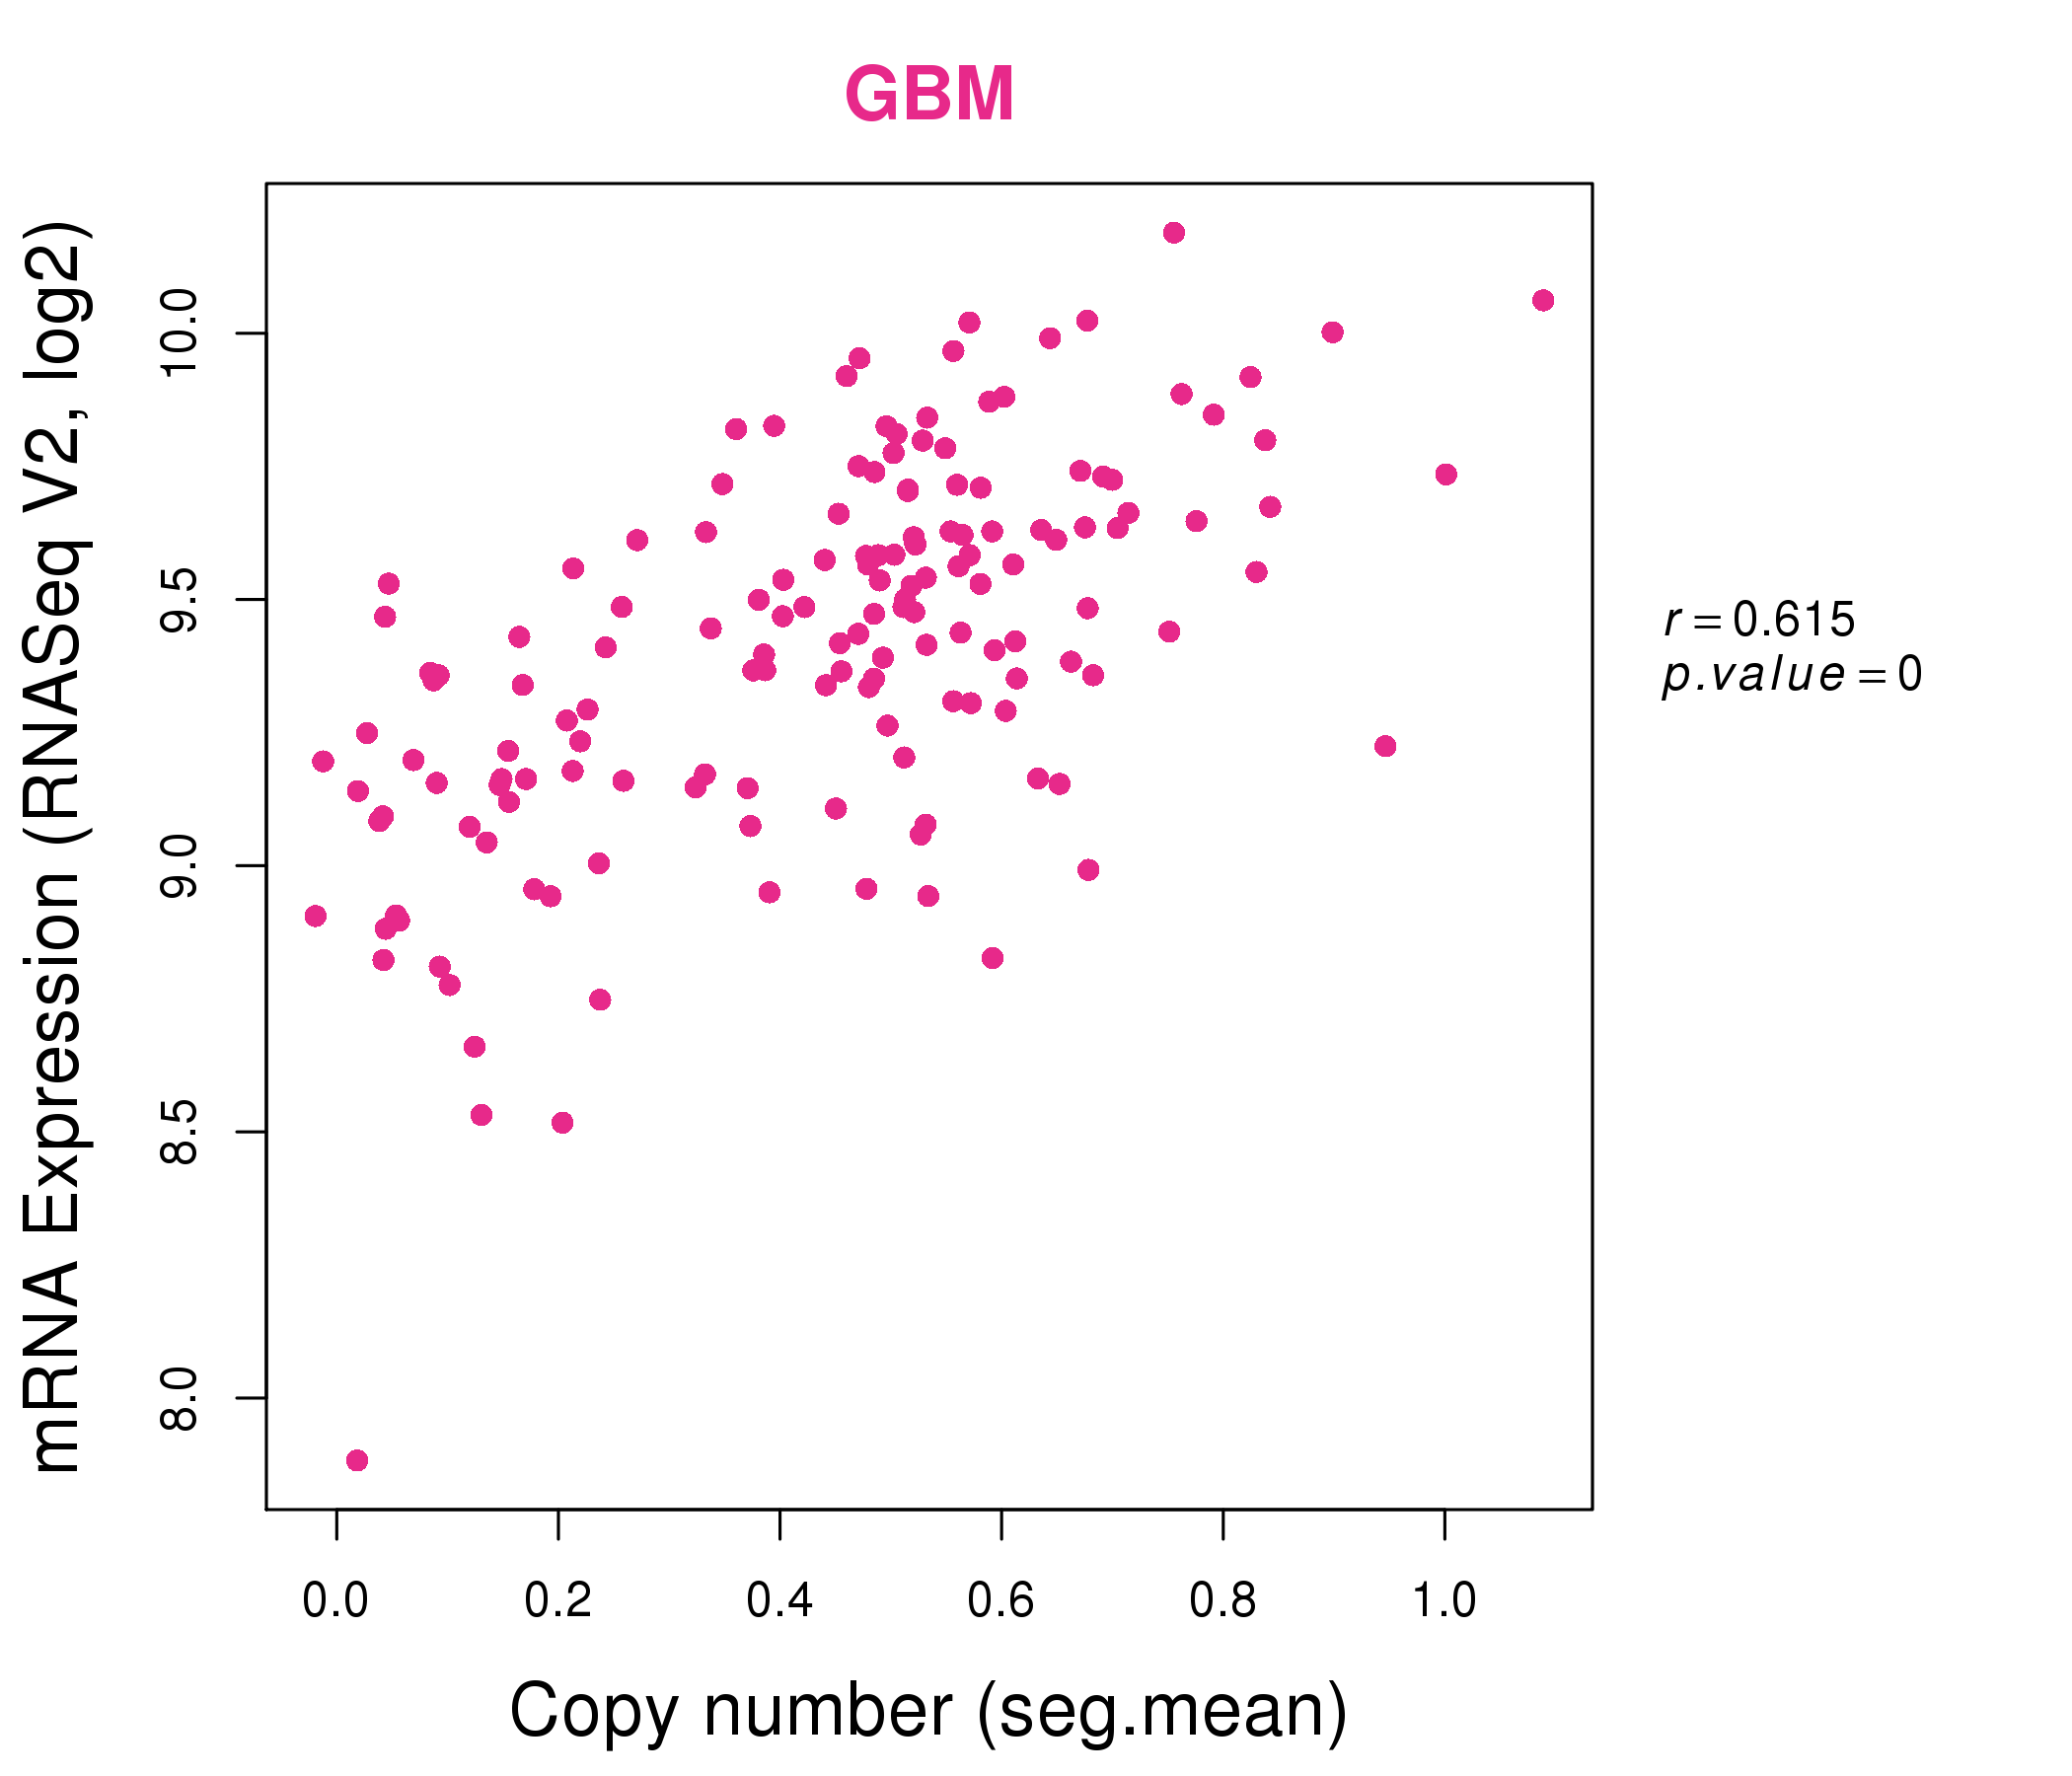
| * This plots show the correlation between CNV and gene expression. |
: Open all plots for all cancer types
 |
|
 |
|
| Top |
| Gene-Gene Network Information |
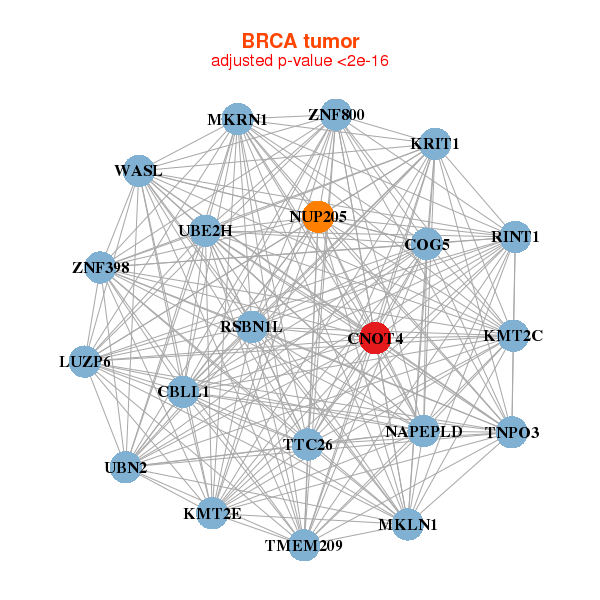
| * Co-Expression network figures were drawn using R package igraph. Only the top 20 genes with the highest correlations were shown. Red circle: input gene, orange circle: cell metabolism gene, sky circle: other gene |
: Open all plots for all cancer types
 |
|
| CBLL1,CNOT4,COG5,KRIT1,LUZP6,MKLN1,MKRN1, KMT2C,KMT2E,NAPEPLD,NUP205,RINT1,RSBN1L,TMEM209, TNPO3,TTC26,UBE2H,UBN2,WASL,ZNF398,ZNF800 | ARIH1,ARMC8,ATAD1,TRMT1L,CNOT4,DNAJC24,FAM175B, CCSER2,FBXW11,POLR2M___GCOM1,KLHL24,LOC221710,NAA30,PCMTD1, PPM1A,RCOR3,RPRD1A,SOS2,TAB2,TRIM23,TTC33 |
 |
|
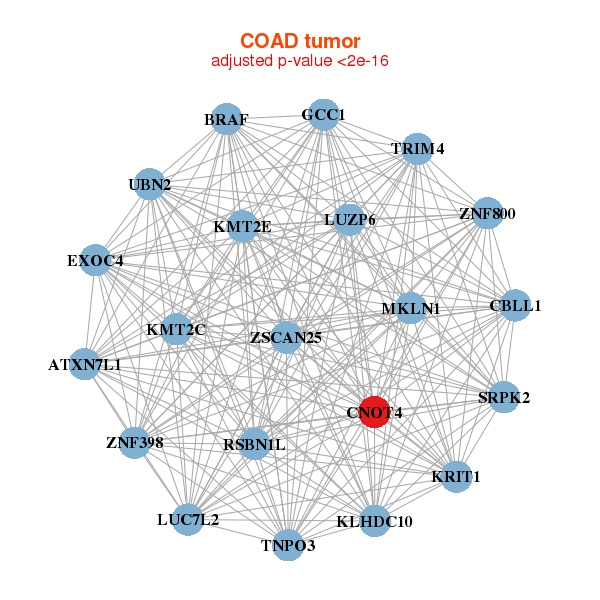
| ATXN7L1,BRAF,CBLL1,CNOT4,EXOC4,GCC1,KLHDC10, KRIT1,LUC7L2,LUZP6,MKLN1,KMT2C,KMT2E,RSBN1L, SRPK2,TNPO3,TRIM4,UBN2,ZNF398,ZSCAN25,ZNF800 | ARIH1,ASH1L,BAZ1B,CNOT4,DYNLL2,KIAA1429,KIDINS220, KPNA6,LRCH3,KMT2A,KAT7,PIK3R4,RAB3GAP1,RSF1, SETD1B,SNX27,UBR1,UBR5,ZNF37A,ZNF609,ZNF638 |

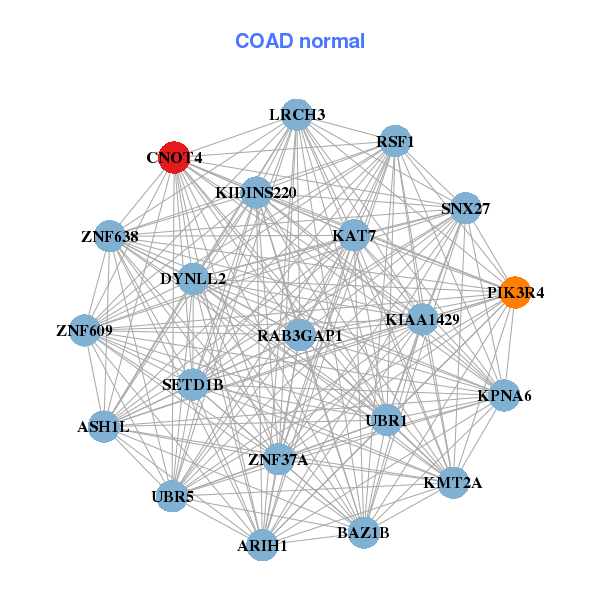
| * Co-Expression network figures were drawn using R package igraph. Only the top 20 genes with the highest correlations were shown. Red circle: input gene, orange circle: cell metabolism gene, sky circle: other gene |
: Open all plots for all cancer types
| Top |
: Open all interacting genes' information including KEGG pathway for all interacting genes from DAVID
| Top |
| Pharmacological Information for CNOT4 |
| There's no related Drug. |
| Top |
| Cross referenced IDs for CNOT4 |
| * We obtained these cross-references from Uniprot database. It covers 150 different DBs, 18 categories. http://www.uniprot.org/help/cross_references_section |
: Open all cross reference information
|
Copyright © 2016-Present - The Univsersity of Texas Health Science Center at Houston @ |