|
|||||||||||||||||||||||||||||||||||||||||||||||||||||||||||||||||||||||||||||||||||||||||||||||||||||||||||||||||||||||||||||||||||||||||||||||||||||||||||||||||||||||||||||||||||||||||||||||||||||||||||||||||||||||||||||||||||||||||||||||||||||||||||||||||||||||||||||||||||||||||||||||||||||||||||||||||||||||||||||||||||||||||||||||||||||||||
| |
| Phenotypic Information (metabolism pathway, cancer, disease, phenome) |
| |
| |
| Gene-Gene Network Information: Co-Expression Network, Interacting Genes & KEGG |
| |
|


| Gene Summary for PIK3C3 |
| Basic gene info. | Gene symbol | PIK3C3 |
| Gene name | phosphatidylinositol 3-kinase, catalytic subunit type 3 | |
| Synonyms | VPS34|hVps34 | |
| Cytomap | UCSC genome browser: 18q12.3 | |
| Genomic location | chr18 :39535198-39661446 | |
| Type of gene | protein-coding | |
| RefGenes | NM_002647.2, | |
| Ensembl id | ENSG00000078142 | |
| Description | PI3-kinase type 3PI3K type 3PtdIns-3-kinase type 3phosphatidylinositol 3-kinase catalytic subunit type 3phosphatidylinositol 3-kinase p100 subunitphosphoinositide-3-kinase, class 3 | |
| Modification date | 20141207 | |
| dbXrefs | MIM : 602609 | |
| HGNC : HGNC | ||
| HPRD : 04009 | ||
| Protein | UniProt: Q8NEB9 go to UniProt's Cross Reference DB Table | |
| Expression | CleanEX: HS_PIK3C3 | |
| BioGPS: 5289 | ||
| Gene Expression Atlas: ENSG00000078142 | ||
| The Human Protein Atlas: ENSG00000078142 | ||
| Pathway | NCI Pathway Interaction Database: PIK3C3 | |
| KEGG: PIK3C3 | ||
| REACTOME: PIK3C3 | ||
| ConsensusPathDB | ||
| Pathway Commons: PIK3C3 | ||
| Metabolism | MetaCyc: PIK3C3 | |
| HUMANCyc: PIK3C3 | ||
| Regulation | Ensembl's Regulation: ENSG00000078142 | |
| miRBase: chr18 :39,535,198-39,661,446 | ||
| TargetScan: NM_002647 | ||
| cisRED: ENSG00000078142 | ||
| Context | iHOP: PIK3C3 | |
| cancer metabolism search in PubMed: PIK3C3 | ||
| UCL Cancer Institute: PIK3C3 | ||
| Assigned class in ccmGDB | A - This gene has a literature evidence and it belongs to cancer gene. | |
| References showing role of PIK3C3 in cancer cell metabolism | 1. Zhao X-J, Zhuo H (2014) ECR-MAPK Regulation in Liver Early Development. BioMed research international. go to article | |
| Top |
| Phenotypic Information for PIK3C3(metabolism pathway, cancer, disease, phenome) |
| Cancer | CGAP: PIK3C3 |
| Familial Cancer Database: PIK3C3 | |
| * This gene is included in those cancer gene databases. |
|
|
|
|
|
|
| |||||||||||||||||||||||||||||||||||||||||||||||||||||||||||||||||||||||||||||||||||||||||||||||||||||||||||||||||||||||||||||||||||||||||||||||||||||||||||||||||||||||||||||||||||||||||||||||||||||||||||||||||||||||||||||||||||||||||||||||||||||||||||||||||||||||||||||||||||||||||||||||||||||||||||||||||||||||||||||||||||||||||||||||||||
Oncogene 1 | Significant driver gene in | ||||||||||||||||||||||||||||||||||||||||||||||||||||||||||||||||||||||||||||||||||||||||||||||||||||||||||||||||||||||||||||||||||||||||||||||||||||||||||||||||||||||||||||||||||||||||||||||||||||||||||||||||||||||||||||||||||||||||||||||||||||||||||||||||||||||||||||||||||||||||||||||||||||||||||||||||||||||||||||||||||||||||||||||||||||||||
| cf) number; DB name 1 Oncogene; http://nar.oxfordjournals.org/content/35/suppl_1/D721.long, 2 Tumor Suppressor gene; https://bioinfo.uth.edu/TSGene/, 3 Cancer Gene Census; http://www.nature.com/nrc/journal/v4/n3/abs/nrc1299.html, 4 CancerGenes; http://nar.oxfordjournals.org/content/35/suppl_1/D721.long, 5 Network of Cancer Gene; http://ncg.kcl.ac.uk/index.php, 1Therapeutic Vulnerabilities in Cancer; http://cbio.mskcc.org/cancergenomics/statius/ |
| KEGG_INOSITOL_PHOSPHATE_METABOLISM REACTOME_PHOSPHOLIPID_METABOLISM REACTOME_PI_METABOLISM REACTOME_METABOLISM_OF_LIPIDS_AND_LIPOPROTEINS | |
| OMIM | 602609; gene. |
| Orphanet | |
| Disease | KEGG Disease: PIK3C3 |
| MedGen: PIK3C3 (Human Medical Genetics with Condition) | |
| ClinVar: PIK3C3 | |
| Phenotype | MGI: PIK3C3 (International Mouse Phenotyping Consortium) |
| PhenomicDB: PIK3C3 | |
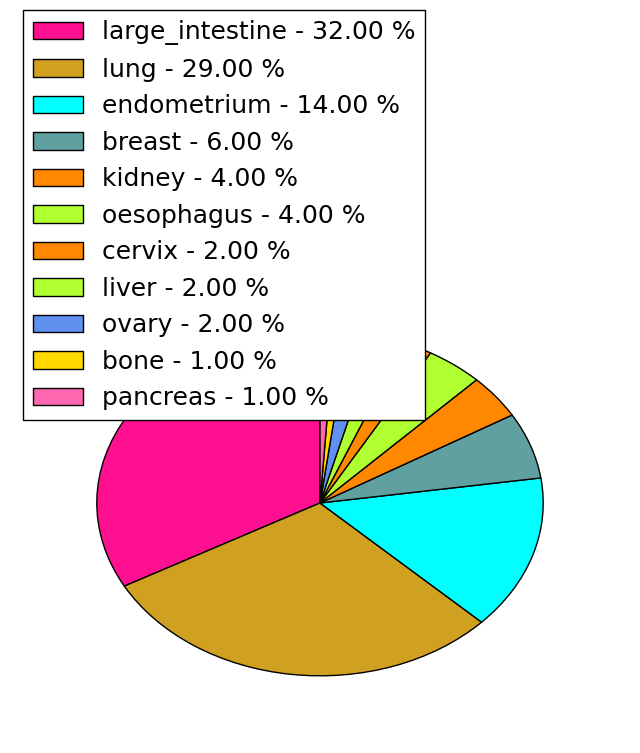
| Mutations for PIK3C3 |
| * Under tables are showing count per each tissue to give us broad intuition about tissue specific mutation patterns.You can go to the detailed page for each mutation database's web site. |
| - Statistics for Tissue and Mutation type | Top |
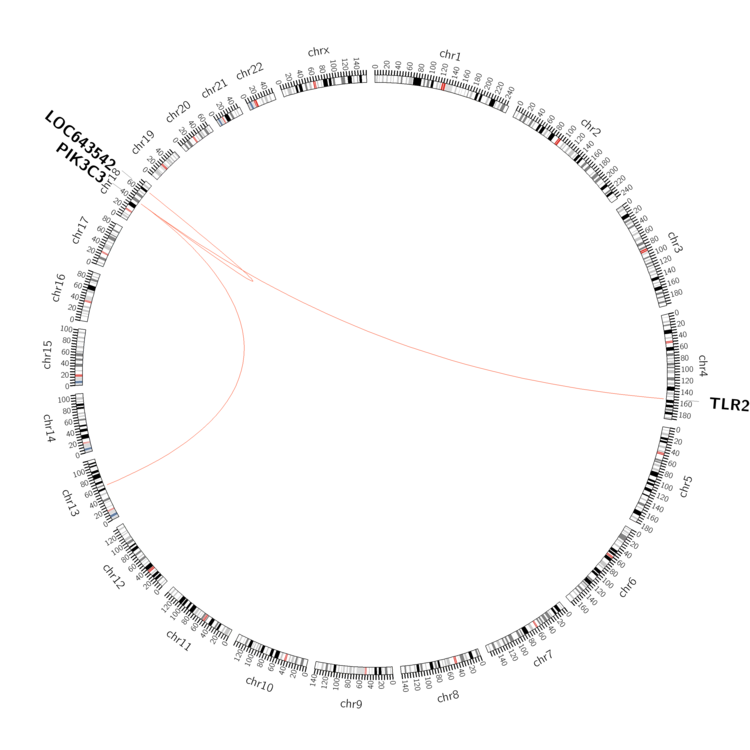 |
| - For Inter-chromosomal Variations |
| * Inter-chromosomal variantions includes 'interchromosomal amplicon to amplicon', 'interchromosomal amplicon to non-amplified dna', 'interchromosomal insertion', 'Interchromosomal unknown type'. |
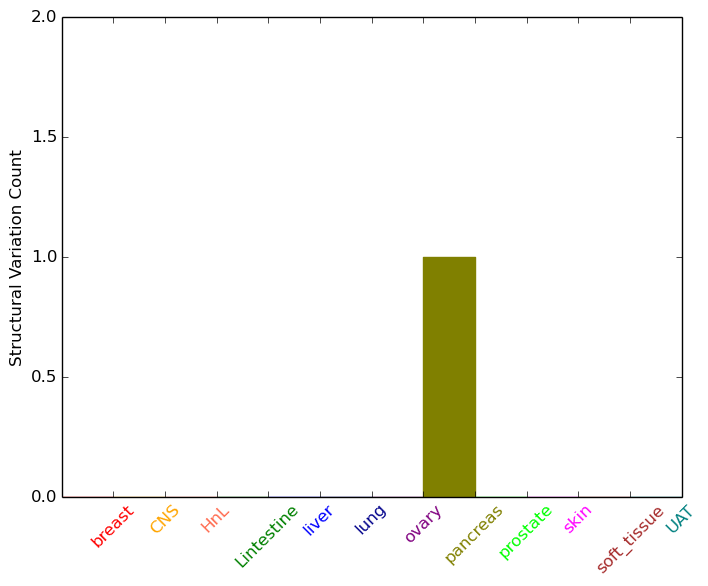 |
| - For Intra-chromosomal Variations |
| * Intra-chromosomal variantions includes 'intrachromosomal amplicon to amplicon', 'intrachromosomal amplicon to non-amplified dna', 'intrachromosomal deletion', 'intrachromosomal fold-back inversion', 'intrachromosomal inversion', 'intrachromosomal tandem duplication', 'Intrachromosomal unknown type', 'intrachromosomal with inverted orientation', 'intrachromosomal with non-inverted orientation'. |
 |
| Sample | Symbol_a | Chr_a | Start_a | End_a | Symbol_b | Chr_b | Start_b | End_b |
| NS | PIK3C3 | chr18 | 39633392 | 39633392 | TLR2 | chr4 | 154611152 | 154611152 |
| pancreas | PIK3C3 | chr18 | 39604230 | 39604250 | LOC643542 | chr18 | 65438483 | 65438503 |
| pancreas | PIK3C3 | chr18 | 39649532 | 39649552 | chr13 | 62641163 | 62641183 |
| cf) Tissue number; Tissue name (1;Breast, 2;Central_nervous_system, 3;Haematopoietic_and_lymphoid_tissue, 4;Large_intestine, 5;Liver, 6;Lung, 7;Ovary, 8;Pancreas, 9;Prostate, 10;Skin, 11;Soft_tissue, 12;Upper_aerodigestive_tract) |
| * From mRNA Sanger sequences, Chitars2.0 arranged chimeric transcripts. This table shows PIK3C3 related fusion information. |
| ID | Head Gene | Tail Gene | Accession | Gene_a | qStart_a | qEnd_a | Chromosome_a | tStart_a | tEnd_a | Gene_a | qStart_a | qEnd_a | Chromosome_a | tStart_a | tEnd_a |
| DW414072 | PIK3C3 | 18 | 210 | 18 | 39535227 | 39542478 | DAB2 | 206 | 317 | 5 | 39375145 | 39376168 | |
| CB124531 | PIK3C3 | 30 | 630 | 18 | 39637909 | 39661363 | LOC100132273 | 624 | 692 | 22 | 42504846 | 42504914 | |
| Top |
| Mutation type/ Tissue ID | brca | cns | cerv | endome | haematopo | kidn | Lintest | liver | lung | ns | ovary | pancre | prost | skin | stoma | thyro | urina | |||
| Total # sample | 1 | 1 | ||||||||||||||||||
| GAIN (# sample) | 1 | 1 | ||||||||||||||||||
| LOSS (# sample) |
| cf) Tissue ID; Tissue type (1; Breast, 2; Central_nervous_system, 3; Cervix, 4; Endometrium, 5; Haematopoietic_and_lymphoid_tissue, 6; Kidney, 7; Large_intestine, 8; Liver, 9; Lung, 10; NS, 11; Ovary, 12; Pancreas, 13; Prostate, 14; Skin, 15; Stomach, 16; Thyroid, 17; Urinary_tract) |
| Top |
|
 |
| Top |
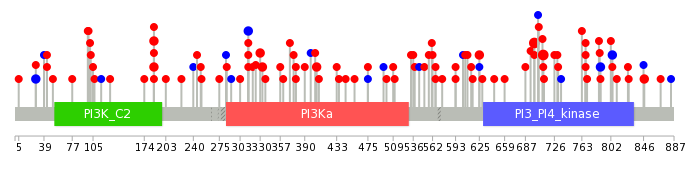
| Stat. for Non-Synonymous SNVs (# total SNVs=97) | (# total SNVs=14) |
 | 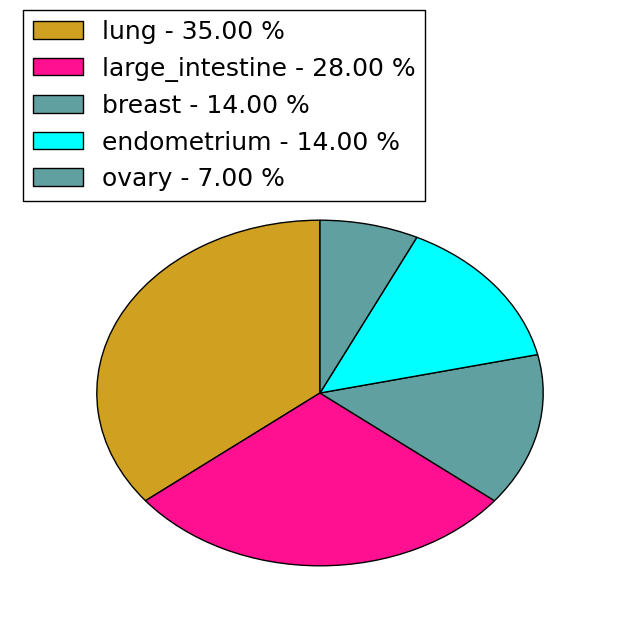 |
(# total SNVs=3) | (# total SNVs=1) |
 | 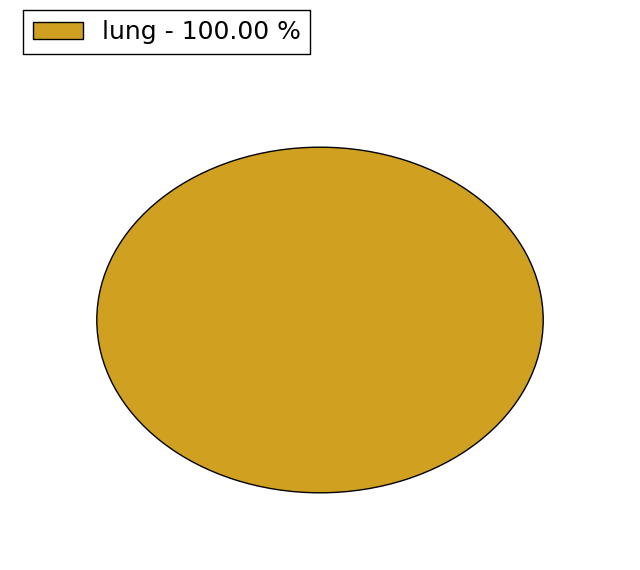 |
| Top |
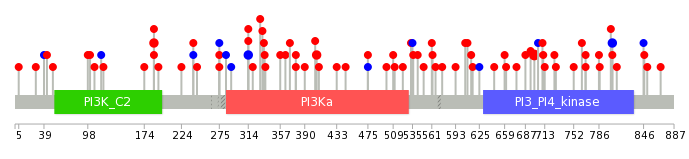
| * When you move the cursor on each content, you can see more deailed mutation information on the Tooltip. Those are primary_site,primary_histology,mutation(aa),pubmedID. |
| GRCh37 position | Mutation(aa) | Unique sampleID count |
| chr18:39570422-39570422 | p.? | 21 |
| chr18:39620697-39620697 | p.S699G | 4 |
| chr18:39623726-39623726 | p.E711D | 3 |
| chr18:39567803-39567803 | p.M187L | 3 |
| chr18:39637995-39637995 | p.T804T | 2 |
| chr18:39617690-39617690 | p.T625M | 2 |
| chr18:39576650-39576650 | p.D314N | 2 |
| chr18:39637886-39637886 | p.R768L | 2 |
| chr18:39576652-39576652 | p.D314D | 2 |
| chr18:39647348-39647348 | p.? | 2 |
| Top |
|
 |
| Point Mutation/ Tissue ID | 1 | 2 | 3 | 4 | 5 | 6 | 7 | 8 | 9 | 10 | 11 | 12 | 13 | 14 | 15 | 16 | 17 | 18 | 19 | 20 |
| # sample | 5 | 2 | 2 | 27 | 4 | 2 | 3 | 12 | 3 | 3 | 5 | 8 | 11 | |||||||
| # mutation | 5 | 2 | 2 | 23 | 4 | 2 | 3 | 13 | 3 | 3 | 5 | 10 | 16 | |||||||
| nonsynonymous SNV | 5 | 2 | 2 | 20 | 3 | 2 | 3 | 10 | 3 | 2 | 3 | 9 | 14 | |||||||
| synonymous SNV | 3 | 1 | 3 | 1 | 2 | 1 | 2 |
| cf) Tissue ID; Tissue type (1; BLCA[Bladder Urothelial Carcinoma], 2; BRCA[Breast invasive carcinoma], 3; CESC[Cervical squamous cell carcinoma and endocervical adenocarcinoma], 4; COAD[Colon adenocarcinoma], 5; GBM[Glioblastoma multiforme], 6; Glioma Low Grade, 7; HNSC[Head and Neck squamous cell carcinoma], 8; KICH[Kidney Chromophobe], 9; KIRC[Kidney renal clear cell carcinoma], 10; KIRP[Kidney renal papillary cell carcinoma], 11; LAML[Acute Myeloid Leukemia], 12; LUAD[Lung adenocarcinoma], 13; LUSC[Lung squamous cell carcinoma], 14; OV[Ovarian serous cystadenocarcinoma ], 15; PAAD[Pancreatic adenocarcinoma], 16; PRAD[Prostate adenocarcinoma], 17; SKCM[Skin Cutaneous Melanoma], 18:STAD[Stomach adenocarcinoma], 19:THCA[Thyroid carcinoma], 20:UCEC[Uterine Corpus Endometrial Carcinoma]) |
| Top |
| * We represented just top 10 SNVs. When you move the cursor on each content, you can see more deailed mutation information on the Tooltip. Those are primary_site, primary_histology, mutation(aa), pubmedID. |
| Genomic Position | Mutation(aa) | Unique sampleID count |
| chr18:39620697 | p.S699G | 4 |
| chr18:39575890 | p.R275R | 3 |
| chr18:39593453 | p.E406D | 2 |
| chr18:39637995 | p.D314D | 2 |
| chr18:39567805 | p.M187I | 2 |
| chr18:39576652 | p.T804T | 2 |
| chr18:39537617 | p.F846F | 1 |
| chr18:39584503 | p.P101H | 1 |
| chr18:39620682 | p.D314N | 1 |
| chr18:39570474 | p.E562K | 1 |
| * Copy number data were extracted from TCGA using R package TCGA-Assembler. The URLs of all public data files on TCGA DCC data server were gathered on Jan-05-2015. Function ProcessCNAData in TCGA-Assembler package was used to obtain gene-level copy number value which is calculated as the average copy number of the genomic region of a gene. |
 |
| cf) Tissue ID[Tissue type]: BLCA[Bladder Urothelial Carcinoma], BRCA[Breast invasive carcinoma], CESC[Cervical squamous cell carcinoma and endocervical adenocarcinoma], COAD[Colon adenocarcinoma], GBM[Glioblastoma multiforme], Glioma Low Grade, HNSC[Head and Neck squamous cell carcinoma], KICH[Kidney Chromophobe], KIRC[Kidney renal clear cell carcinoma], KIRP[Kidney renal papillary cell carcinoma], LAML[Acute Myeloid Leukemia], LUAD[Lung adenocarcinoma], LUSC[Lung squamous cell carcinoma], OV[Ovarian serous cystadenocarcinoma ], PAAD[Pancreatic adenocarcinoma], PRAD[Prostate adenocarcinoma], SKCM[Skin Cutaneous Melanoma], STAD[Stomach adenocarcinoma], THCA[Thyroid carcinoma], UCEC[Uterine Corpus Endometrial Carcinoma] |
| Top |
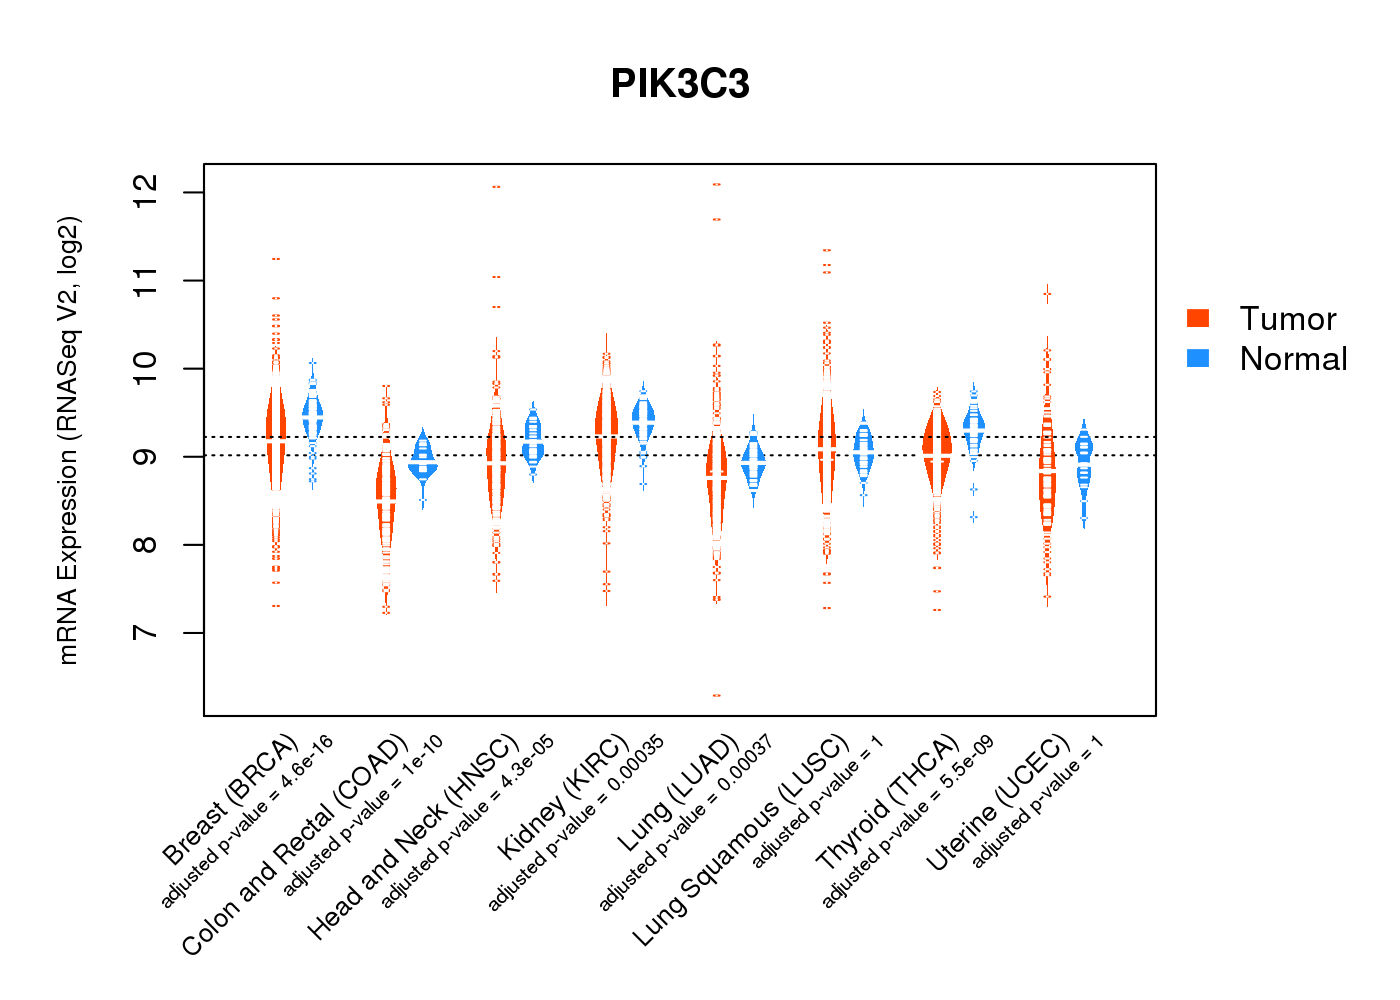
| Gene Expression for PIK3C3 |
| * CCLE gene expression data were extracted from CCLE_Expression_Entrez_2012-10-18.res: Gene-centric RMA-normalized mRNA expression data. |
 |
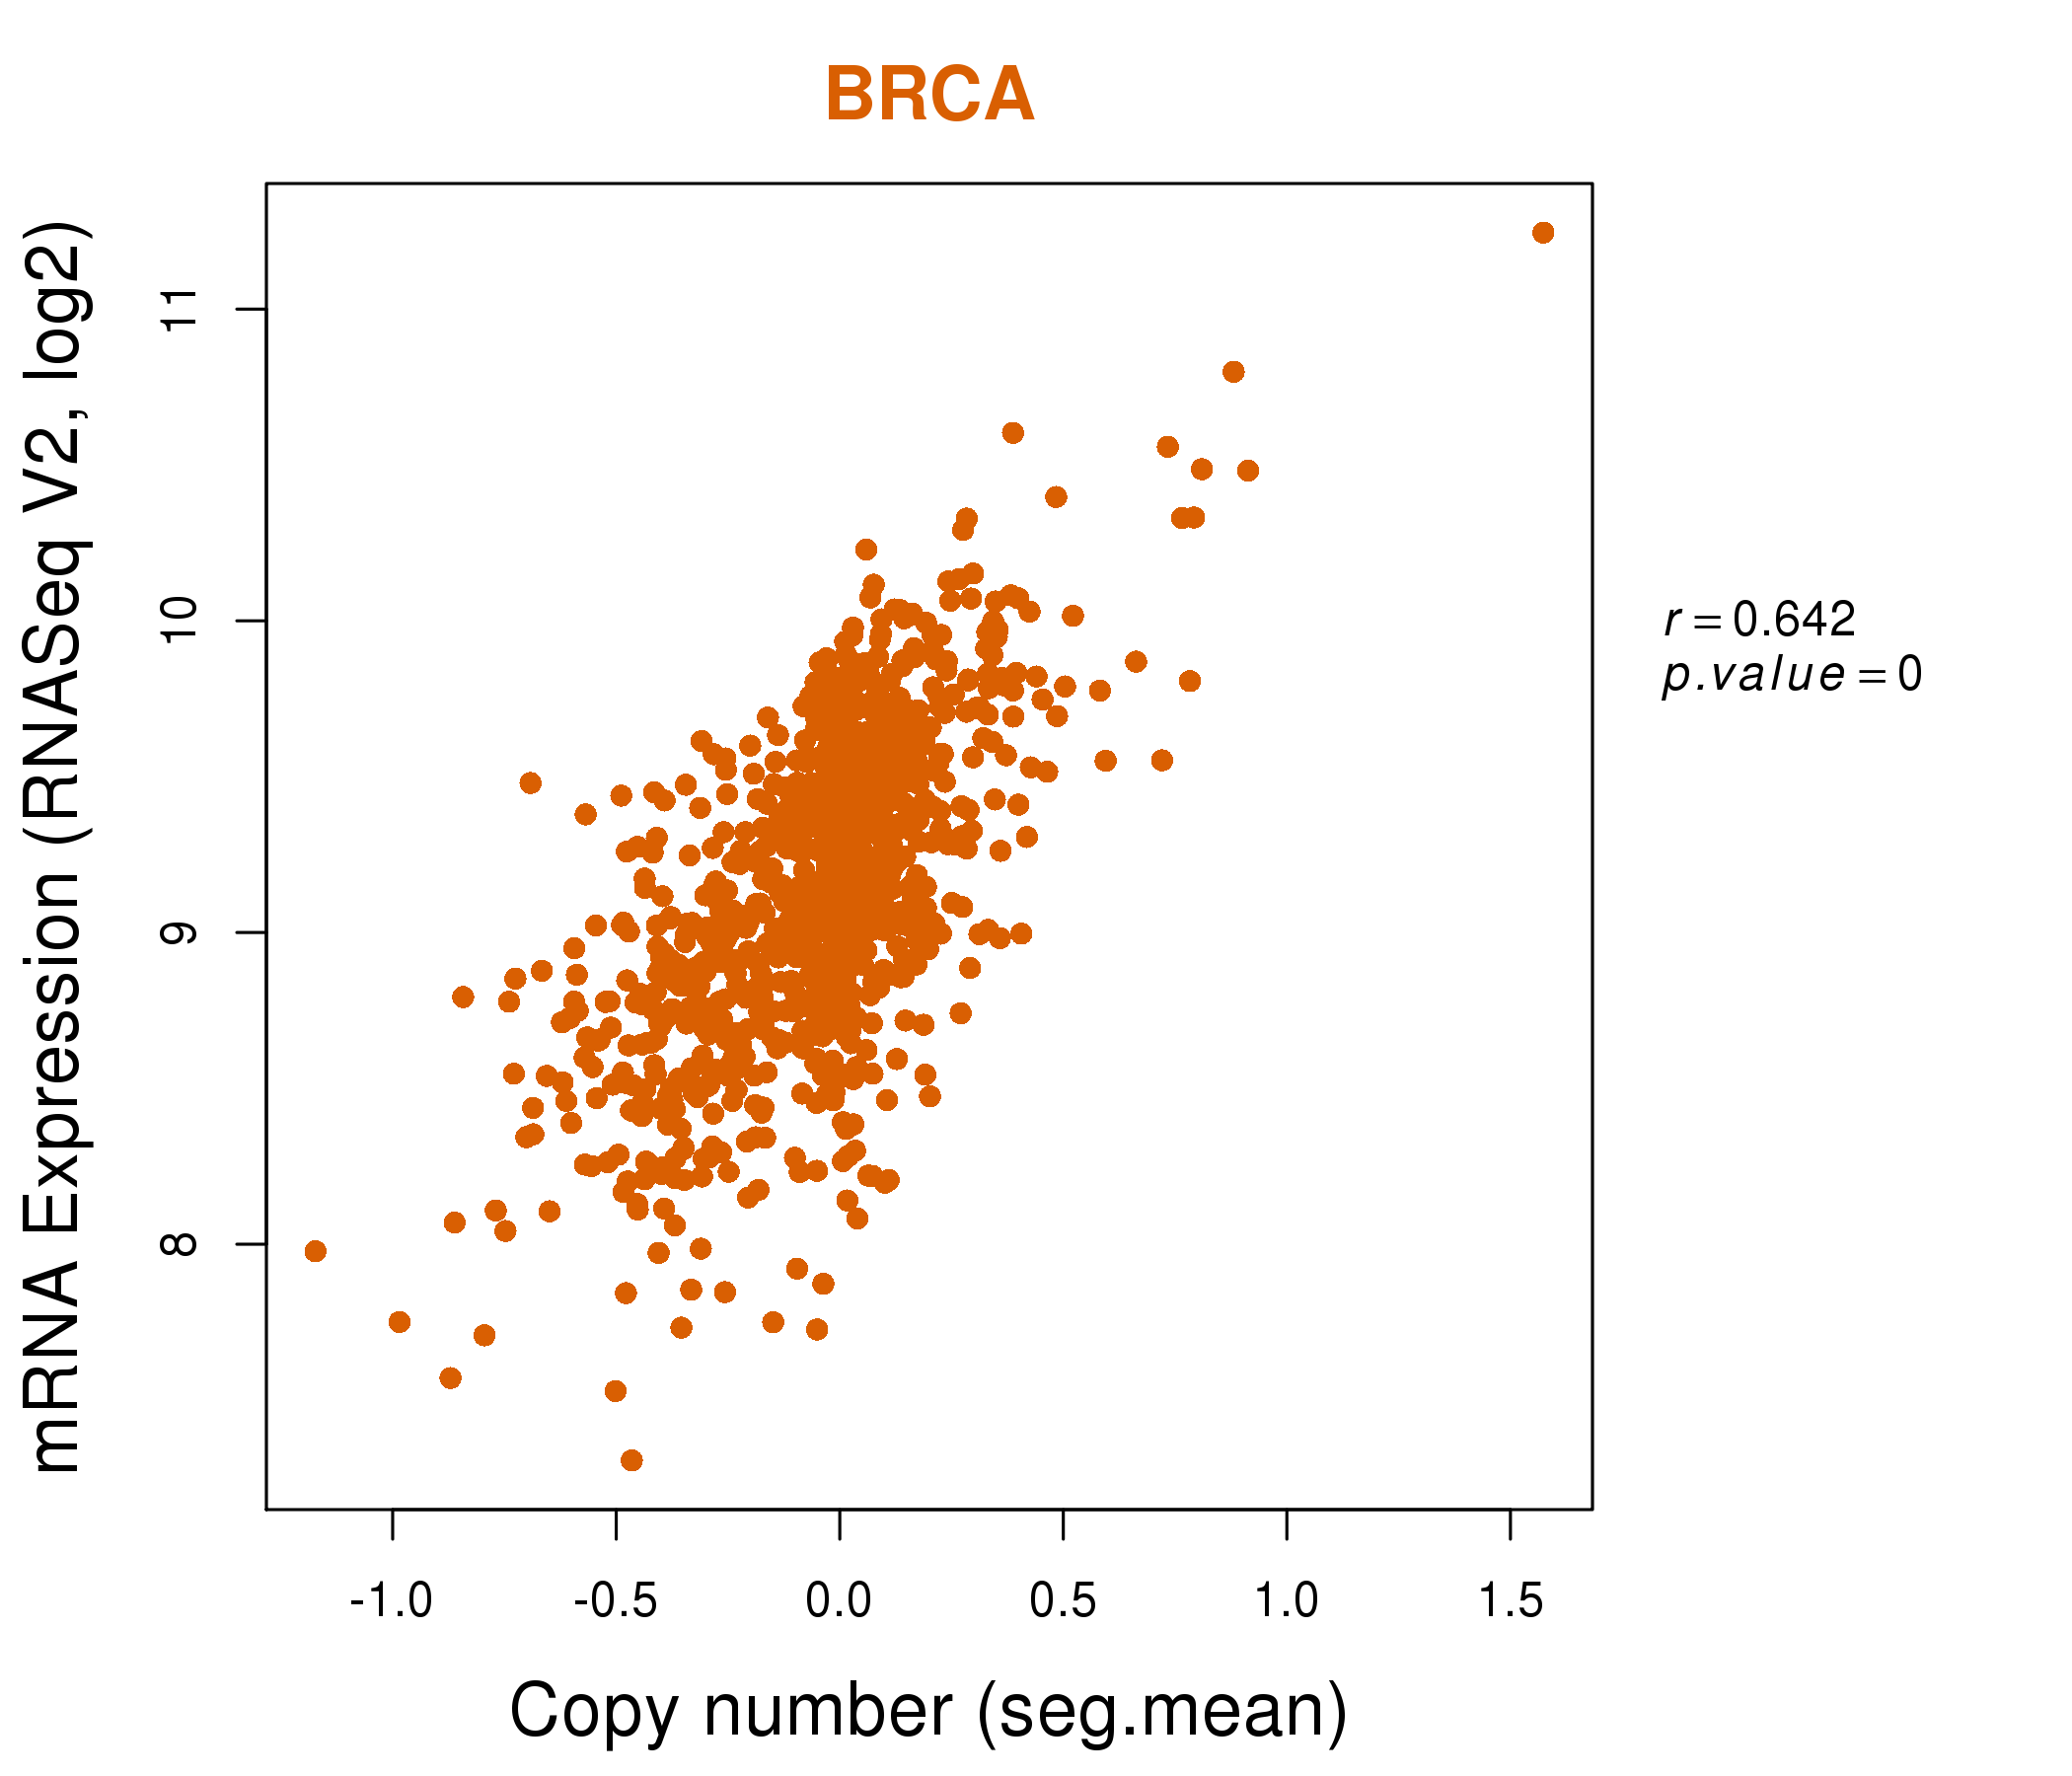
| * Normalized gene expression data of RNASeqV2 was extracted from TCGA using R package TCGA-Assembler. The URLs of all public data files on TCGA DCC data server were gathered at Jan-05-2015. Only eight cancer types have enough normal control samples for differential expression analysis. (t test, adjusted p<0.05 (using Benjamini-Hochberg FDR)) |
 |
| Top |
| * This plots show the correlation between CNV and gene expression. |
: Open all plots for all cancer types
 |
|
 |
|

| Top |
| Gene-Gene Network Information |
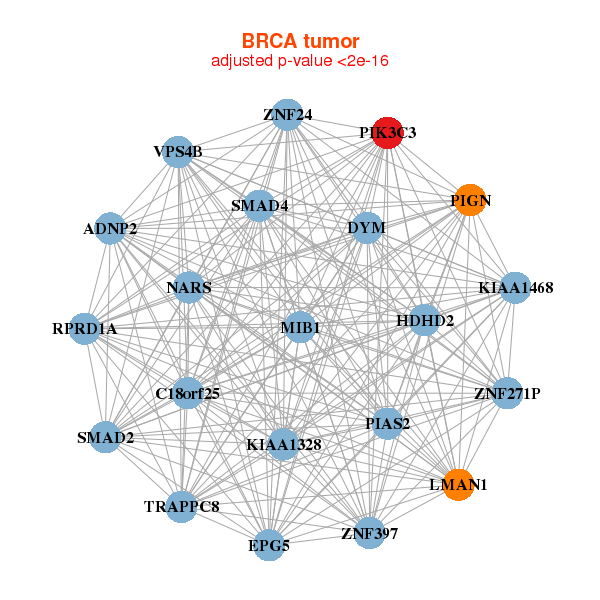
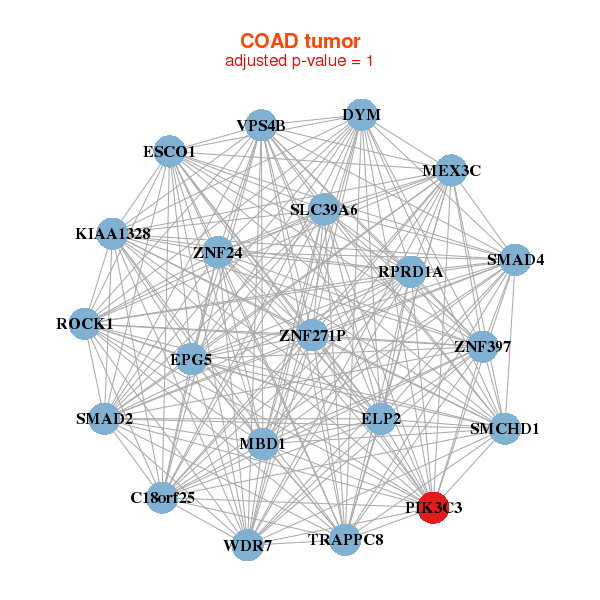
| * Co-Expression network figures were drawn using R package igraph. Only the top 20 genes with the highest correlations were shown. Red circle: input gene, orange circle: cell metabolism gene, sky circle: other gene |
: Open all plots for all cancer types
 |
| ||||
| ADNP2,C18orf25,DYM,HDHD2,TRAPPC8,KIAA1328,KIAA1468, EPG5,LMAN1,MIB1,NARS,PIAS2,PIGN,PIK3C3, RPRD1A,SMAD2,SMAD4,VPS4B,ZNF24,ZNF271P,ZNF397 | AFF4,BIRC6,TRAPPC11,ERCC6L2,CASP8AP2,KDM5A,GLTSCR1L, KIAA0586,KIAA2026,LATS1,NIPBL,NUP153,PIAS1,PIK3C3, RANBP2,RIF1,LTN1,SF3B1,SCAF11,THOC2,WAPAL | ||||
 |
| ||||
| C18orf25,DYM,ELP2,ESCO1,TRAPPC8,KIAA1328,EPG5, MBD1,MEX3C,PIK3C3,ROCK1,RPRD1A,SLC39A6,SMAD2, SMAD4,SMCHD1,VPS4B,WDR7,ZNF24,ZNF271P,ZNF397 | ATAD1,ATE1,TBC1D32,GPATCH11,CTDSPL2,DNAJB14,FBXO38, HDAC9,HDHD2,MAPK14,PDCL,PHAX,PIK3C3,RAB30, RBBP5,SIKE1,SP3,USP8,VPS41,ZNF19,ZNF41 |

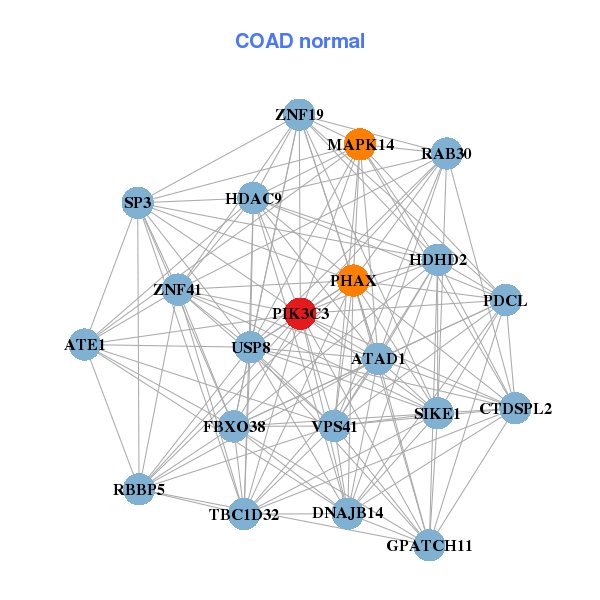
| * Co-Expression network figures were drawn using R package igraph. Only the top 20 genes with the highest correlations were shown. Red circle: input gene, orange circle: cell metabolism gene, sky circle: other gene |
: Open all plots for all cancer types
| Top |
: Open all interacting genes' information including KEGG pathway for all interacting genes from DAVID
| Top |
| Pharmacological Information for PIK3C3 |
| DB Category | DB Name | DB's ID and Url link |
| Chemistry | BindingDB | Q8NEB9; -. |
| Chemistry | ChEMBL | CHEMBL1075165; -. |
| Organism-specific databases | PharmGKB | PA33307; -. |
| Organism-specific databases | CTD | 5289; -. |
| * Gene Centered Interaction Network. |
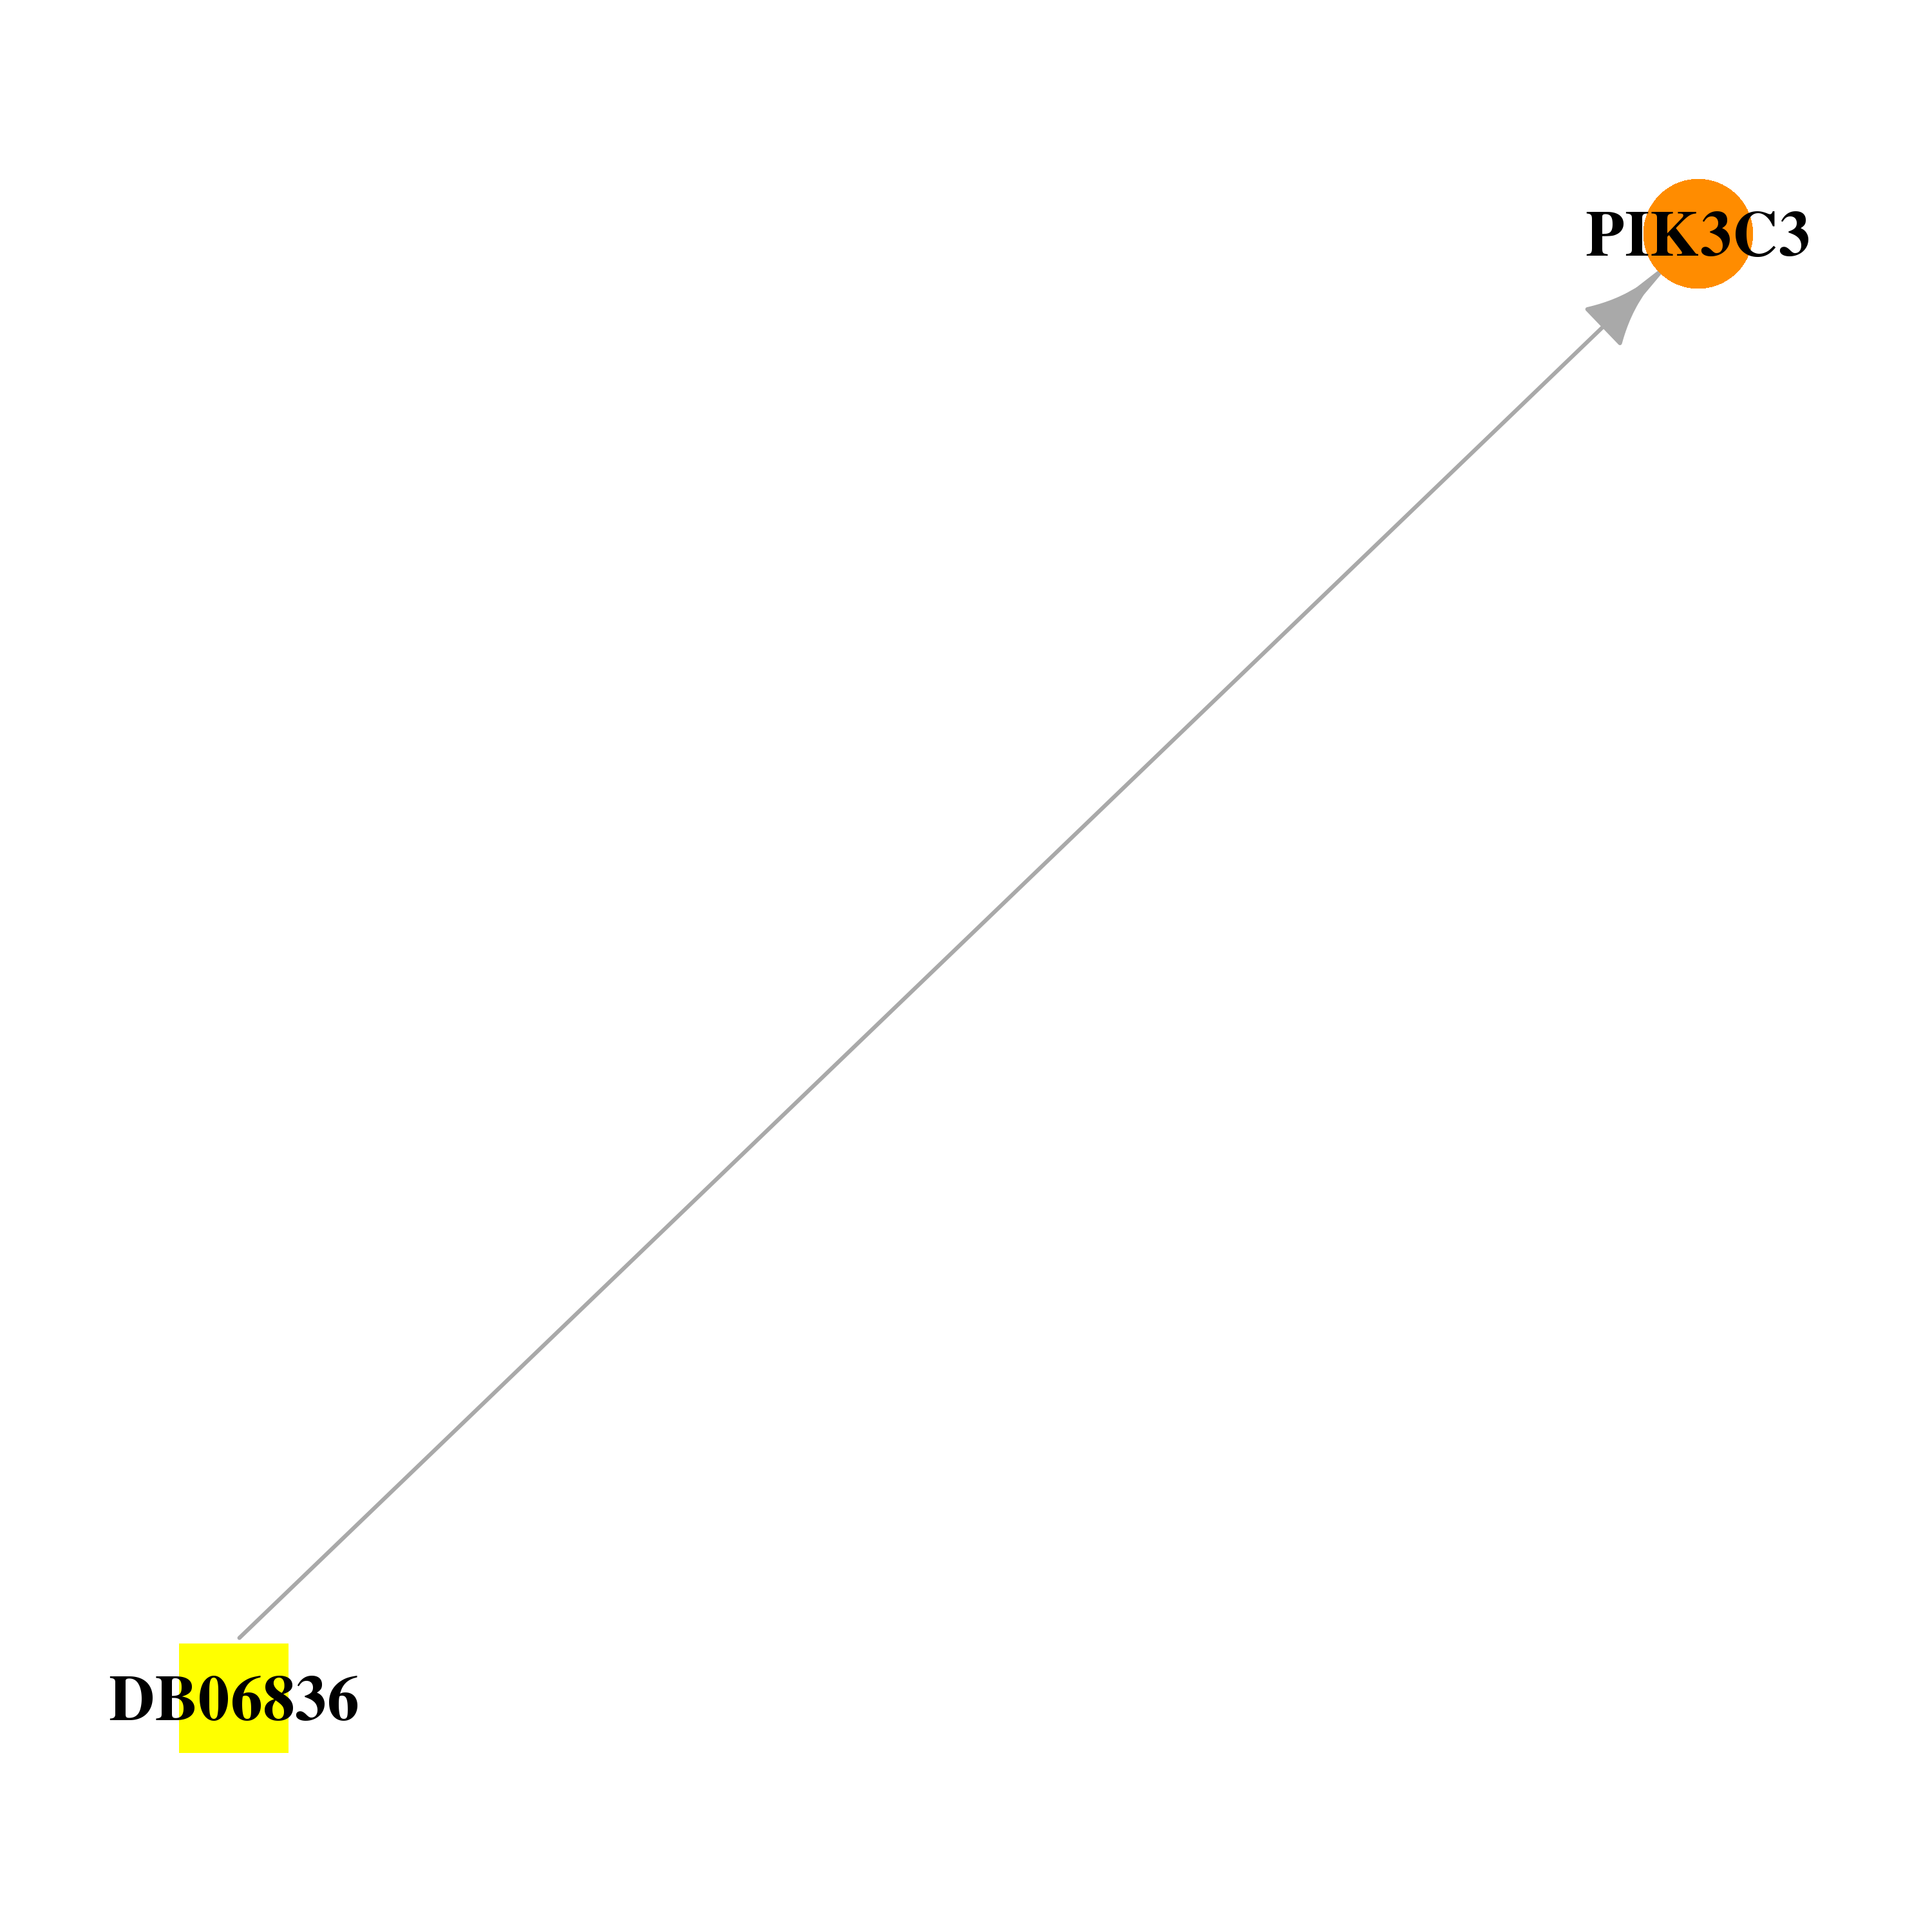 |
| * Drug Centered Interaction Network. |
| DrugBank ID | Target Name | Drug Groups | Generic Name | Drug Centered Network | Drug Structure |
| DB06836 | phosphatidylinositol 3-kinase, catalytic subunit type 3 | experimental | N-(5-(4-CHLORO-3-(2-HYDROXY-ETHYLSULFAMOYL)- PHENYLTHIAZOLE-2-YL)-ACETAMIDE | 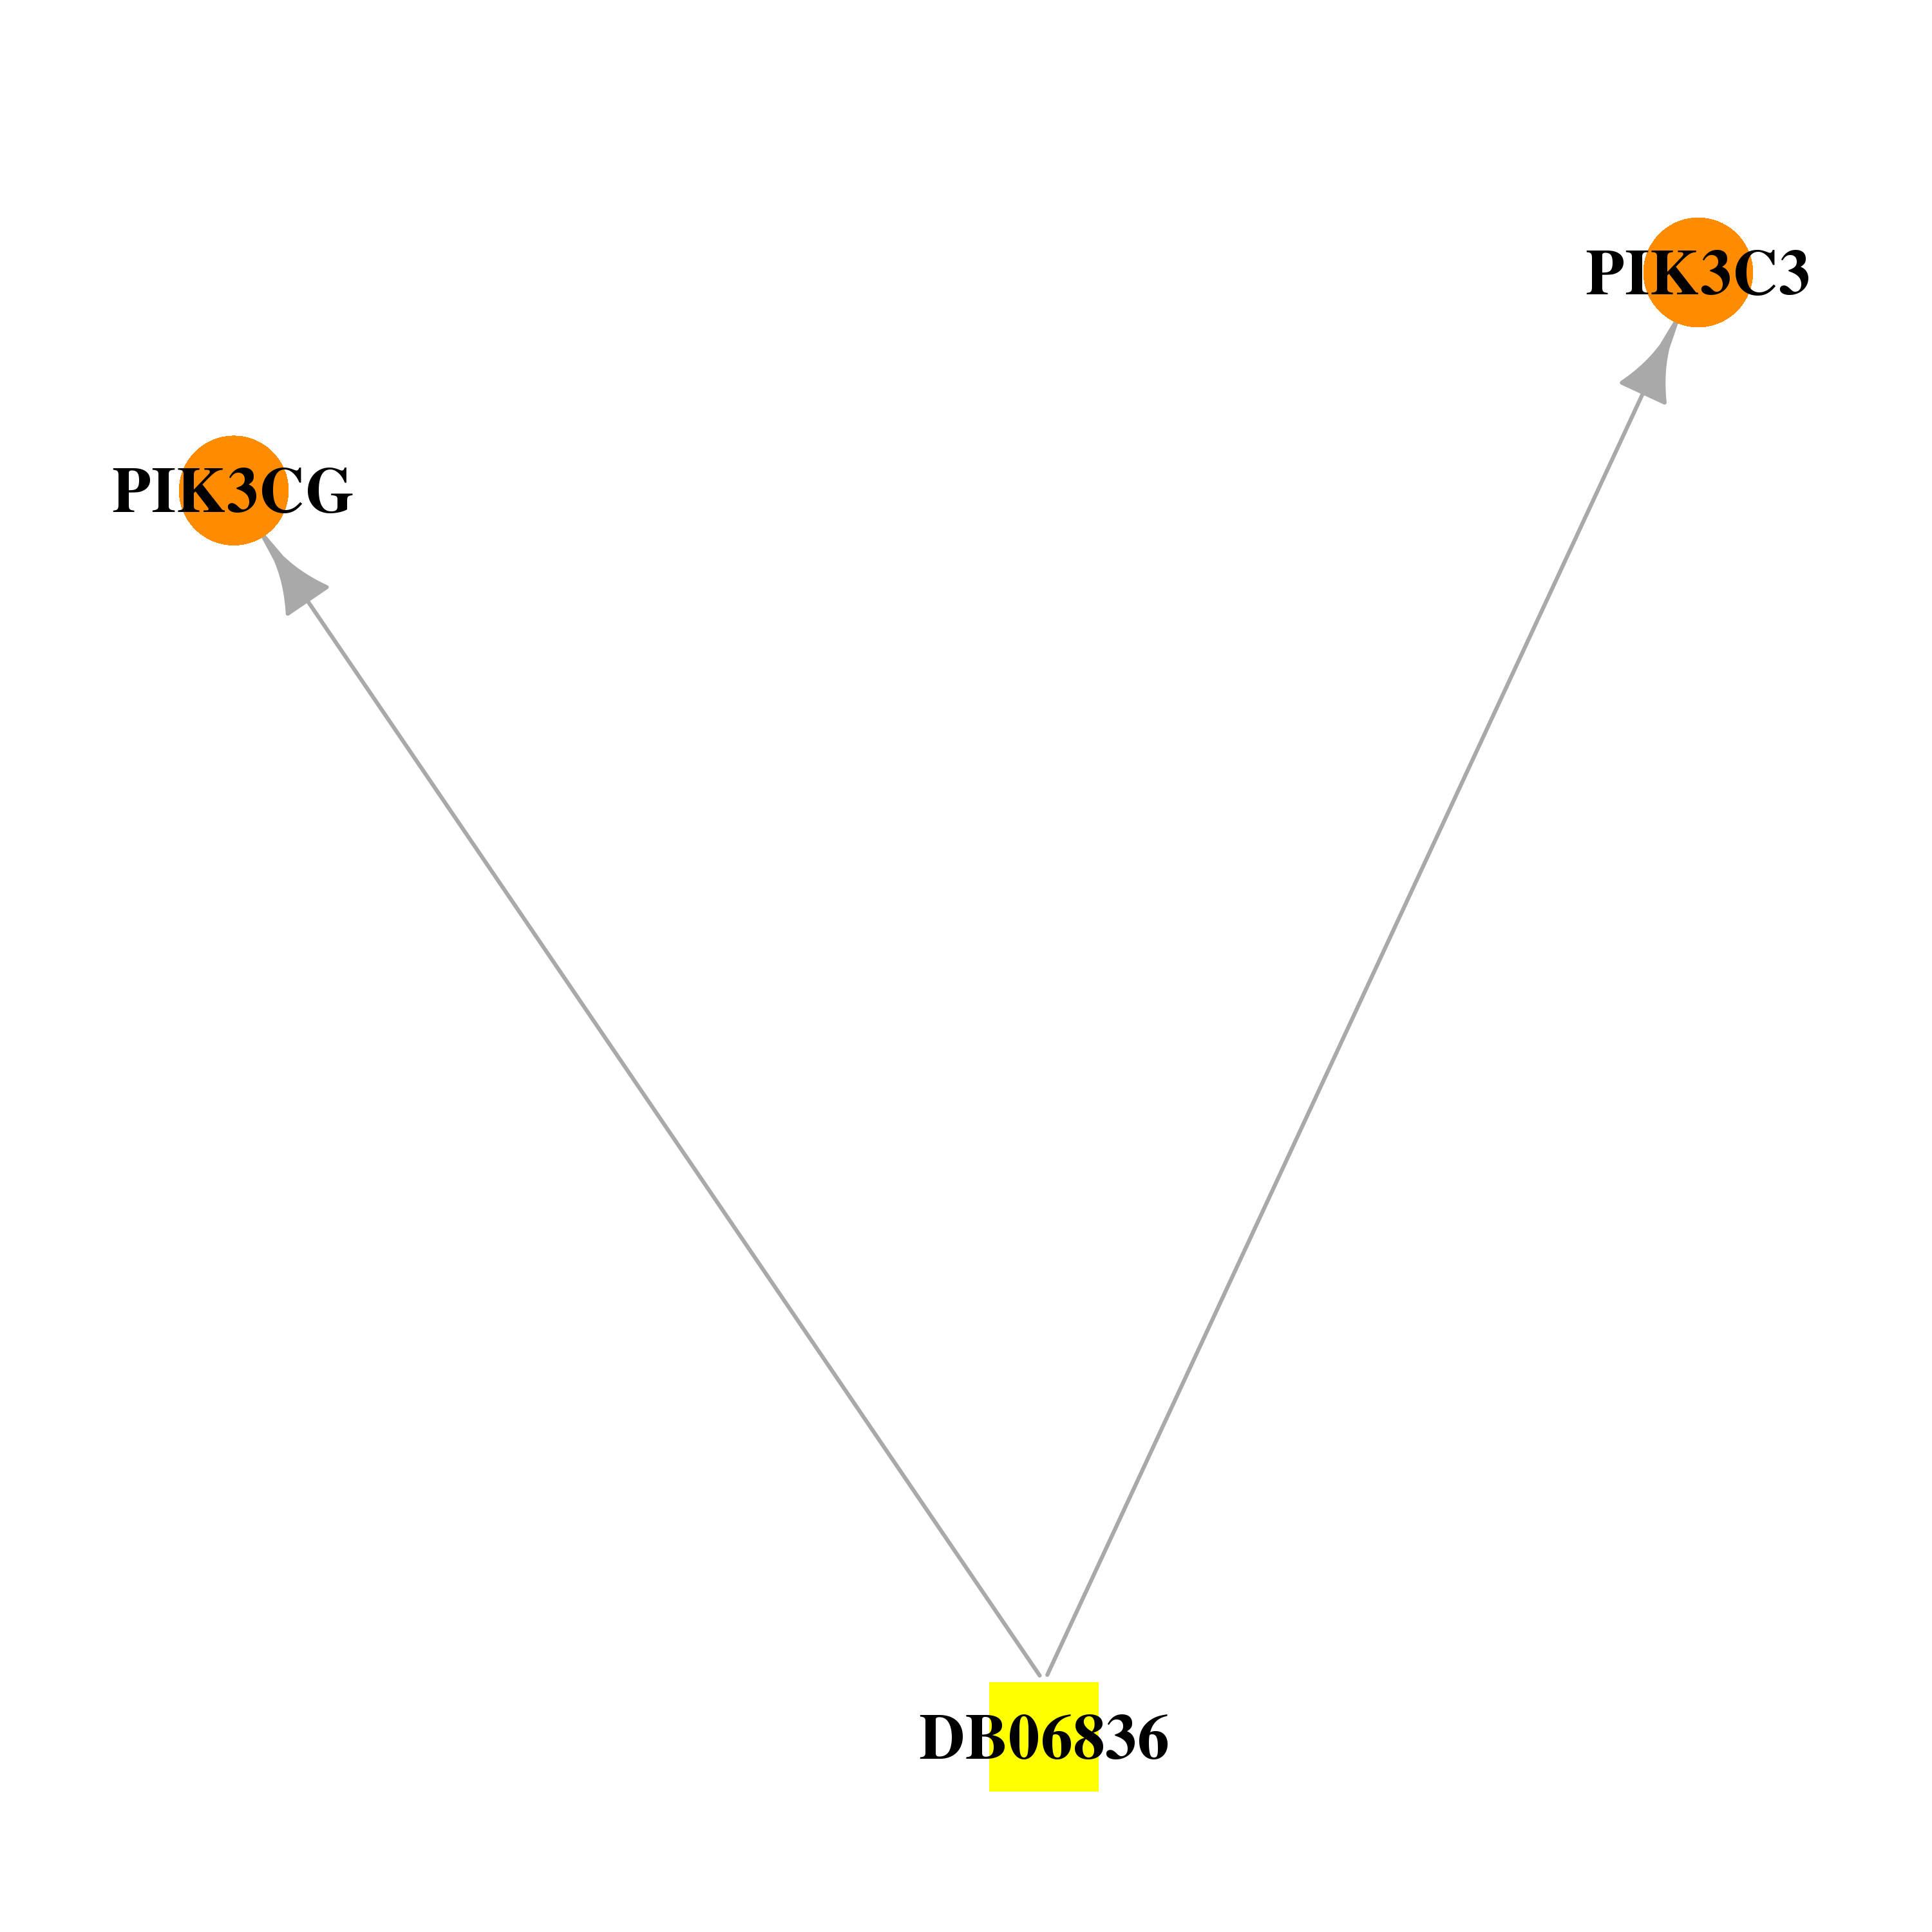 |  |
| Top |
| Cross referenced IDs for PIK3C3 |
| * We obtained these cross-references from Uniprot database. It covers 150 different DBs, 18 categories. http://www.uniprot.org/help/cross_references_section |
: Open all cross reference information
|
Copyright © 2016-Present - The Univsersity of Texas Health Science Center at Houston @ |