|
||||||||||||||||||||
| |
| Phenotypic Information (metabolism pathway, cancer, disease, phenome) |
| |
| |
| Gene-Gene Network Information: Co-Expression Network, Interacting Genes & KEGG |
| |
|


| Gene Summary for POLD1 |
| Basic gene info. | Gene symbol | POLD1 |
| Gene name | polymerase (DNA directed), delta 1, catalytic subunit | |
| Synonyms | CDC2|CRCS10|MDPL|POLD | |
| Cytomap | UCSC genome browser: 19q13.3 | |
| Genomic location | chr19 :50887579-50921275 | |
| Type of gene | protein-coding | |
| RefGenes | NM_001256849.1, NM_002691.3,NR_046402.1, | |
| Ensembl id | ENSG00000062822 | |
| Description | CDC2 homologDNA polymerase delta catalytic subunitDNA polymerase subunit delta p125polymerase (DNA directed), delta 1, catalytic subunit 125kDa | |
| Modification date | 20141207 | |
| dbXrefs | MIM : 174761 | |
| HGNC : HGNC | ||
| Ensembl : ENSG00000062822 | ||
| HPRD : 08882 | ||
| Vega : OTTHUMG00000183037 | ||
| Protein | UniProt: P28340 go to UniProt's Cross Reference DB Table | |
| Expression | CleanEX: HS_POLD1 | |
| BioGPS: 5424 | ||
| Gene Expression Atlas: ENSG00000062822 | ||
| The Human Protein Atlas: ENSG00000062822 | ||
| Pathway | NCI Pathway Interaction Database: POLD1 | |
| KEGG: POLD1 | ||
| REACTOME: POLD1 | ||
| ConsensusPathDB | ||
| Pathway Commons: POLD1 | ||
| Metabolism | MetaCyc: POLD1 | |
| HUMANCyc: POLD1 | ||
| Regulation | Ensembl's Regulation: ENSG00000062822 | |
| miRBase: chr19 :50,887,579-50,921,275 | ||
| TargetScan: NM_001256849 | ||
| cisRED: ENSG00000062822 | ||
| Context | iHOP: POLD1 | |
| cancer metabolism search in PubMed: POLD1 | ||
| UCL Cancer Institute: POLD1 | ||
| Assigned class in ccmGDB | A - This gene has a literature evidence and it belongs to cancer gene. | |
| References showing role of POLD1 in cancer cell metabolism | 1. Mertz TM, Sharma S, Chabes A, Shcherbakova PV (2015) Colon cancer-associated mutator DNA polymerase δ variant causes expansion of dNTP pools increasing its own infidelity. Proceedings of the National Academy of Sciences 112: E2467-E2476. go to article | |
| Top |
| Phenotypic Information for POLD1(metabolism pathway, cancer, disease, phenome) |
| Cancer | CGAP: POLD1 |
| Familial Cancer Database: POLD1 | |
| * This gene is included in those cancer gene databases. |
|
|
|
|
|
| . | ||||||||||||||
Oncogene 1 | Significant driver gene in | |||||||||||||||||||
| cf) number; DB name 1 Oncogene; http://nar.oxfordjournals.org/content/35/suppl_1/D721.long, 2 Tumor Suppressor gene; https://bioinfo.uth.edu/TSGene/, 3 Cancer Gene Census; http://www.nature.com/nrc/journal/v4/n3/abs/nrc1299.html, 4 CancerGenes; http://nar.oxfordjournals.org/content/35/suppl_1/D721.long, 5 Network of Cancer Gene; http://ncg.kcl.ac.uk/index.php, 1Therapeutic Vulnerabilities in Cancer; http://cbio.mskcc.org/cancergenomics/statius/ |
| KEGG_PURINE_METABOLISM KEGG_PYRIMIDINE_METABOLISM | |
| OMIM | 174761; gene. 612591; phenotype. 615381; phenotype. |
| Orphanet | 363649; Mandibular hypoplasia-deafness-progeroid syndrome. |
| Disease | KEGG Disease: POLD1 |
| MedGen: POLD1 (Human Medical Genetics with Condition) | |
| ClinVar: POLD1 | |
| Phenotype | MGI: POLD1 (International Mouse Phenotyping Consortium) |
| PhenomicDB: POLD1 | |
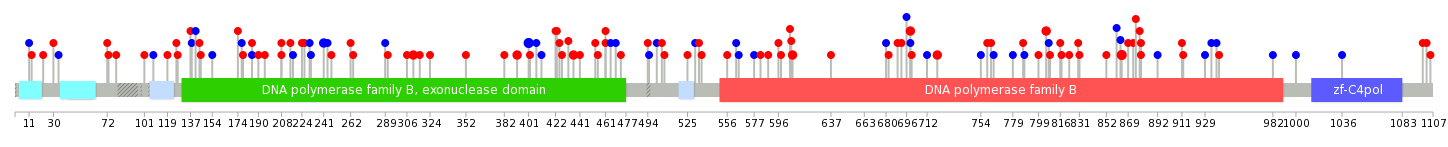
| Mutations for POLD1 |
| * Under tables are showing count per each tissue to give us broad intuition about tissue specific mutation patterns.You can go to the detailed page for each mutation database's web site. |
| There's no structural variation information in COSMIC data for this gene. |
| * From mRNA Sanger sequences, Chitars2.0 arranged chimeric transcripts. This table shows POLD1 related fusion information. |
| ID | Head Gene | Tail Gene | Accession | Gene_a | qStart_a | qEnd_a | Chromosome_a | tStart_a | tEnd_a | Gene_a | qStart_a | qEnd_a | Chromosome_a | tStart_a | tEnd_a |
| Top |
| There's no copy number variation information in COSMIC data for this gene. |
| Top |
|
 |
| Top |
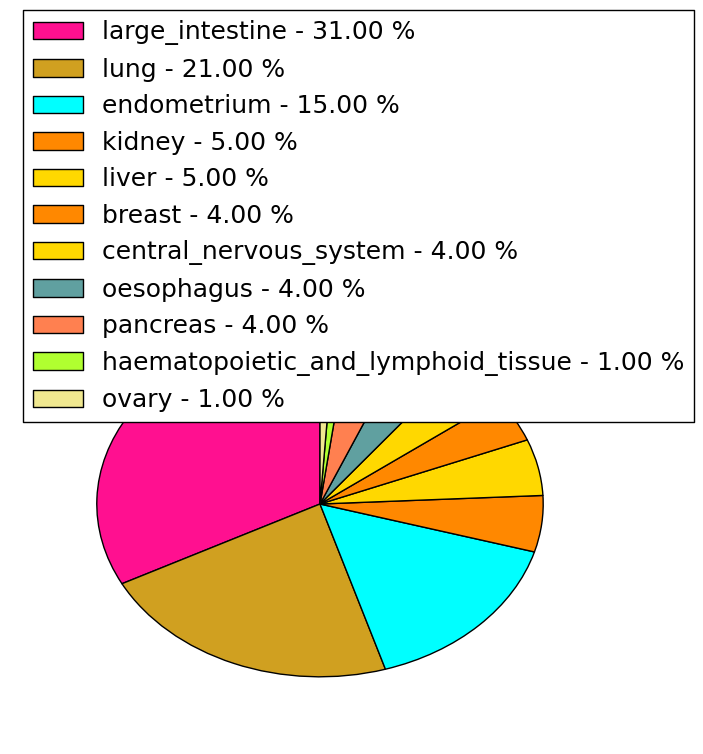
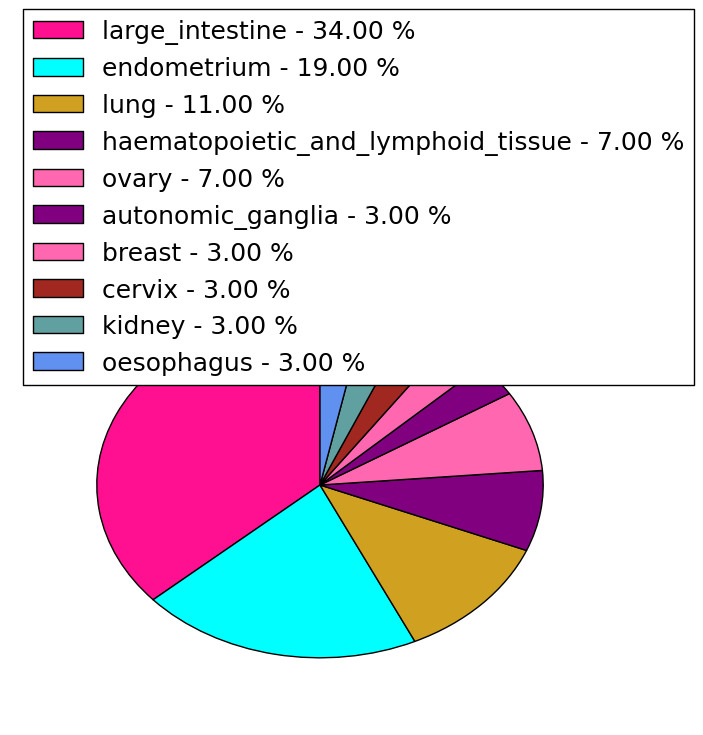
| Stat. for Non-Synonymous SNVs (# total SNVs=70) | (# total SNVs=26) |
 |  |
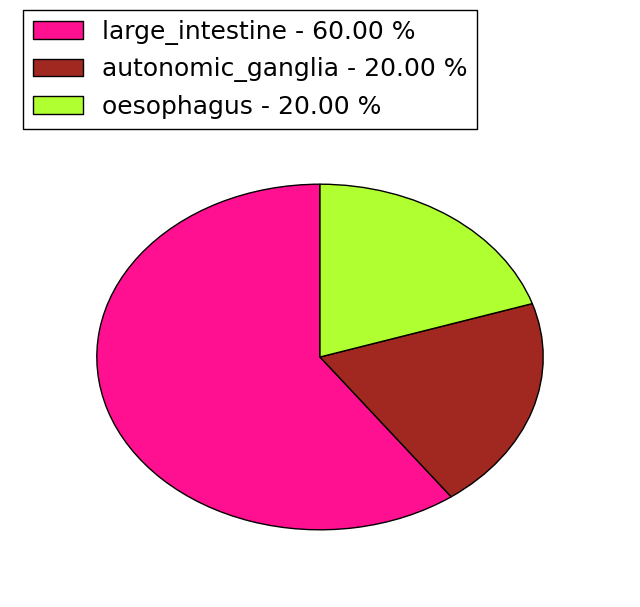
(# total SNVs=5) | (# total SNVs=1) |
 |  |
| Top |
| * When you move the cursor on each content, you can see more deailed mutation information on the Tooltip. Those are primary_site,primary_histology,mutation(aa),pubmedID. |
| GRCh37 position | Mutation(aa) | Unique sampleID count |
| chr19:50918720-50918720 | p.A864T | 3 |
| chr19:50906815-50906815 | p.F401F | 3 |
| chr19:50912086-50912086 | p.Y607C | 2 |
| chr19:50918097-50918097 | p.S805N | 2 |
| chr19:50916686-50916686 | p.V720I | 2 |
| chr19:50905055-50905055 | p.P116fs*53 | 2 |
| chr19:50909504-50909504 | p.F436L | 2 |
| chr19:50906786-50906786 | p.V392M | 2 |
| chr19:50905959-50905959 | p.R311C | 2 |
| chr19:50905595-50905595 | p.F241F | 2 |
| Top |
|
 |
| Point Mutation/ Tissue ID | 1 | 2 | 3 | 4 | 5 | 6 | 7 | 8 | 9 | 10 | 11 | 12 | 13 | 14 | 15 | 16 | 17 | 18 | 19 | 20 |
| # sample | 1 | 1 | 1 | 18 | 1 | 4 | 3 | 4 | 3 | 2 | 1 | 13 | 11 | 14 | ||||||
| # mutation | 1 | 1 | 1 | 17 | 1 | 4 | 3 | 5 | 3 | 2 | 1 | 14 | 12 | 16 | ||||||
| nonsynonymous SNV | 1 | 1 | 12 | 1 | 3 | 2 | 4 | 2 | 1 | 6 | 8 | 11 | ||||||||
| synonymous SNV | 1 | 5 | 1 | 1 | 1 | 1 | 2 | 8 | 4 | 5 |
| cf) Tissue ID; Tissue type (1; BLCA[Bladder Urothelial Carcinoma], 2; BRCA[Breast invasive carcinoma], 3; CESC[Cervical squamous cell carcinoma and endocervical adenocarcinoma], 4; COAD[Colon adenocarcinoma], 5; GBM[Glioblastoma multiforme], 6; Glioma Low Grade, 7; HNSC[Head and Neck squamous cell carcinoma], 8; KICH[Kidney Chromophobe], 9; KIRC[Kidney renal clear cell carcinoma], 10; KIRP[Kidney renal papillary cell carcinoma], 11; LAML[Acute Myeloid Leukemia], 12; LUAD[Lung adenocarcinoma], 13; LUSC[Lung squamous cell carcinoma], 14; OV[Ovarian serous cystadenocarcinoma ], 15; PAAD[Pancreatic adenocarcinoma], 16; PRAD[Prostate adenocarcinoma], 17; SKCM[Skin Cutaneous Melanoma], 18:STAD[Stomach adenocarcinoma], 19:THCA[Thyroid carcinoma], 20:UCEC[Uterine Corpus Endometrial Carcinoma]) |
| Top |
| * We represented just top 10 SNVs. When you move the cursor on each content, you can see more deailed mutation information on the Tooltip. Those are primary_site, primary_histology, mutation(aa), pubmedID. |
| Genomic Position | Mutation(aa) | Unique sampleID count |
| chr19:50906815 | p.F401F,POLD1 | 2 |
| chr19:50918720 | p.A864T,POLD1 | 2 |
| chr19:50905959 | p.F241F,POLD1 | 2 |
| chr19:50917112 | p.Q461H,POLD1 | 2 |
| chr19:50909579 | p.S788S,POLD1 | 2 |
| chr19:50905595 | p.R311C,POLD1 | 2 |
| chr19:50906786 | p.A145D,POLD1 | 2 |
| chr19:50905152 | p.V392M,POLD1 | 2 |
| chr19:50918719 | p.F637L,POLD1 | 1 |
| chr19:50919778 | p.A860A,POLD1 | 1 |
| * Copy number data were extracted from TCGA using R package TCGA-Assembler. The URLs of all public data files on TCGA DCC data server were gathered on Jan-05-2015. Function ProcessCNAData in TCGA-Assembler package was used to obtain gene-level copy number value which is calculated as the average copy number of the genomic region of a gene. |
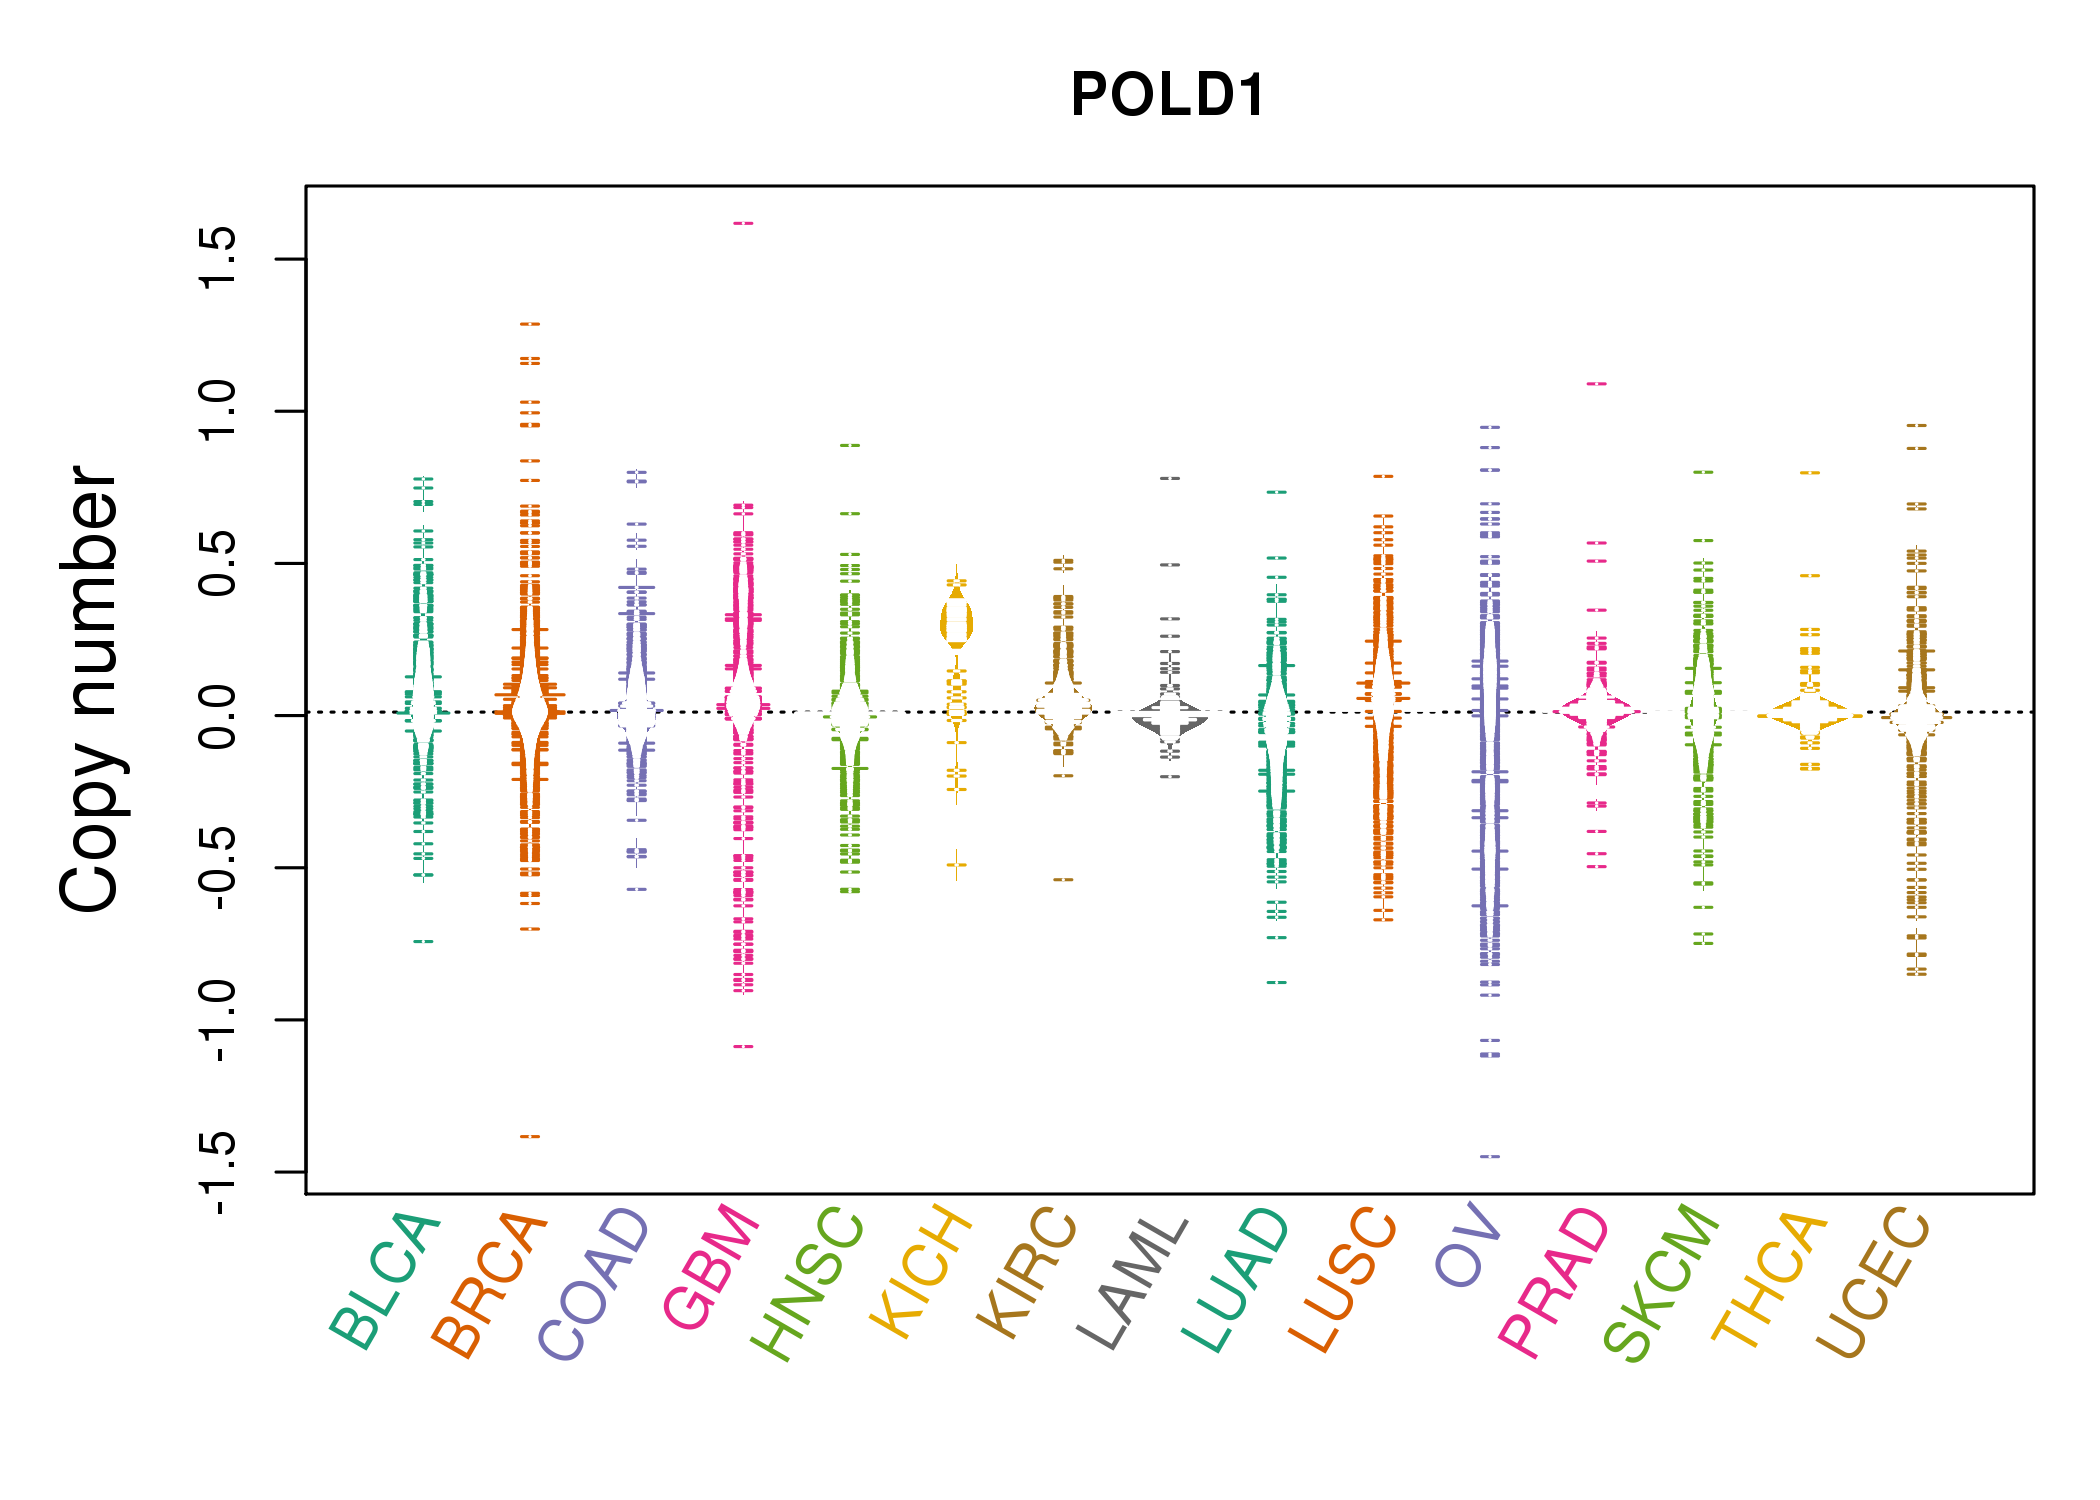 |
| cf) Tissue ID[Tissue type]: BLCA[Bladder Urothelial Carcinoma], BRCA[Breast invasive carcinoma], CESC[Cervical squamous cell carcinoma and endocervical adenocarcinoma], COAD[Colon adenocarcinoma], GBM[Glioblastoma multiforme], Glioma Low Grade, HNSC[Head and Neck squamous cell carcinoma], KICH[Kidney Chromophobe], KIRC[Kidney renal clear cell carcinoma], KIRP[Kidney renal papillary cell carcinoma], LAML[Acute Myeloid Leukemia], LUAD[Lung adenocarcinoma], LUSC[Lung squamous cell carcinoma], OV[Ovarian serous cystadenocarcinoma ], PAAD[Pancreatic adenocarcinoma], PRAD[Prostate adenocarcinoma], SKCM[Skin Cutaneous Melanoma], STAD[Stomach adenocarcinoma], THCA[Thyroid carcinoma], UCEC[Uterine Corpus Endometrial Carcinoma] |
| Top |
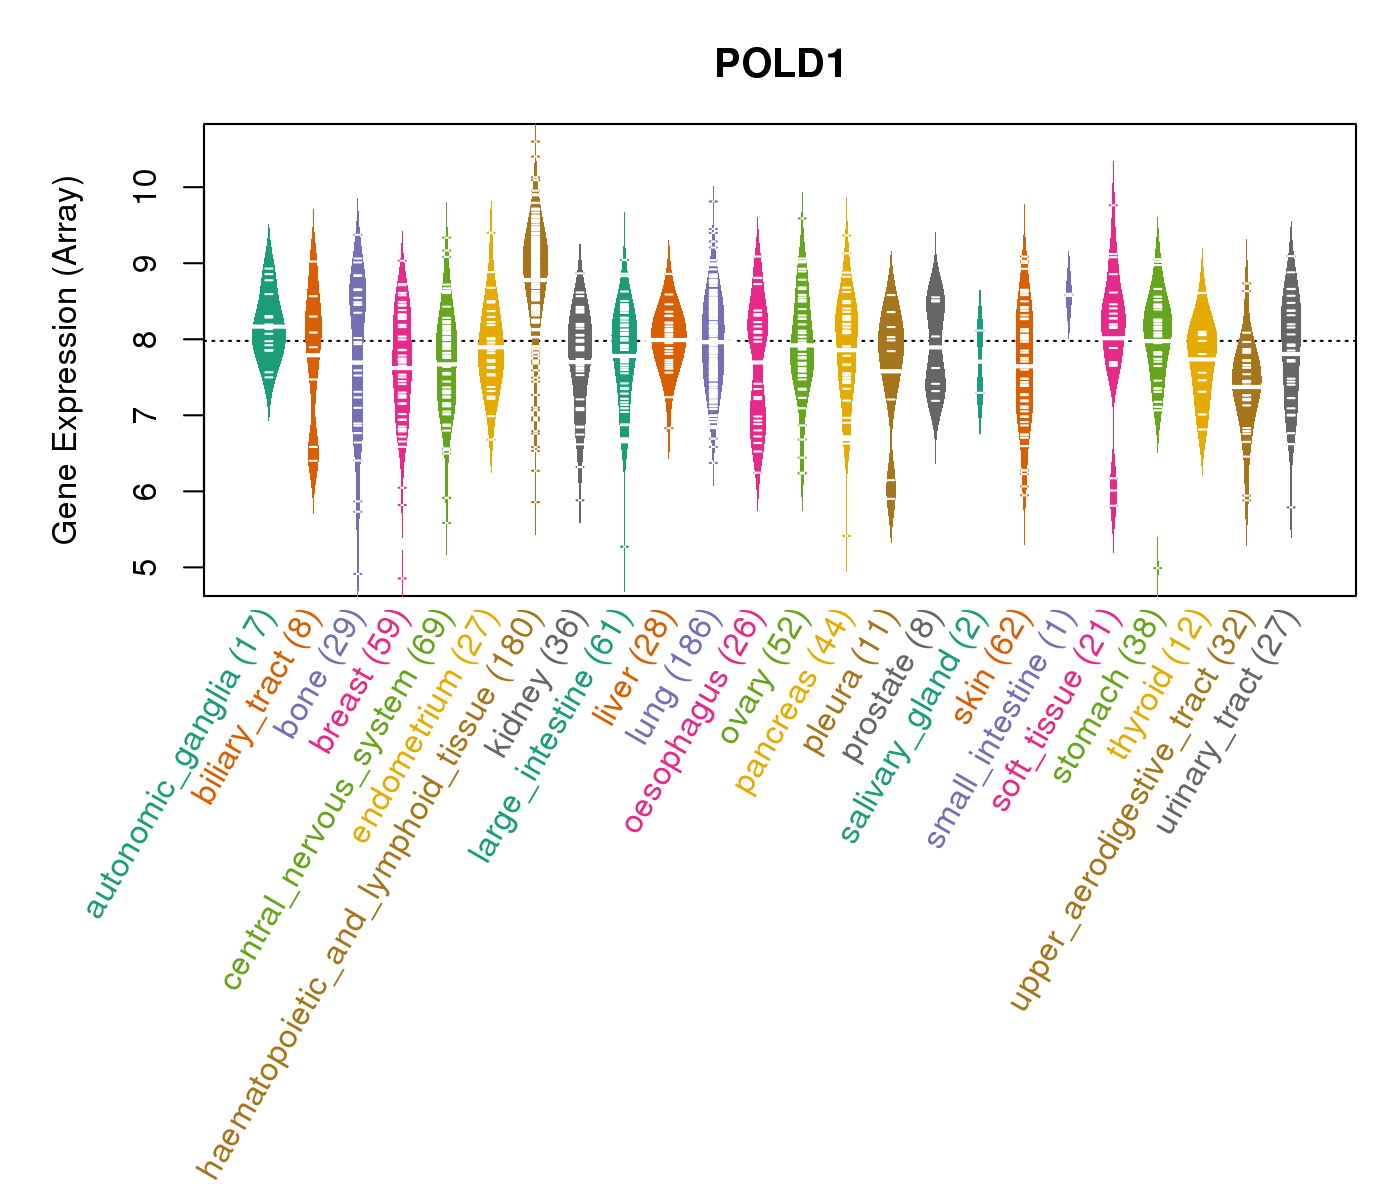
| Gene Expression for POLD1 |
| * CCLE gene expression data were extracted from CCLE_Expression_Entrez_2012-10-18.res: Gene-centric RMA-normalized mRNA expression data. |
 |
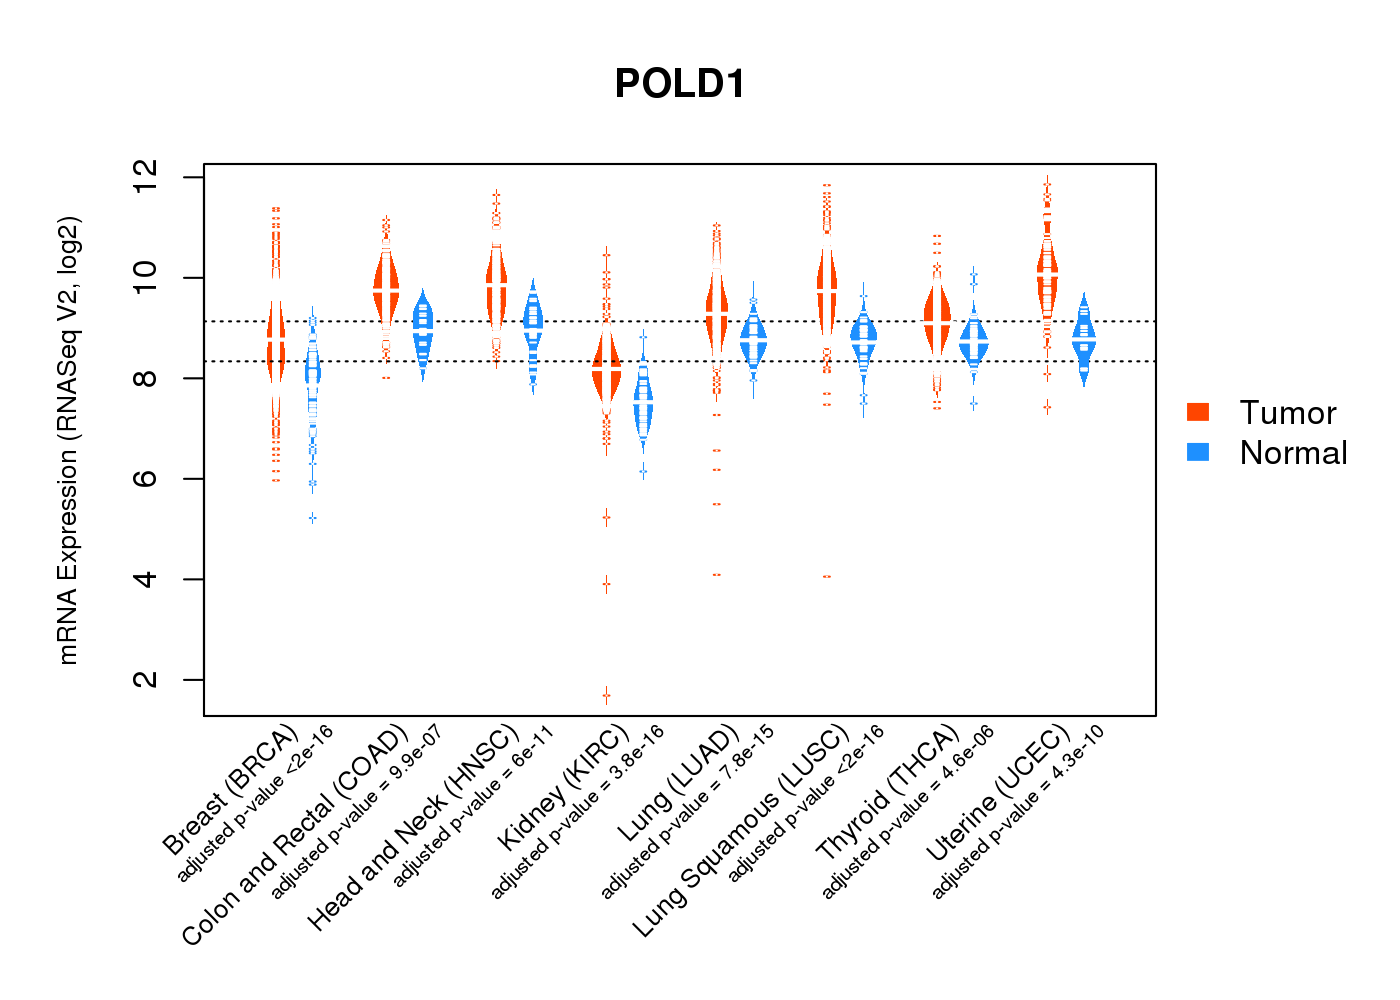
| * Normalized gene expression data of RNASeqV2 was extracted from TCGA using R package TCGA-Assembler. The URLs of all public data files on TCGA DCC data server were gathered at Jan-05-2015. Only eight cancer types have enough normal control samples for differential expression analysis. (t test, adjusted p<0.05 (using Benjamini-Hochberg FDR)) |
 |
| Top |
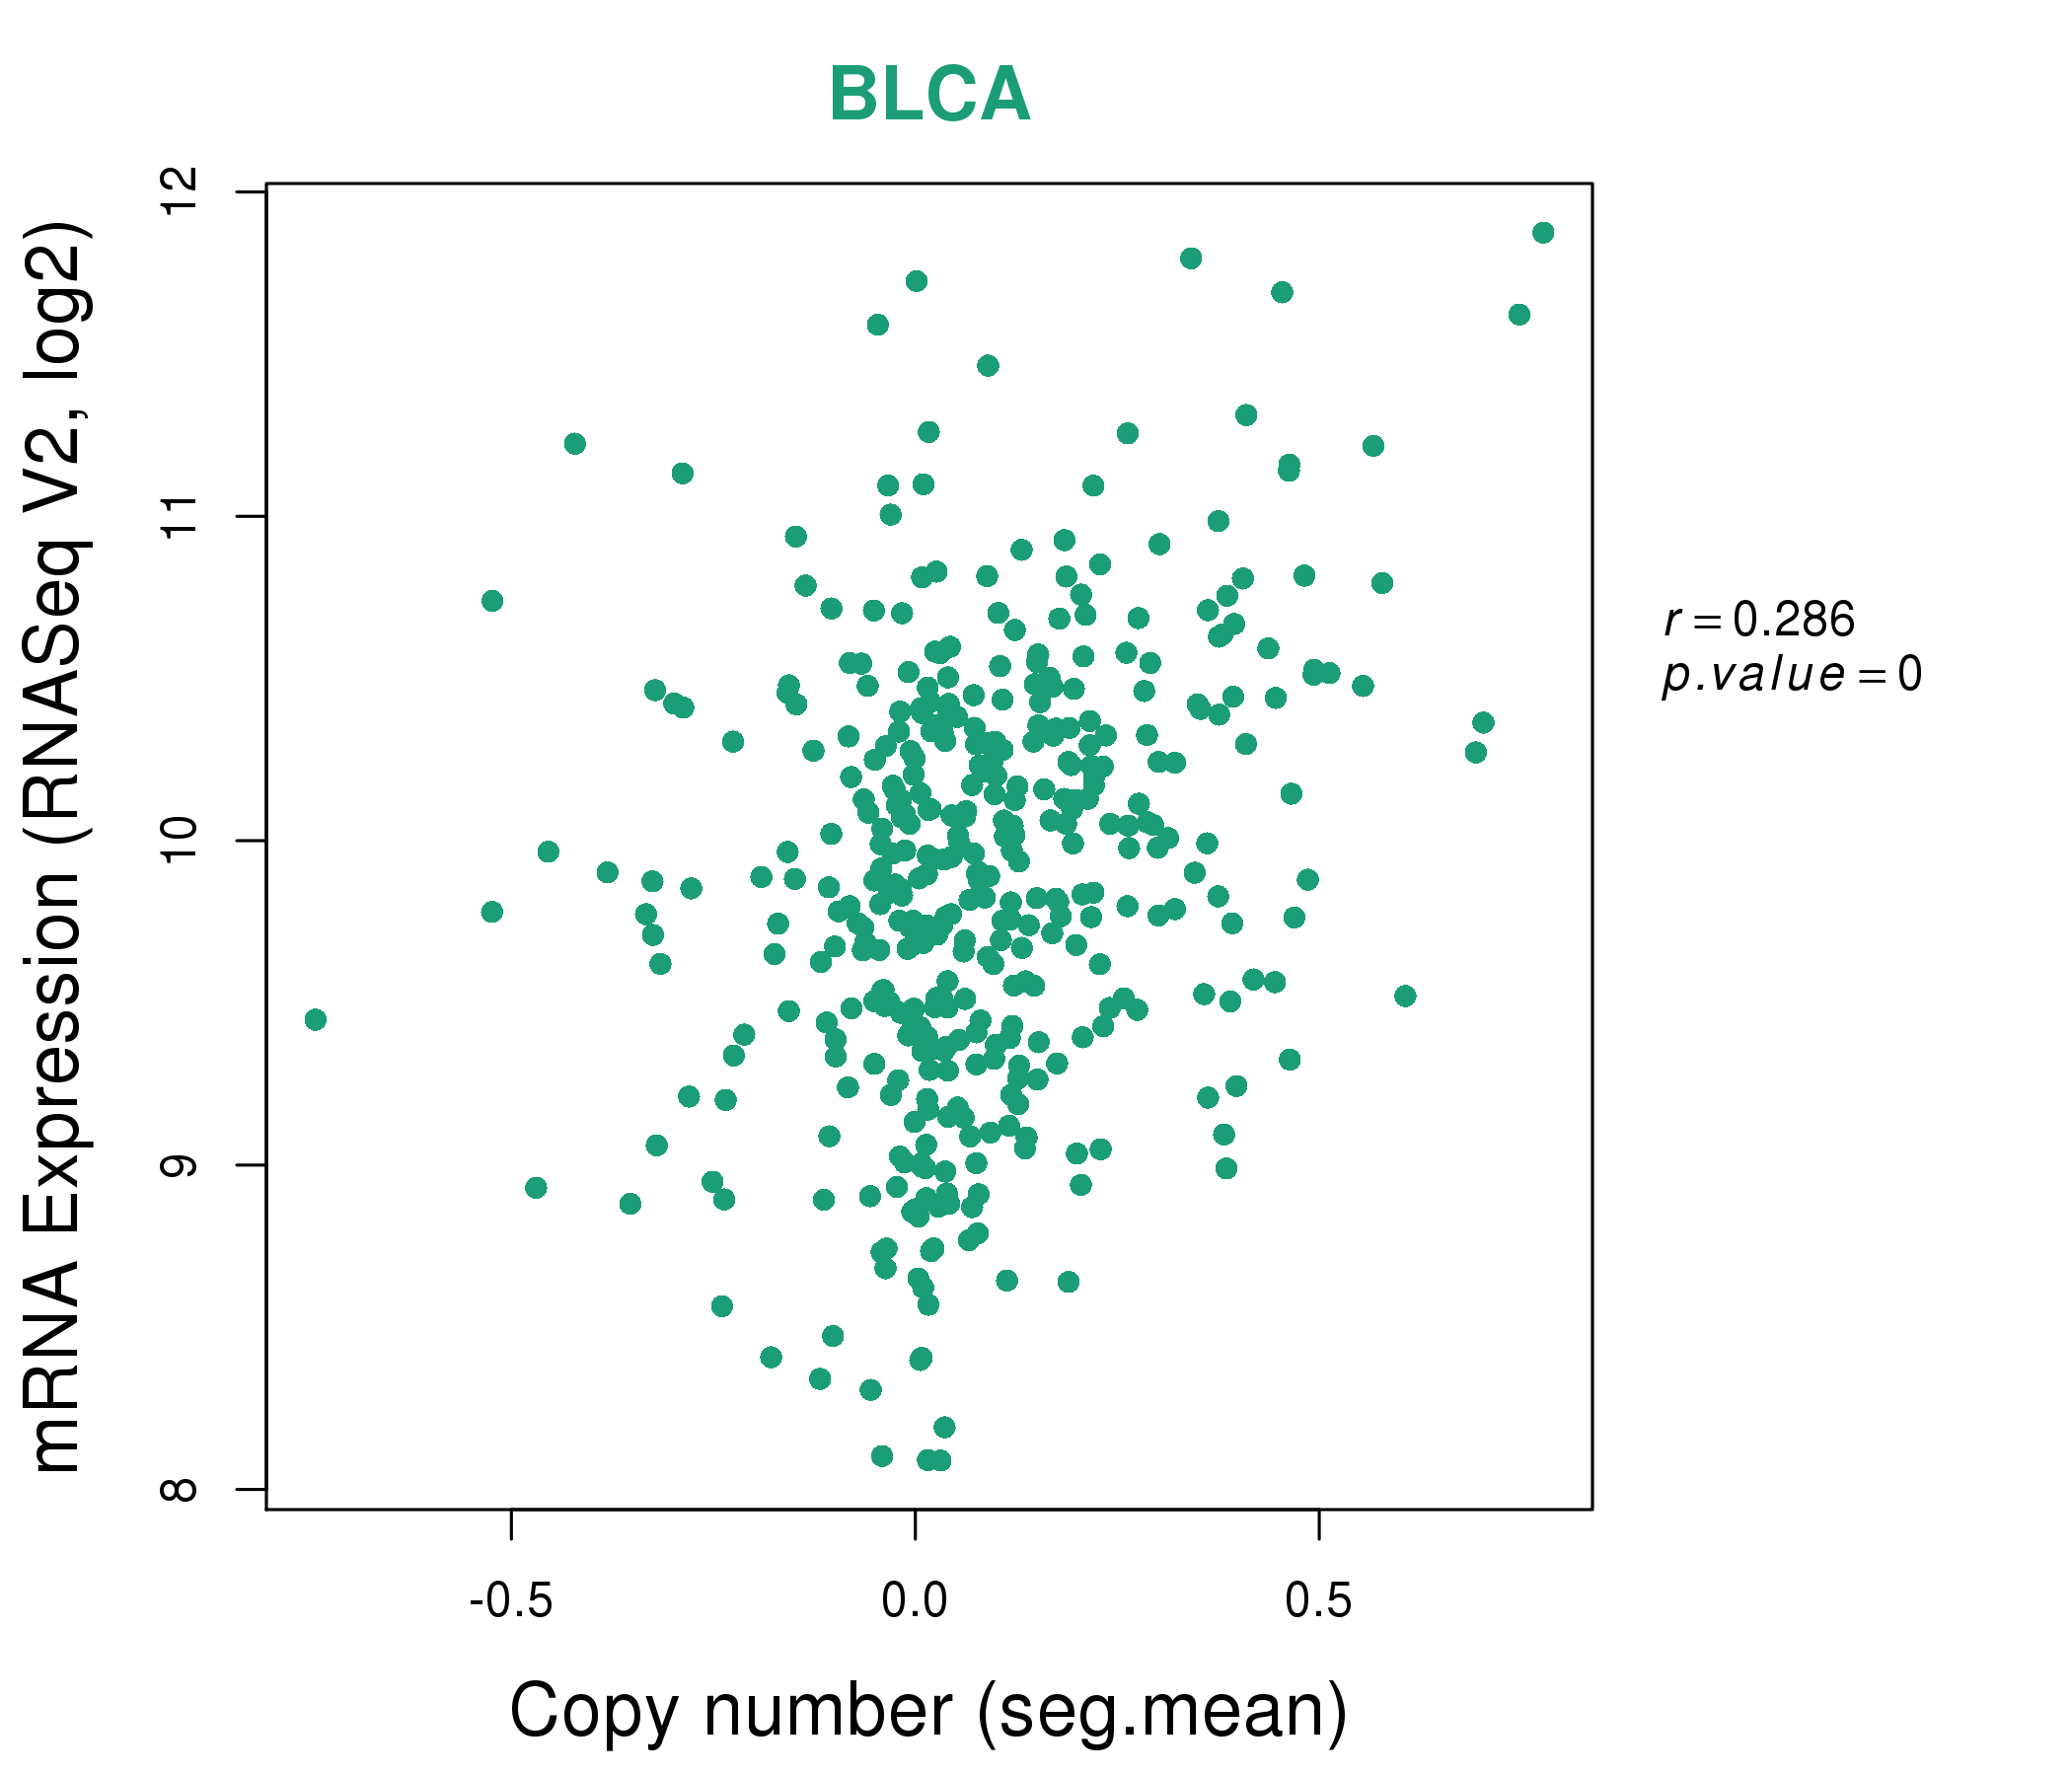
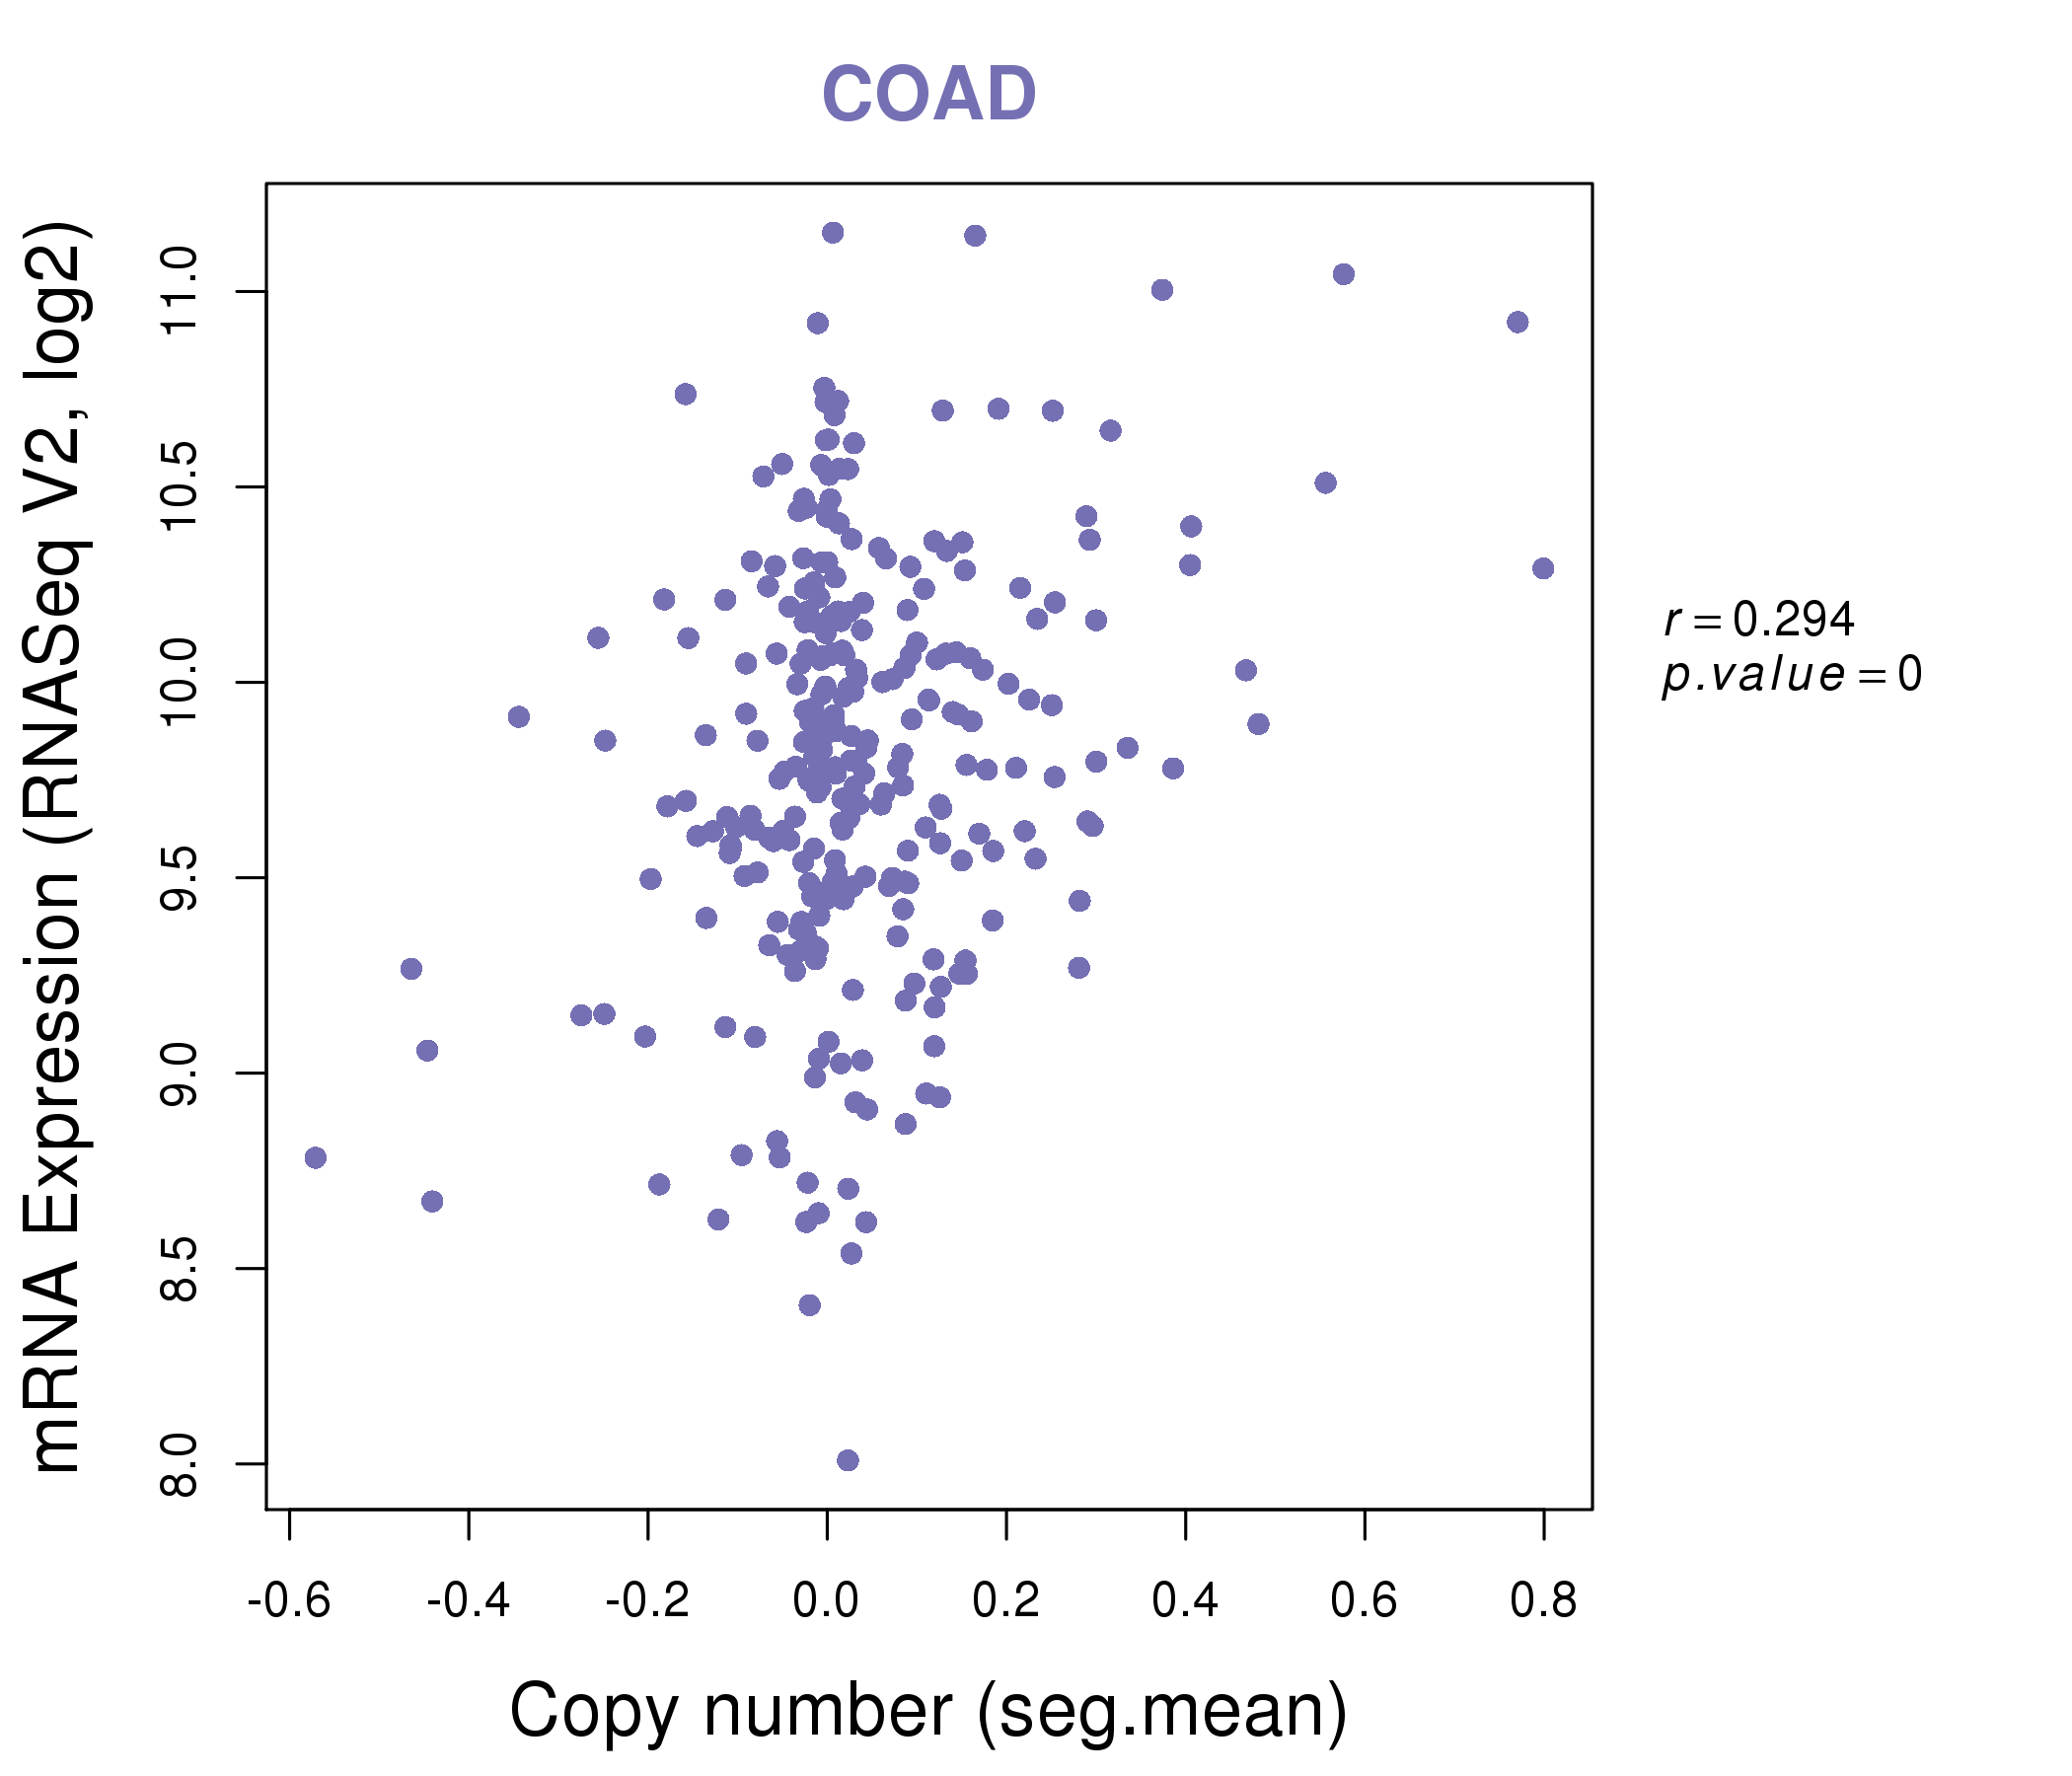
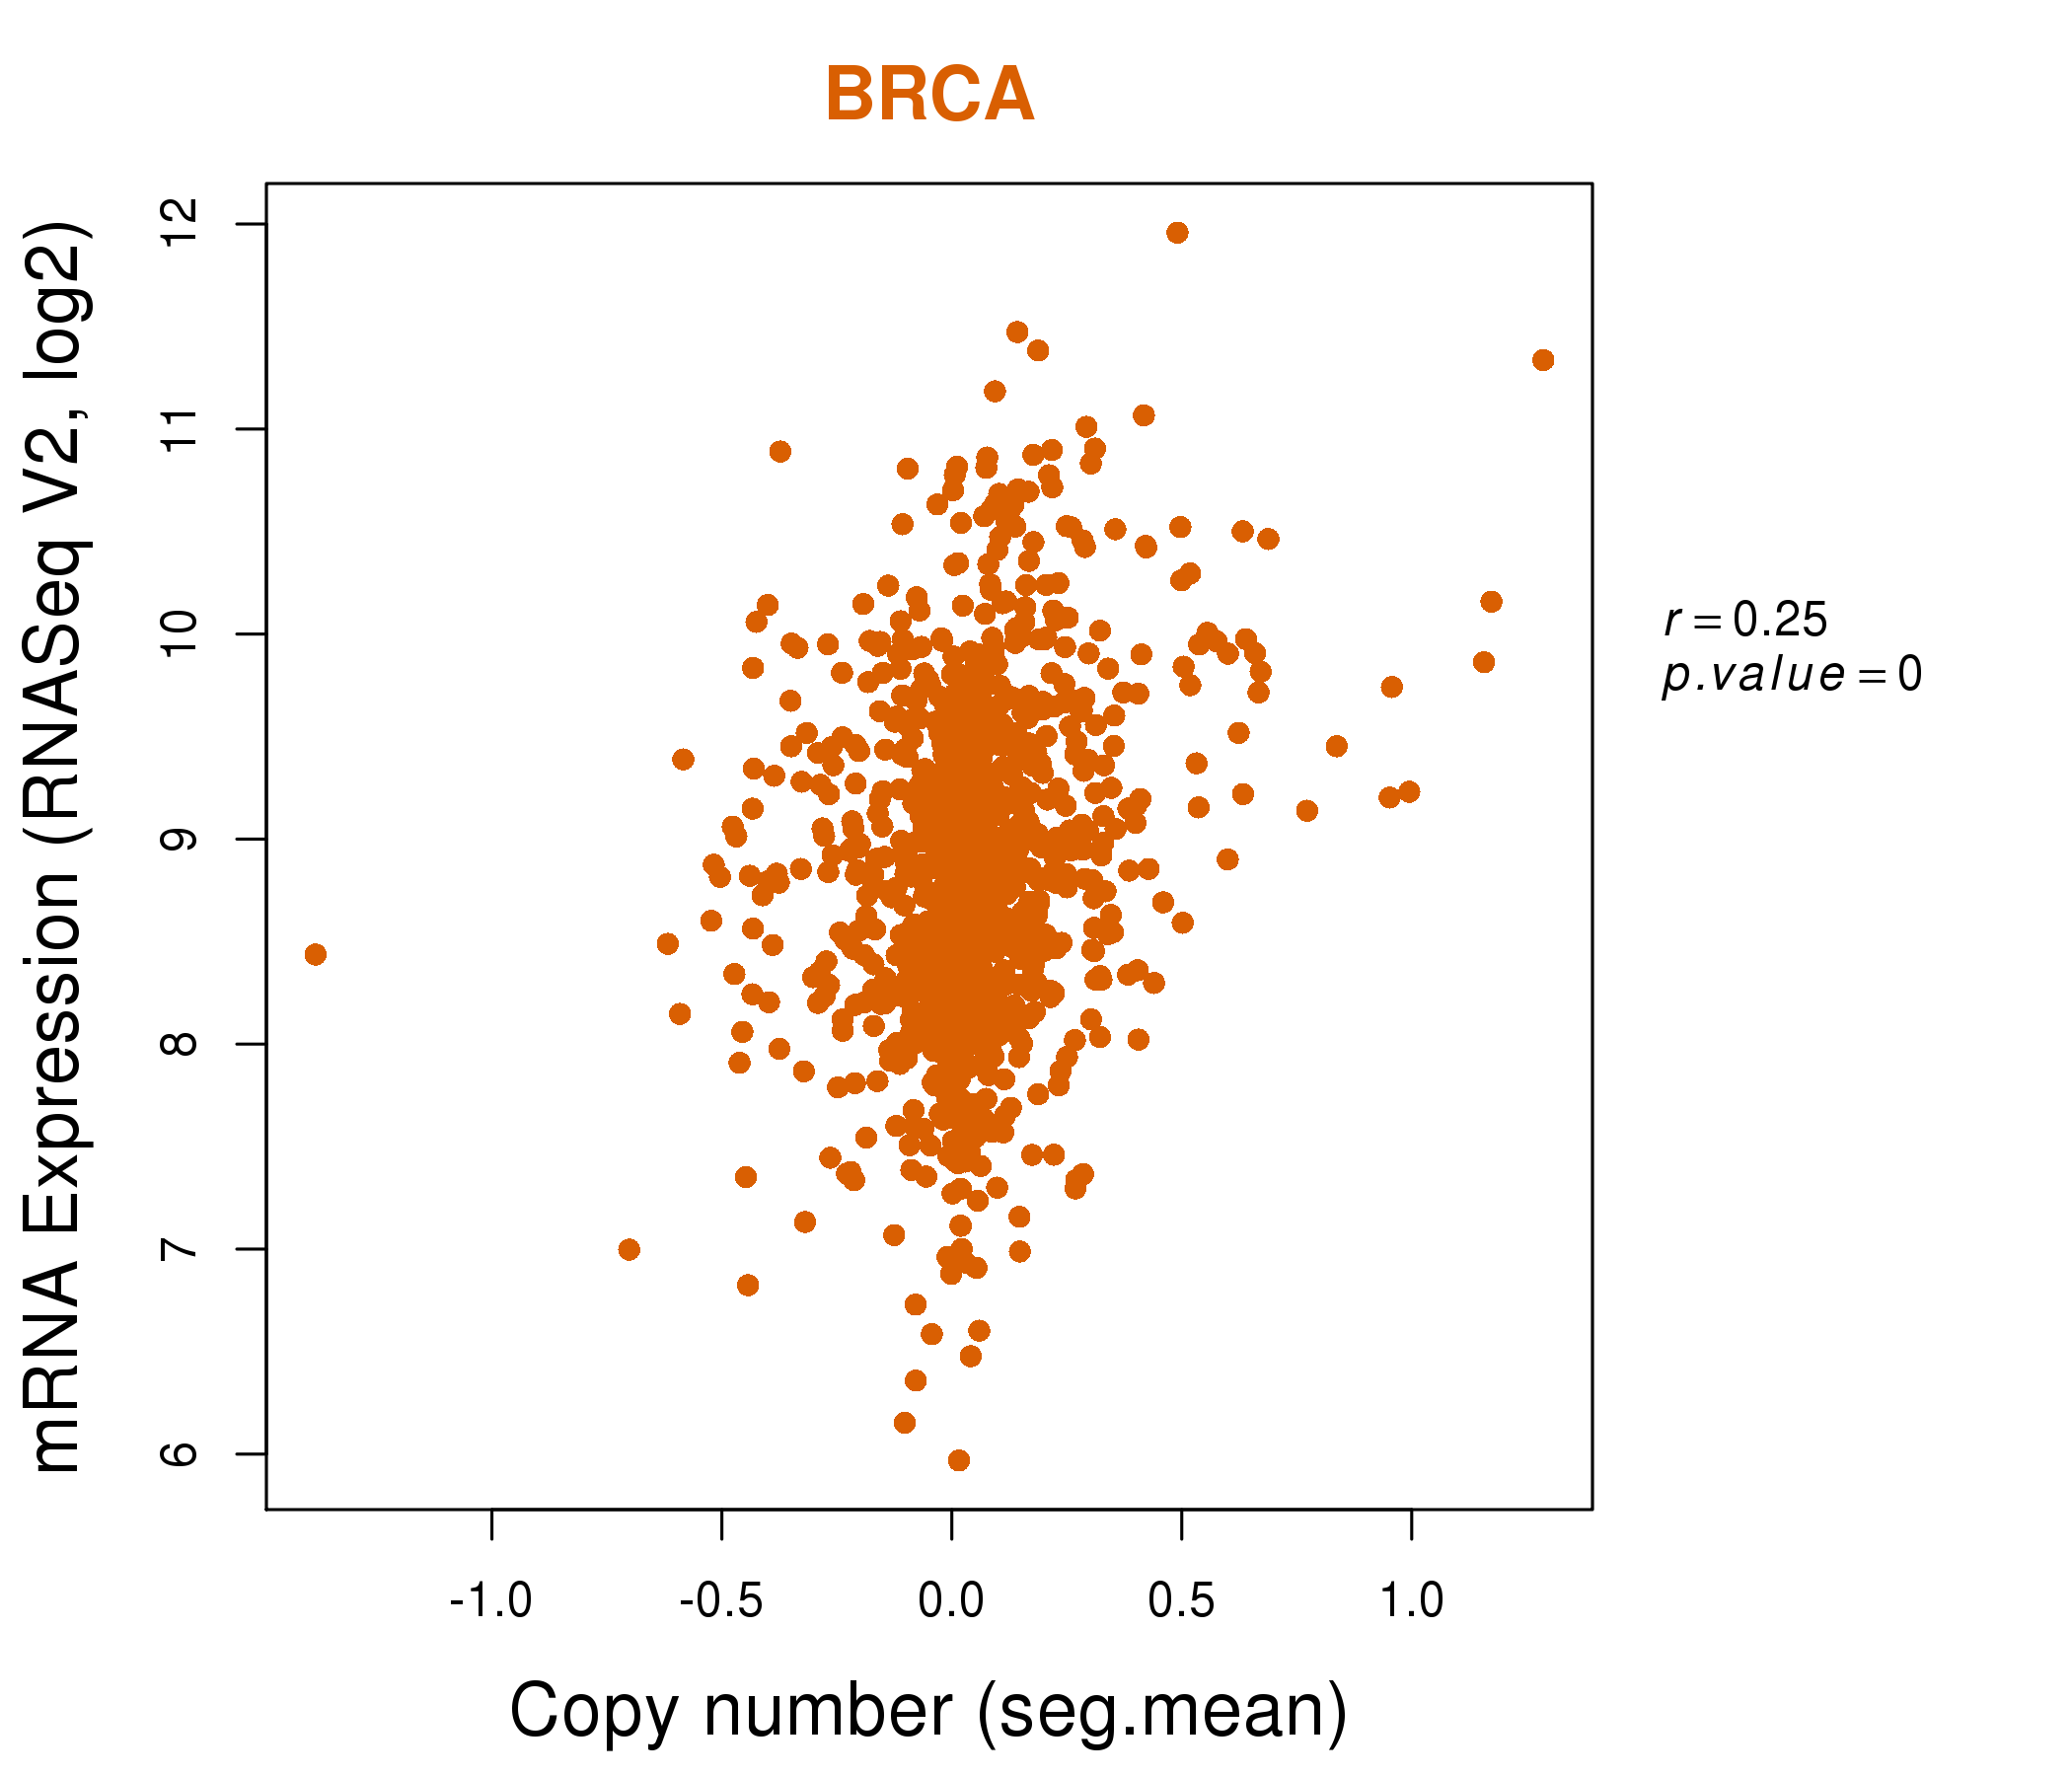
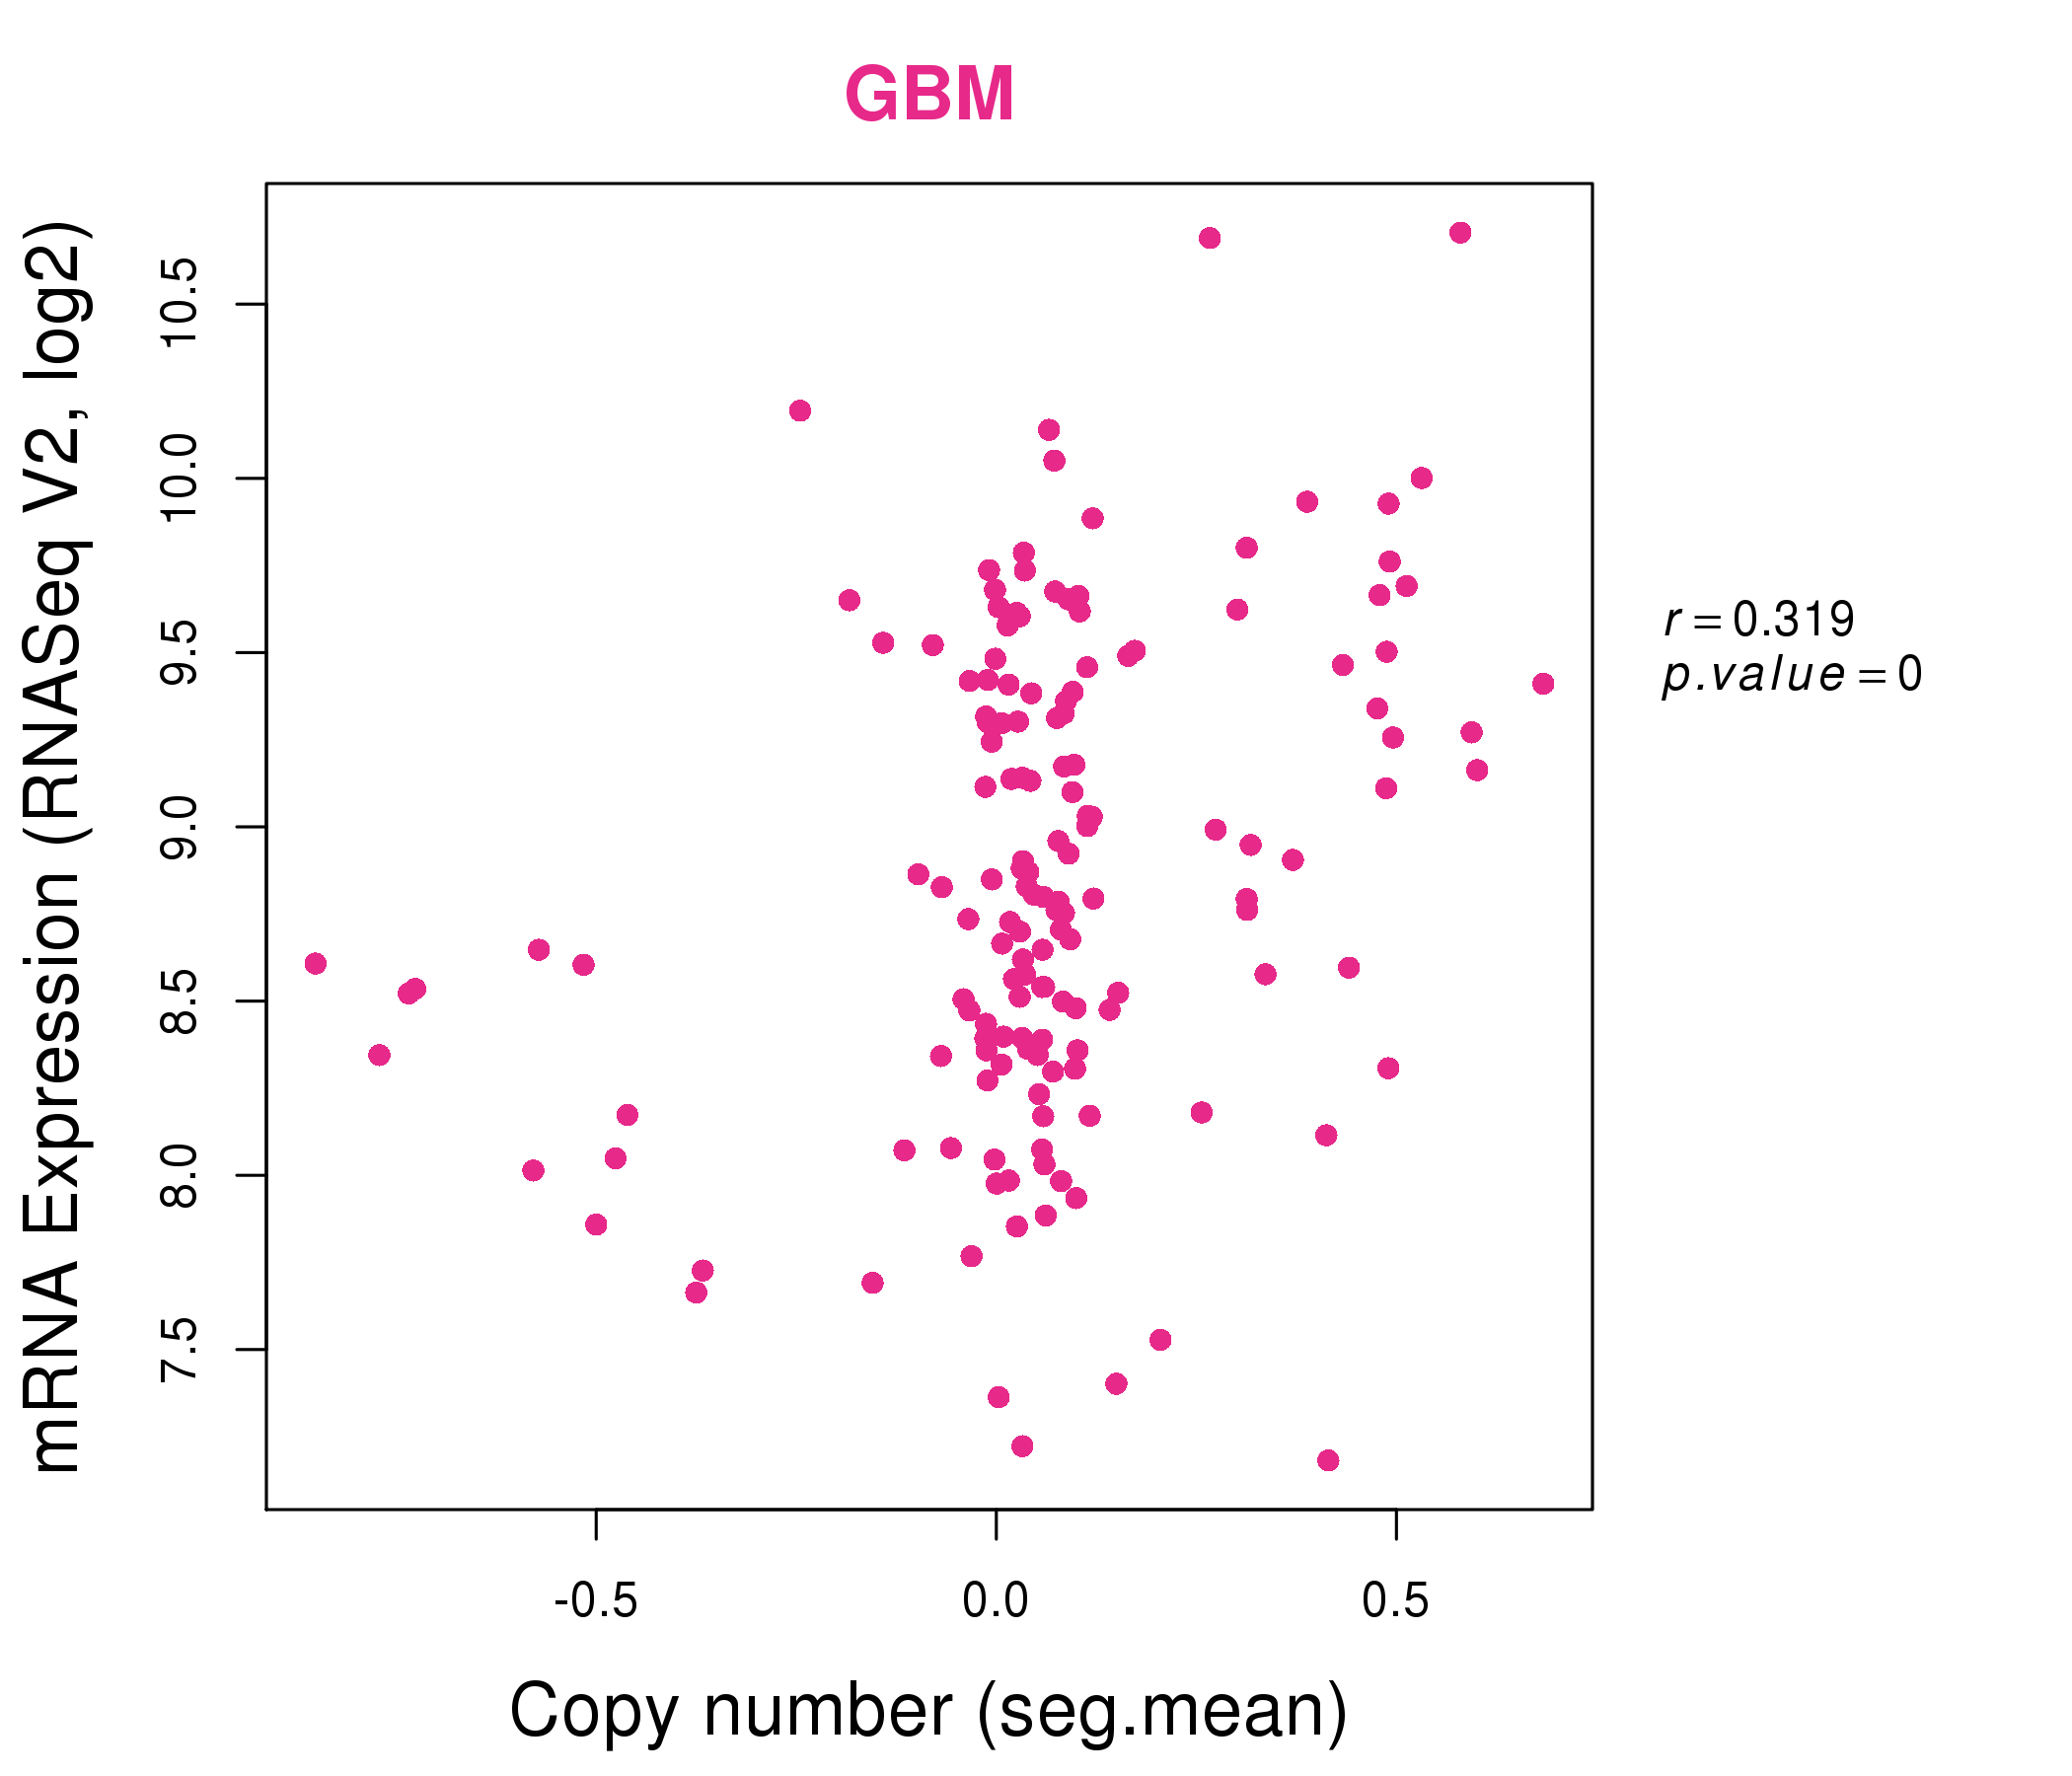
| * This plots show the correlation between CNV and gene expression. |
: Open all plots for all cancer types
 |
|
 |
|
| Top |
| Gene-Gene Network Information |
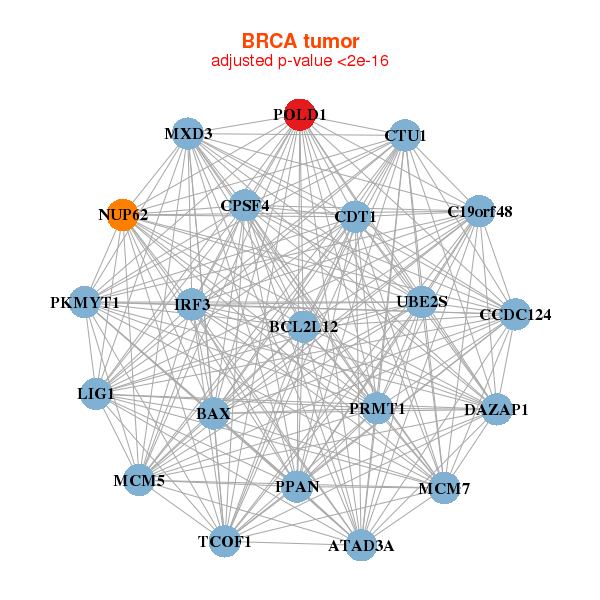
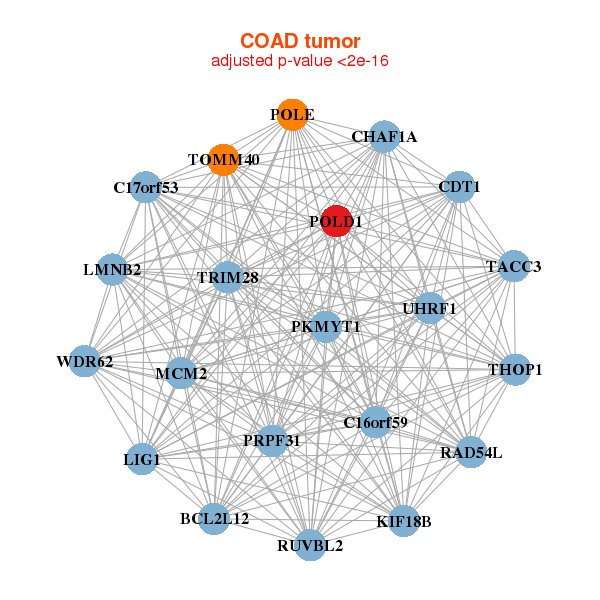
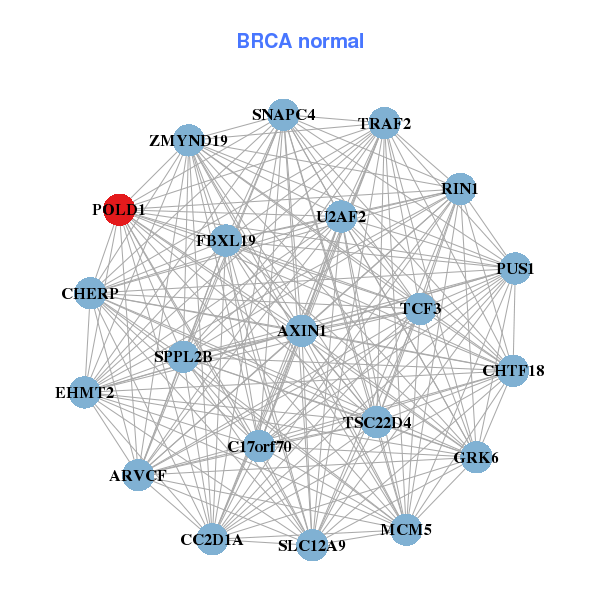
| * Co-Expression network figures were drawn using R package igraph. Only the top 20 genes with the highest correlations were shown. Red circle: input gene, orange circle: cell metabolism gene, sky circle: other gene |
: Open all plots for all cancer types
 |
|
| ATAD3A,BAX,BCL2L12,C19orf48,CCDC124,CDT1,CPSF4, CTU1,DAZAP1,IRF3,LIG1,MCM5,MCM7,MXD3, NUP62,PKMYT1,POLD1,PPAN,PRMT1,TCOF1,UBE2S | ARVCF,AXIN1,C17orf70,CC2D1A,CHERP,CHTF18,EHMT2, FBXL19,GRK6,MCM5,POLD1,PUS1,RIN1,SLC12A9, SNAPC4,SPPL2B,TCF3,TRAF2,TSC22D4,U2AF2,ZMYND19 |
 |
|
| BCL2L12,C16orf59,C17orf53,CDT1,CHAF1A,KIF18B,LIG1, LMNB2,MCM2,PKMYT1,POLD1,POLE,PRPF31,RAD54L, RUVBL2,TACC3,THOP1,TOMM40,TRIM28,UHRF1,WDR62 | C14orf80,CDT1,CHAF1A,CHTF18,H2AFX,LIG1,LOC100128191, LRRC45,MCM5,MED24,TONSL,POLD1,PPP2R3B,RECQL4, REEP4,SPC24,SYMPK,TACC3,TARS2,U2AF2,ZNF296 |
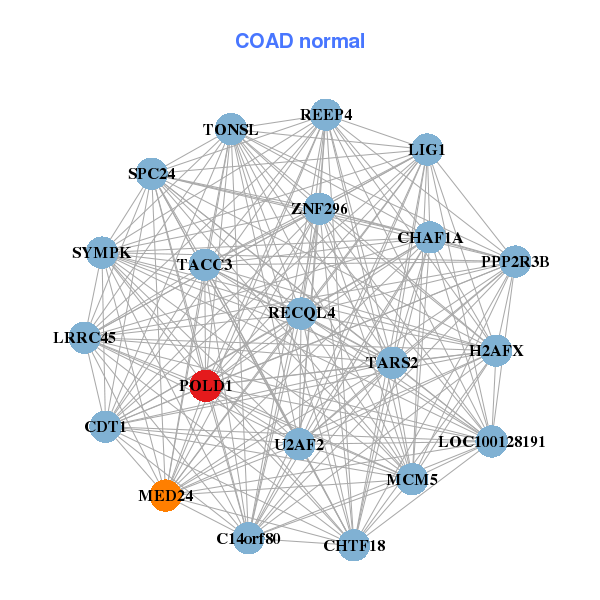
| * Co-Expression network figures were drawn using R package igraph. Only the top 20 genes with the highest correlations were shown. Red circle: input gene, orange circle: cell metabolism gene, sky circle: other gene |
: Open all plots for all cancer types
| Top |
: Open all interacting genes' information including KEGG pathway for all interacting genes from DAVID
| Top |
| Pharmacological Information for POLD1 |
| There's no related Drug. |
| Top |
| Cross referenced IDs for POLD1 |
| * We obtained these cross-references from Uniprot database. It covers 150 different DBs, 18 categories. http://www.uniprot.org/help/cross_references_section |
: Open all cross reference information
|
Copyright © 2016-Present - The Univsersity of Texas Health Science Center at Houston @ |