|
||||||||||||||||||||||||||||||||||||||||||||||||||||||||||||||||||||||||||||||||||||||||||||||||||||||||||||||||||||||||||||||||||||||||||||||||||||||||||||||||||||||||||||||||||||||||||||||||||||||||||||||||||||||||||||||||||||||||||||||||||||||||||||||||||||||||||||||||||||||||||||||||||||||||||||||||||||||||||
| |
| Phenotypic Information (metabolism pathway, cancer, disease, phenome) |
| |
| |
| Gene-Gene Network Information: Co-Expression Network, Interacting Genes & KEGG |
| |
|


| Gene Summary for POLR2B |
| Basic gene info. | Gene symbol | POLR2B |
| Gene name | polymerase (RNA) II (DNA directed) polypeptide B, 140kDa | |
| Synonyms | POL2RB|RPB2|hRPB140|hsRPB2 | |
| Cytomap | UCSC genome browser: 4q12 | |
| Genomic location | chr4 :57845108-57897334 | |
| Type of gene | protein-coding | |
| RefGenes | NM_000938.1, | |
| Ensembl id | ENSG00000047315 | |
| Description | DNA directed RNA polymerase II 140 kDa polypeptide, RNA polymerase II subunit 2, RNA polymerase II second largest subunitDNA-directed RNA polymerase II 140 kDa polypeptideDNA-directed RNA polymerase II subunit BDNA-directed RNA polymerase II subunit RP | |
| Modification date | 20141207 | |
| dbXrefs | MIM : 180661 | |
| HGNC : HGNC | ||
| Ensembl : ENSG00000047315 | ||
| HPRD : 15943 | ||
| Vega : OTTHUMG00000128771 | ||
| Protein | UniProt: P30876 go to UniProt's Cross Reference DB Table | |
| Expression | CleanEX: HS_POLR2B | |
| BioGPS: 5431 | ||
| Gene Expression Atlas: ENSG00000047315 | ||
| The Human Protein Atlas: ENSG00000047315 | ||
| Pathway | NCI Pathway Interaction Database: POLR2B | |
| KEGG: POLR2B | ||
| REACTOME: POLR2B | ||
| ConsensusPathDB | ||
| Pathway Commons: POLR2B | ||
| Metabolism | MetaCyc: POLR2B | |
| HUMANCyc: POLR2B | ||
| Regulation | Ensembl's Regulation: ENSG00000047315 | |
| miRBase: chr4 :57,845,108-57,897,334 | ||
| TargetScan: NM_000938 | ||
| cisRED: ENSG00000047315 | ||
| Context | iHOP: POLR2B | |
| cancer metabolism search in PubMed: POLR2B | ||
| UCL Cancer Institute: POLR2B | ||
| Assigned class in ccmGDB | B - This gene belongs to cancer gene. | |
| Top |
| Phenotypic Information for POLR2B(metabolism pathway, cancer, disease, phenome) |
| Cancer | CGAP: POLR2B |
| Familial Cancer Database: POLR2B | |
| * This gene is included in those cancer gene databases. |
|
|
|
|
|
| . | ||||||||||||||||||||||||||||||||||||||||||||||||||||||||||||||||||||||||||||||||||||||||||||||||||||||||||||||||||||||||||||||||||||||||||||||||||||||||||||||||||||||||||||||||||||||||||||||||||||||||||||||||||||||||||||||||||||||||||||||||||||||||||||||||||||||||||||||||||||||||||||||||||||||||||||||||||||
Oncogene 1 | Significant driver gene in | |||||||||||||||||||||||||||||||||||||||||||||||||||||||||||||||||||||||||||||||||||||||||||||||||||||||||||||||||||||||||||||||||||||||||||||||||||||||||||||||||||||||||||||||||||||||||||||||||||||||||||||||||||||||||||||||||||||||||||||||||||||||||||||||||||||||||||||||||||||||||||||||||||||||||||||||||||||||||
| cf) number; DB name 1 Oncogene; http://nar.oxfordjournals.org/content/35/suppl_1/D721.long, 2 Tumor Suppressor gene; https://bioinfo.uth.edu/TSGene/, 3 Cancer Gene Census; http://www.nature.com/nrc/journal/v4/n3/abs/nrc1299.html, 4 CancerGenes; http://nar.oxfordjournals.org/content/35/suppl_1/D721.long, 5 Network of Cancer Gene; http://ncg.kcl.ac.uk/index.php, 1Therapeutic Vulnerabilities in Cancer; http://cbio.mskcc.org/cancergenomics/statius/ |
| KEGG_PURINE_METABOLISM KEGG_PYRIMIDINE_METABOLISM | |
| OMIM | 180661; gene. |
| Orphanet | |
| Disease | KEGG Disease: POLR2B |
| MedGen: POLR2B (Human Medical Genetics with Condition) | |
| ClinVar: POLR2B | |
| Phenotype | MGI: POLR2B (International Mouse Phenotyping Consortium) |
| PhenomicDB: POLR2B | |
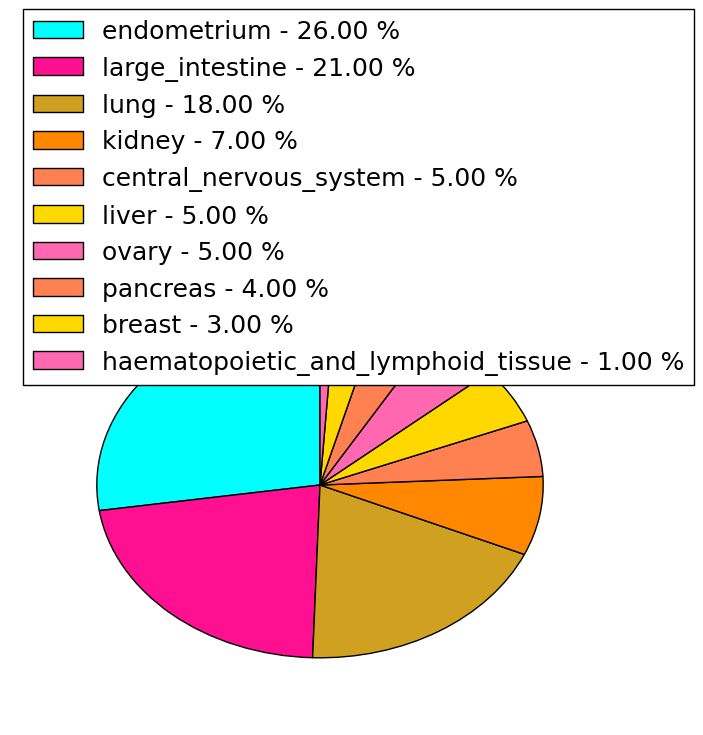
| Mutations for POLR2B |
| * Under tables are showing count per each tissue to give us broad intuition about tissue specific mutation patterns.You can go to the detailed page for each mutation database's web site. |
| There's no structural variation information in COSMIC data for this gene. |
| * From mRNA Sanger sequences, Chitars2.0 arranged chimeric transcripts. This table shows POLR2B related fusion information. |
| ID | Head Gene | Tail Gene | Accession | Gene_a | qStart_a | qEnd_a | Chromosome_a | tStart_a | tEnd_a | Gene_a | qStart_a | qEnd_a | Chromosome_a | tStart_a | tEnd_a |
| W81478 | POLR2B | 1 | 142 | 4 | 57896942 | 57897082 | IGF2BP3 | 135 | 392 | 7 | 23419096 | 23419353 | |
| W81438 | IGF2BP3 | 1 | 288 | 7 | 23419096 | 23419383 | POLR2B | 281 | 362 | 4 | 57897001 | 57897082 | |
| Top |
| Mutation type/ Tissue ID | brca | cns | cerv | endome | haematopo | kidn | Lintest | liver | lung | ns | ovary | pancre | prost | skin | stoma | thyro | urina | |||
| Total # sample | 4 | 1 | ||||||||||||||||||
| GAIN (# sample) | 4 | 1 | ||||||||||||||||||
| LOSS (# sample) |
| cf) Tissue ID; Tissue type (1; Breast, 2; Central_nervous_system, 3; Cervix, 4; Endometrium, 5; Haematopoietic_and_lymphoid_tissue, 6; Kidney, 7; Large_intestine, 8; Liver, 9; Lung, 10; NS, 11; Ovary, 12; Pancreas, 13; Prostate, 14; Skin, 15; Stomach, 16; Thyroid, 17; Urinary_tract) |
| Top |
|
 |
| Top |
| Stat. for Non-Synonymous SNVs (# total SNVs=90) | (# total SNVs=23) |
 | 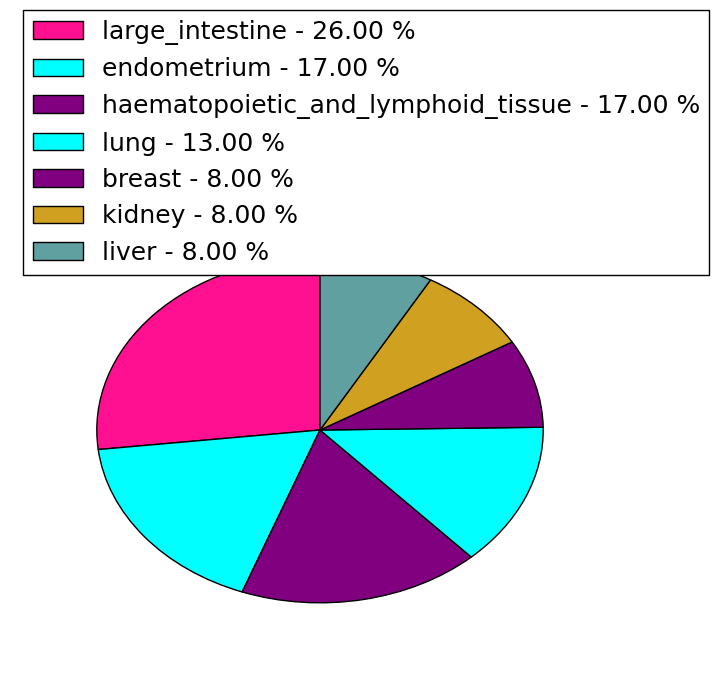 |
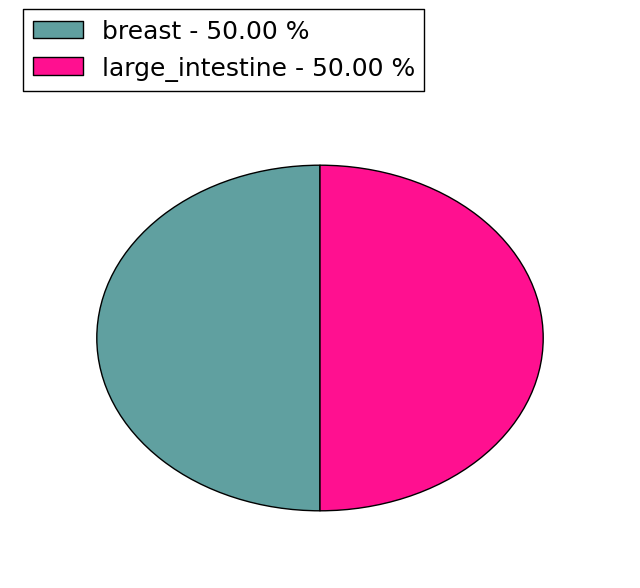
(# total SNVs=2) | (# total SNVs=0) |
 |
| Top |
| * When you move the cursor on each content, you can see more deailed mutation information on the Tooltip. Those are primary_site,primary_histology,mutation(aa),pubmedID. |
| GRCh37 position | Mutation(aa) | Unique sampleID count |
| chr4:57871762-57871762 | p.? | 5 |
| chr4:57865797-57865797 | p.S250S | 3 |
| chr4:57896476-57896476 | p.V1116I | 3 |
| chr4:57881715-57881715 | p.T616T | 3 |
| chr4:57877060-57877060 | p.? | 2 |
| chr4:57876570-57876570 | p.R483H | 2 |
| chr4:57883767-57883767 | p.A732A | 2 |
| chr4:57890238-57890238 | p.R975H | 2 |
| chr4:57876591-57876591 | p.G490V | 2 |
| chr4:57888376-57888376 | p.E827* | 2 |
| Top |
|
 |
| Point Mutation/ Tissue ID | 1 | 2 | 3 | 4 | 5 | 6 | 7 | 8 | 9 | 10 | 11 | 12 | 13 | 14 | 15 | 16 | 17 | 18 | 19 | 20 |
| # sample | 1 | 2 | 11 | 1 | 3 | 5 | 1 | 10 | 4 | 3 | 1 | 8 | 8 | 1 | 17 | |||||
| # mutation | 1 | 2 | 13 | 1 | 3 | 5 | 2 | 12 | 4 | 3 | 1 | 8 | 10 | 1 | 23 | |||||
| nonsynonymous SNV | 1 | 1 | 11 | 1 | 2 | 4 | 1 | 8 | 4 | 3 | 7 | 9 | 1 | 20 | ||||||
| synonymous SNV | 1 | 2 | 1 | 1 | 1 | 4 | 1 | 1 | 1 | 3 |
| cf) Tissue ID; Tissue type (1; BLCA[Bladder Urothelial Carcinoma], 2; BRCA[Breast invasive carcinoma], 3; CESC[Cervical squamous cell carcinoma and endocervical adenocarcinoma], 4; COAD[Colon adenocarcinoma], 5; GBM[Glioblastoma multiforme], 6; Glioma Low Grade, 7; HNSC[Head and Neck squamous cell carcinoma], 8; KICH[Kidney Chromophobe], 9; KIRC[Kidney renal clear cell carcinoma], 10; KIRP[Kidney renal papillary cell carcinoma], 11; LAML[Acute Myeloid Leukemia], 12; LUAD[Lung adenocarcinoma], 13; LUSC[Lung squamous cell carcinoma], 14; OV[Ovarian serous cystadenocarcinoma ], 15; PAAD[Pancreatic adenocarcinoma], 16; PRAD[Prostate adenocarcinoma], 17; SKCM[Skin Cutaneous Melanoma], 18:STAD[Stomach adenocarcinoma], 19:THCA[Thyroid carcinoma], 20:UCEC[Uterine Corpus Endometrial Carcinoma]) |
| Top |
| * We represented just top 10 SNVs. When you move the cursor on each content, you can see more deailed mutation information on the Tooltip. Those are primary_site, primary_histology, mutation(aa), pubmedID. |
| Genomic Position | Mutation(aa) | Unique sampleID count |
| chr4:57896476 | p.S250S | 3 |
| chr4:57865797 | p.V1116I | 3 |
| chr4:57871515 | p.G804S | 2 |
| chr4:57889516 | p.K993N | 2 |
| chr4:57891066 | p.R335I | 2 |
| chr4:57883852 | p.D846N | 2 |
| chr4:57887151 | p.D606N | 2 |
| chr4:57881683 | p.T761A | 2 |
| chr4:57860967 | p.G490D | 1 |
| chr4:57881716 | p.G775V | 1 |
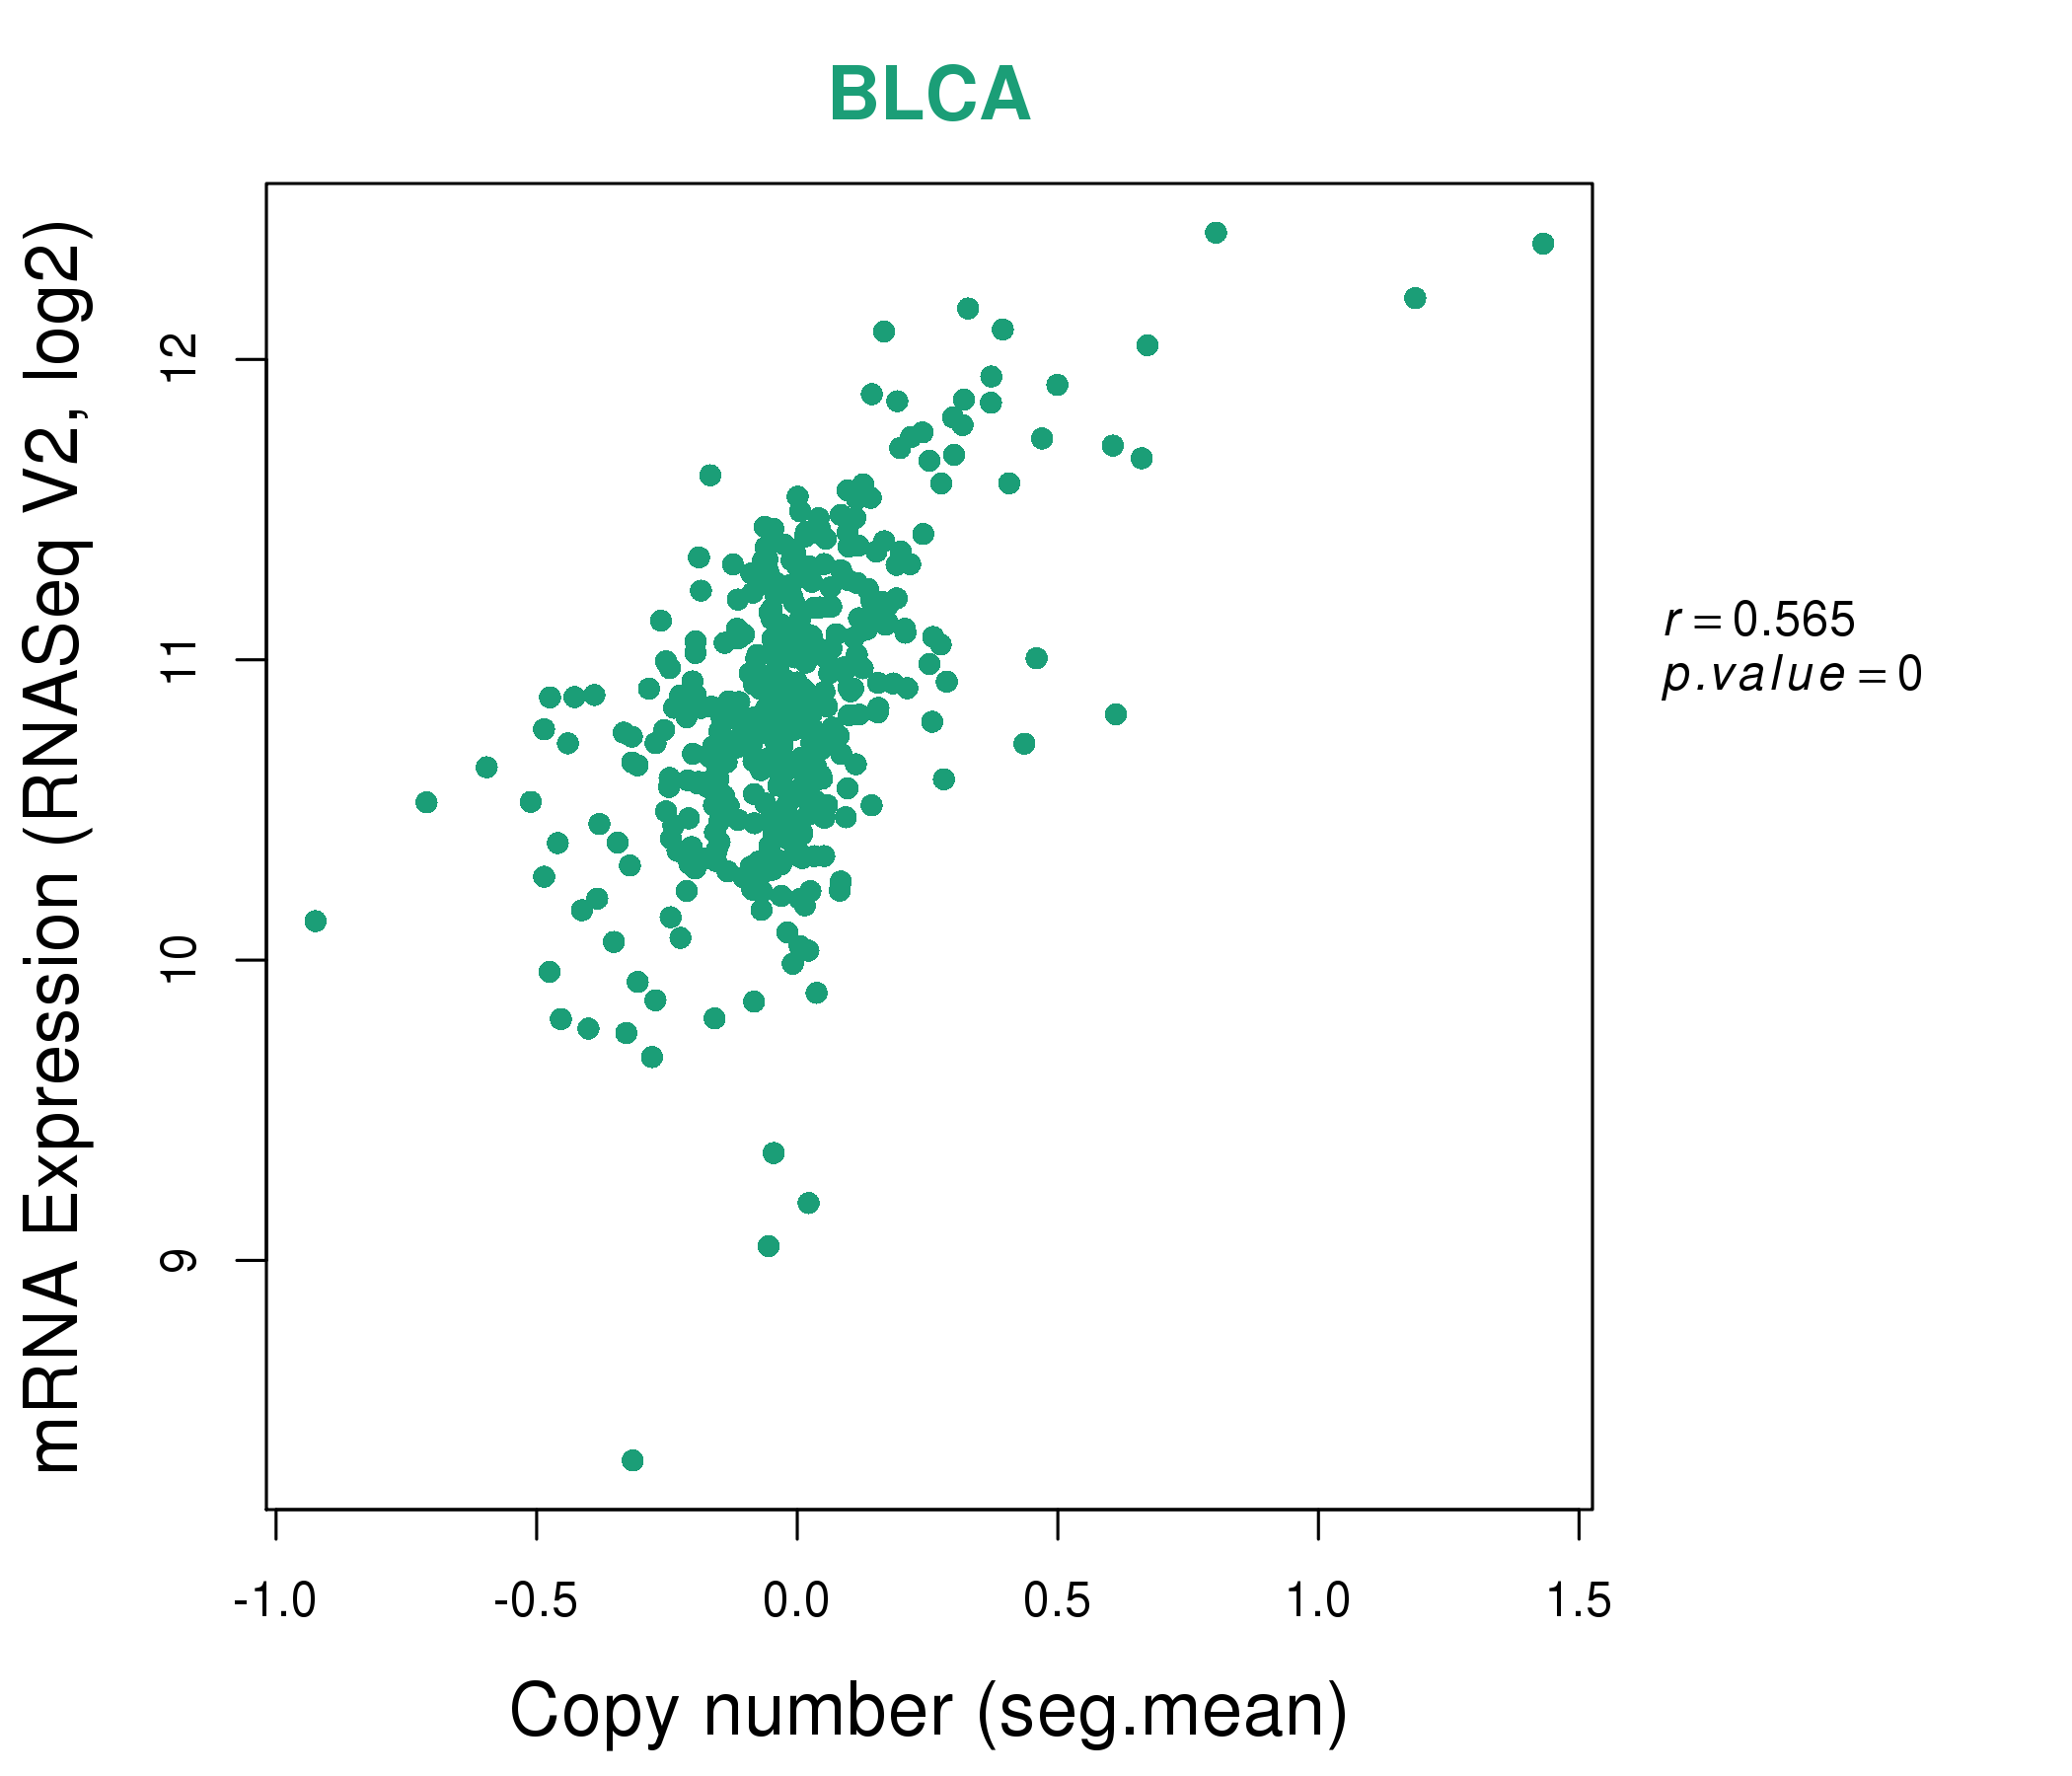
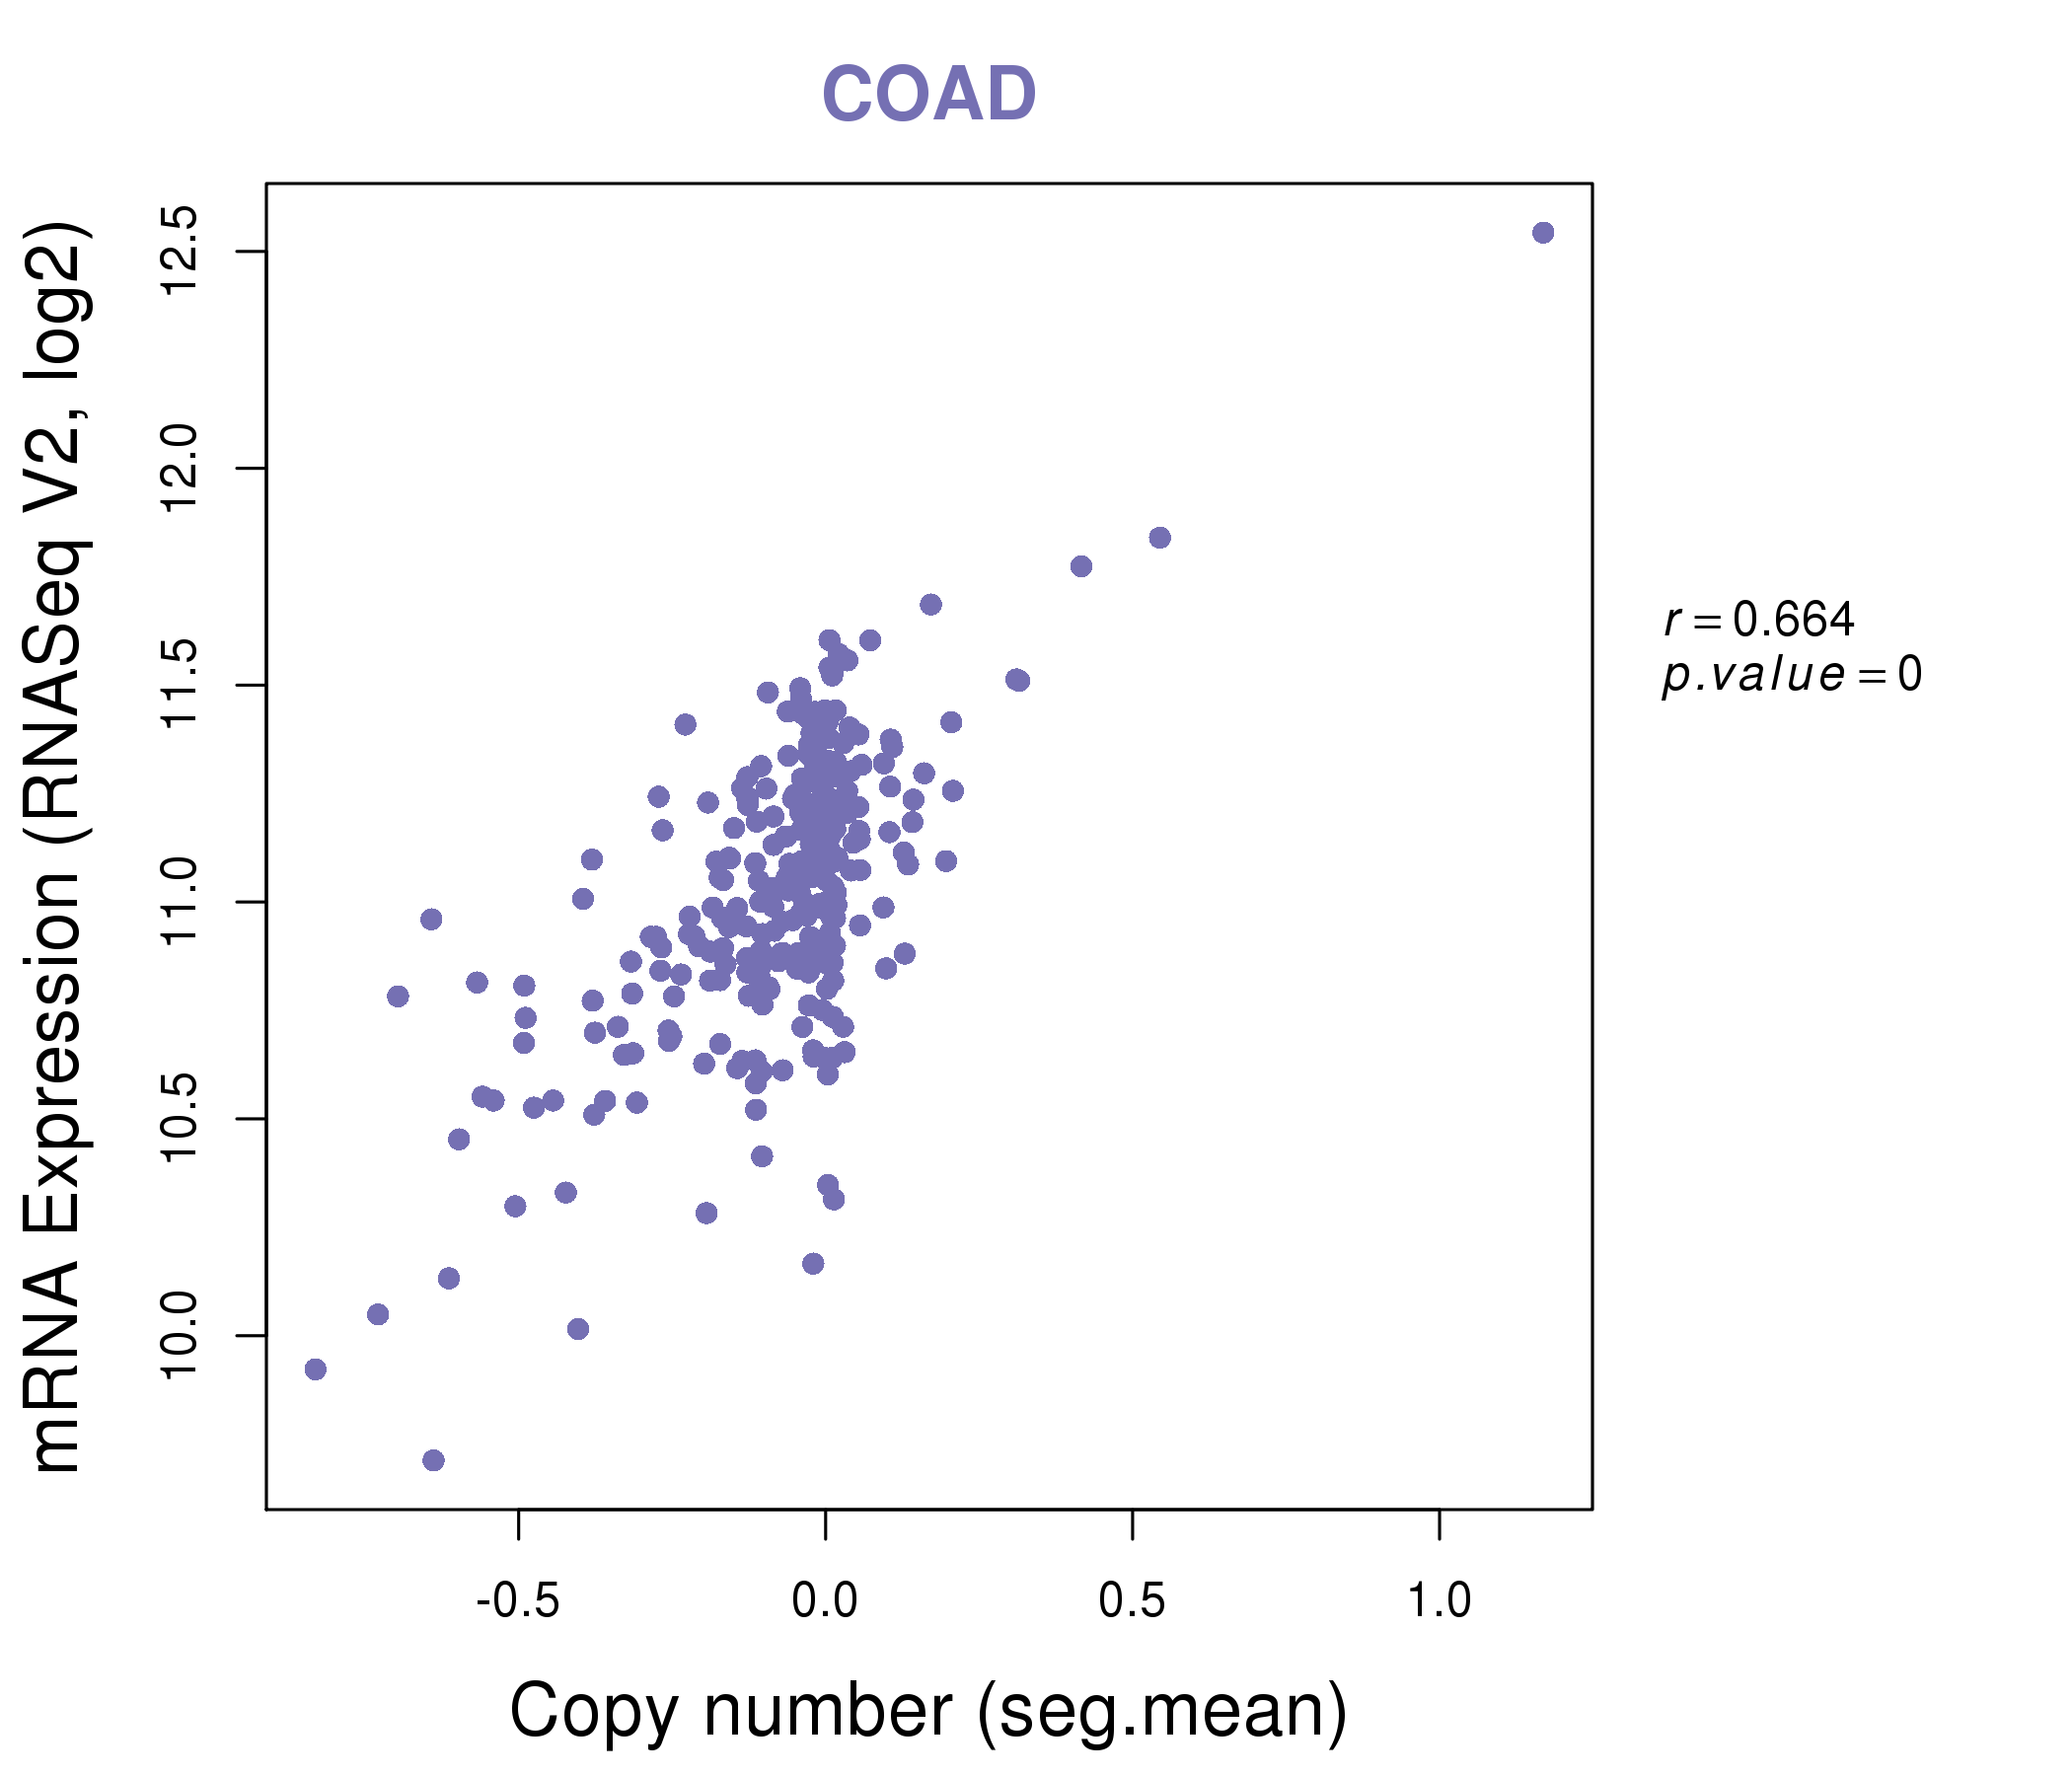
| * Copy number data were extracted from TCGA using R package TCGA-Assembler. The URLs of all public data files on TCGA DCC data server were gathered on Jan-05-2015. Function ProcessCNAData in TCGA-Assembler package was used to obtain gene-level copy number value which is calculated as the average copy number of the genomic region of a gene. |
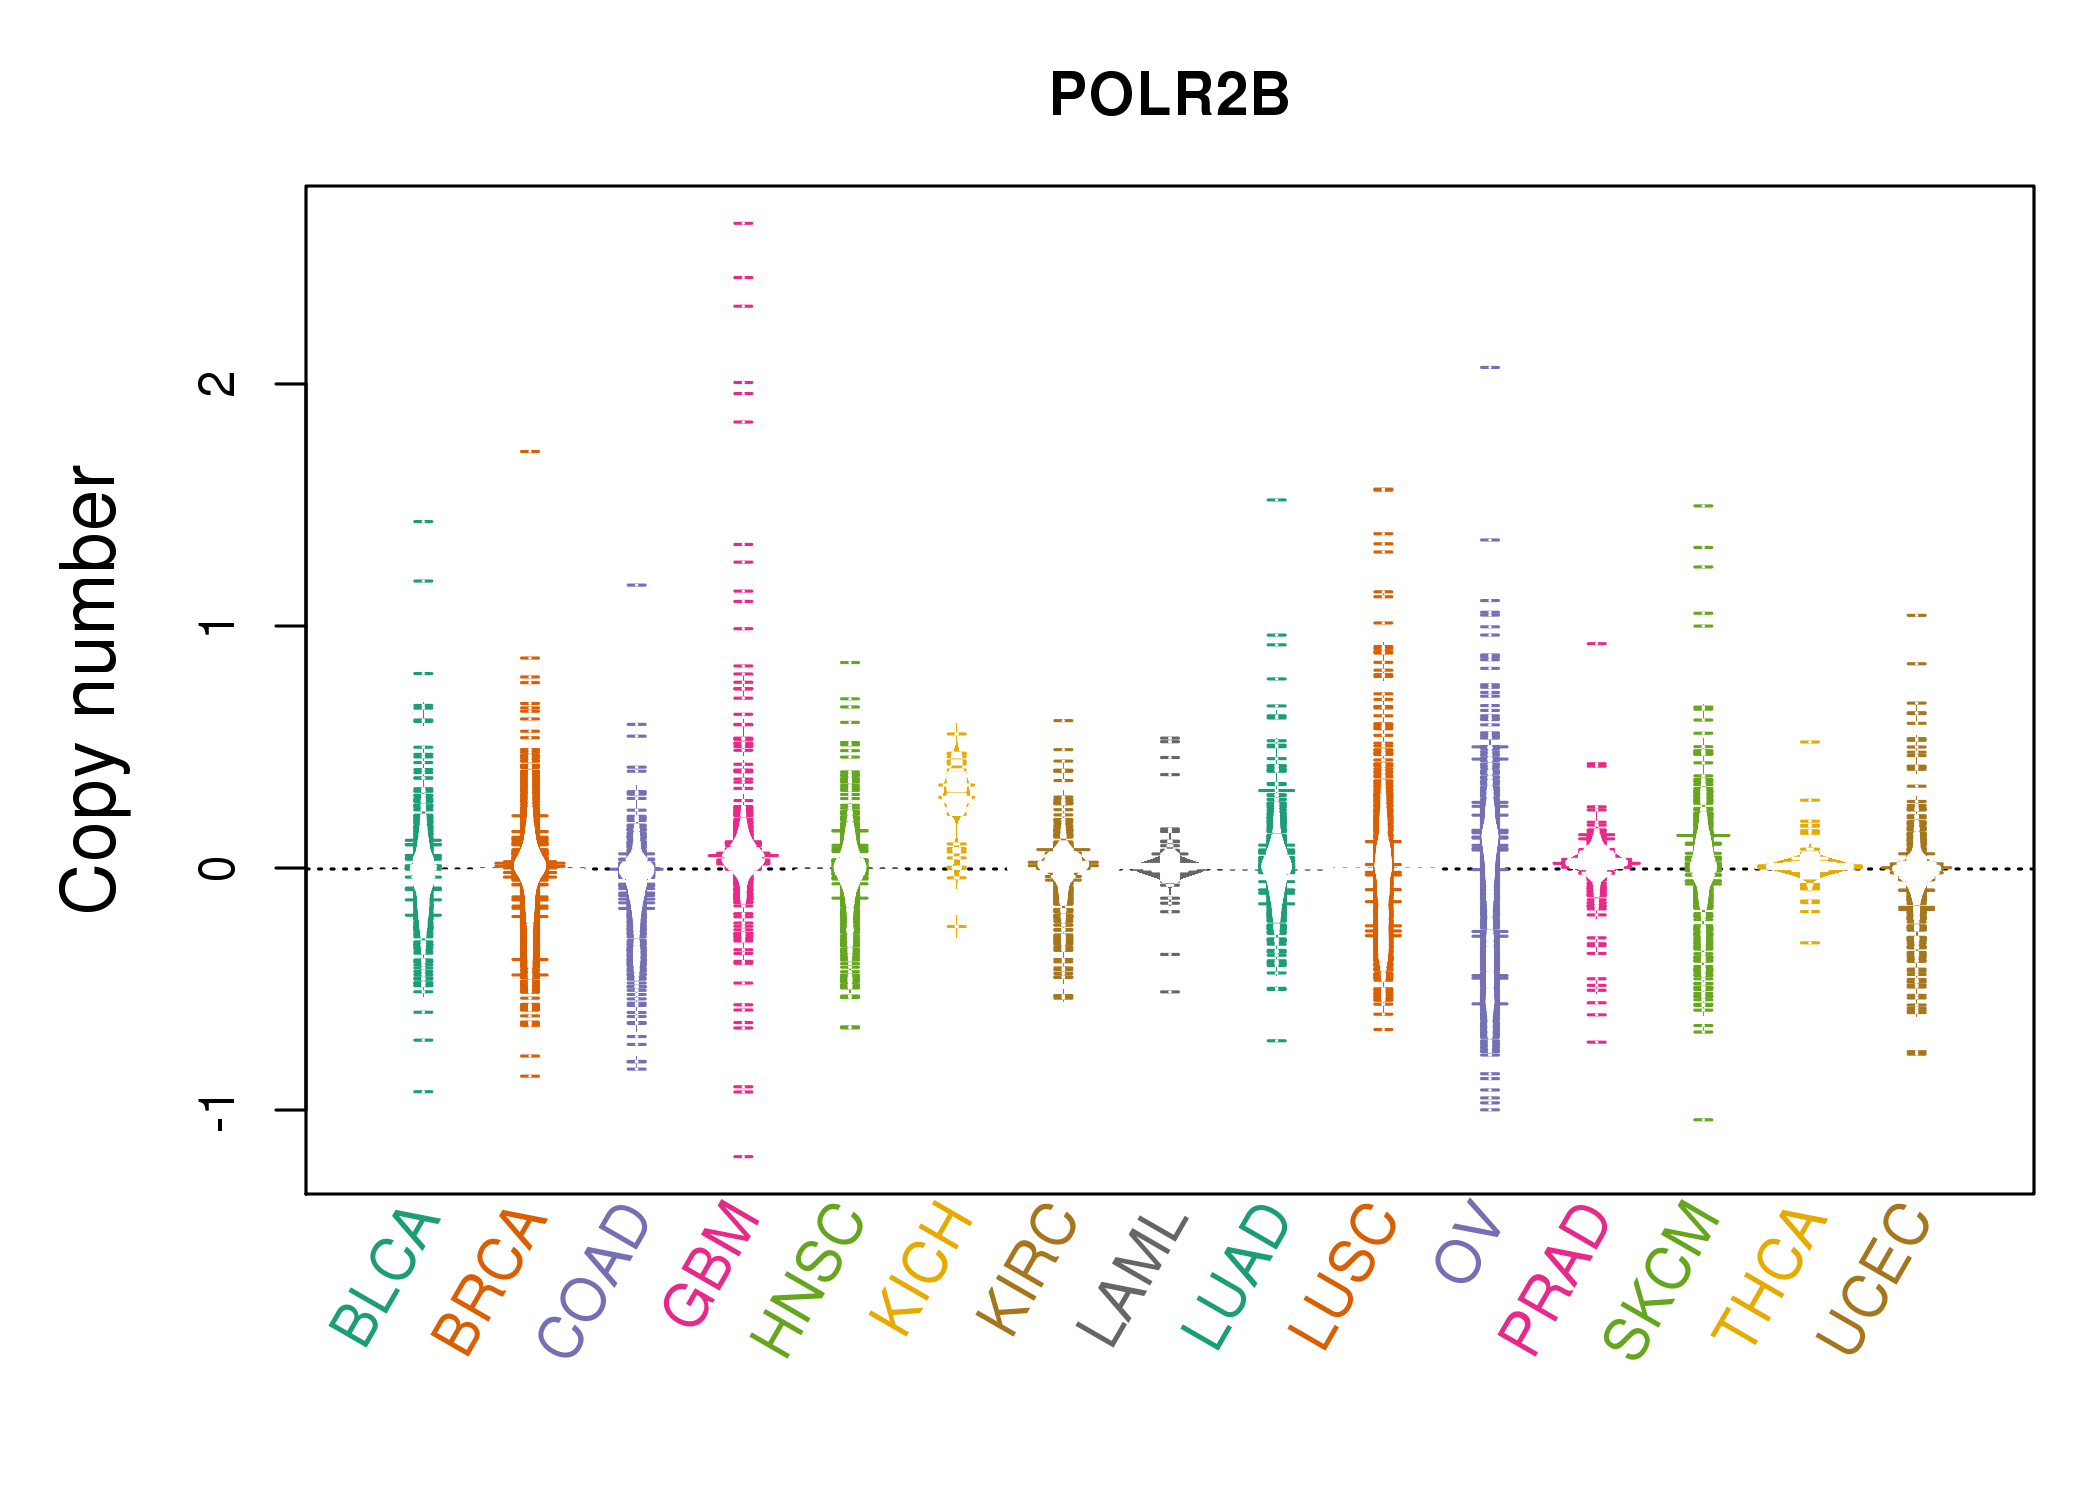 |
| cf) Tissue ID[Tissue type]: BLCA[Bladder Urothelial Carcinoma], BRCA[Breast invasive carcinoma], CESC[Cervical squamous cell carcinoma and endocervical adenocarcinoma], COAD[Colon adenocarcinoma], GBM[Glioblastoma multiforme], Glioma Low Grade, HNSC[Head and Neck squamous cell carcinoma], KICH[Kidney Chromophobe], KIRC[Kidney renal clear cell carcinoma], KIRP[Kidney renal papillary cell carcinoma], LAML[Acute Myeloid Leukemia], LUAD[Lung adenocarcinoma], LUSC[Lung squamous cell carcinoma], OV[Ovarian serous cystadenocarcinoma ], PAAD[Pancreatic adenocarcinoma], PRAD[Prostate adenocarcinoma], SKCM[Skin Cutaneous Melanoma], STAD[Stomach adenocarcinoma], THCA[Thyroid carcinoma], UCEC[Uterine Corpus Endometrial Carcinoma] |
| Top |
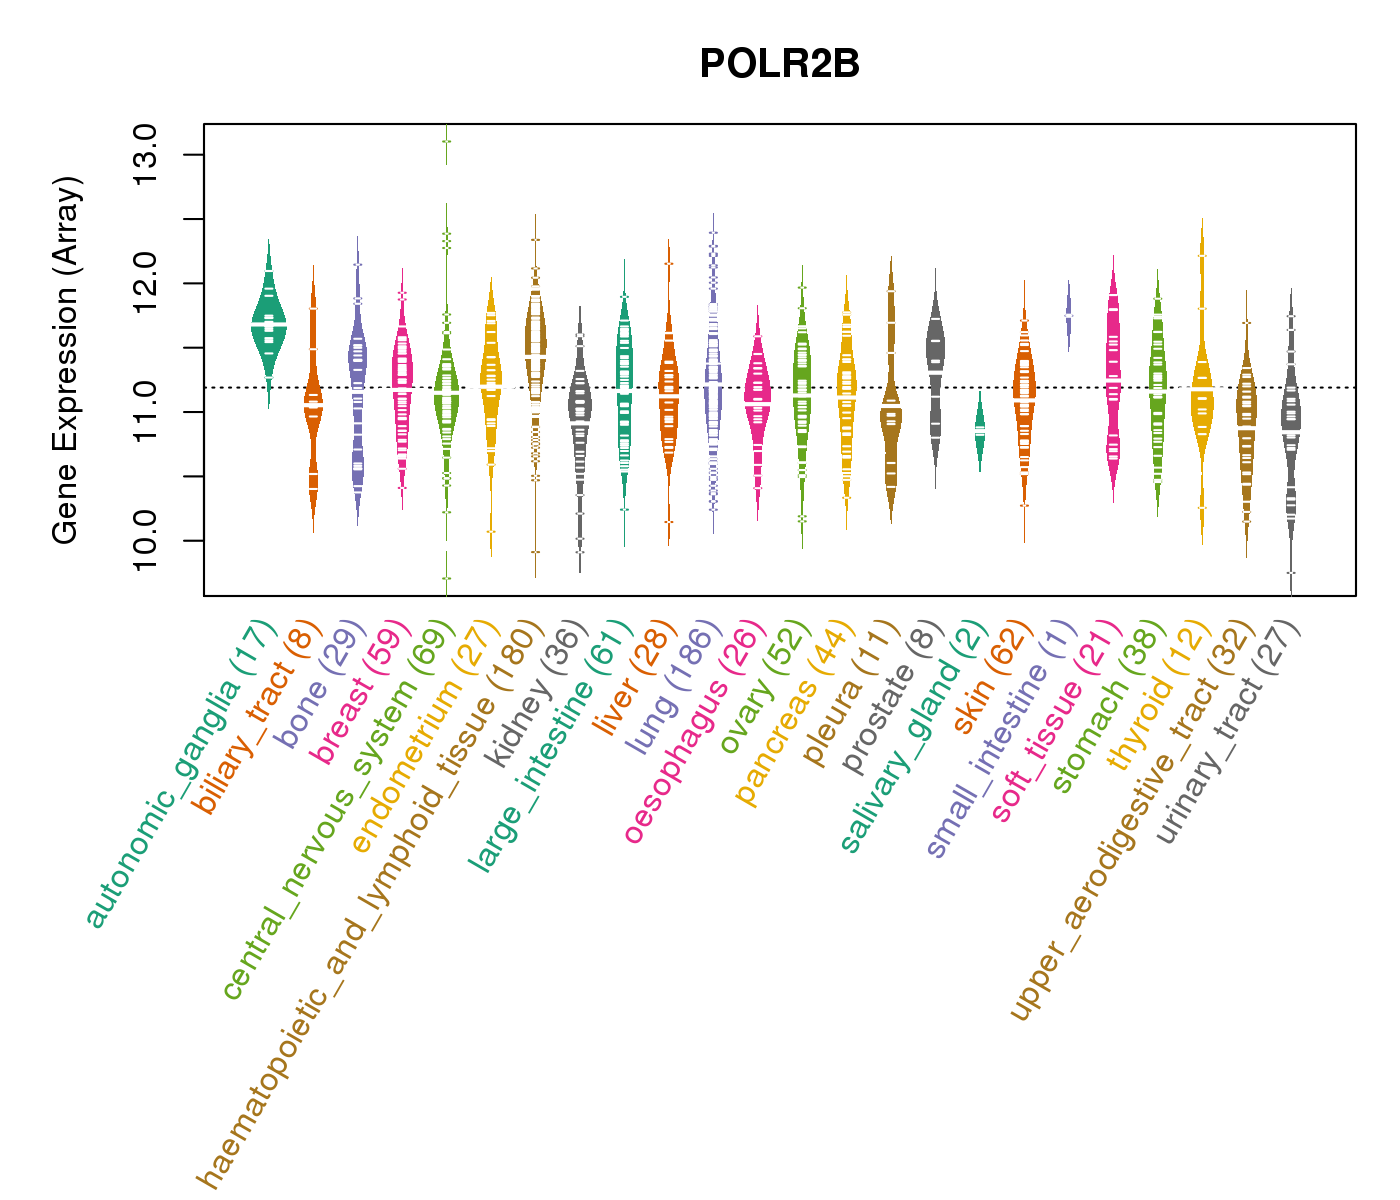
| Gene Expression for POLR2B |
| * CCLE gene expression data were extracted from CCLE_Expression_Entrez_2012-10-18.res: Gene-centric RMA-normalized mRNA expression data. |
 |
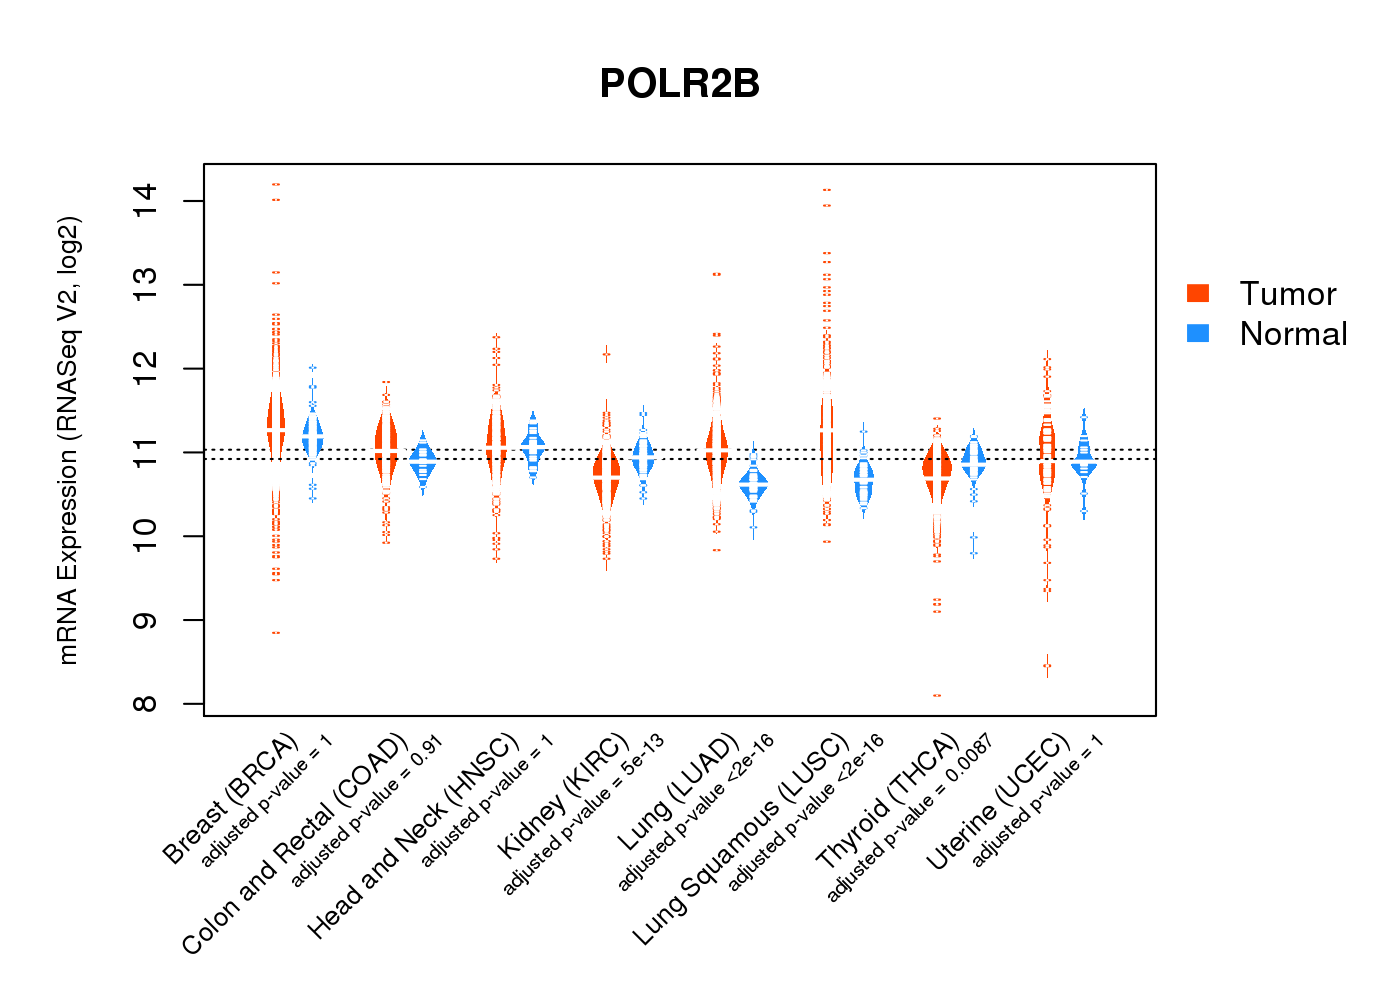
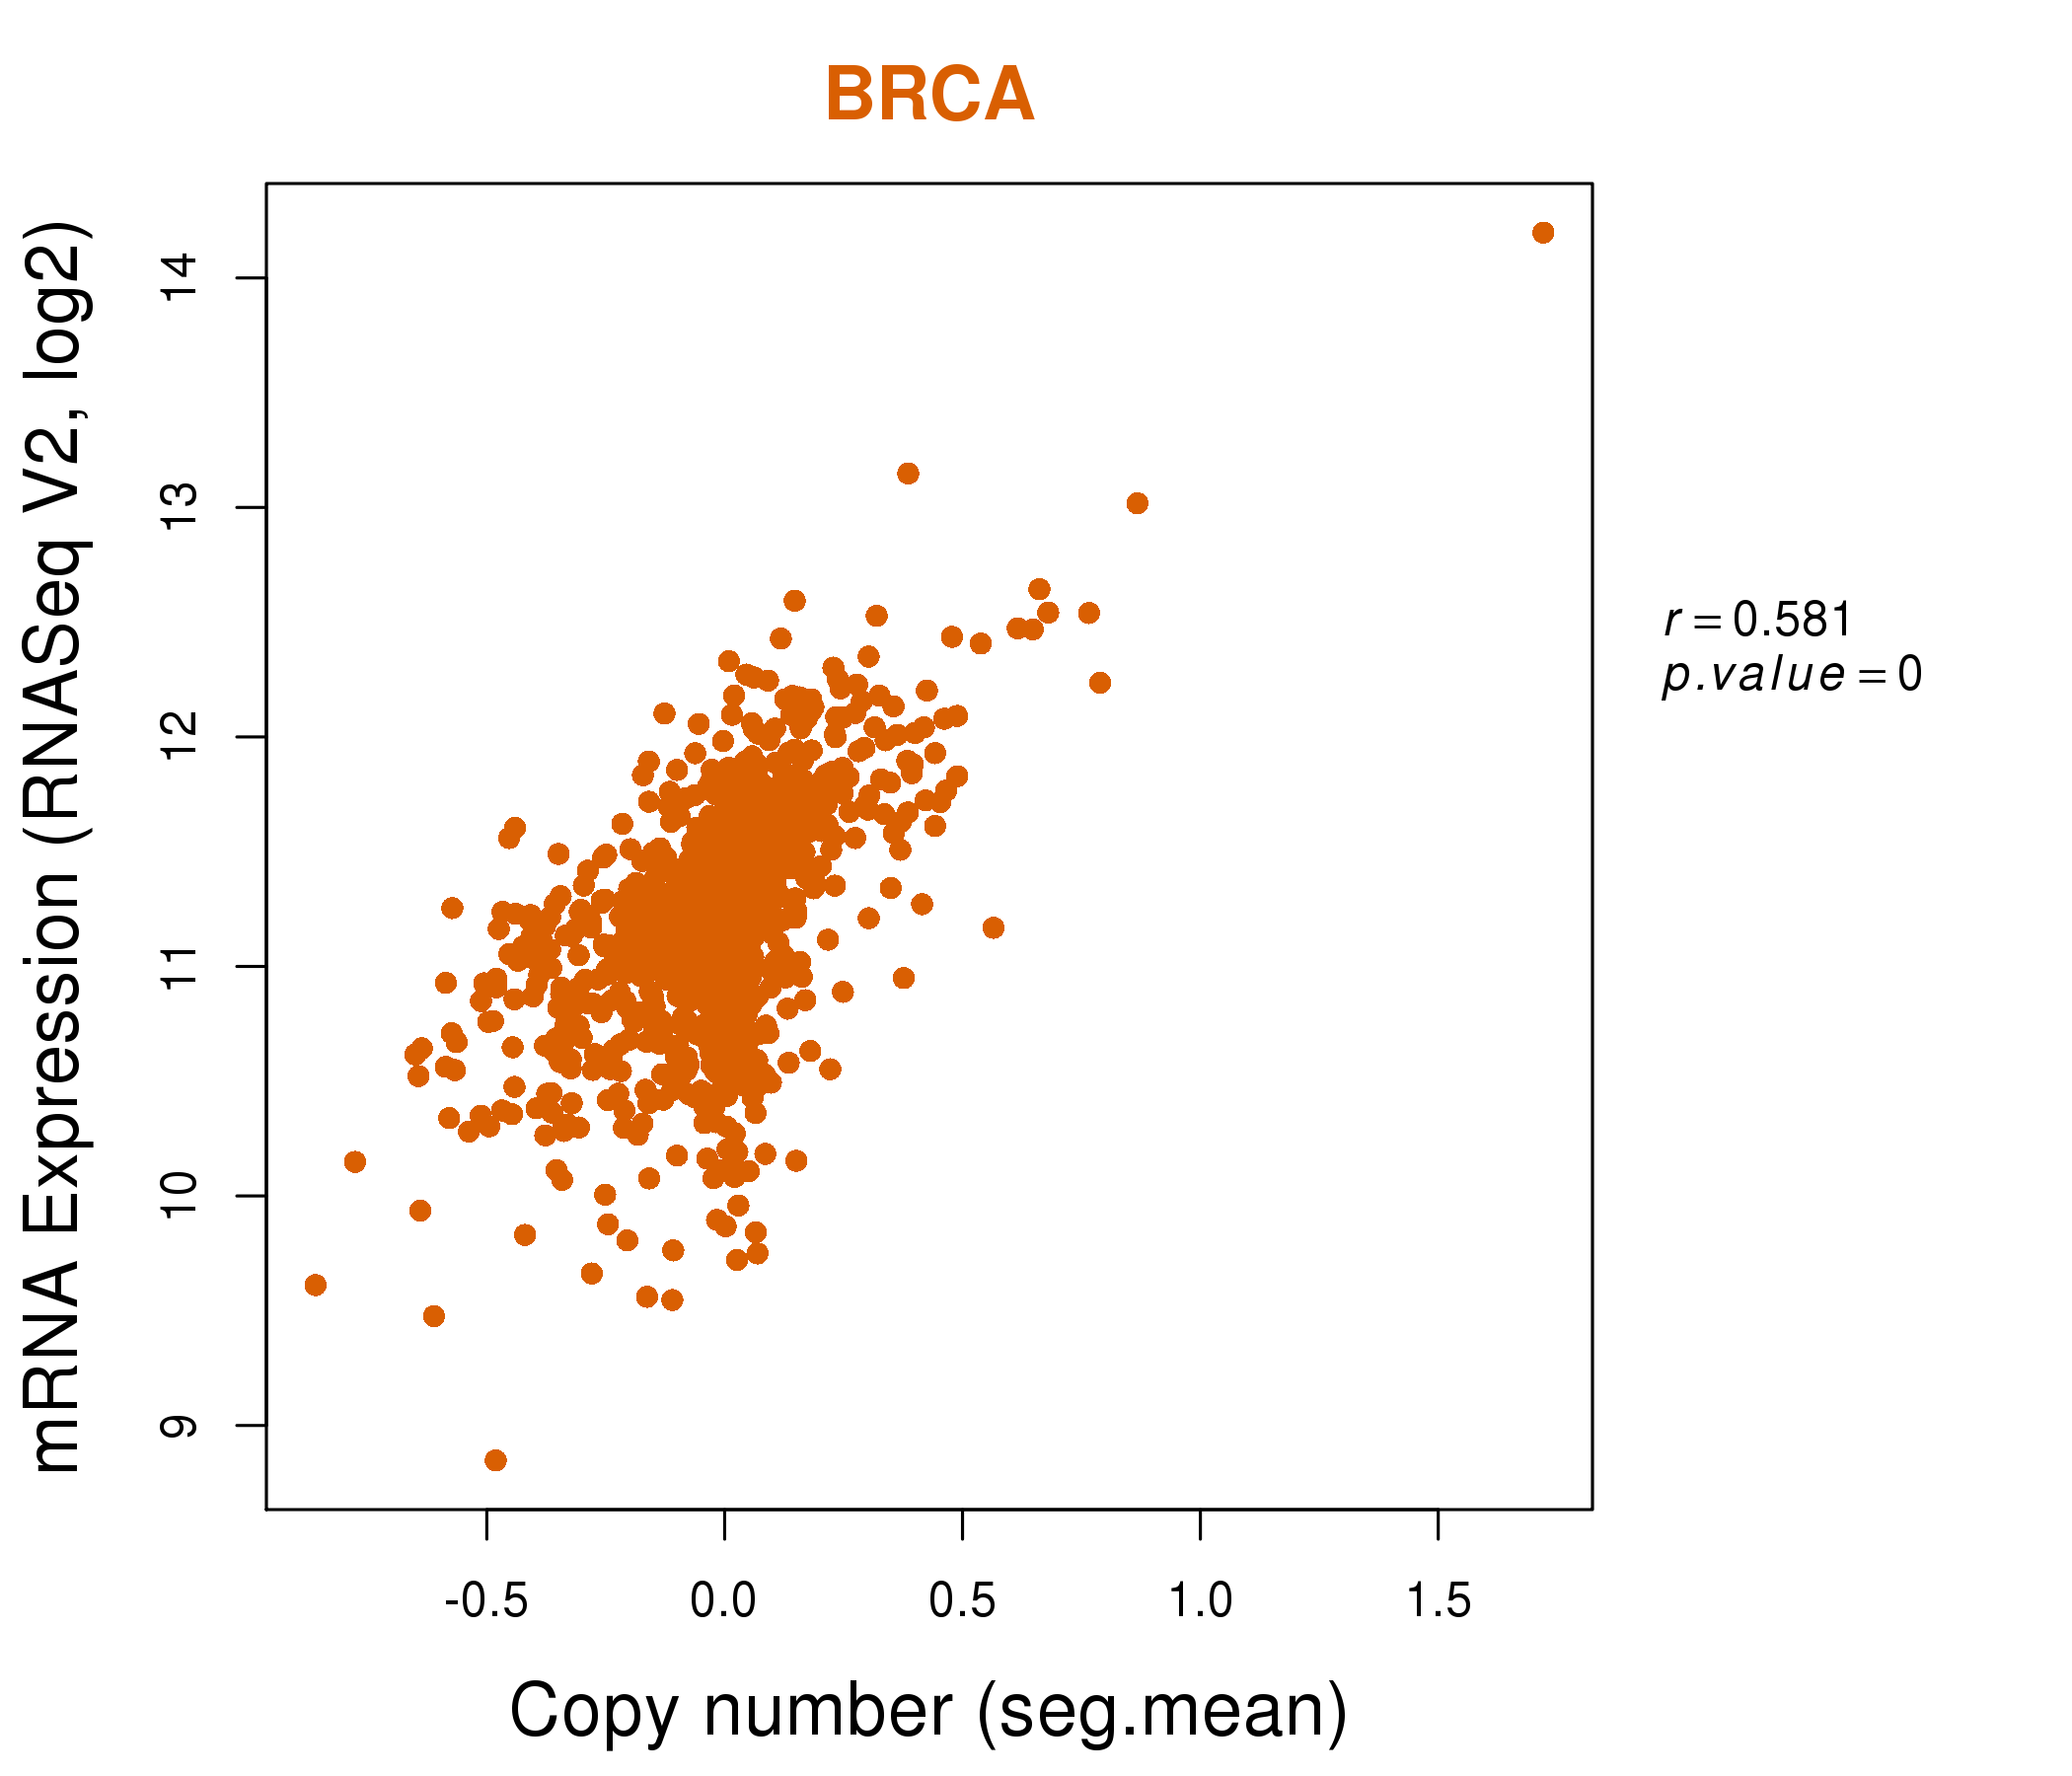
| * Normalized gene expression data of RNASeqV2 was extracted from TCGA using R package TCGA-Assembler. The URLs of all public data files on TCGA DCC data server were gathered at Jan-05-2015. Only eight cancer types have enough normal control samples for differential expression analysis. (t test, adjusted p<0.05 (using Benjamini-Hochberg FDR)) |
 |
| Top |
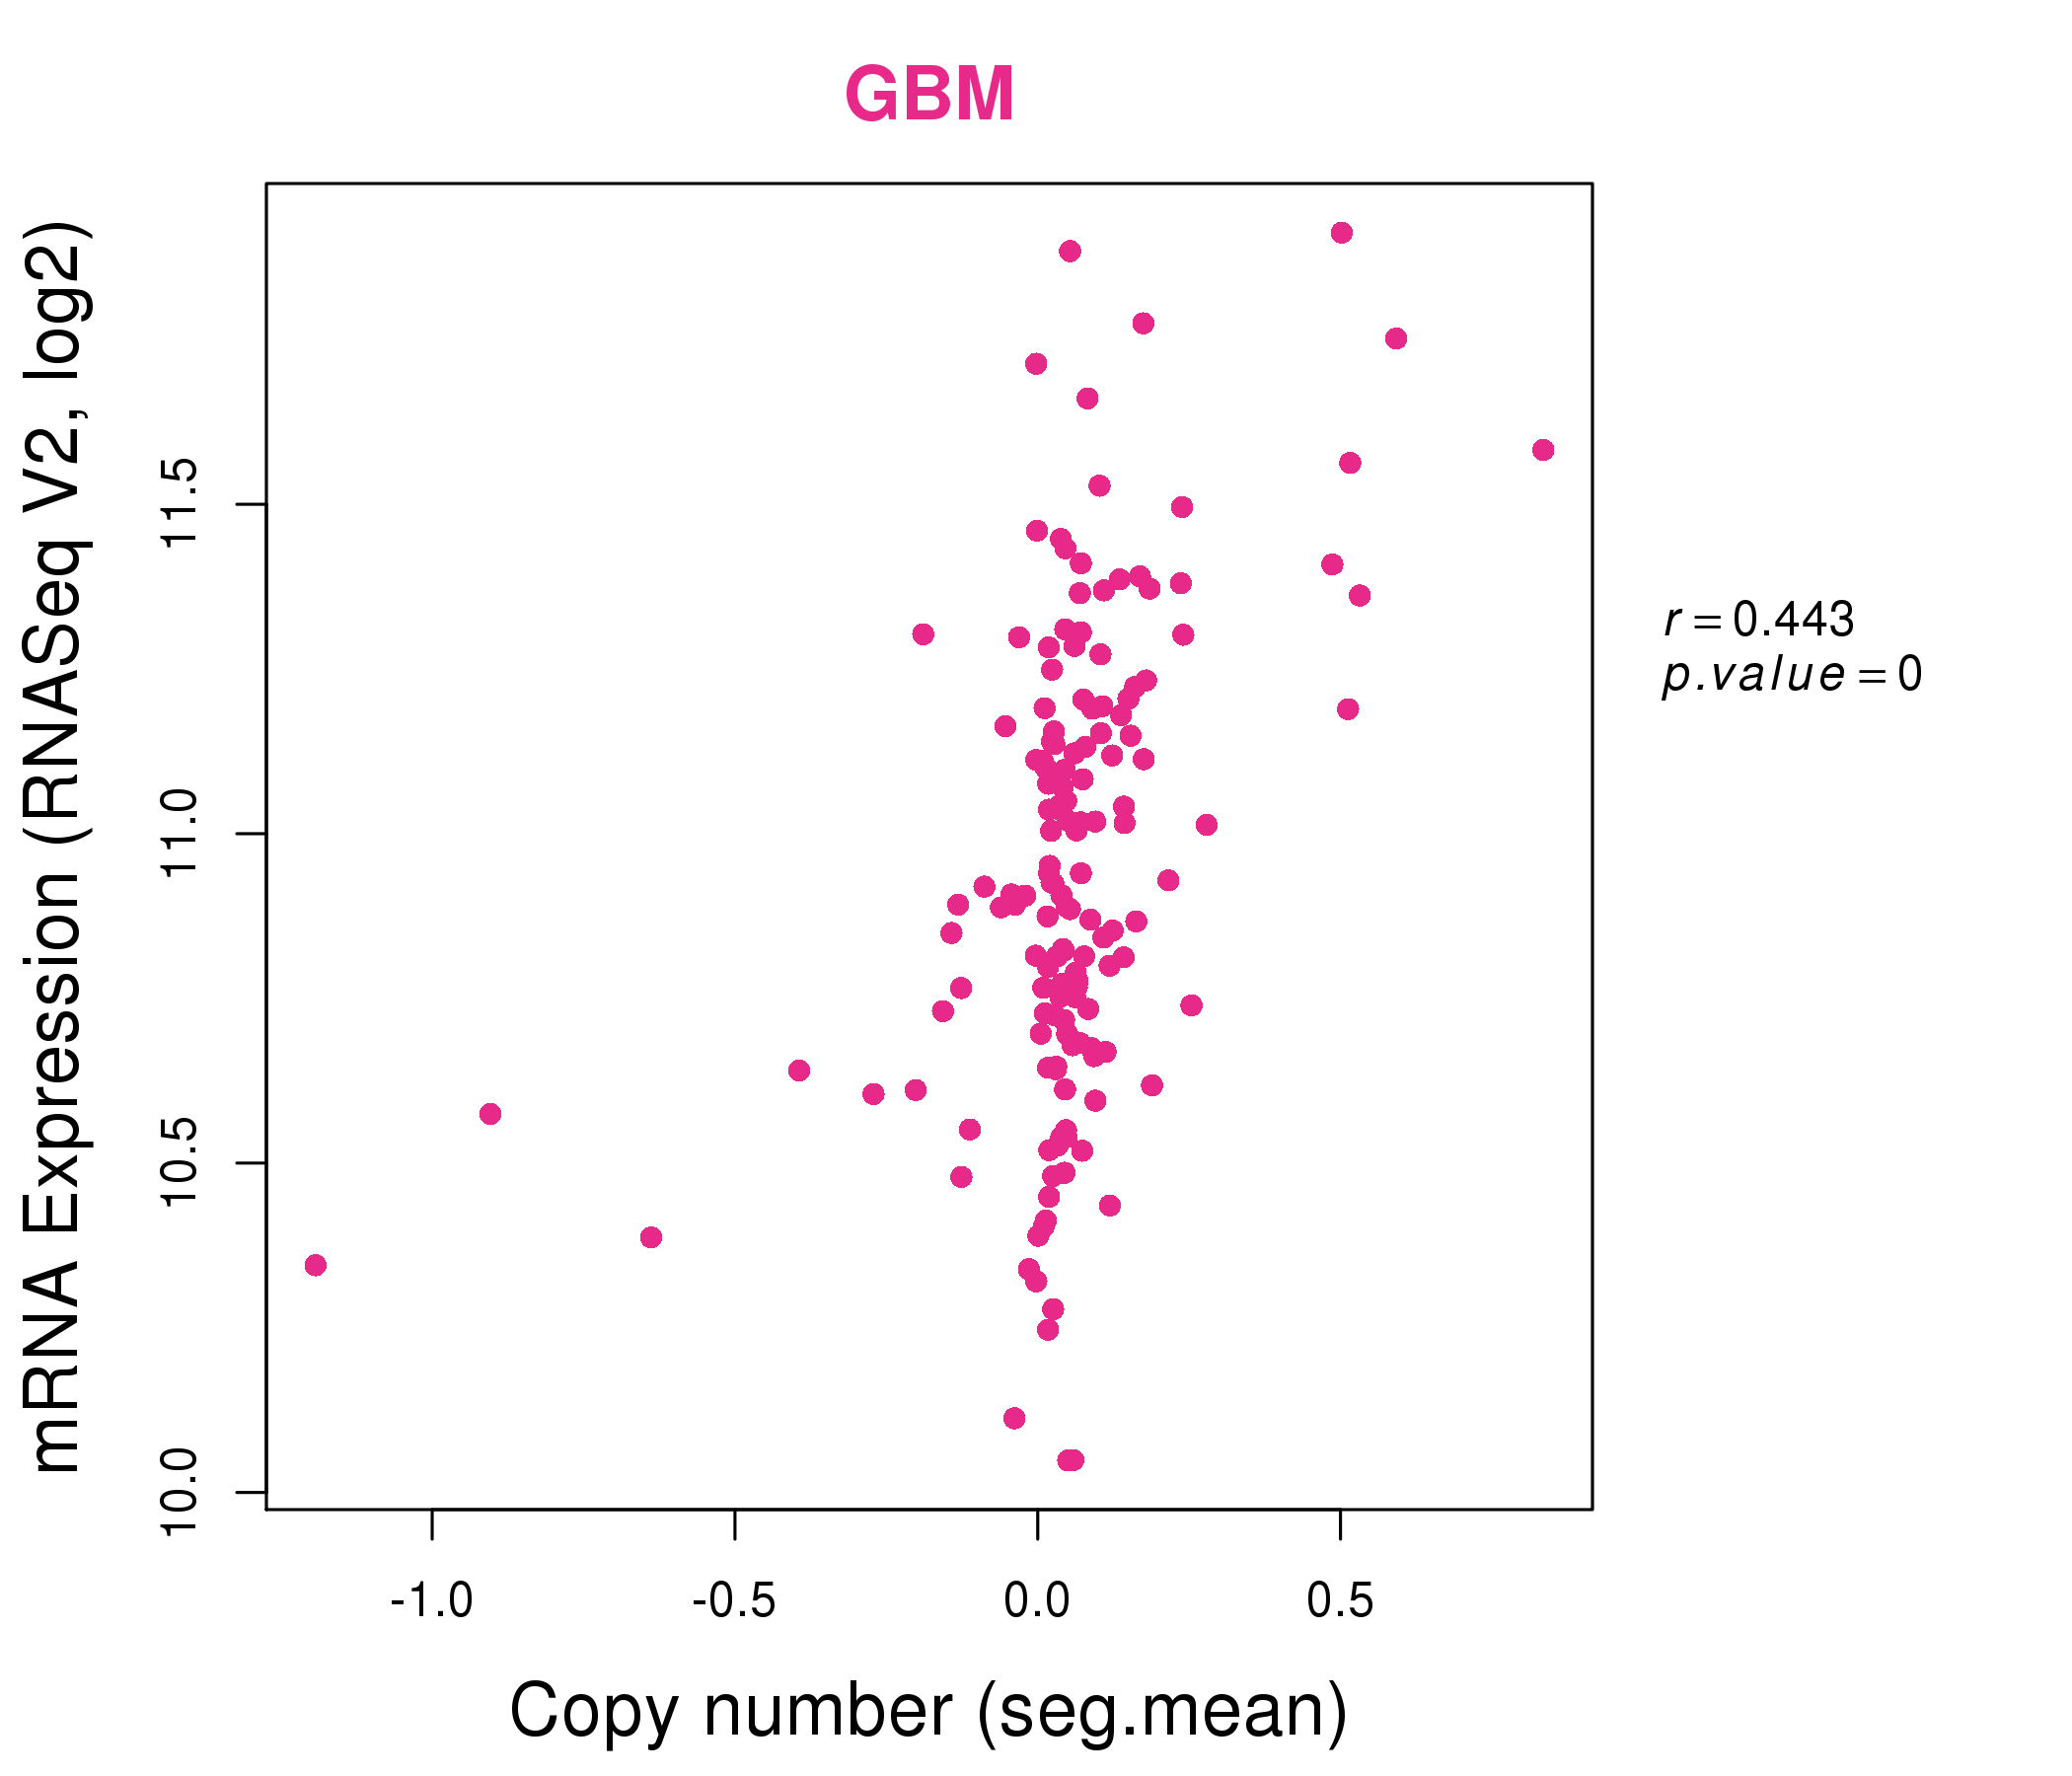
| * This plots show the correlation between CNV and gene expression. |
: Open all plots for all cancer types
 |
|
 |
|
| Top |
| Gene-Gene Network Information |
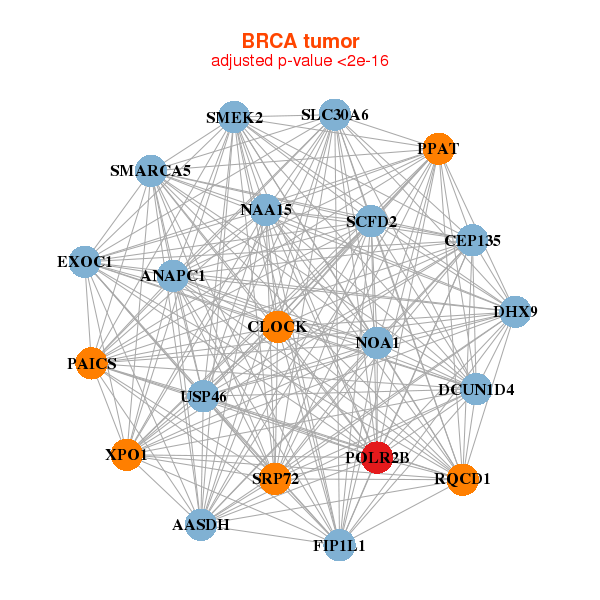
| * Co-Expression network figures were drawn using R package igraph. Only the top 20 genes with the highest correlations were shown. Red circle: input gene, orange circle: cell metabolism gene, sky circle: other gene |
: Open all plots for all cancer types
 |
|
| AASDH,ANAPC1,NOA1,CEP135,CLOCK,DCUN1D4,DHX9, EXOC1,FIP1L1,NAA15,PAICS,POLR2B,PPAT,RQCD1, SCFD2,SLC30A6,SMARCA5,SMEK2,SRP72,USP46,XPO1 | ANKRD28,CUL3,EPRS,IARS,IBTK,MED14,MIOS, NAA35,PARG,PCM1,POLR2B,PPP2R5E,RANBP6,RQCD1, TNKS2,TPP2,UBE3A,USP46,USP7,YME1L1,ZNF41 |
 |
|
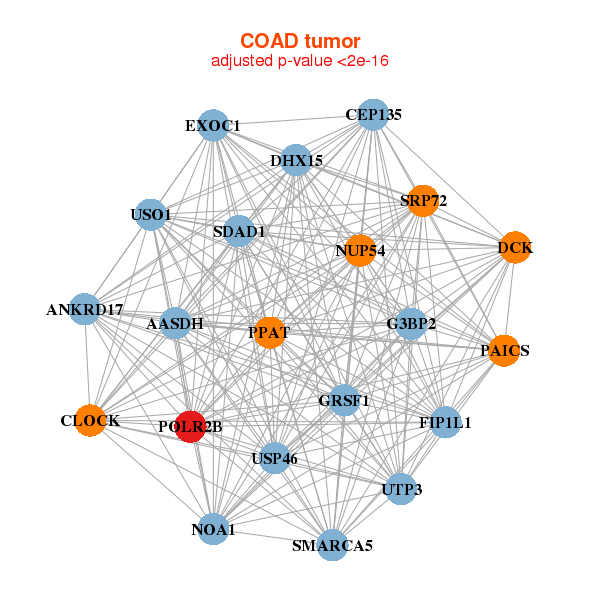
| AASDH,ANKRD17,NOA1,CEP135,CLOCK,DCK,DHX15, EXOC1,FIP1L1,G3BP2,GRSF1,NUP54,PAICS,POLR2B, PPAT,SDAD1,SMARCA5,SRP72,USO1,USP46,UTP3 | CDC5L,DHX36,ENOX2,FIGNL1,HAUS6,IARS,KIAA0586, MSH6,NUDT21,NUP107,NUP155,NUP160,NUP205,PARP2, POLA1,POLR2B,SDAD1,SKIV2L2,TOMM70A,XPO1,ZW10 |
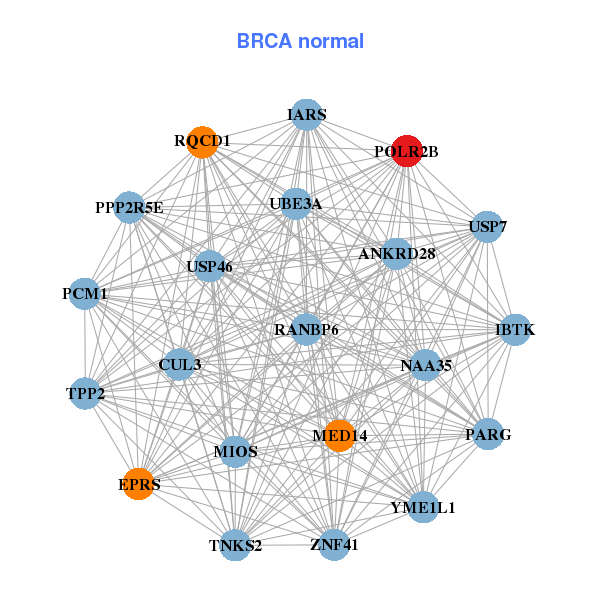
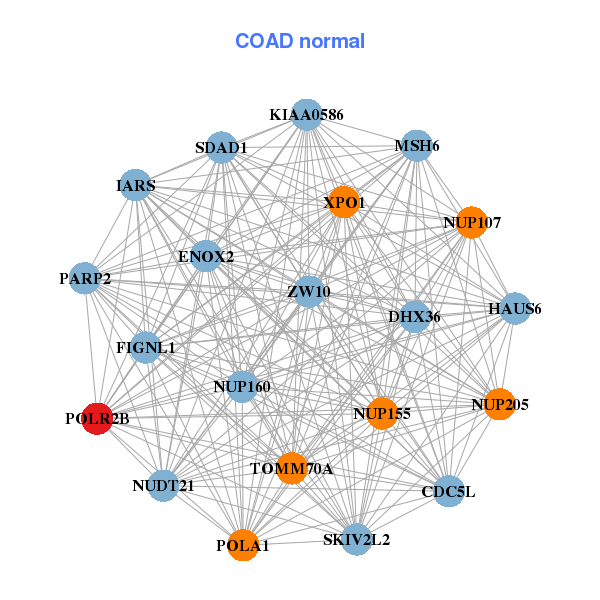
| * Co-Expression network figures were drawn using R package igraph. Only the top 20 genes with the highest correlations were shown. Red circle: input gene, orange circle: cell metabolism gene, sky circle: other gene |
: Open all plots for all cancer types
| Top |
: Open all interacting genes' information including KEGG pathway for all interacting genes from DAVID
| Top |
| Pharmacological Information for POLR2B |
| There's no related Drug. |
| Top |
| Cross referenced IDs for POLR2B |
| * We obtained these cross-references from Uniprot database. It covers 150 different DBs, 18 categories. http://www.uniprot.org/help/cross_references_section |
: Open all cross reference information
|
Copyright © 2016-Present - The Univsersity of Texas Health Science Center at Houston @ |