|
||||||||||||||||||||||||||||||||||||||||||||||||||||||||||||||||||||||||||||||||||||||||||||||||||||||||||||||||||||||||||||||||||||||||||||||||||||||||||||||||||||||||||||||||||||||||||||||||||||||||||||||||||||||||||||||||||||||||||||||||||||||||||||||||||||||||||||||||||||||||||||||||||||||||||||||||||||||||||
| |
| Phenotypic Information (metabolism pathway, cancer, disease, phenome) |
| |
| |
| Gene-Gene Network Information: Co-Expression Network, Interacting Genes & KEGG |
| |
|


| Gene Summary for POLR2H |
| Top |
| Phenotypic Information for POLR2H(metabolism pathway, cancer, disease, phenome) |
| Cancer | CGAP: POLR2H |
| Familial Cancer Database: POLR2H | |
| * This gene is included in those cancer gene databases. |
|
|
|
|
|
| . | ||||||||||||||||||||||||||||||||||||||||||||||||||||||||||||||||||||||||||||||||||||||||||||||||||||||||||||||||||||||||||||||||||||||||||||||||||||||||||||||||||||||||||||||||||||||||||||||||||||||||||||||||||||||||||||||||||||||||||||||||||||||||||||||||||||||||||||||||||||||||||||||||||||||||||||||||||||
Oncogene 1 | Significant driver gene in | |||||||||||||||||||||||||||||||||||||||||||||||||||||||||||||||||||||||||||||||||||||||||||||||||||||||||||||||||||||||||||||||||||||||||||||||||||||||||||||||||||||||||||||||||||||||||||||||||||||||||||||||||||||||||||||||||||||||||||||||||||||||||||||||||||||||||||||||||||||||||||||||||||||||||||||||||||||||||
| cf) number; DB name 1 Oncogene; http://nar.oxfordjournals.org/content/35/suppl_1/D721.long, 2 Tumor Suppressor gene; https://bioinfo.uth.edu/TSGene/, 3 Cancer Gene Census; http://www.nature.com/nrc/journal/v4/n3/abs/nrc1299.html, 4 CancerGenes; http://nar.oxfordjournals.org/content/35/suppl_1/D721.long, 5 Network of Cancer Gene; http://ncg.kcl.ac.uk/index.php, 1Therapeutic Vulnerabilities in Cancer; http://cbio.mskcc.org/cancergenomics/statius/ |
| KEGG_PURINE_METABOLISM KEGG_PYRIMIDINE_METABOLISM | |
| OMIM | 606023; gene. |
| Orphanet | |
| Disease | KEGG Disease: POLR2H |
| MedGen: POLR2H (Human Medical Genetics with Condition) | |
| ClinVar: POLR2H | |
| Phenotype | MGI: POLR2H (International Mouse Phenotyping Consortium) |
| PhenomicDB: POLR2H | |
| Mutations for POLR2H |
| * Under tables are showing count per each tissue to give us broad intuition about tissue specific mutation patterns.You can go to the detailed page for each mutation database's web site. |
| There's no structural variation information in COSMIC data for this gene. |
| * From mRNA Sanger sequences, Chitars2.0 arranged chimeric transcripts. This table shows POLR2H related fusion information. |
| ID | Head Gene | Tail Gene | Accession | Gene_a | qStart_a | qEnd_a | Chromosome_a | tStart_a | tEnd_a | Gene_a | qStart_a | qEnd_a | Chromosome_a | tStart_a | tEnd_a |
| BF001934 | POLR2H | 5 | 349 | 3 | 184086046 | 184086367 | DTX3L | 342 | 522 | 3 | 122291997 | 122292177 | |
| AI680578 | POLR2H | 21 | 85 | 3 | 184086267 | 184086331 | SRRT | 82 | 351 | 7 | 100485876 | 100486235 | |
| Top |
| Mutation type/ Tissue ID | brca | cns | cerv | endome | haematopo | kidn | Lintest | liver | lung | ns | ovary | pancre | prost | skin | stoma | thyro | urina | |||
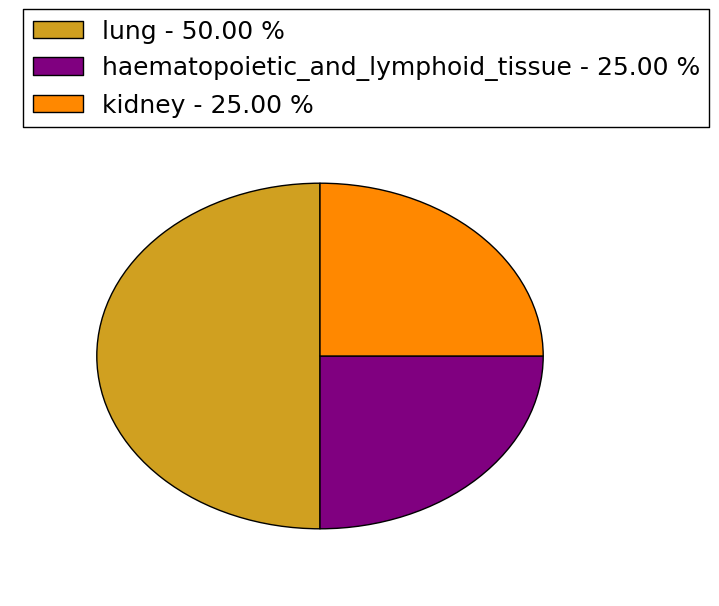
| Total # sample | 1 | |||||||||||||||||||
| GAIN (# sample) | 1 | |||||||||||||||||||
| LOSS (# sample) |
| cf) Tissue ID; Tissue type (1; Breast, 2; Central_nervous_system, 3; Cervix, 4; Endometrium, 5; Haematopoietic_and_lymphoid_tissue, 6; Kidney, 7; Large_intestine, 8; Liver, 9; Lung, 10; NS, 11; Ovary, 12; Pancreas, 13; Prostate, 14; Skin, 15; Stomach, 16; Thyroid, 17; Urinary_tract) |
| Top |
|
 |
| Top |
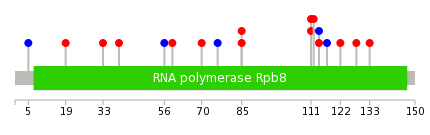
| Stat. for Non-Synonymous SNVs (# total SNVs=10) | (# total SNVs=4) |
 |  |
(# total SNVs=0) | (# total SNVs=0) |
| Top |
| * When you move the cursor on each content, you can see more deailed mutation information on the Tooltip. Those are primary_site,primary_histology,mutation(aa),pubmedID. |
| GRCh37 position | Mutation(aa) | Unique sampleID count |
| chr3:184086011-184086011 | p.D128N | 1 |
| chr3:184084506-184084506 | p.A85S | 1 |
| chr3:184086028-184086028 | p.H133Q | 1 |
| chr3:184081293-184081293 | p.L5L | 1 |
| chr3:184084507-184084507 | p.A85G | 1 |
| chr3:184081335-184081335 | p.G19S | 1 |
| chr3:184084584-184084584 | p.R111C | 1 |
| chr3:184081350-184081350 | p.R24* | 1 |
| chr3:184084585-184084585 | p.R111H | 1 |
| chr3:184082777-184082777 | p.E33K | 1 |
| Top |
|
 |
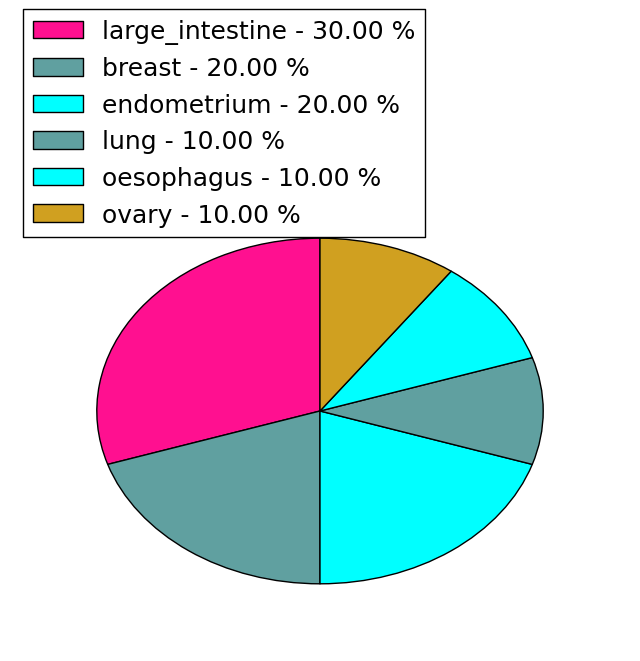
| Point Mutation/ Tissue ID | 1 | 2 | 3 | 4 | 5 | 6 | 7 | 8 | 9 | 10 | 11 | 12 | 13 | 14 | 15 | 16 | 17 | 18 | 19 | 20 |
| # sample | 1 | 2 | 1 | 5 | 1 | 1 | 2 | |||||||||||||
| # mutation | 1 | 2 | 1 | 5 | 1 | 1 | 2 | |||||||||||||
| nonsynonymous SNV | 1 | 2 | 3 | 1 | 1 | 2 | ||||||||||||||
| synonymous SNV | 1 | 2 |
| cf) Tissue ID; Tissue type (1; BLCA[Bladder Urothelial Carcinoma], 2; BRCA[Breast invasive carcinoma], 3; CESC[Cervical squamous cell carcinoma and endocervical adenocarcinoma], 4; COAD[Colon adenocarcinoma], 5; GBM[Glioblastoma multiforme], 6; Glioma Low Grade, 7; HNSC[Head and Neck squamous cell carcinoma], 8; KICH[Kidney Chromophobe], 9; KIRC[Kidney renal clear cell carcinoma], 10; KIRP[Kidney renal papillary cell carcinoma], 11; LAML[Acute Myeloid Leukemia], 12; LUAD[Lung adenocarcinoma], 13; LUSC[Lung squamous cell carcinoma], 14; OV[Ovarian serous cystadenocarcinoma ], 15; PAAD[Pancreatic adenocarcinoma], 16; PRAD[Prostate adenocarcinoma], 17; SKCM[Skin Cutaneous Melanoma], 18:STAD[Stomach adenocarcinoma], 19:THCA[Thyroid carcinoma], 20:UCEC[Uterine Corpus Endometrial Carcinoma]) |
| Top |
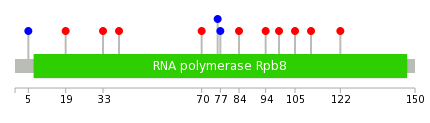
| * We represented just top 10 SNVs. When you move the cursor on each content, you can see more deailed mutation information on the Tooltip. Those are primary_site, primary_histology, mutation(aa), pubmedID. |
| Genomic Position | Mutation(aa) | Unique sampleID count |
| chr3:184086008 | p.L5L,POLR2H | 1 |
| chr3:184081293 | p.G19S,POLR2H | 1 |
| chr3:184086028 | p.E33K,POLR2H | 1 |
| chr3:184081335 | p.L39V,POLR2H | 1 |
| chr3:184086079 | p.L70V,POLR2H | 1 |
| chr3:184082777 | p.N76N,POLR2H | 1 |
| chr3:184082795 | p.P77P,POLR2H | 1 |
| chr3:184082971 | p.R84S,POLR2H | 1 |
| chr3:184082991 | p.R111H,POLR2H | 1 |
| chr3:184082994 | p.L94F,POLR2H | 1 |
| * Copy number data were extracted from TCGA using R package TCGA-Assembler. The URLs of all public data files on TCGA DCC data server were gathered on Jan-05-2015. Function ProcessCNAData in TCGA-Assembler package was used to obtain gene-level copy number value which is calculated as the average copy number of the genomic region of a gene. |
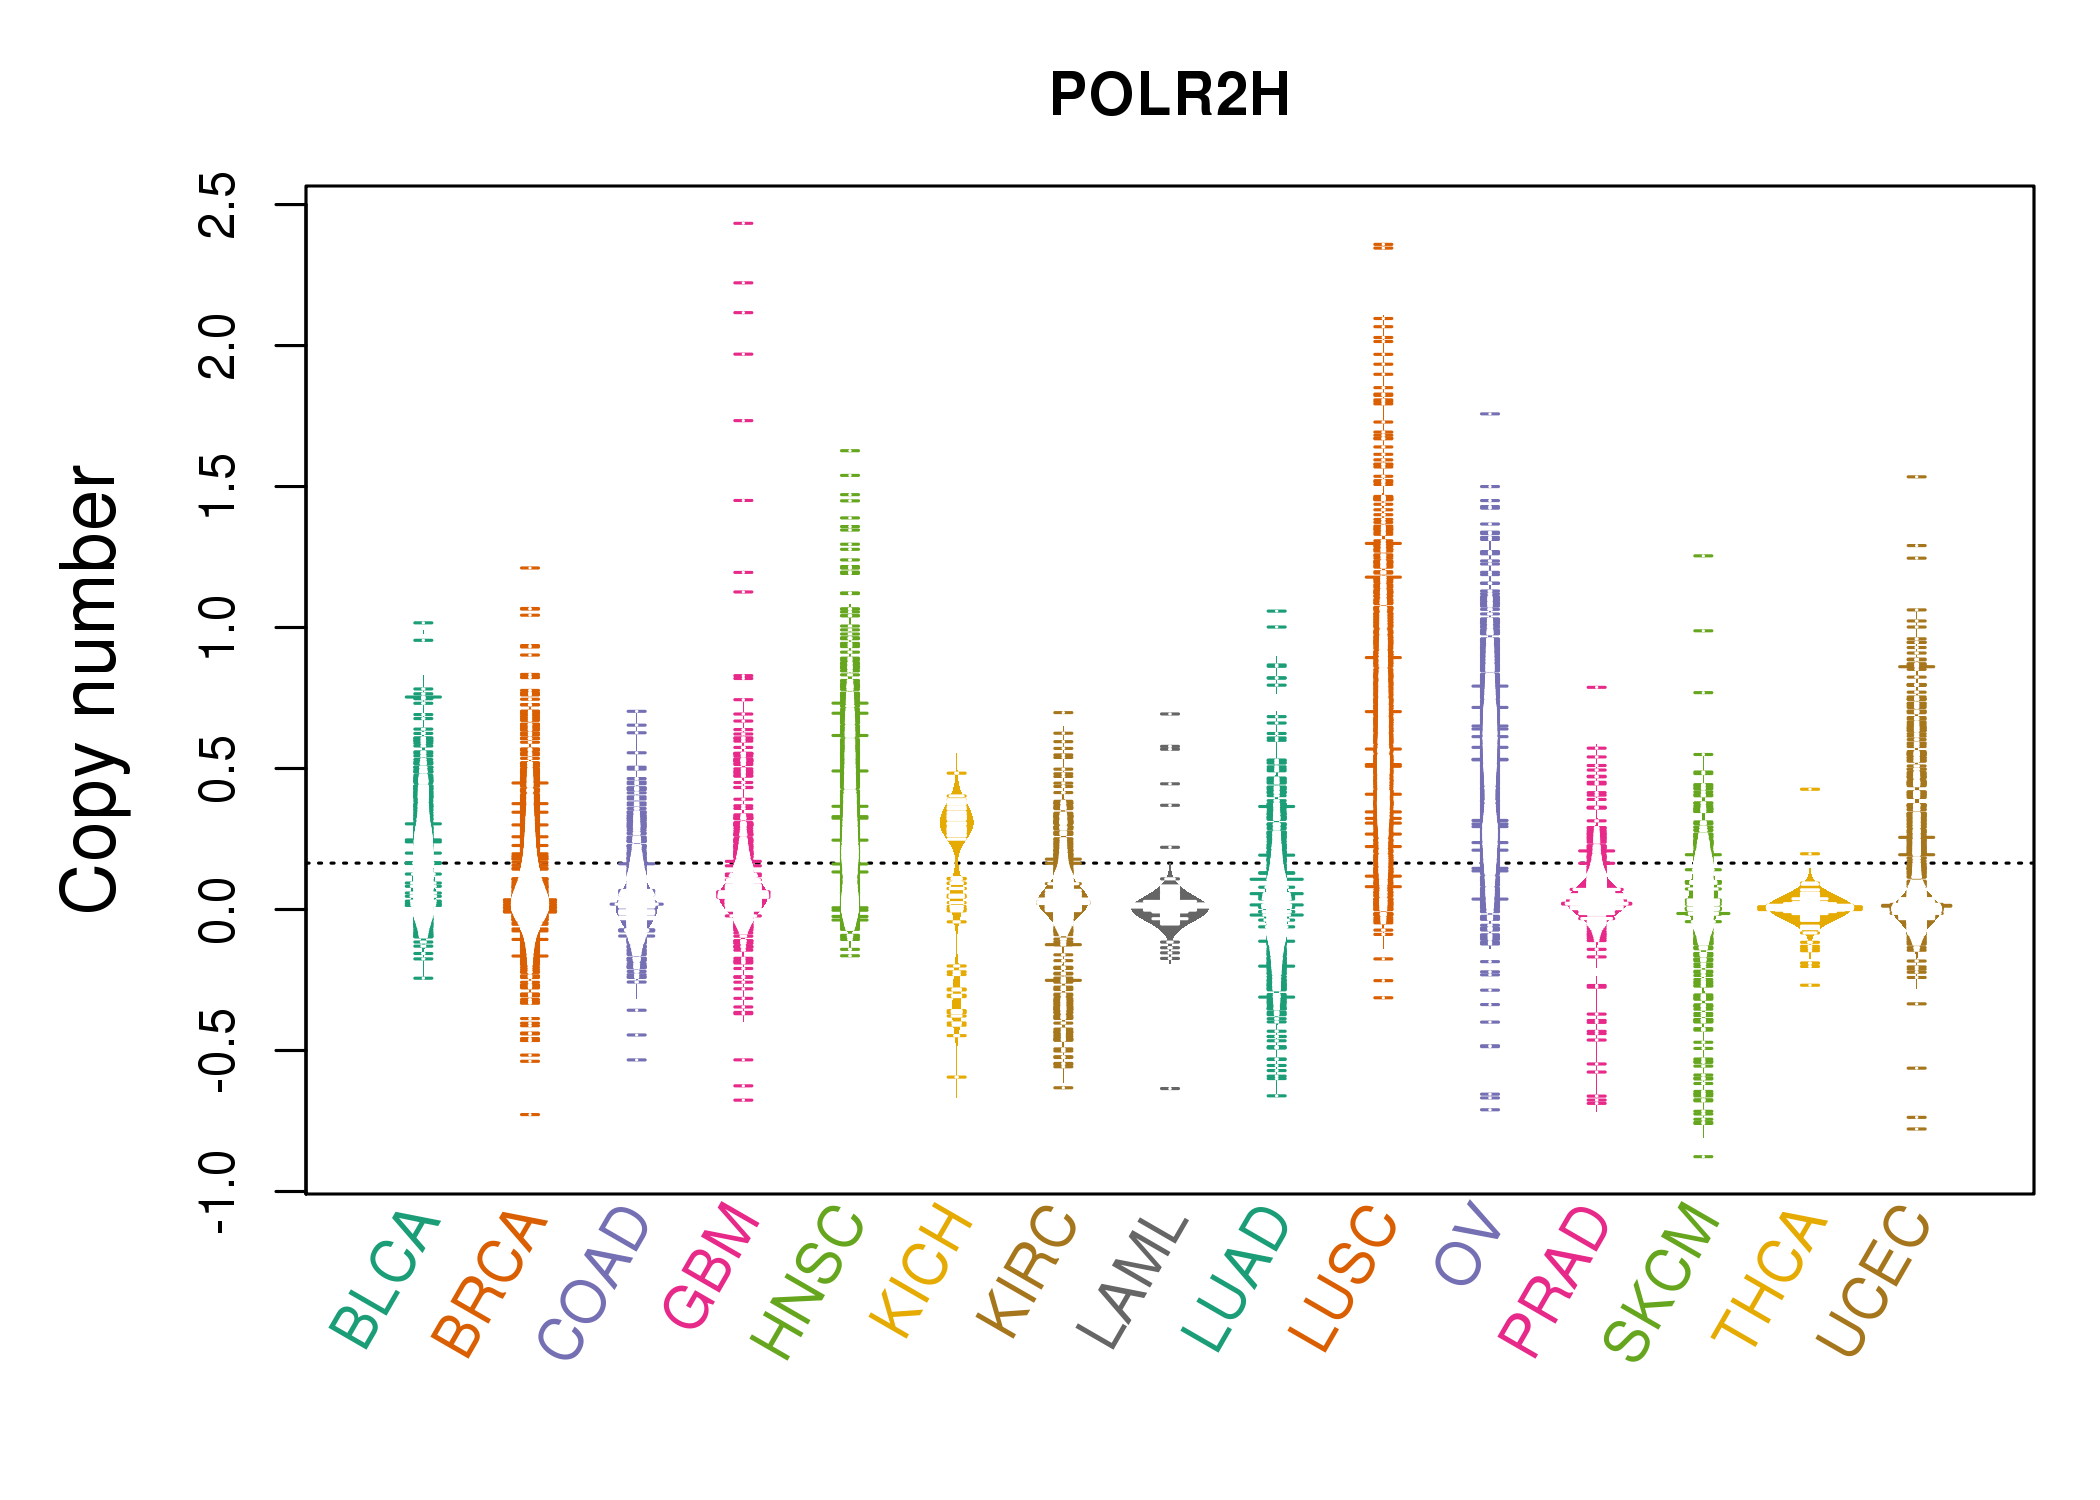 |
| cf) Tissue ID[Tissue type]: BLCA[Bladder Urothelial Carcinoma], BRCA[Breast invasive carcinoma], CESC[Cervical squamous cell carcinoma and endocervical adenocarcinoma], COAD[Colon adenocarcinoma], GBM[Glioblastoma multiforme], Glioma Low Grade, HNSC[Head and Neck squamous cell carcinoma], KICH[Kidney Chromophobe], KIRC[Kidney renal clear cell carcinoma], KIRP[Kidney renal papillary cell carcinoma], LAML[Acute Myeloid Leukemia], LUAD[Lung adenocarcinoma], LUSC[Lung squamous cell carcinoma], OV[Ovarian serous cystadenocarcinoma ], PAAD[Pancreatic adenocarcinoma], PRAD[Prostate adenocarcinoma], SKCM[Skin Cutaneous Melanoma], STAD[Stomach adenocarcinoma], THCA[Thyroid carcinoma], UCEC[Uterine Corpus Endometrial Carcinoma] |
| Top |
| Gene Expression for POLR2H |
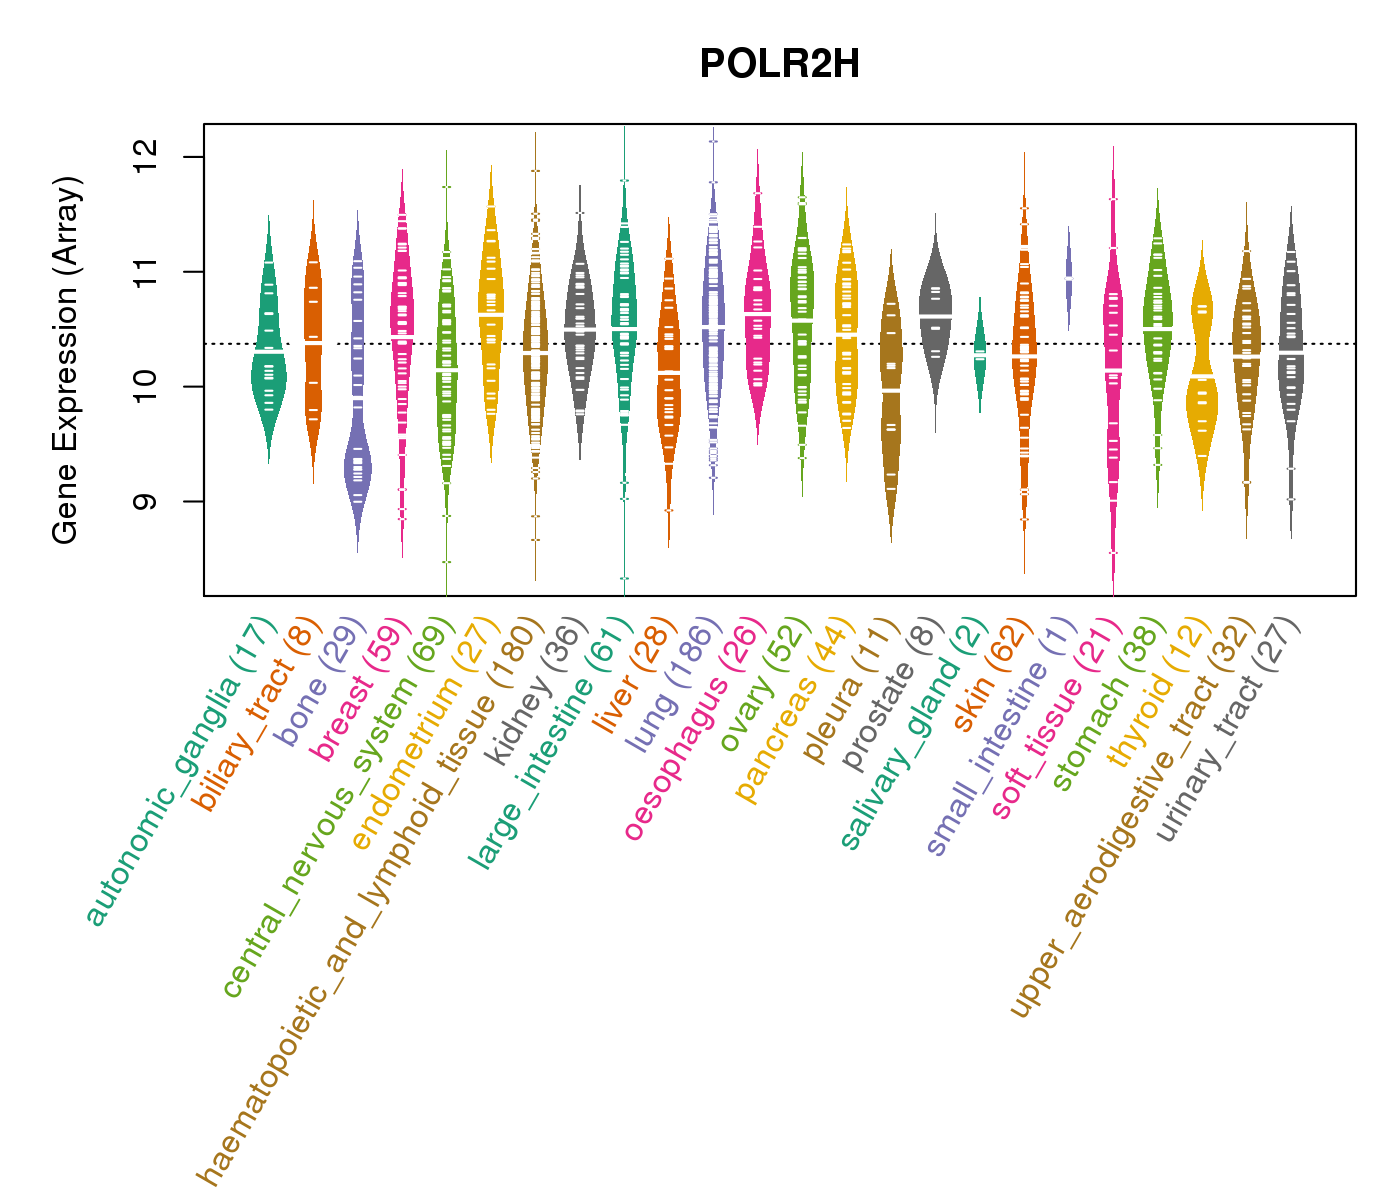
| * CCLE gene expression data were extracted from CCLE_Expression_Entrez_2012-10-18.res: Gene-centric RMA-normalized mRNA expression data. |
 |
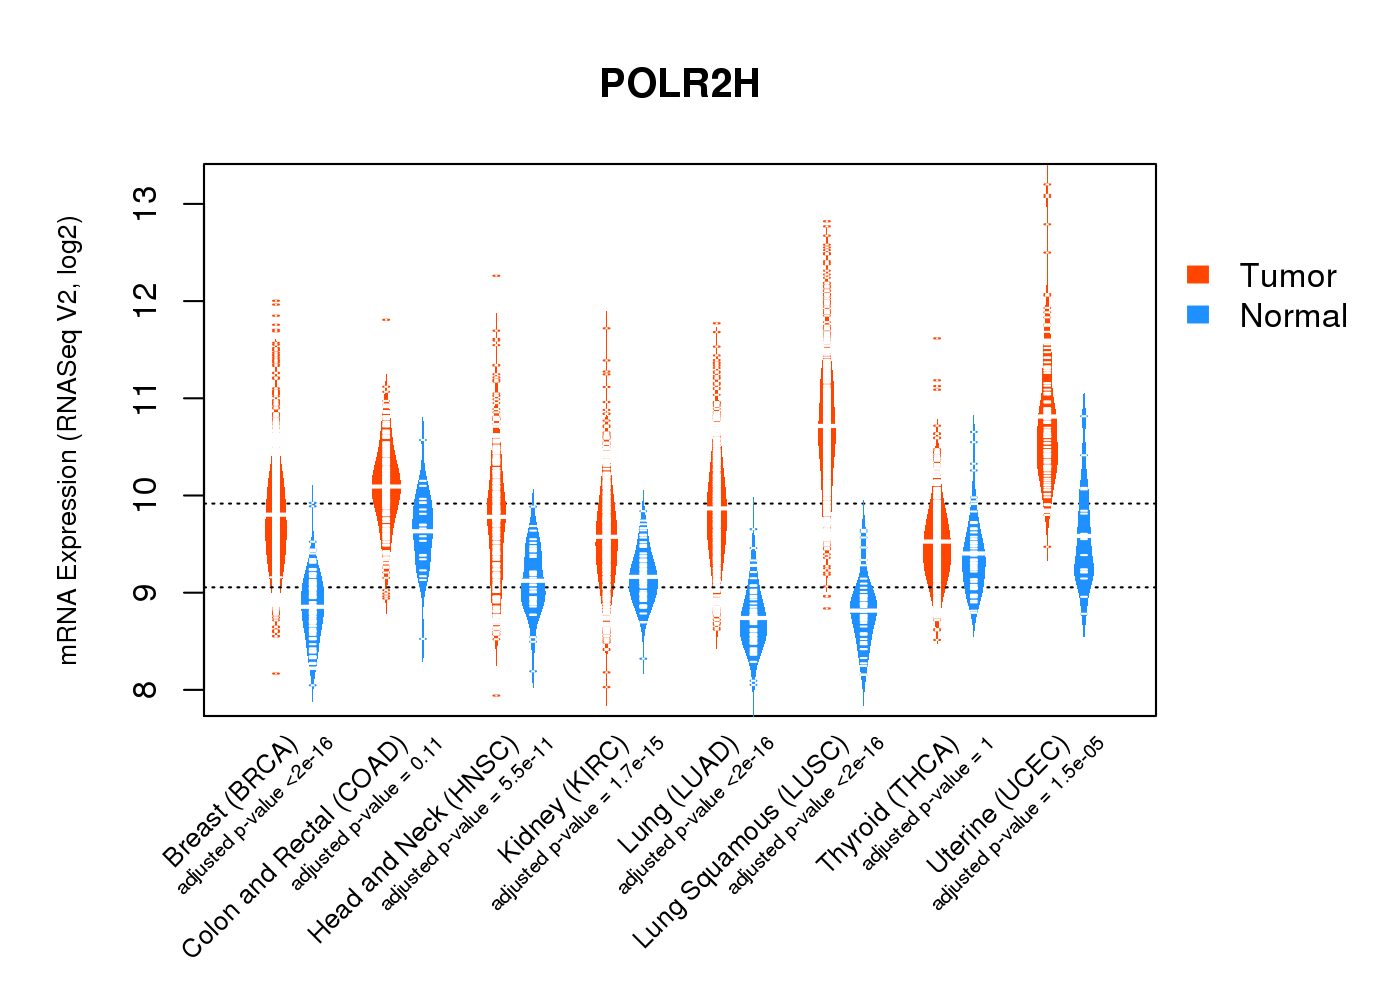
| * Normalized gene expression data of RNASeqV2 was extracted from TCGA using R package TCGA-Assembler. The URLs of all public data files on TCGA DCC data server were gathered at Jan-05-2015. Only eight cancer types have enough normal control samples for differential expression analysis. (t test, adjusted p<0.05 (using Benjamini-Hochberg FDR)) |
 |
| Top |
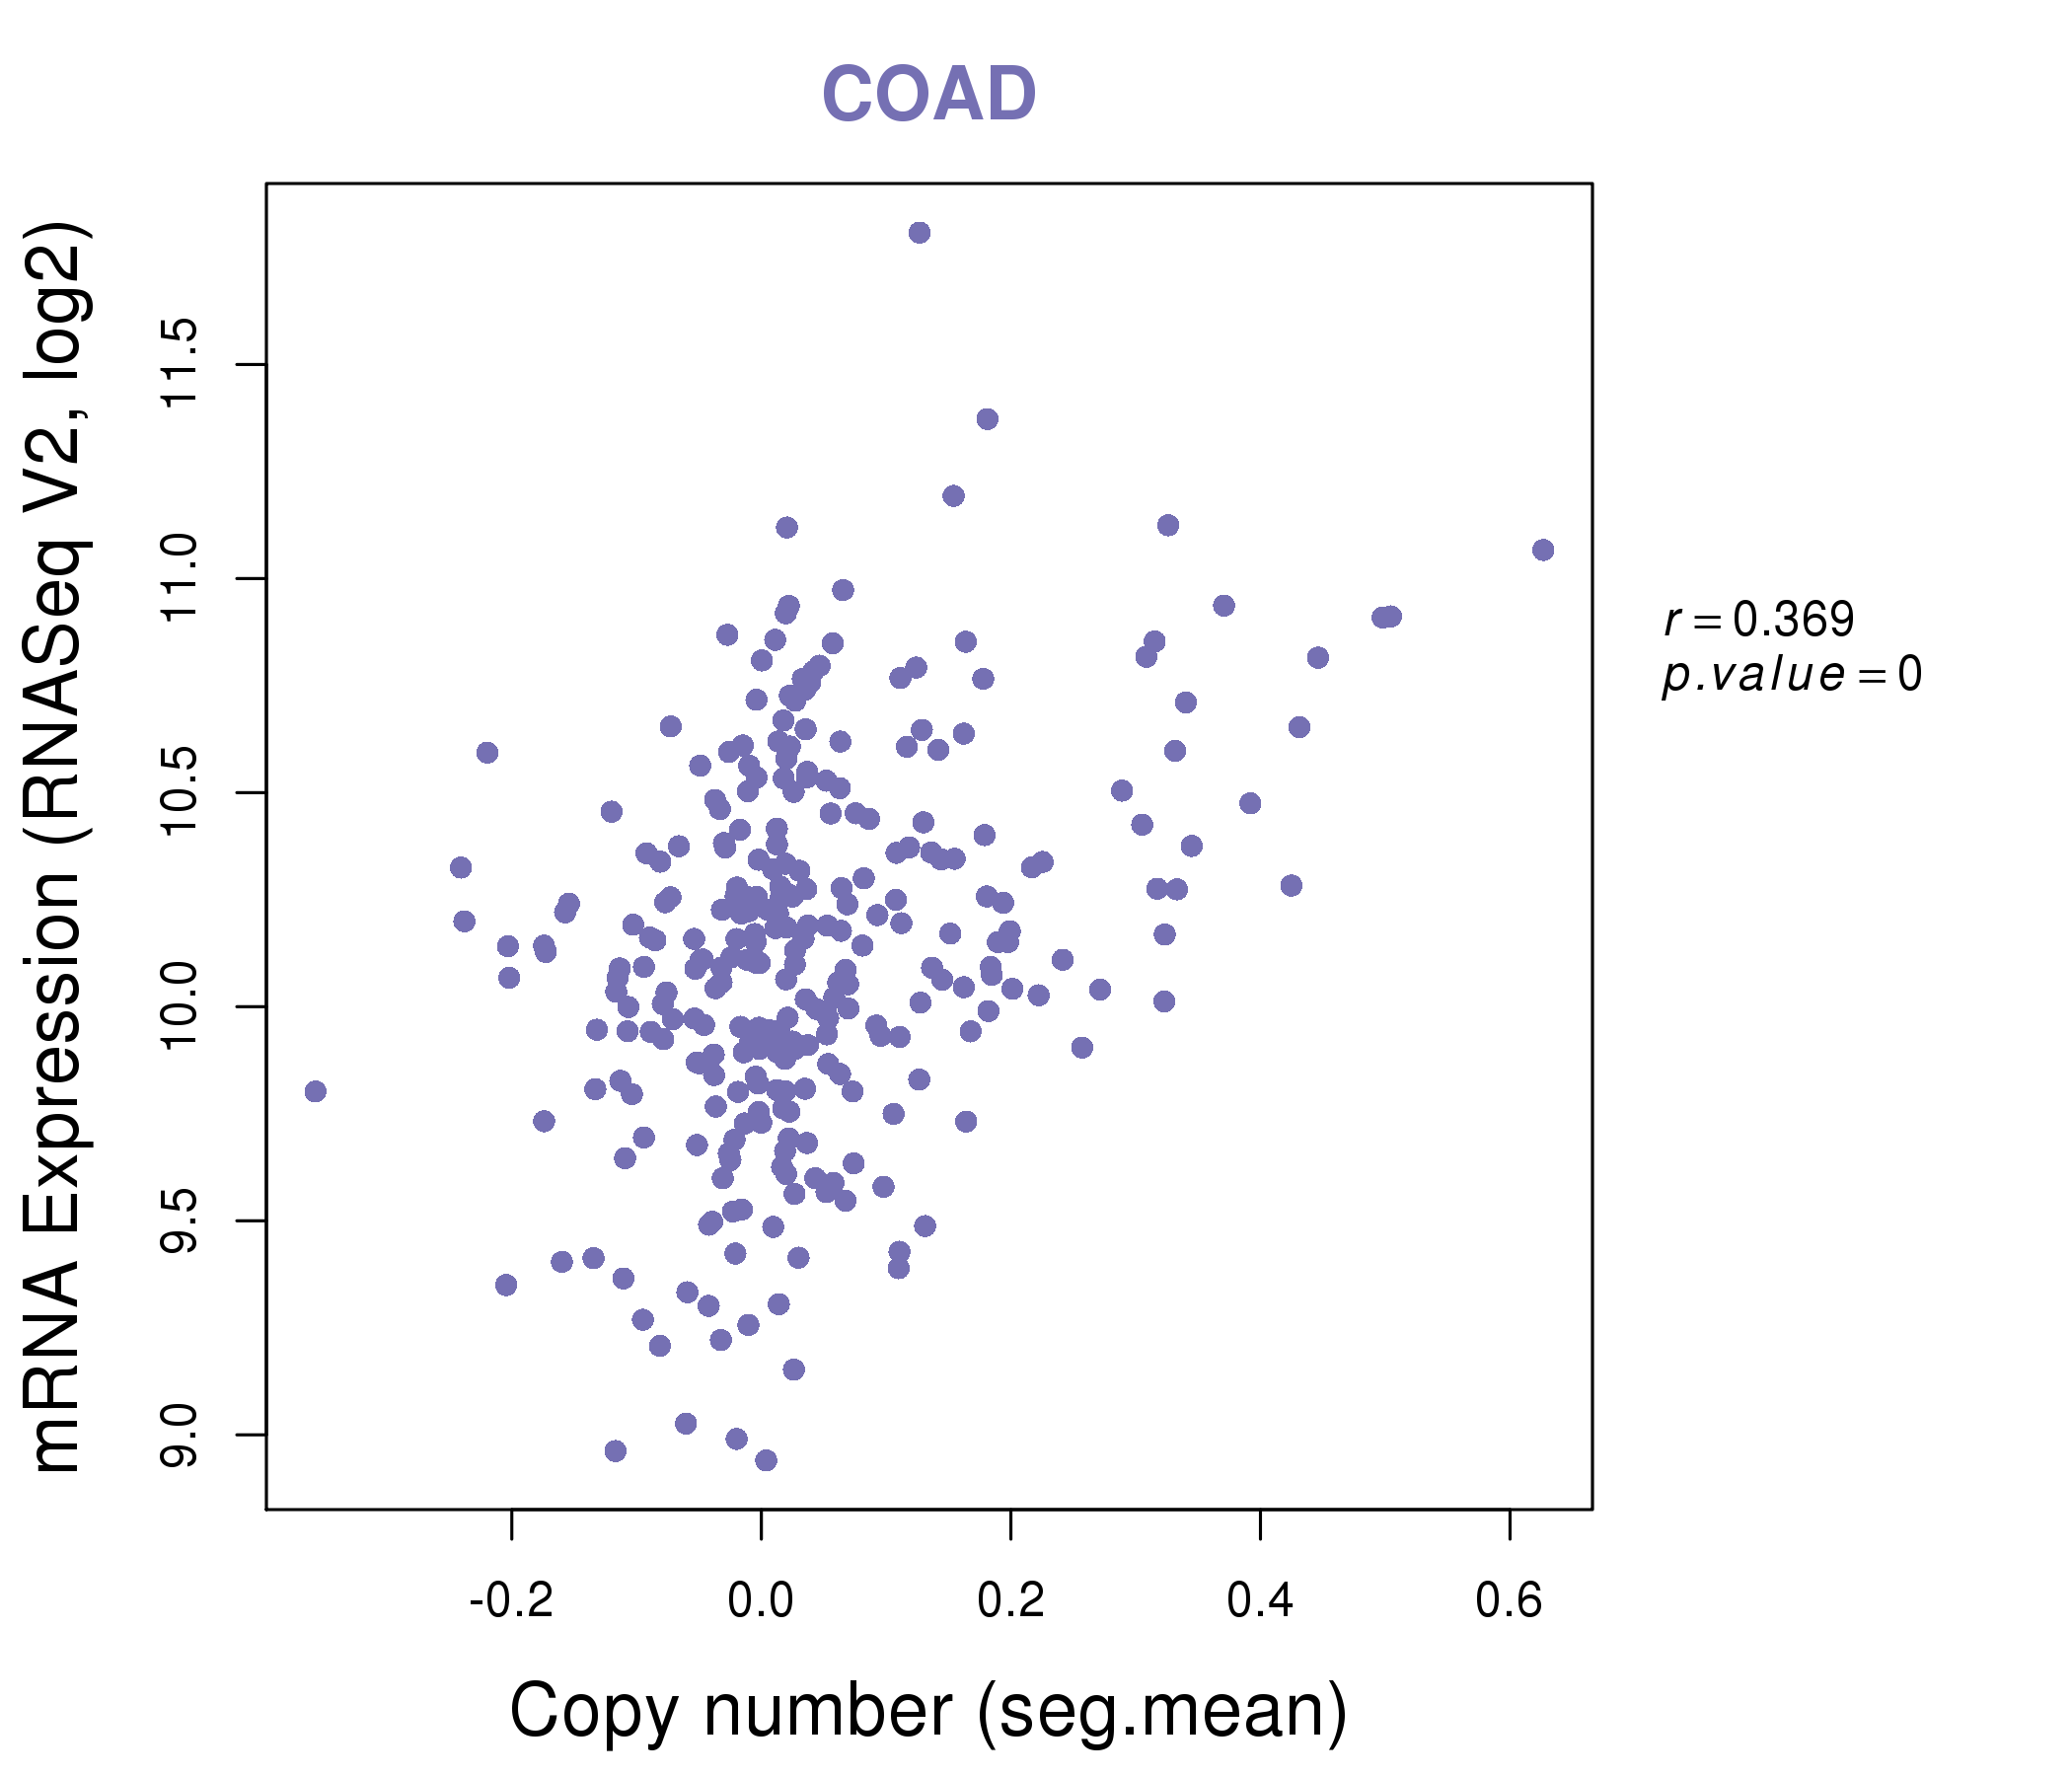
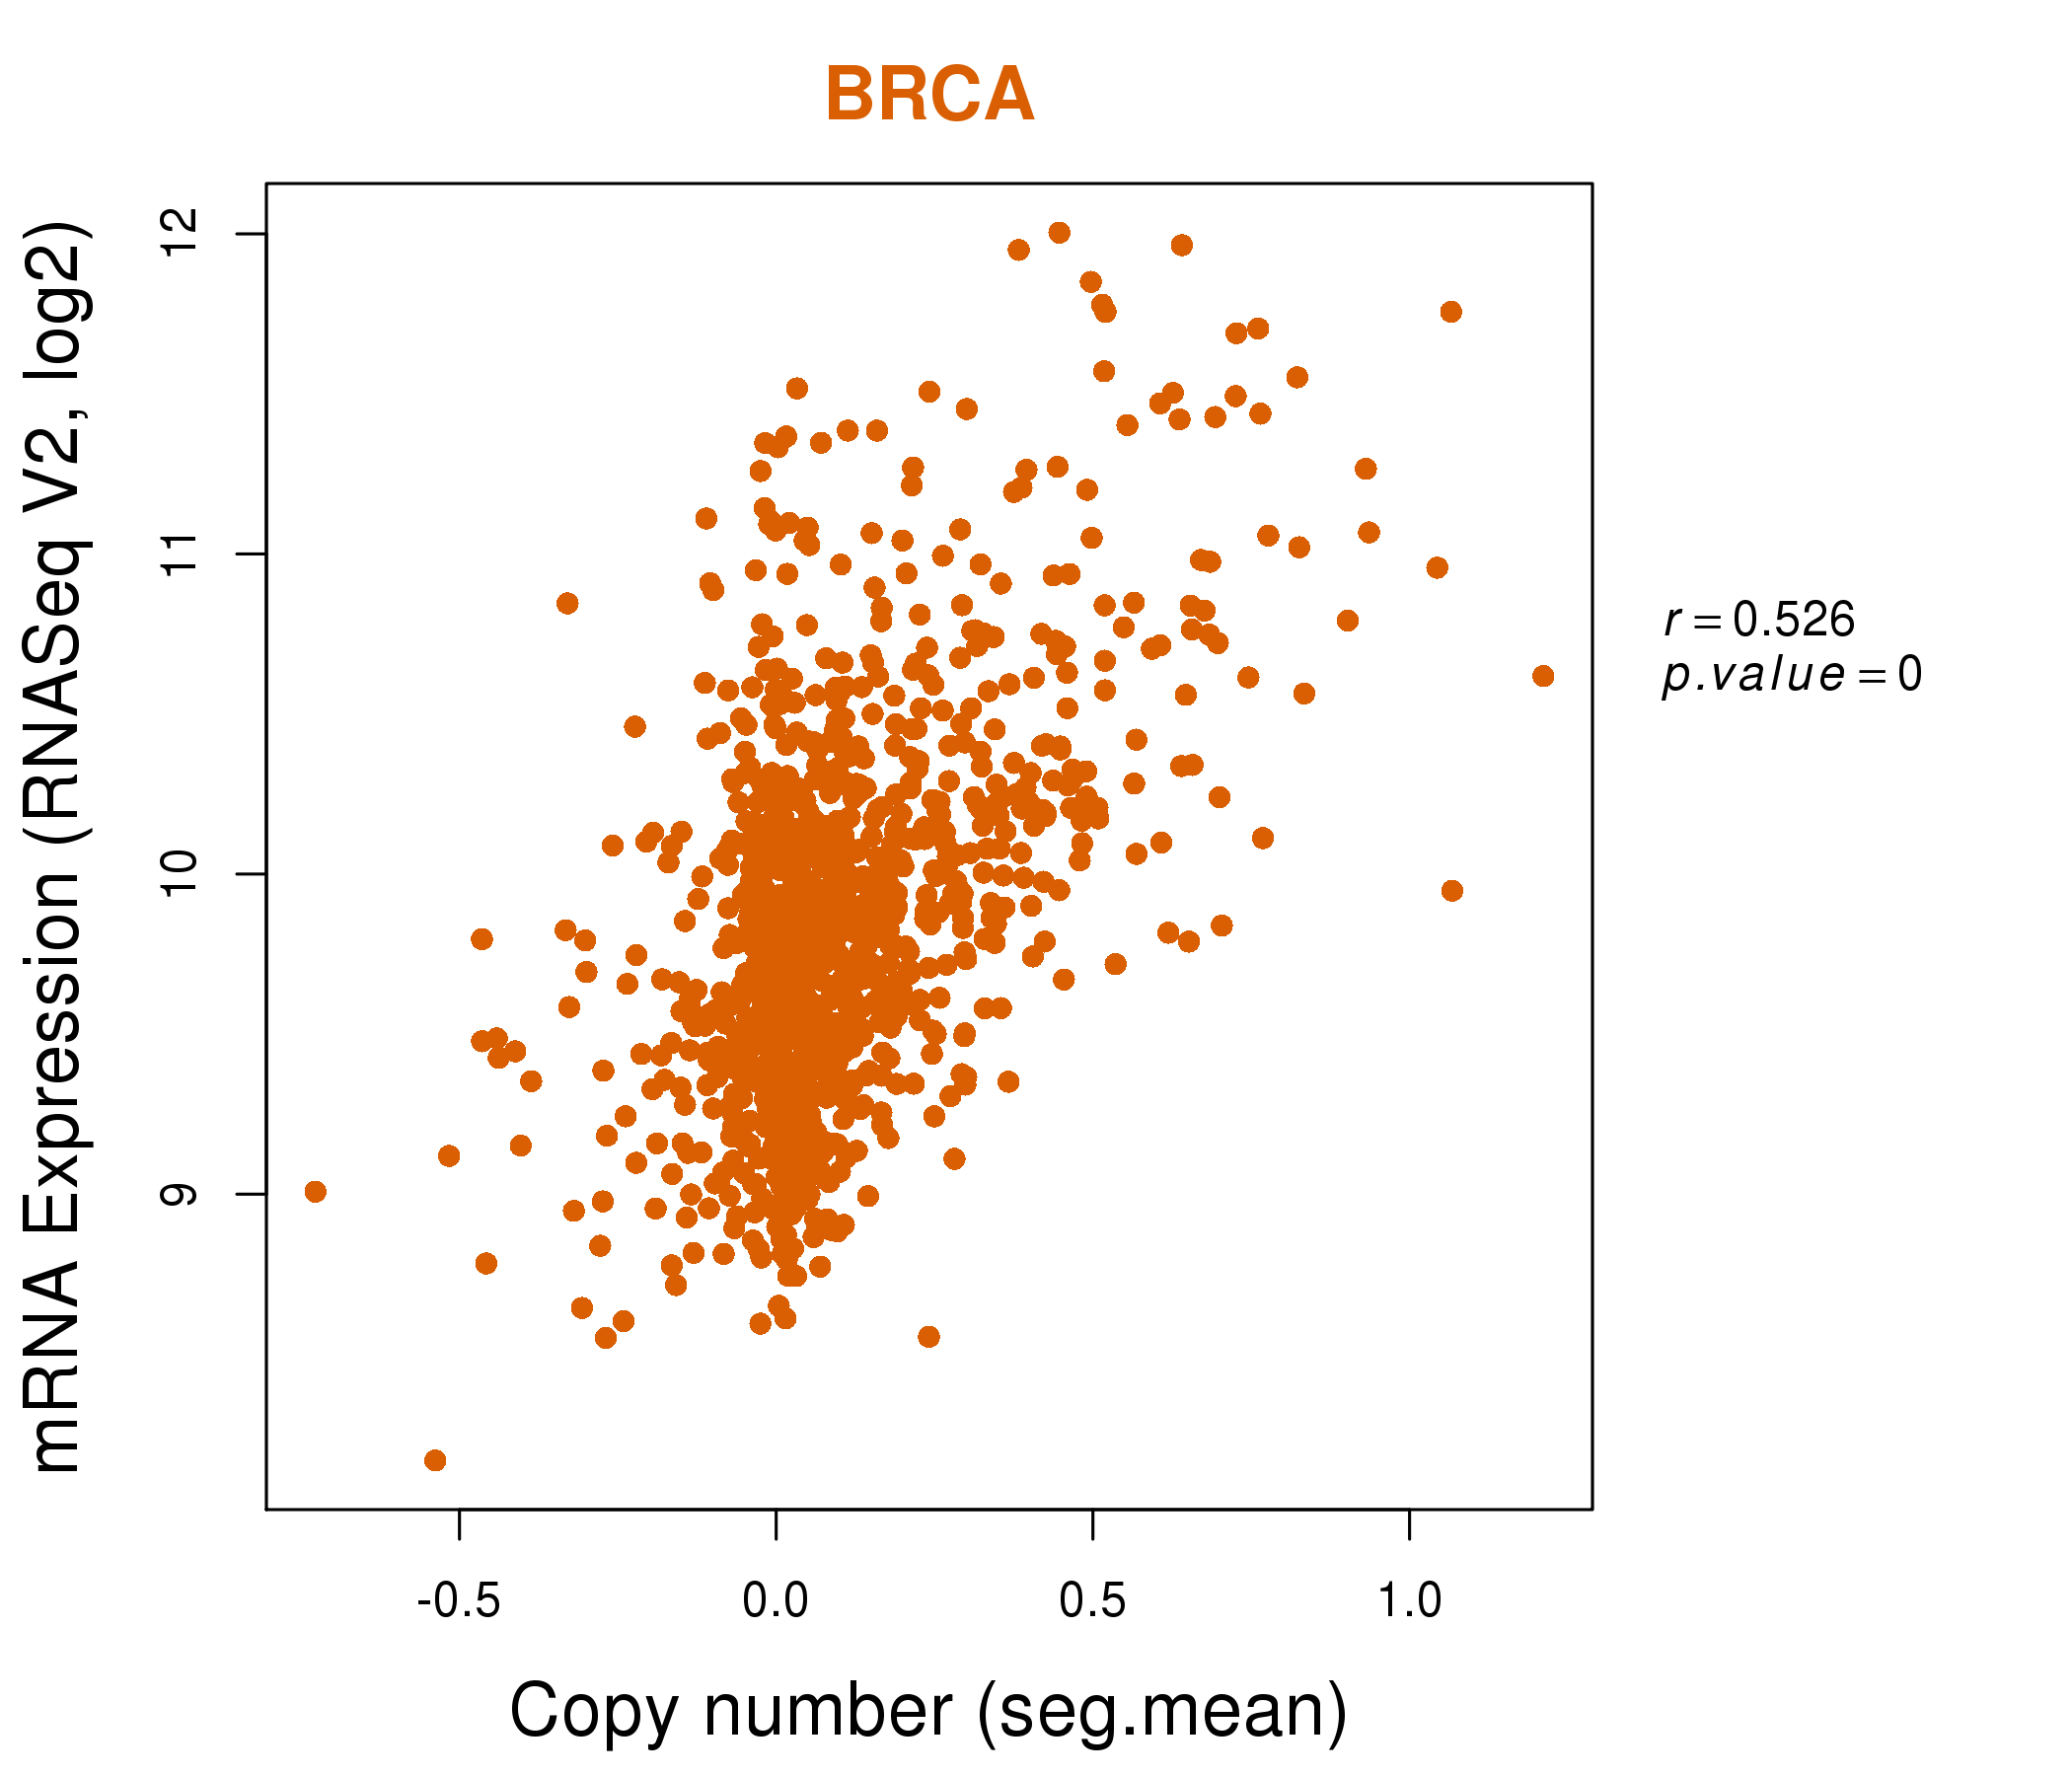
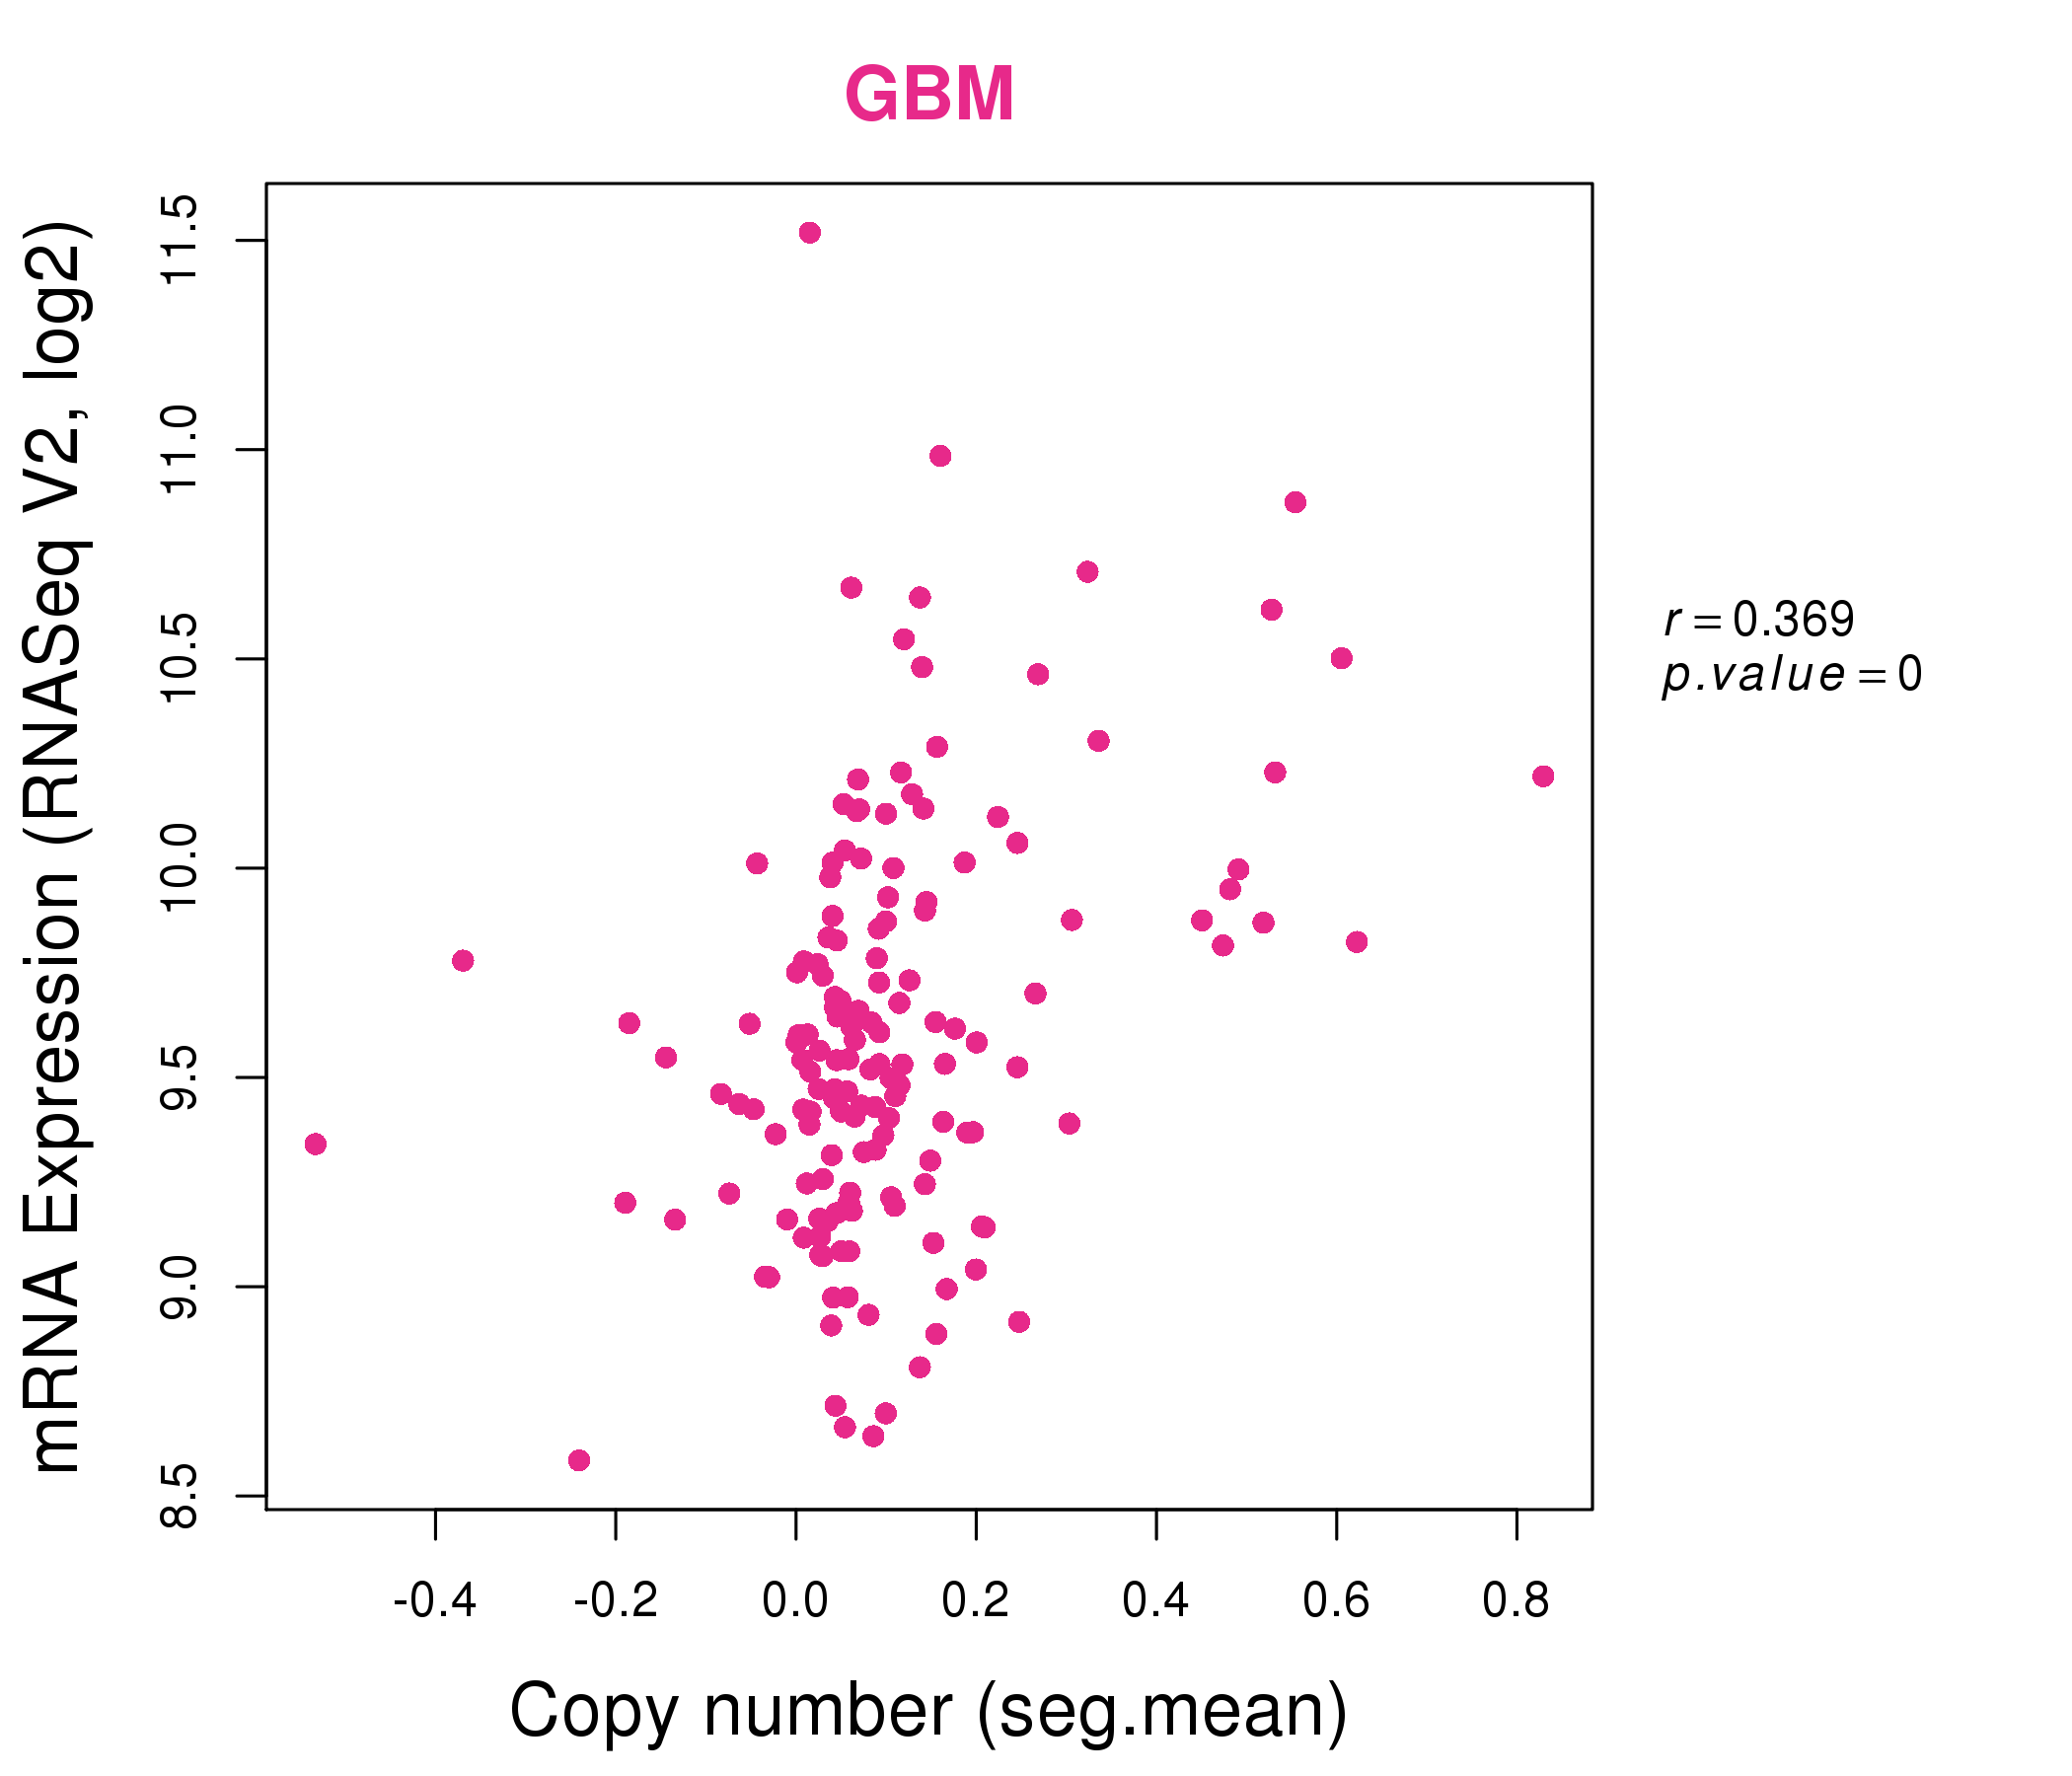
| * This plots show the correlation between CNV and gene expression. |
: Open all plots for all cancer types
 |
|
 |
|
| Top |
| Gene-Gene Network Information |
| * Co-Expression network figures were drawn using R package igraph. Only the top 20 genes with the highest correlations were shown. Red circle: input gene, orange circle: cell metabolism gene, sky circle: other gene |
: Open all plots for all cancer types
 |
|
| ABCF3,ALG3,AP2M1,C19orf43,C1orf35,ECE2,LOC152217, LSM4,LSM7,MRPL47,MRPL55,NDUFA11,PARL,POLR2H, PSMG3,RFXANK,RPL35A,RPP21,SNRPA,SNRPD2,USMG5 | SYNE4,CCDC24,COQ4,DPCD,FBXW9,LOC92659,LPAR2, LYPLA2,NMRAL1,NR2C2AP,PAFAH1B3,POLR2H,PPAP2C,PRCC, SLC35C2,STAP2,TARBP2,TMEM198,TSEN34,TSEN54,WDR34 |
 |
|
| UQCC2,C9orf142,CCDC58,TMA7,ECE2,GADD45GIP1,MRPL14, MRPL17,NDUFB4,NDUFS3,NR2C2AP,PARL,PCGF1,POLR2H, RFC4,RPL24,RPL32,RPL35,RPL35A,SNHG1,SS18L2 | ALG14,ATP6V0B,AUP1,MIEN1,PLGRKT,CCL15,CIB1, CLIC1,GEMIN8P4,H2AFY,LGALS3,MLX,PDCD6,PLEKHJ1, POLR2H,RASSF7,VIMP,TMEM106C,TRAF4,TSG101,VPS25 |


| * Co-Expression network figures were drawn using R package igraph. Only the top 20 genes with the highest correlations were shown. Red circle: input gene, orange circle: cell metabolism gene, sky circle: other gene |
: Open all plots for all cancer types
| Top |
: Open all interacting genes' information including KEGG pathway for all interacting genes from DAVID
| Top |
| Pharmacological Information for POLR2H |
| There's no related Drug. |
| Top |
| Cross referenced IDs for POLR2H |
| * We obtained these cross-references from Uniprot database. It covers 150 different DBs, 18 categories. http://www.uniprot.org/help/cross_references_section |
: Open all cross reference information
|
Copyright © 2016-Present - The Univsersity of Texas Health Science Center at Houston @ |