|
||||||||||||||||||||||||||||||||||||||||||||||||||||||||||||||||||||||||||||||||||||||||||||||||||||||||||||||||||||||||||||||||||||||||||||||||||||||||||||||||||||||||||||||||||||||||||||||||||||||||||||||||||||||||||||||||||||||||||||||||||||||||||||||||||||||||||||||||||||||||||||||||||||||||||||||||||||||||||
| |
| Phenotypic Information (metabolism pathway, cancer, disease, phenome) |
| |
| |
| Gene-Gene Network Information: Co-Expression Network, Interacting Genes & KEGG |
| |
|


| Gene Summary for XRN1 |
| Top |
| Phenotypic Information for XRN1(metabolism pathway, cancer, disease, phenome) |
| Cancer | CGAP: XRN1 |
| Familial Cancer Database: XRN1 | |
| * This gene is included in those cancer gene databases. |
|
|
|
|
|
| . | ||||||||||||||||||||||||||||||||||||||||||||||||||||||||||||||||||||||||||||||||||||||||||||||||||||||||||||||||||||||||||||||||||||||||||||||||||||||||||||||||||||||||||||||||||||||||||||||||||||||||||||||||||||||||||||||||||||||||||||||||||||||||||||||||||||||||||||||||||||||||||||||||||||||||||||||||||||
Oncogene 1 | Significant driver gene in | |||||||||||||||||||||||||||||||||||||||||||||||||||||||||||||||||||||||||||||||||||||||||||||||||||||||||||||||||||||||||||||||||||||||||||||||||||||||||||||||||||||||||||||||||||||||||||||||||||||||||||||||||||||||||||||||||||||||||||||||||||||||||||||||||||||||||||||||||||||||||||||||||||||||||||||||||||||||||
| cf) number; DB name 1 Oncogene; http://nar.oxfordjournals.org/content/35/suppl_1/D721.long, 2 Tumor Suppressor gene; https://bioinfo.uth.edu/TSGene/, 3 Cancer Gene Census; http://www.nature.com/nrc/journal/v4/n3/abs/nrc1299.html, 4 CancerGenes; http://nar.oxfordjournals.org/content/35/suppl_1/D721.long, 5 Network of Cancer Gene; http://ncg.kcl.ac.uk/index.php, 1Therapeutic Vulnerabilities in Cancer; http://cbio.mskcc.org/cancergenomics/statius/ |
| REACTOME_METABOLISM_OF_MRNA REACTOME_METABOLISM_OF_RNA | |
| OMIM | 607994; gene. |
| Orphanet | |
| Disease | KEGG Disease: XRN1 |
| MedGen: XRN1 (Human Medical Genetics with Condition) | |
| ClinVar: XRN1 | |
| Phenotype | MGI: XRN1 (International Mouse Phenotyping Consortium) |
| PhenomicDB: XRN1 | |
| Mutations for XRN1 |
| * Under tables are showing count per each tissue to give us broad intuition about tissue specific mutation patterns.You can go to the detailed page for each mutation database's web site. |
| - Statistics for Tissue and Mutation type | Top |
 |
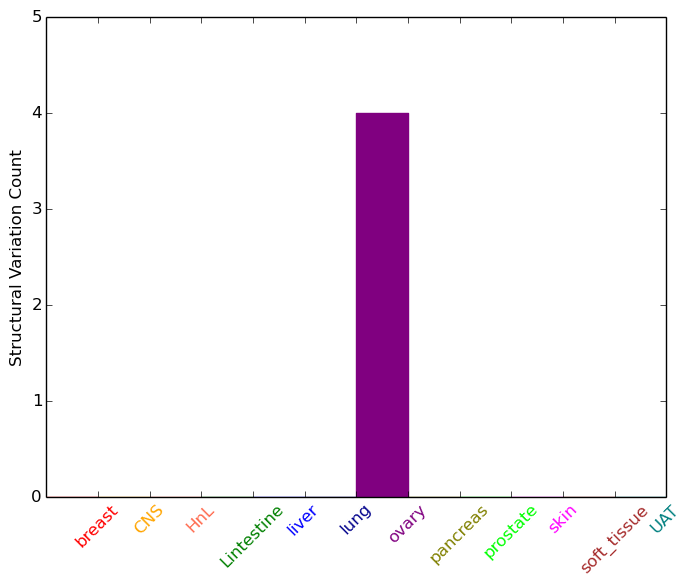
| - For Inter-chromosomal Variations |
| There's no inter-chromosomal structural variation. |
| - For Intra-chromosomal Variations |
| * Intra-chromosomal variantions includes 'intrachromosomal amplicon to amplicon', 'intrachromosomal amplicon to non-amplified dna', 'intrachromosomal deletion', 'intrachromosomal fold-back inversion', 'intrachromosomal inversion', 'intrachromosomal tandem duplication', 'Intrachromosomal unknown type', 'intrachromosomal with inverted orientation', 'intrachromosomal with non-inverted orientation'. |
 |
| Sample | Symbol_a | Chr_a | Start_a | End_a | Symbol_b | Chr_b | Start_b | End_b |
| ovary | XRN1 | chr3 | 142089160 | 142089180 | GK5 | chr3 | 141894728 | 141894748 |
| ovary | XRN1 | chr3 | 142122557 | 142122577 | XRN1 | chr3 | 142122614 | 142122634 |
| ovary | XRN1 | chr3 | 142157079 | 142157099 | XRN1 | chr3 | 142157335 | 142157355 |
| cf) Tissue number; Tissue name (1;Breast, 2;Central_nervous_system, 3;Haematopoietic_and_lymphoid_tissue, 4;Large_intestine, 5;Liver, 6;Lung, 7;Ovary, 8;Pancreas, 9;Prostate, 10;Skin, 11;Soft_tissue, 12;Upper_aerodigestive_tract) |
| * From mRNA Sanger sequences, Chitars2.0 arranged chimeric transcripts. This table shows XRN1 related fusion information. |
| ID | Head Gene | Tail Gene | Accession | Gene_a | qStart_a | qEnd_a | Chromosome_a | tStart_a | tEnd_a | Gene_a | qStart_a | qEnd_a | Chromosome_a | tStart_a | tEnd_a |
| AI871771 | XRN1 | 1 | 278 | 3 | 142029034 | 142029311 | GNPTAB | 272 | 474 | 12 | 102139379 | 102139580 | |
| BE671625 | XRN1 | 1 | 279 | 3 | 142029034 | 142029312 | GNPTAB | 273 | 518 | 12 | 102139335 | 102139580 | |
| DB537013 | NQO1 | 1 | 297 | 16 | 69744221 | 69744518 | XRN1 | 297 | 331 | 3 | 142053702 | 142053736 | |
| Top |
| Mutation type/ Tissue ID | brca | cns | cerv | endome | haematopo | kidn | Lintest | liver | lung | ns | ovary | pancre | prost | skin | stoma | thyro | urina | |||
| Total # sample | 1 | 1 | 1 | |||||||||||||||||
| GAIN (# sample) | 1 | 1 | 1 | |||||||||||||||||
| LOSS (# sample) |
| cf) Tissue ID; Tissue type (1; Breast, 2; Central_nervous_system, 3; Cervix, 4; Endometrium, 5; Haematopoietic_and_lymphoid_tissue, 6; Kidney, 7; Large_intestine, 8; Liver, 9; Lung, 10; NS, 11; Ovary, 12; Pancreas, 13; Prostate, 14; Skin, 15; Stomach, 16; Thyroid, 17; Urinary_tract) |
| Top |
|
 |
| Top |
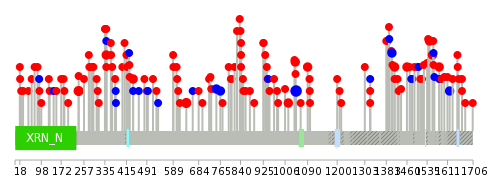
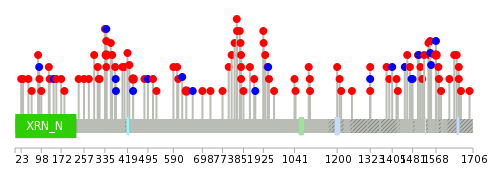
| Stat. for Non-Synonymous SNVs (# total SNVs=120) | (# total SNVs=28) |
 |  |
(# total SNVs=6) | (# total SNVs=1) |
 |  |
| Top |
| * When you move the cursor on each content, you can see more deailed mutation information on the Tooltip. Those are primary_site,primary_histology,mutation(aa),pubmedID. |
| GRCh37 position | Mutation(aa) | Unique sampleID count |
| chr3:142089390-142089390 | p.C1047C | 6 |
| chr3:142142403-142142403 | p.R237W | 3 |
| chr3:142142427-142142427 | p.R229* | 3 |
| chr3:142122802-142122802 | p.R638H | 3 |
| chr3:142140334-142140334 | p.L340P | 3 |
| chr3:142030643-142030643 | p.R1611fs*34 | 3 |
| chr3:142048297-142048297 | p.F1460L | 2 |
| chr3:142137373-142137373 | p.T440M | 2 |
| chr3:142089400-142089400 | p.R1044H | 2 |
| chr3:142030480-142030480 | p.S1665F | 2 |
| Top |
|
 |
| Point Mutation/ Tissue ID | 1 | 2 | 3 | 4 | 5 | 6 | 7 | 8 | 9 | 10 | 11 | 12 | 13 | 14 | 15 | 16 | 17 | 18 | 19 | 20 |
| # sample | 3 | 6 | 23 | 9 | 7 | 3 | 13 | 5 | 4 | 10 | 12 | 3 | 13 | |||||||
| # mutation | 3 | 6 | 23 | 9 | 7 | 3 | 13 | 5 | 4 | 10 | 14 | 3 | 15 | |||||||
| nonsynonymous SNV | 2 | 4 | 16 | 7 | 6 | 3 | 10 | 4 | 4 | 10 | 14 | 1 | 14 | |||||||
| synonymous SNV | 1 | 2 | 7 | 2 | 1 | 3 | 1 | 2 | 1 |
| cf) Tissue ID; Tissue type (1; BLCA[Bladder Urothelial Carcinoma], 2; BRCA[Breast invasive carcinoma], 3; CESC[Cervical squamous cell carcinoma and endocervical adenocarcinoma], 4; COAD[Colon adenocarcinoma], 5; GBM[Glioblastoma multiforme], 6; Glioma Low Grade, 7; HNSC[Head and Neck squamous cell carcinoma], 8; KICH[Kidney Chromophobe], 9; KIRC[Kidney renal clear cell carcinoma], 10; KIRP[Kidney renal papillary cell carcinoma], 11; LAML[Acute Myeloid Leukemia], 12; LUAD[Lung adenocarcinoma], 13; LUSC[Lung squamous cell carcinoma], 14; OV[Ovarian serous cystadenocarcinoma ], 15; PAAD[Pancreatic adenocarcinoma], 16; PRAD[Prostate adenocarcinoma], 17; SKCM[Skin Cutaneous Melanoma], 18:STAD[Stomach adenocarcinoma], 19:THCA[Thyroid carcinoma], 20:UCEC[Uterine Corpus Endometrial Carcinoma]) |
| Top |
| * We represented just top 10 SNVs. When you move the cursor on each content, you can see more deailed mutation information on the Tooltip. Those are primary_site, primary_histology, mutation(aa), pubmedID. |
| Genomic Position | Mutation(aa) | Unique sampleID count |
| chr3:142140334 | p.L340P,XRN1 | 3 |
| chr3:142102234 | p.S1653Y,XRN1 | 2 |
| chr3:142030480 | p.R638H,XRN1 | 2 |
| chr3:142137373 | p.R842S,XRN1 | 2 |
| chr3:142122802 | p.H1568R,XRN1 | 2 |
| chr3:142031519 | p.T440M,XRN1 | 2 |
| chr3:142139962 | p.S698L,XRN1 | 1 |
| chr3:142037719 | p.T400A,XRN1 | 1 |
| chr3:142102233 | p.Q1661E,XRN1 | 1 |
| chr3:142142402 | p.R237Q,XRN1 | 1 |
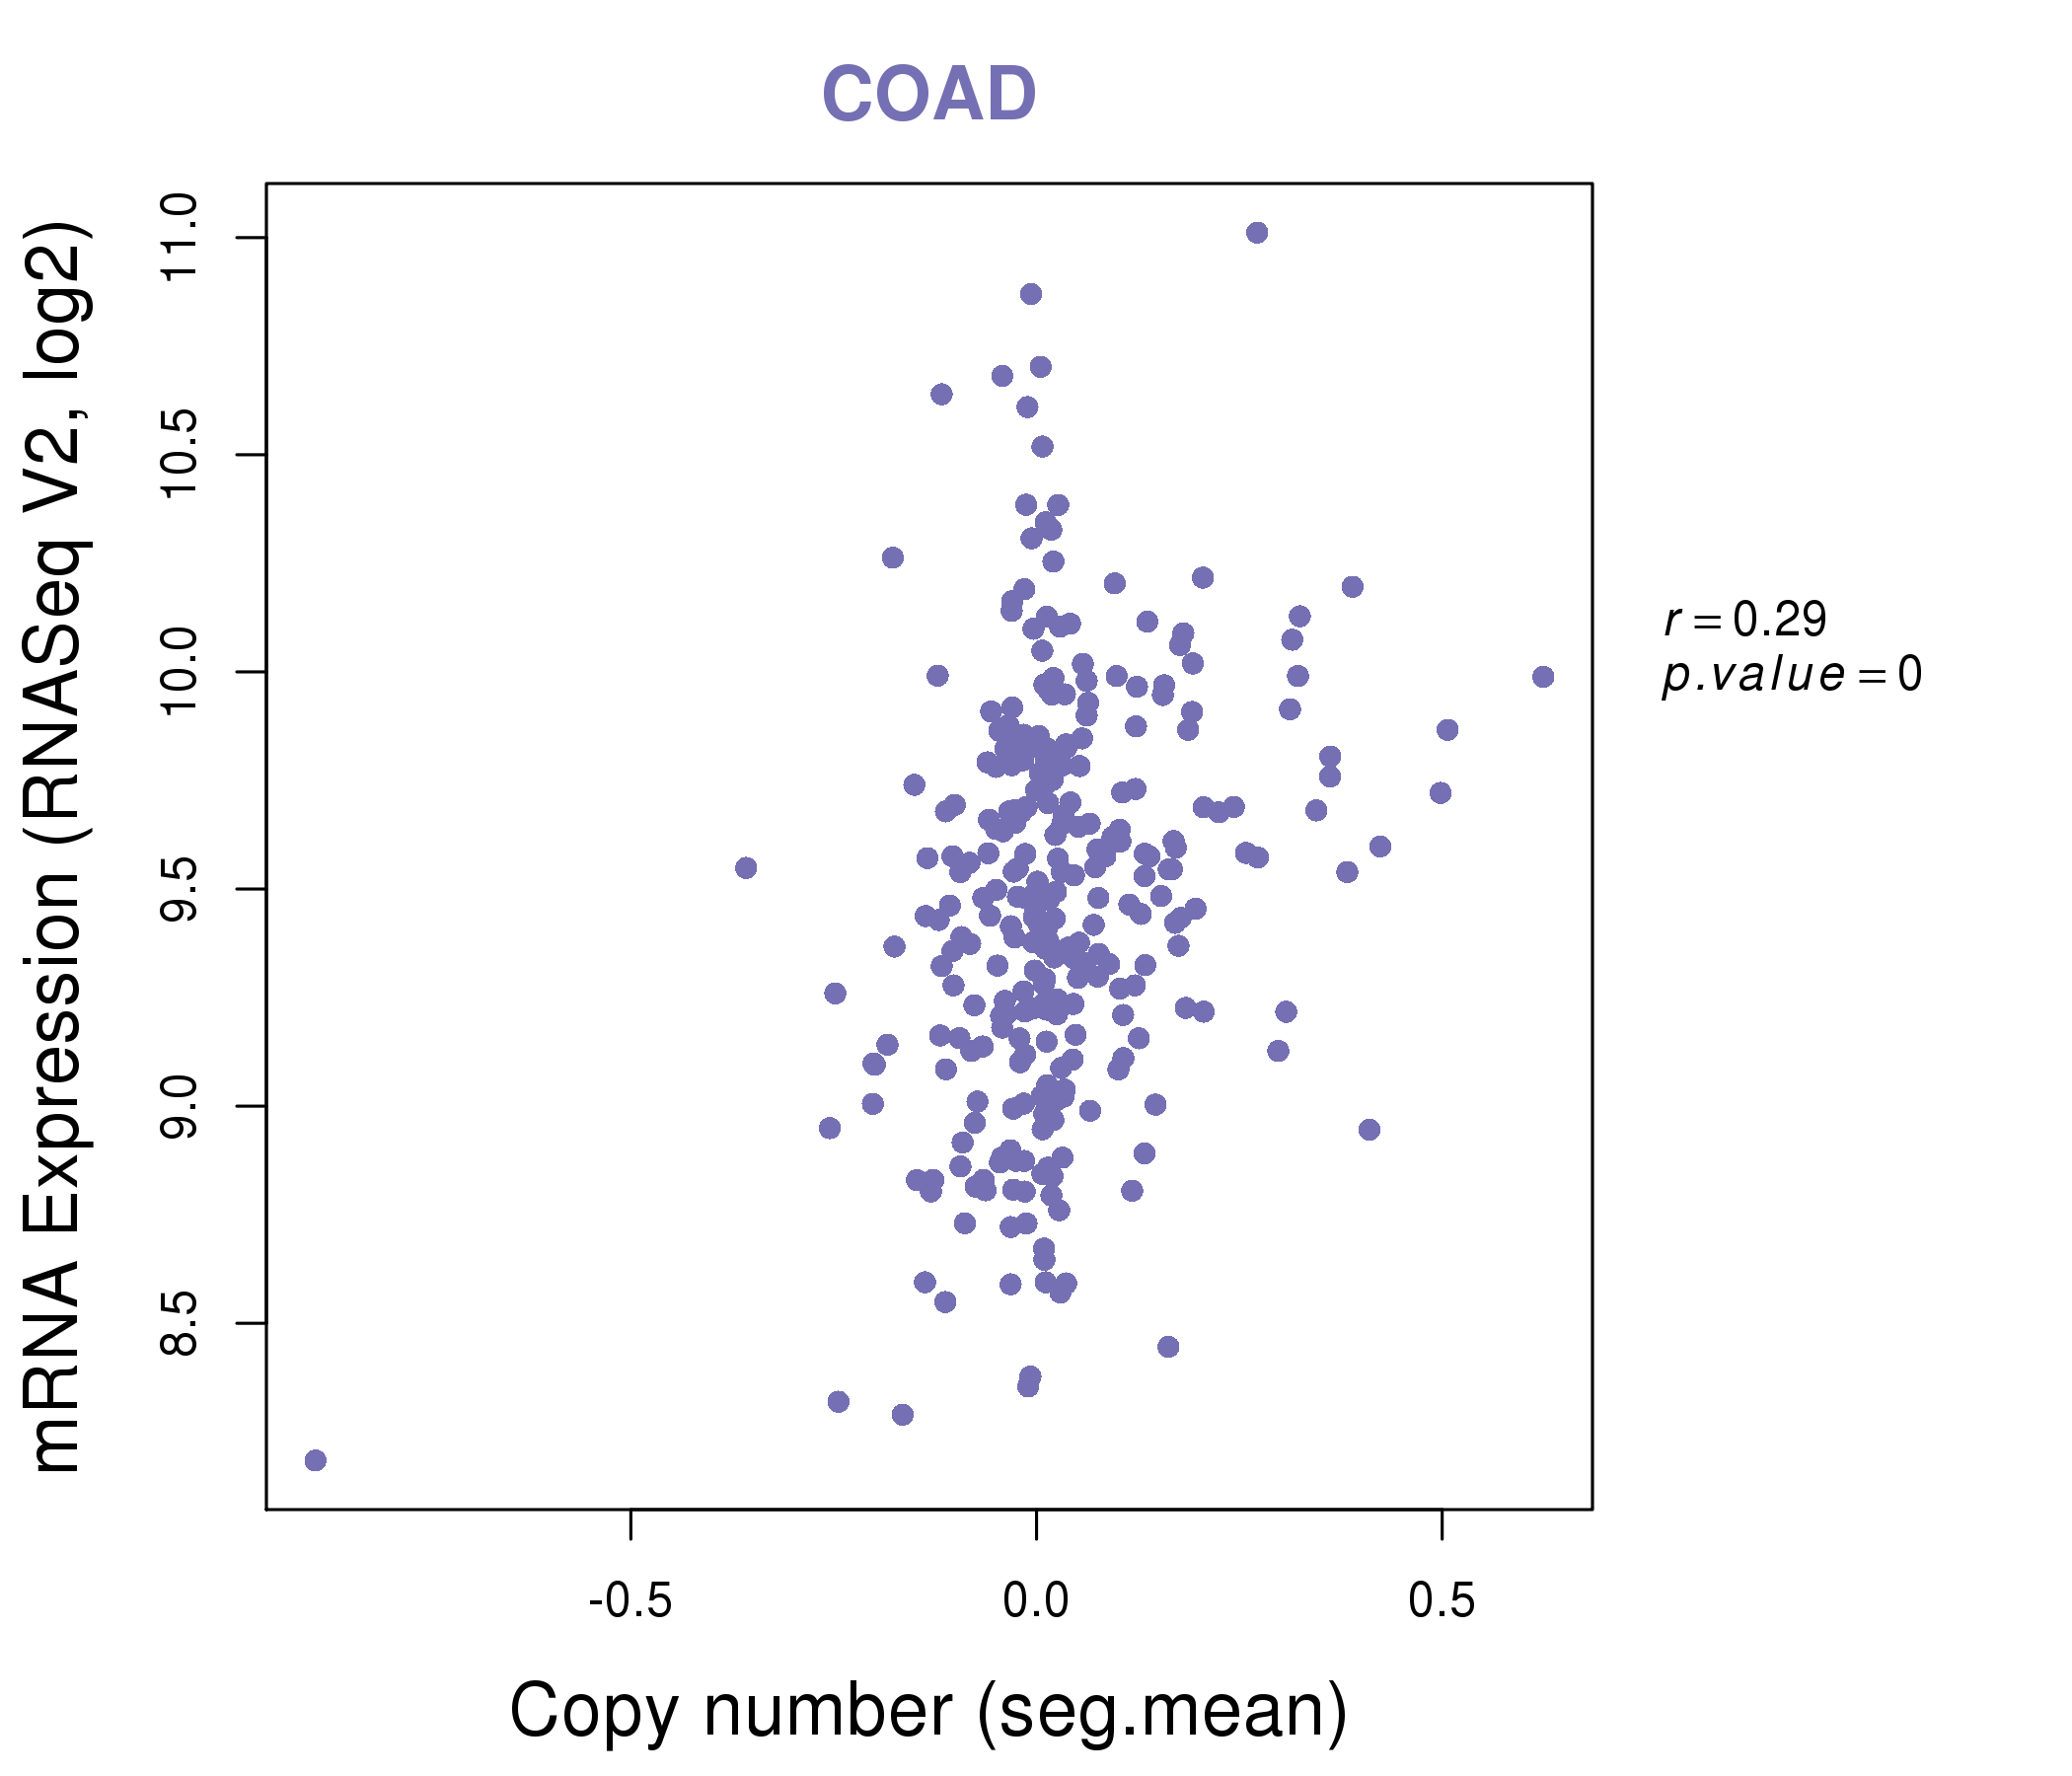
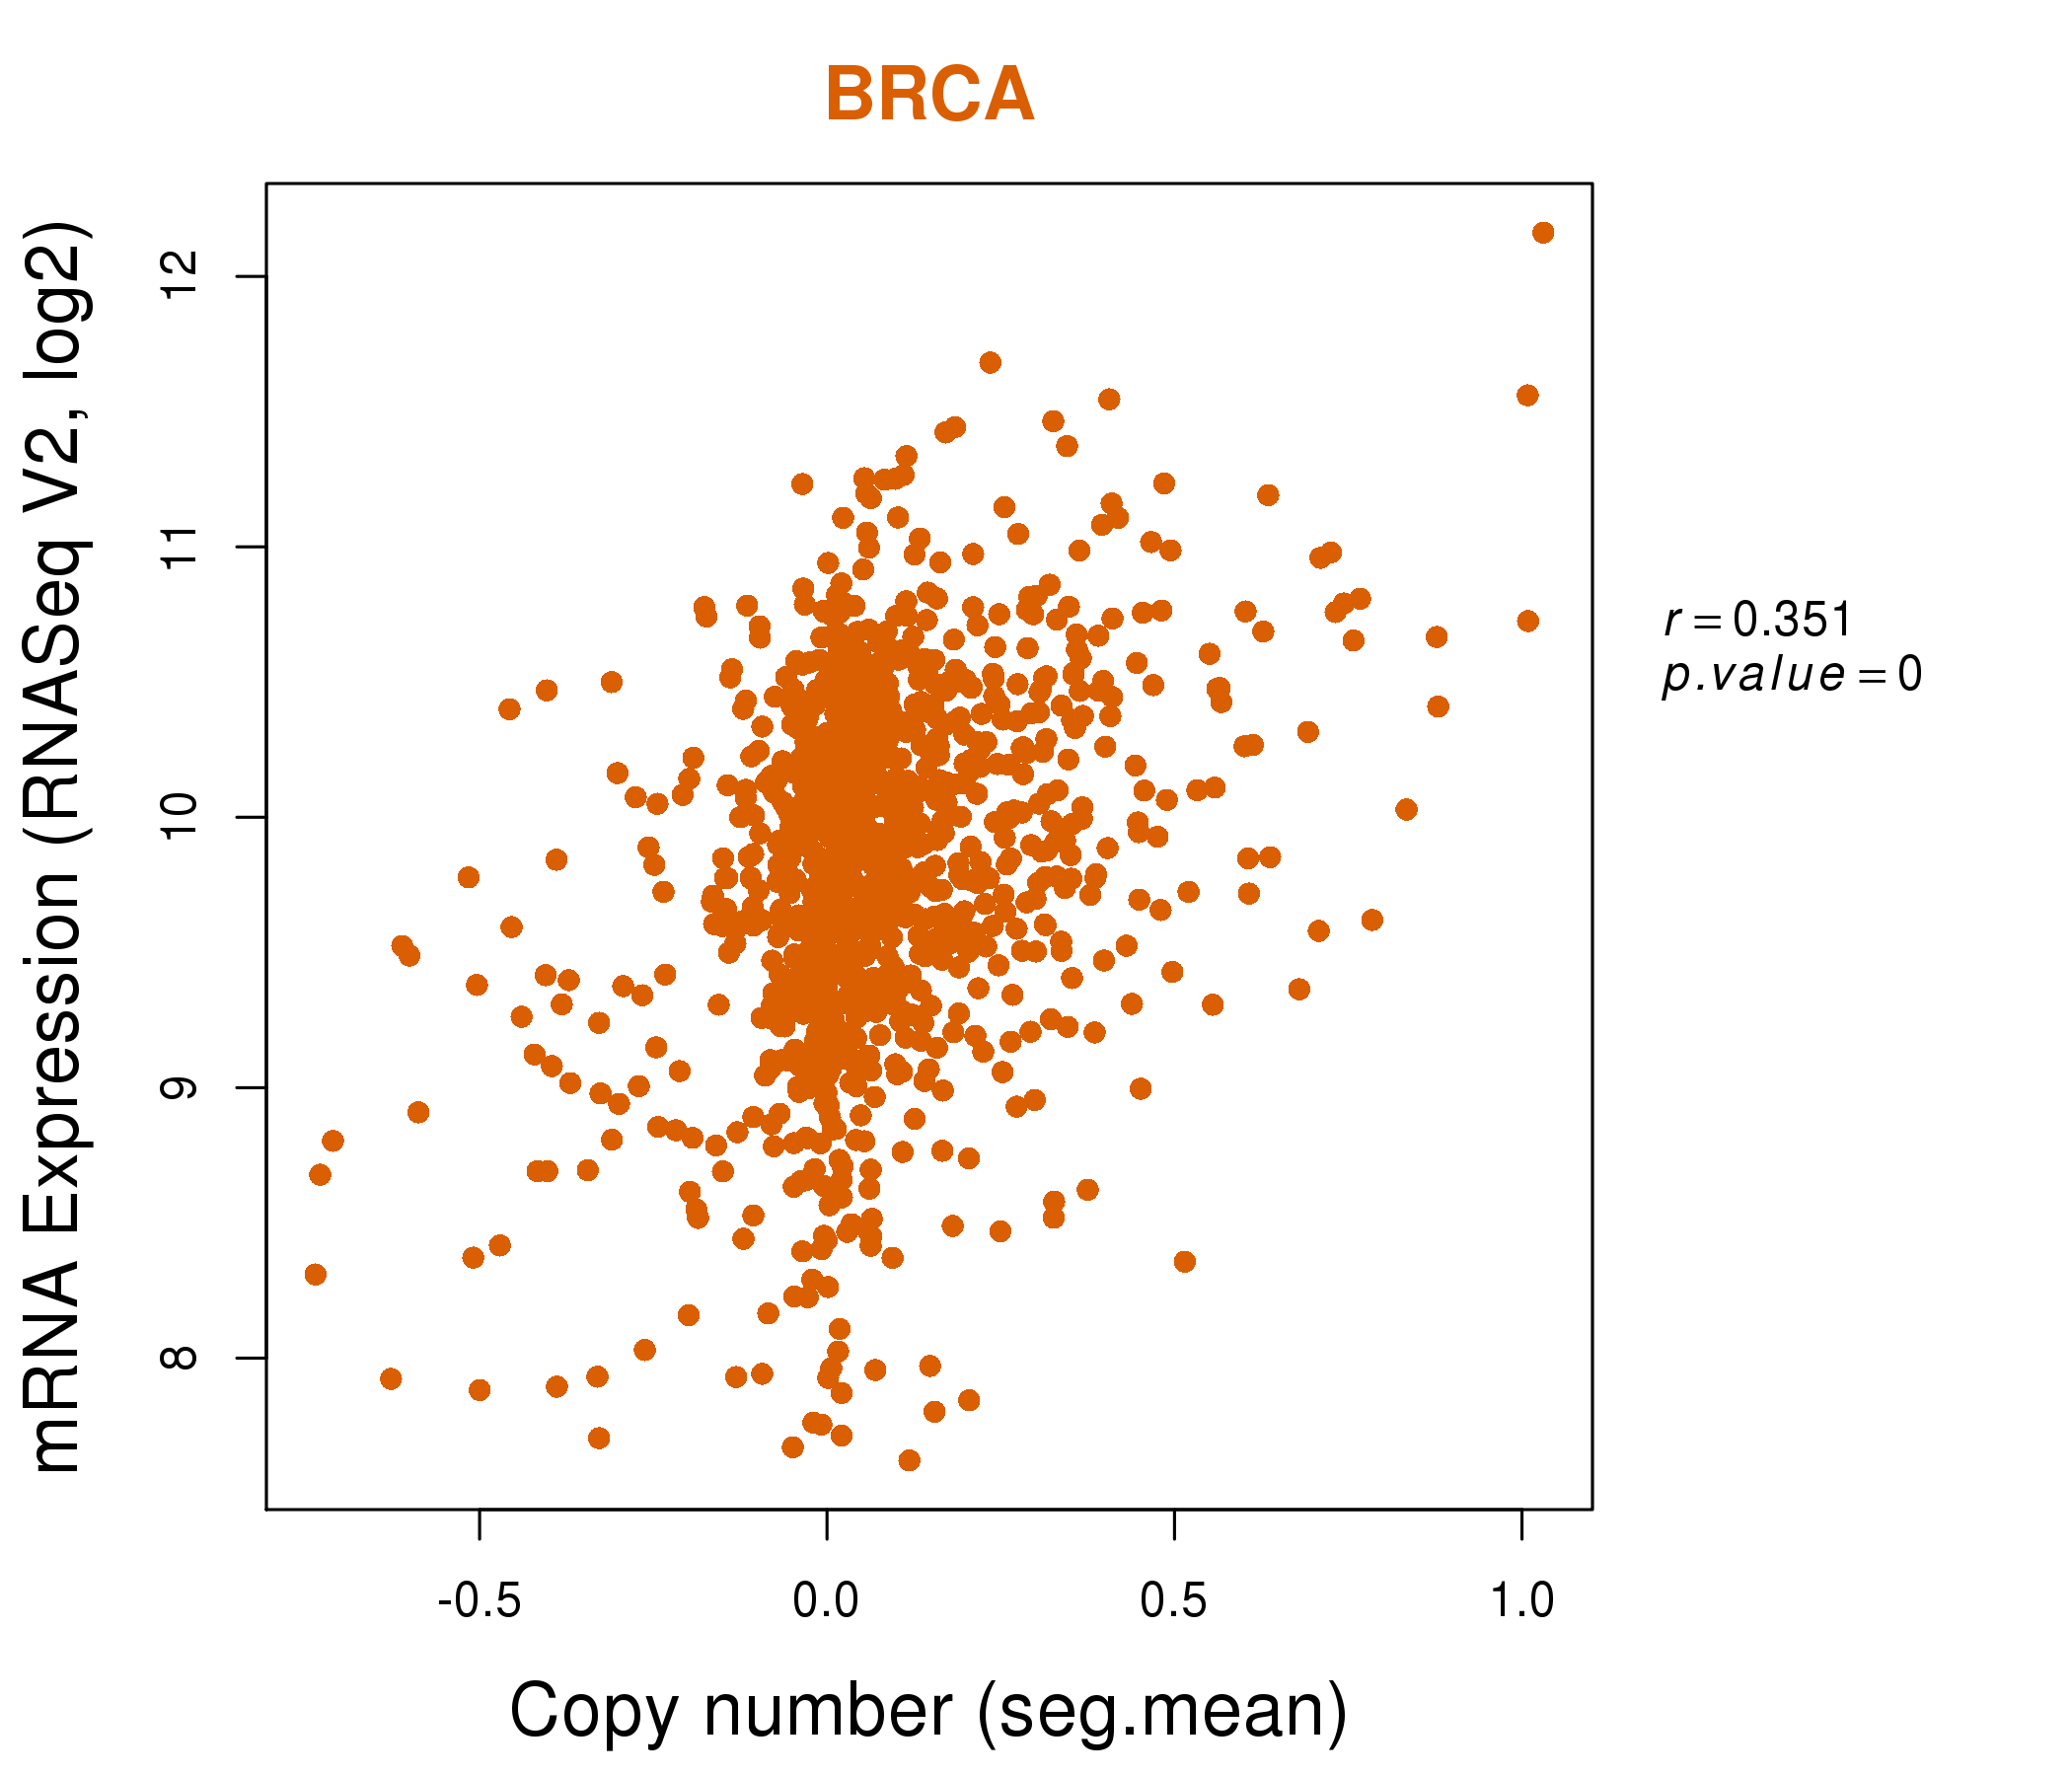
| * Copy number data were extracted from TCGA using R package TCGA-Assembler. The URLs of all public data files on TCGA DCC data server were gathered on Jan-05-2015. Function ProcessCNAData in TCGA-Assembler package was used to obtain gene-level copy number value which is calculated as the average copy number of the genomic region of a gene. |
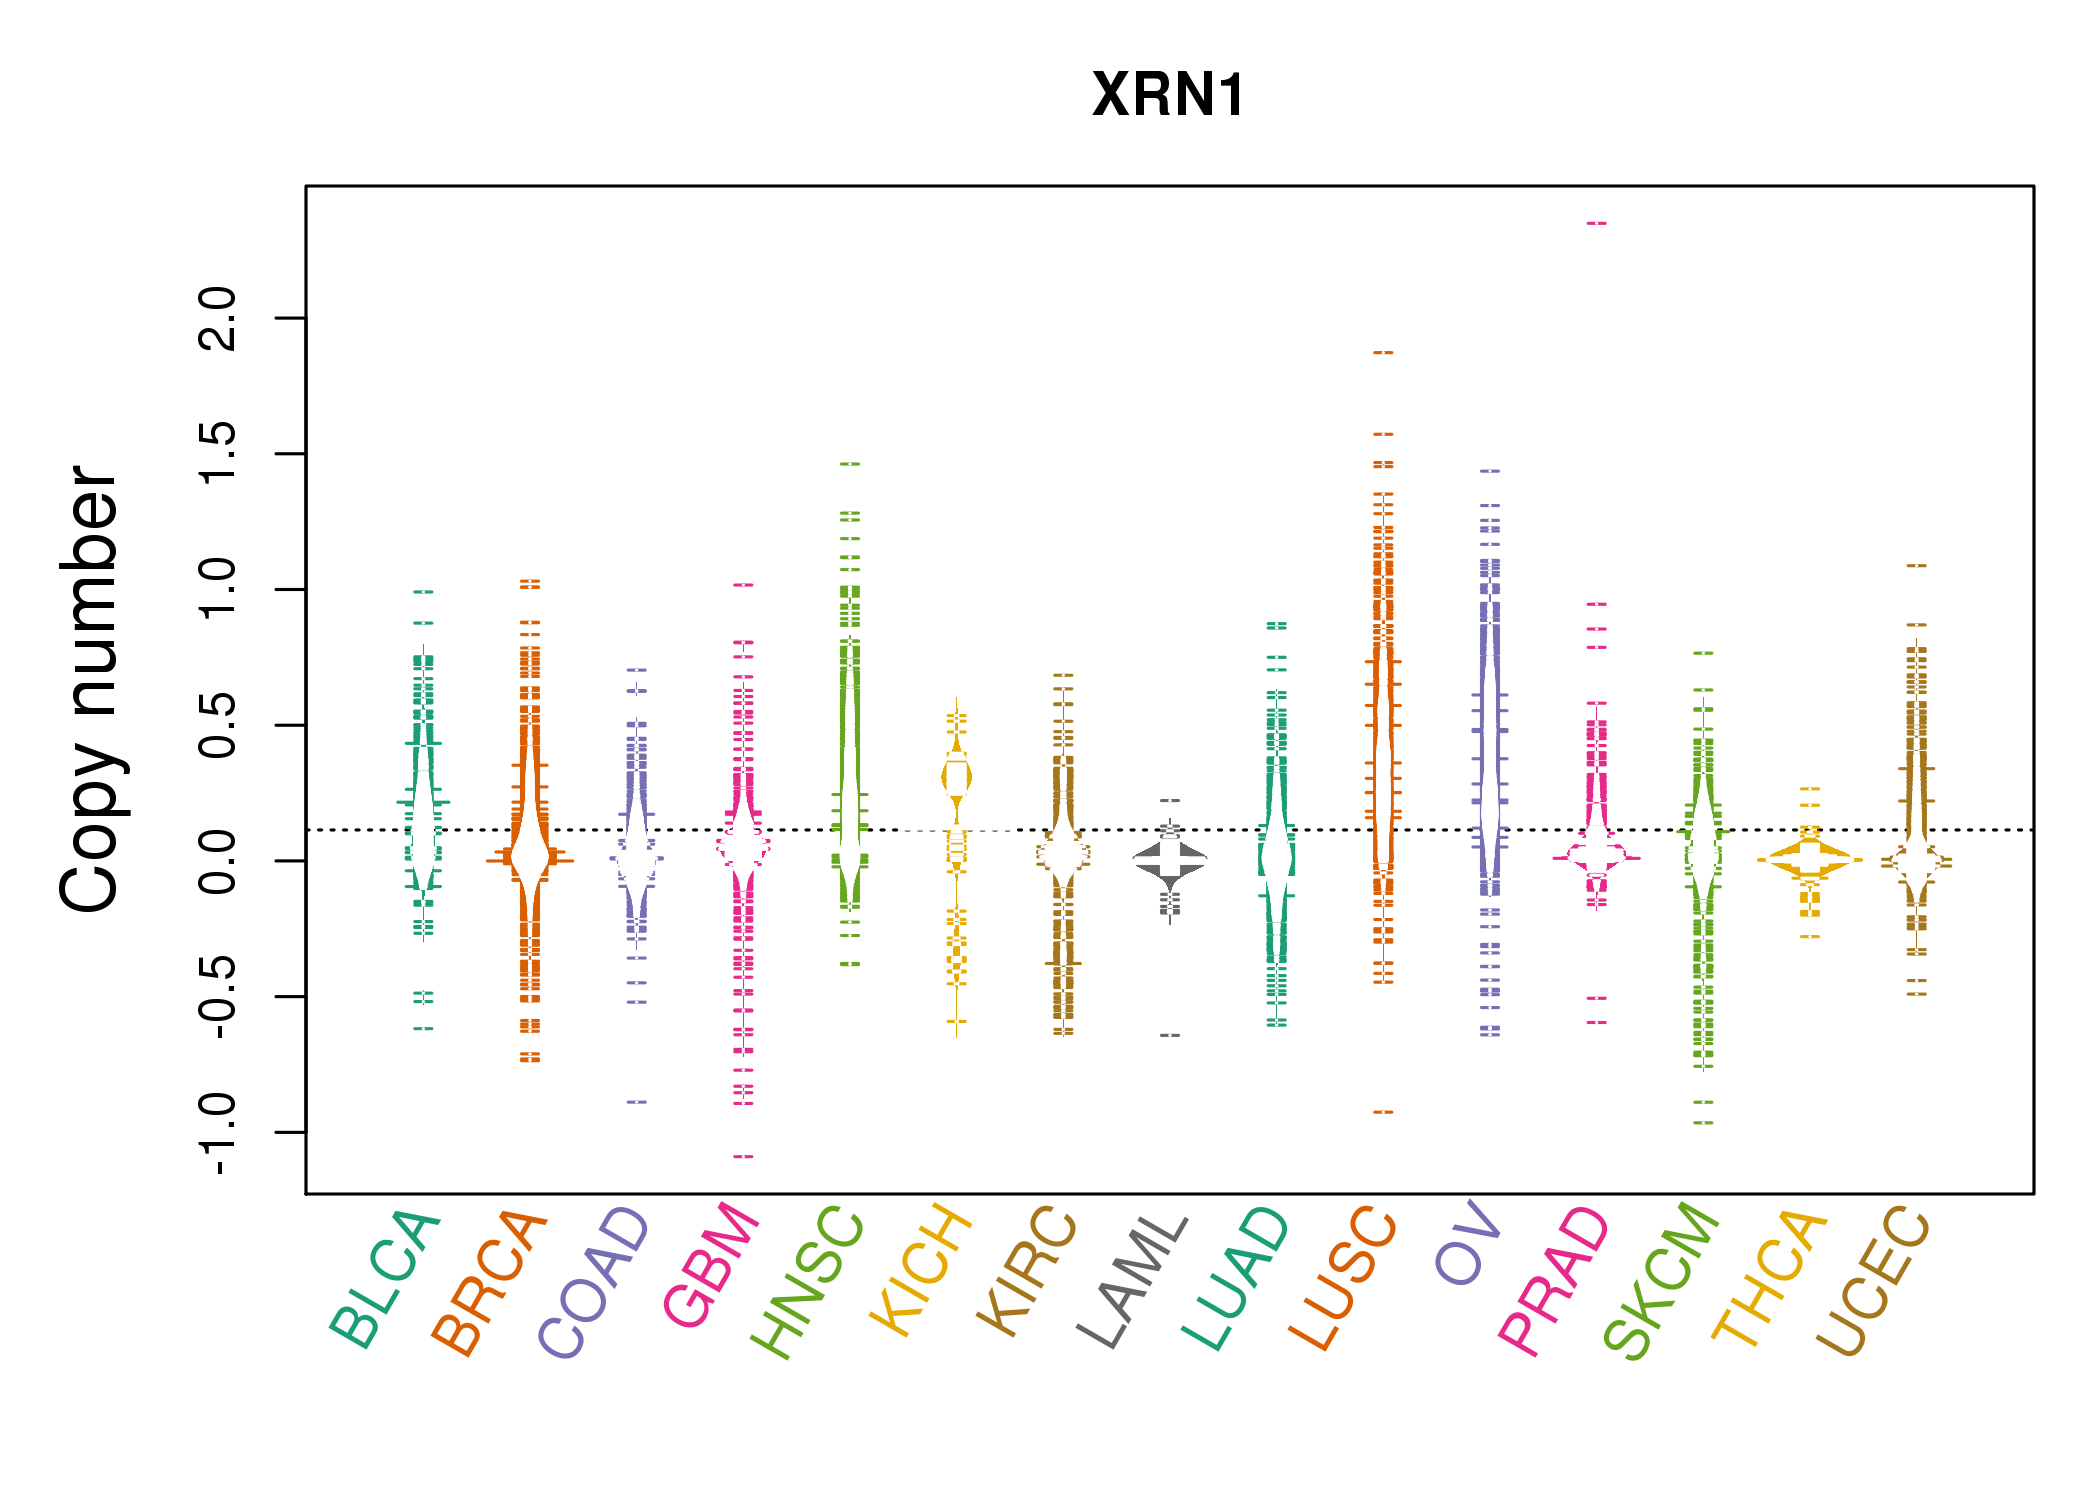 |
| cf) Tissue ID[Tissue type]: BLCA[Bladder Urothelial Carcinoma], BRCA[Breast invasive carcinoma], CESC[Cervical squamous cell carcinoma and endocervical adenocarcinoma], COAD[Colon adenocarcinoma], GBM[Glioblastoma multiforme], Glioma Low Grade, HNSC[Head and Neck squamous cell carcinoma], KICH[Kidney Chromophobe], KIRC[Kidney renal clear cell carcinoma], KIRP[Kidney renal papillary cell carcinoma], LAML[Acute Myeloid Leukemia], LUAD[Lung adenocarcinoma], LUSC[Lung squamous cell carcinoma], OV[Ovarian serous cystadenocarcinoma ], PAAD[Pancreatic adenocarcinoma], PRAD[Prostate adenocarcinoma], SKCM[Skin Cutaneous Melanoma], STAD[Stomach adenocarcinoma], THCA[Thyroid carcinoma], UCEC[Uterine Corpus Endometrial Carcinoma] |
| Top |
| Gene Expression for XRN1 |
| * CCLE gene expression data were extracted from CCLE_Expression_Entrez_2012-10-18.res: Gene-centric RMA-normalized mRNA expression data. |
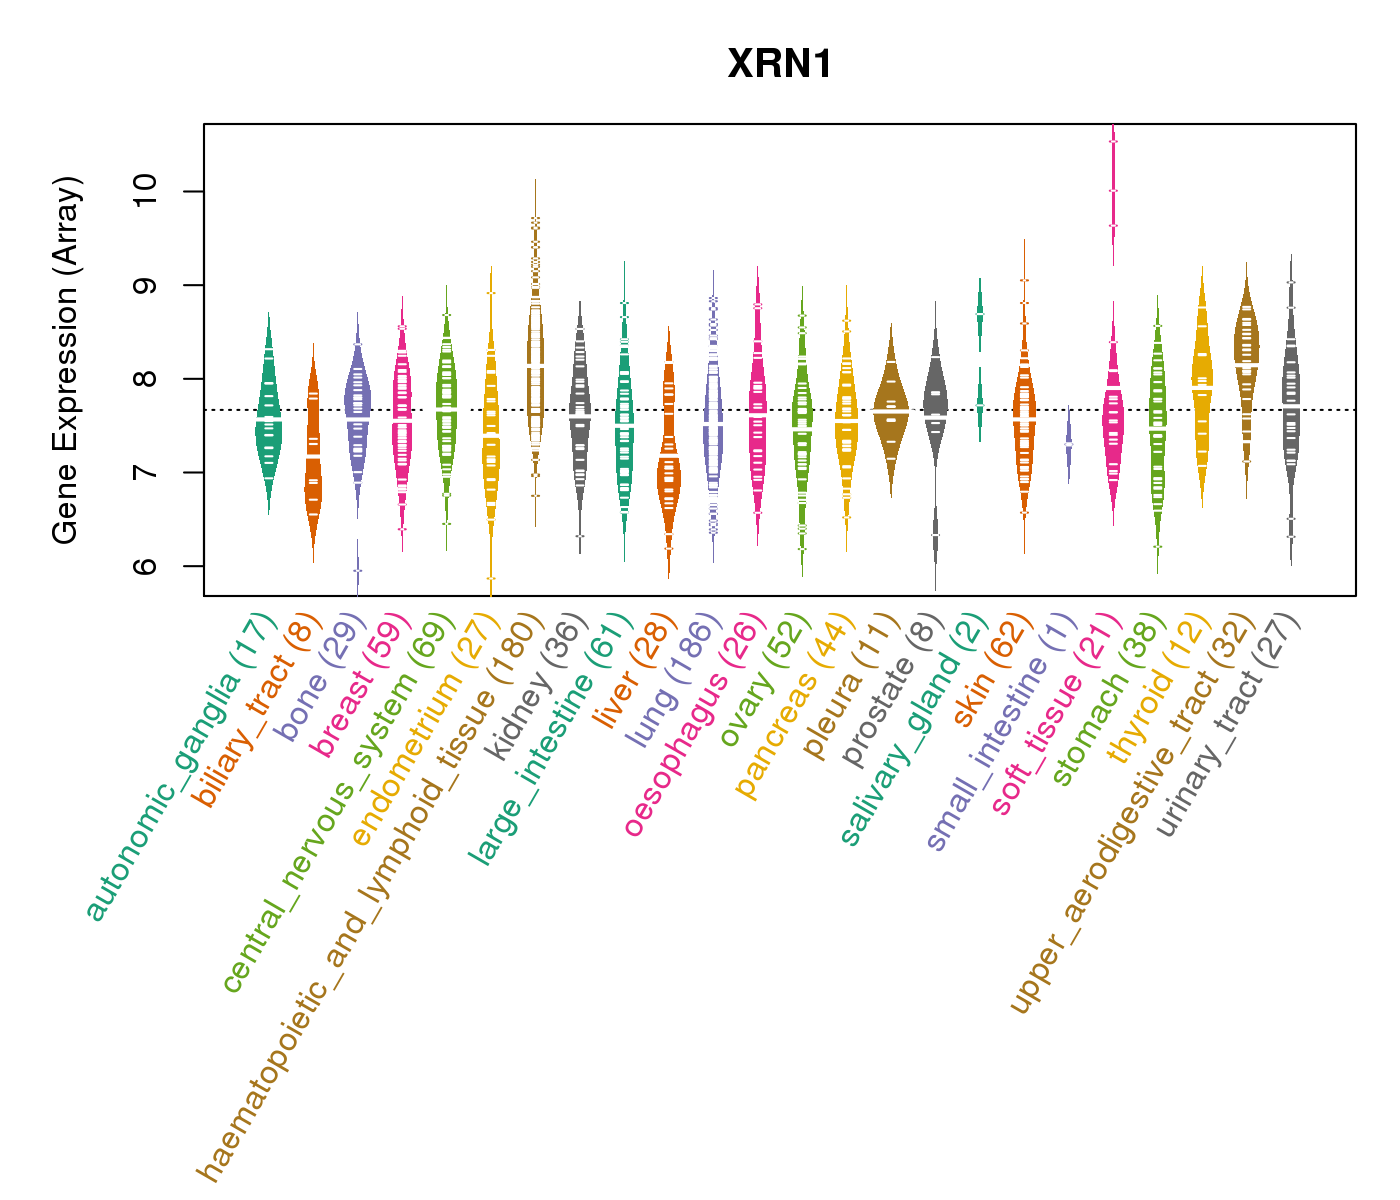 |
| * Normalized gene expression data of RNASeqV2 was extracted from TCGA using R package TCGA-Assembler. The URLs of all public data files on TCGA DCC data server were gathered at Jan-05-2015. Only eight cancer types have enough normal control samples for differential expression analysis. (t test, adjusted p<0.05 (using Benjamini-Hochberg FDR)) |
 |
| Top |
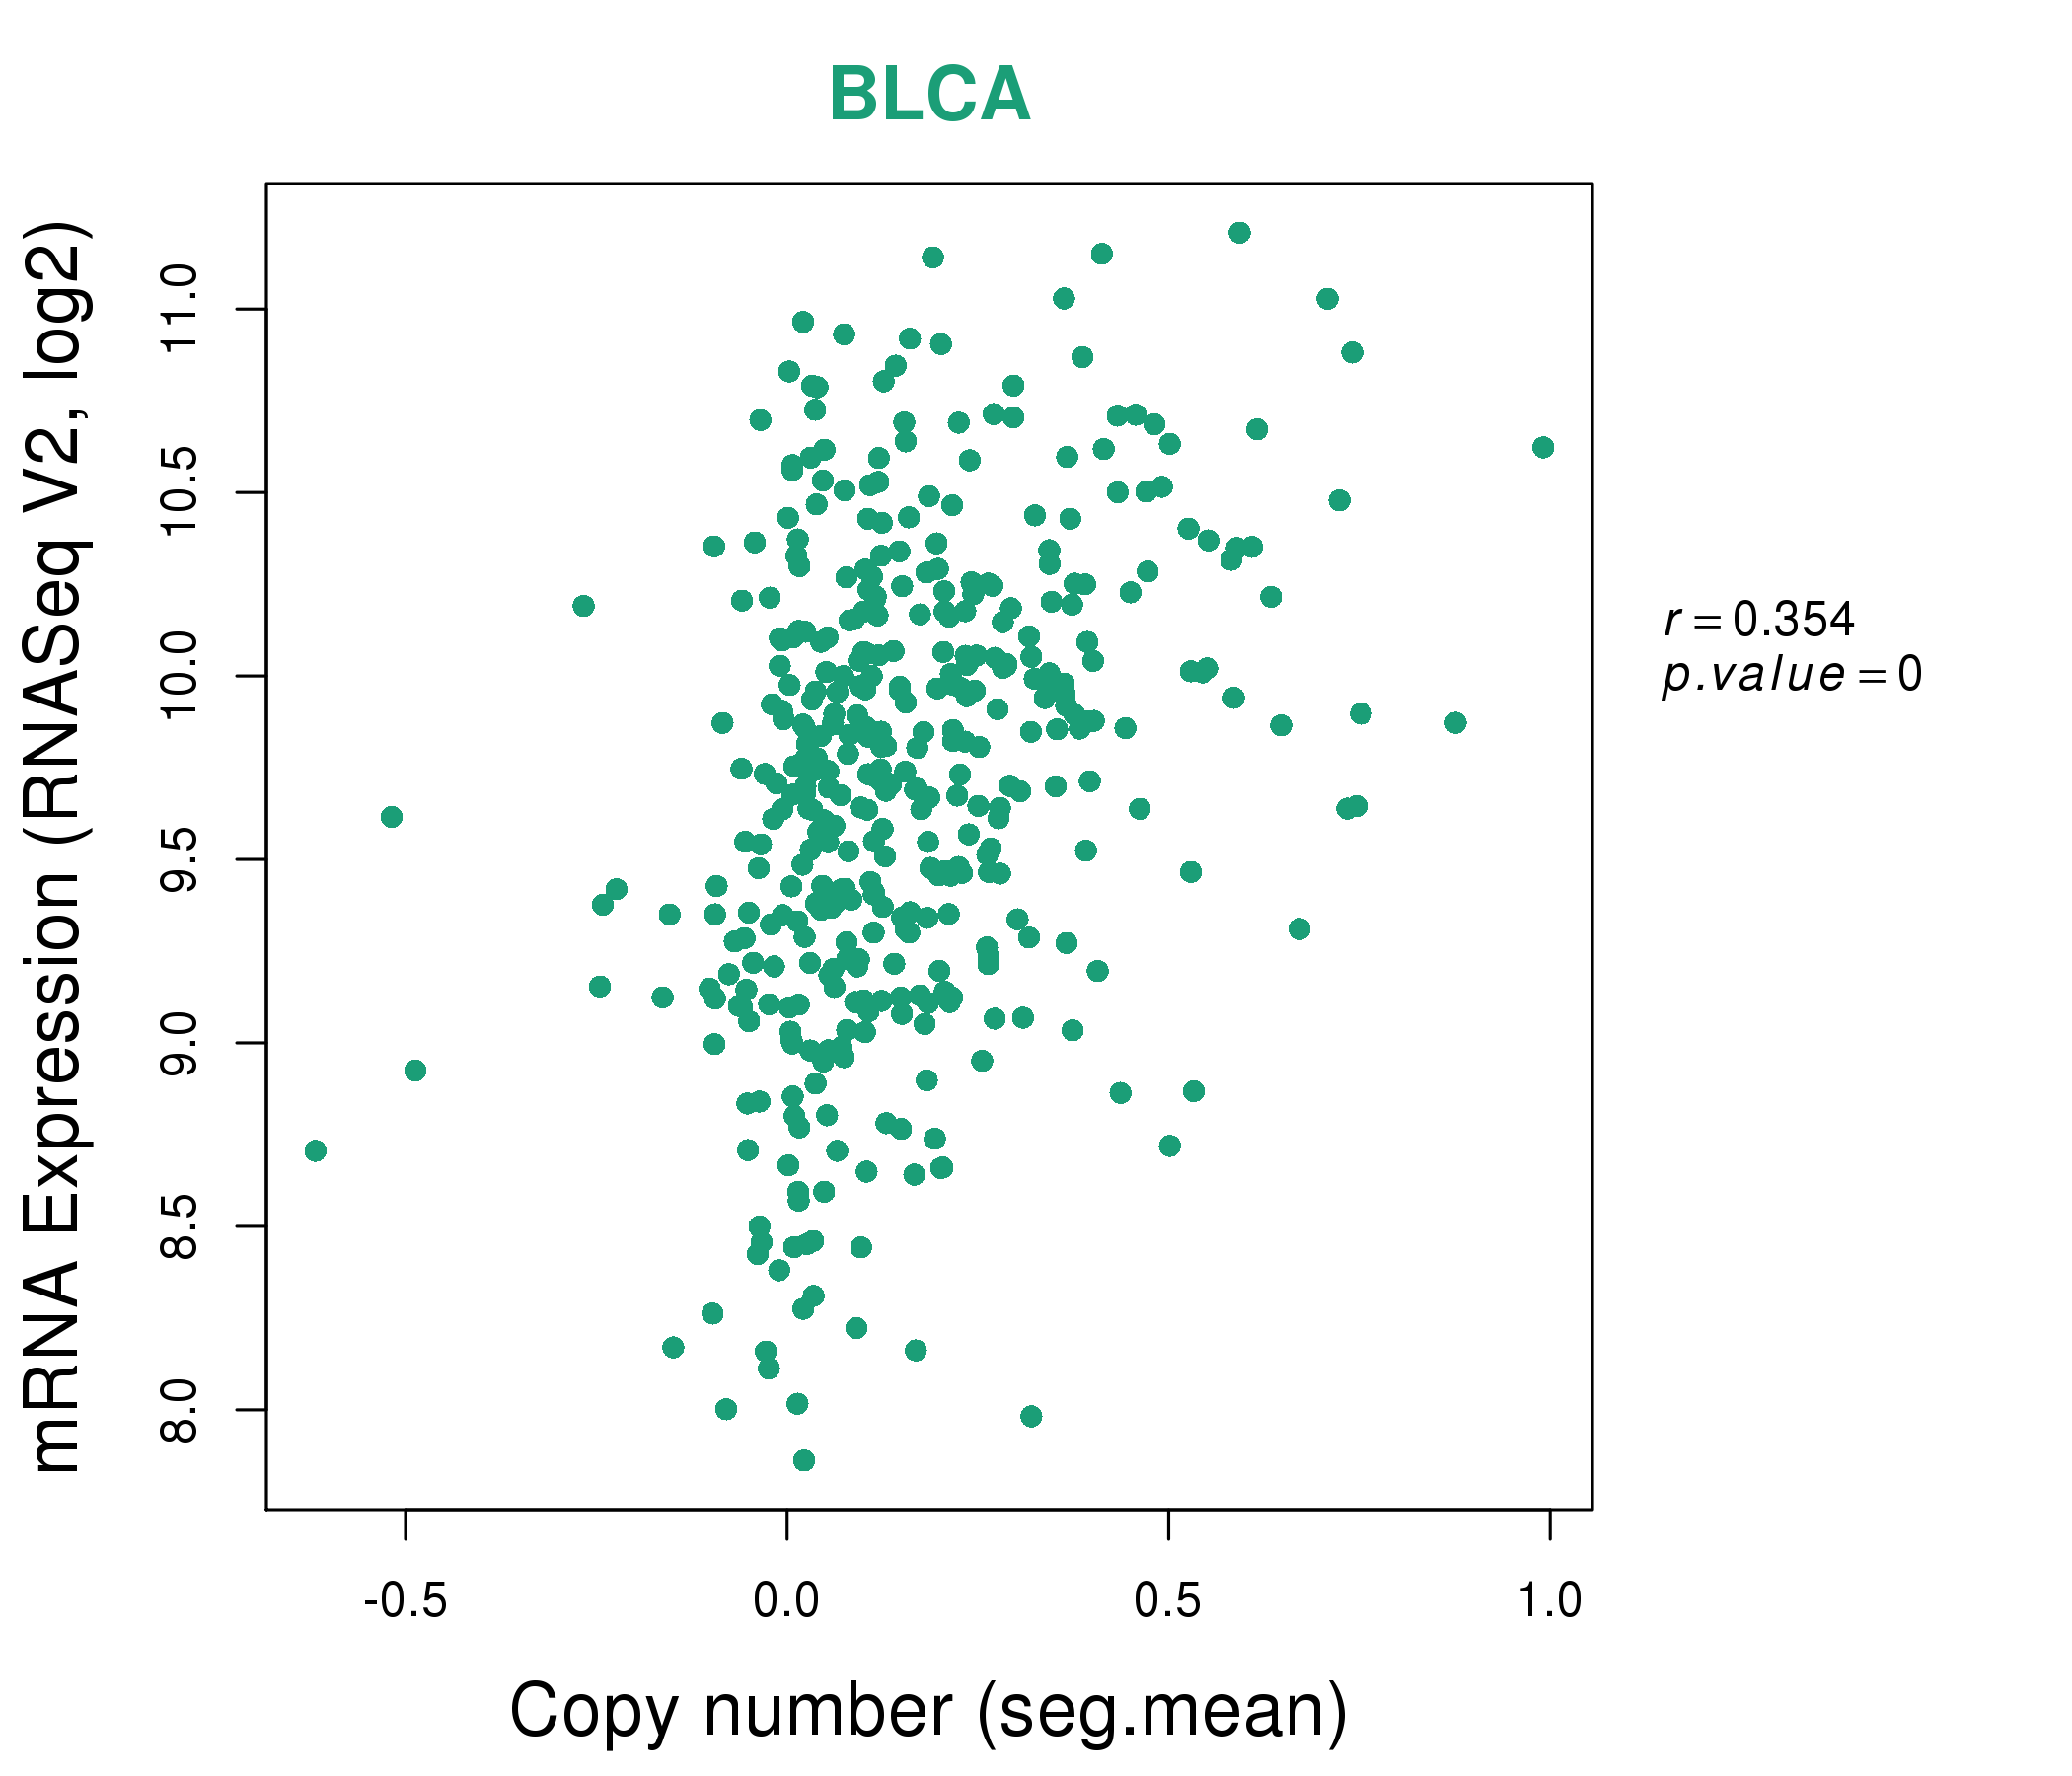
| * This plots show the correlation between CNV and gene expression. |
: Open all plots for all cancer types
 |
|
 |
|

| Top |
| Gene-Gene Network Information |
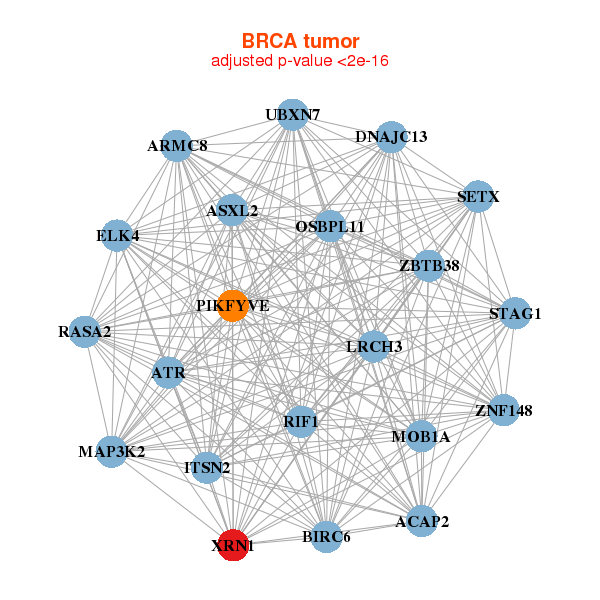
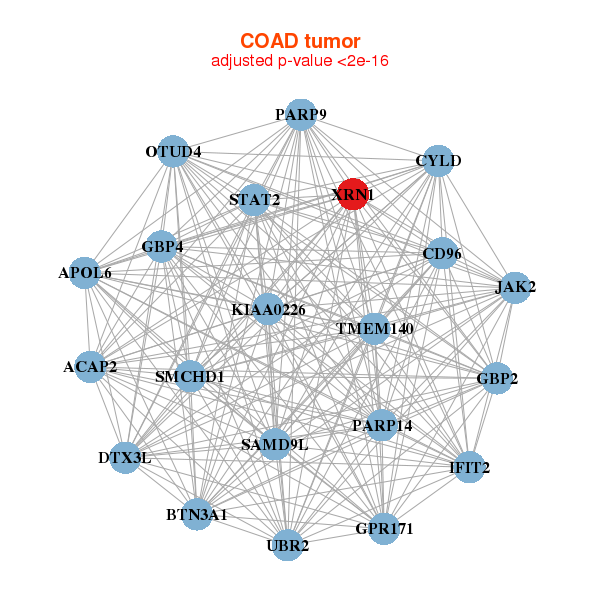
| * Co-Expression network figures were drawn using R package igraph. Only the top 20 genes with the highest correlations were shown. Red circle: input gene, orange circle: cell metabolism gene, sky circle: other gene |
: Open all plots for all cancer types
 |
|
| ACAP2,ARMC8,ASXL2,ATR,BIRC6,DNAJC13,ELK4, ITSN2,LRCH3,MAP3K2,MOB1A,OSBPL11,PIKFYVE,RASA2, RIF1,SETX,STAG1,UBXN7,XRN1,ZBTB38,ZNF148 | ANKRD12,ATG2B,ATRX,BIRC6,CHD9,DNAJB14,MED13, MON2,PHC3,PTAR1,RAB3GAP2,RICTOR,RIF1,LTN1, SCAF11,SMCHD1,SMG1,VPS13C,XRN1,ZFX,ZNF451 |
 |
|
| ACAP2,APOL6,BTN3A1,CD96,CYLD,DTX3L,GBP2, GBP4,GPR171,IFIT2,JAK2,KIAA0226,OTUD4,PARP14, PARP9,SAMD9L,SMCHD1,STAT2,TMEM140,UBR2,XRN1 | APOL6,C18orf8,CCDC68,CLIC5,DTX3L,FGD6,GCC2, HKDC1,KIF2A,MUC13,PARP14,PLEKHA7,PLS1,RNF19A, SECTM1,SEMA6D,SMCHD1,UACA,UBR2,XRN1,ZNFX1 |
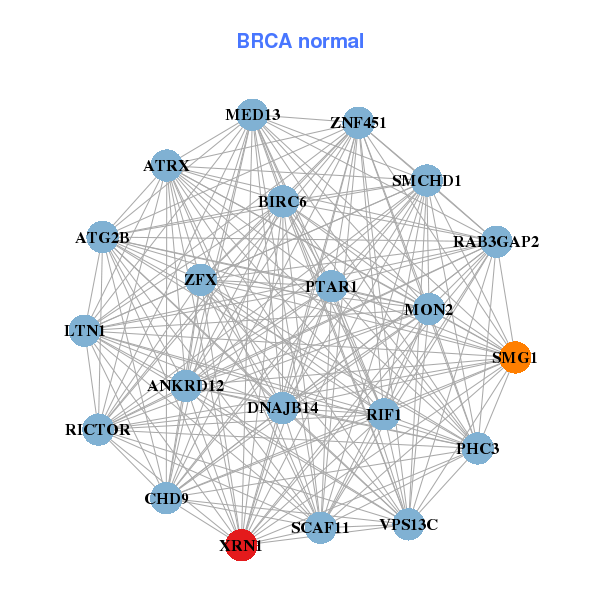
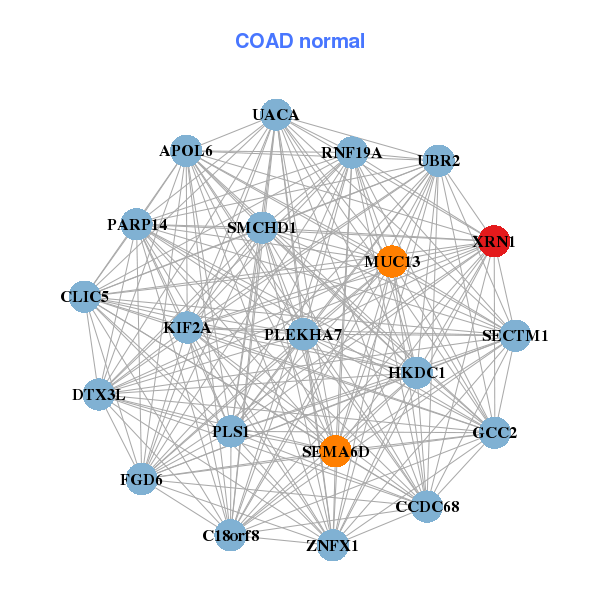
| * Co-Expression network figures were drawn using R package igraph. Only the top 20 genes with the highest correlations were shown. Red circle: input gene, orange circle: cell metabolism gene, sky circle: other gene |
: Open all plots for all cancer types
| Top |
: Open all interacting genes' information including KEGG pathway for all interacting genes from DAVID
| Top |
| Pharmacological Information for XRN1 |
| There's no related Drug. |
| Top |
| Cross referenced IDs for XRN1 |
| * We obtained these cross-references from Uniprot database. It covers 150 different DBs, 18 categories. http://www.uniprot.org/help/cross_references_section |
: Open all cross reference information
|
Copyright © 2016-Present - The Univsersity of Texas Health Science Center at Houston @ |