|
||||||||||||||||||||
| |
| Phenotypic Information (metabolism pathway, cancer, disease, phenome) |
| |
| |
| Gene-Gene Network Information: Co-Expression Network, Interacting Genes & KEGG |
| |
|


| Gene Summary for PSMD1 |
| Basic gene info. | Gene symbol | PSMD1 |
| Gene name | proteasome (prosome, macropain) 26S subunit, non-ATPase, 1 | |
| Synonyms | P112|Rpn2|S1 | |
| Cytomap | UCSC genome browser: 2q37.1 | |
| Genomic location | chr2 :231921577-232037540 | |
| Type of gene | protein-coding | |
| RefGenes | NM_001191037.1, NM_002807.3,NR_034059.1, | |
| Ensembl id | ENSG00000173692 | |
| Description | 26S proteasome non-ATPase regulatory subunit 126S proteasome regulatory subunit RPN226S proteasome regulatory subunit S126S proteasome subunit p112 | |
| Modification date | 20141207 | |
| dbXrefs | HGNC : HGNC | |
| Ensembl : ENSG00000173692 | ||
| HPRD : 10169 | ||
| Vega : OTTHUMG00000133223 | ||
| Protein | UniProt: Q99460 go to UniProt's Cross Reference DB Table | |
| Expression | CleanEX: HS_PSMD1 | |
| BioGPS: 5707 | ||
| Gene Expression Atlas: ENSG00000173692 | ||
| The Human Protein Atlas: ENSG00000173692 | ||
| Pathway | NCI Pathway Interaction Database: PSMD1 | |
| KEGG: PSMD1 | ||
| REACTOME: PSMD1 | ||
| ConsensusPathDB | ||
| Pathway Commons: PSMD1 | ||
| Metabolism | MetaCyc: PSMD1 | |
| HUMANCyc: PSMD1 | ||
| Regulation | Ensembl's Regulation: ENSG00000173692 | |
| miRBase: chr2 :231,921,577-232,037,540 | ||
| TargetScan: NM_001191037 | ||
| cisRED: ENSG00000173692 | ||
| Context | iHOP: PSMD1 | |
| cancer metabolism search in PubMed: PSMD1 | ||
| UCL Cancer Institute: PSMD1 | ||
| Assigned class in ccmGDB | B - This gene belongs to cancer gene. | |
| Top |
| Phenotypic Information for PSMD1(metabolism pathway, cancer, disease, phenome) |
| Cancer | CGAP: PSMD1 |
| Familial Cancer Database: PSMD1 | |
| * This gene is included in those cancer gene databases. |
|
|
|
|
|
| . | ||||||||||||||
Oncogene 1 | Significant driver gene in | |||||||||||||||||||
| cf) number; DB name 1 Oncogene; http://nar.oxfordjournals.org/content/35/suppl_1/D721.long, 2 Tumor Suppressor gene; https://bioinfo.uth.edu/TSGene/, 3 Cancer Gene Census; http://www.nature.com/nrc/journal/v4/n3/abs/nrc1299.html, 4 CancerGenes; http://nar.oxfordjournals.org/content/35/suppl_1/D721.long, 5 Network of Cancer Gene; http://ncg.kcl.ac.uk/index.php, 1Therapeutic Vulnerabilities in Cancer; http://cbio.mskcc.org/cancergenomics/statius/ |
| REACTOME_METABOLISM_OF_AMINO_ACIDS_AND_DERIVATIVES REACTOME_METABOLISM_OF_MRNA REACTOME_METABOLISM_OF_RNA | |
| OMIM | |
| Orphanet | |
| Disease | KEGG Disease: PSMD1 |
| MedGen: PSMD1 (Human Medical Genetics with Condition) | |
| ClinVar: PSMD1 | |
| Phenotype | MGI: PSMD1 (International Mouse Phenotyping Consortium) |
| PhenomicDB: PSMD1 | |
| Mutations for PSMD1 |
| * Under tables are showing count per each tissue to give us broad intuition about tissue specific mutation patterns.You can go to the detailed page for each mutation database's web site. |
| - Statistics for Tissue and Mutation type | Top |
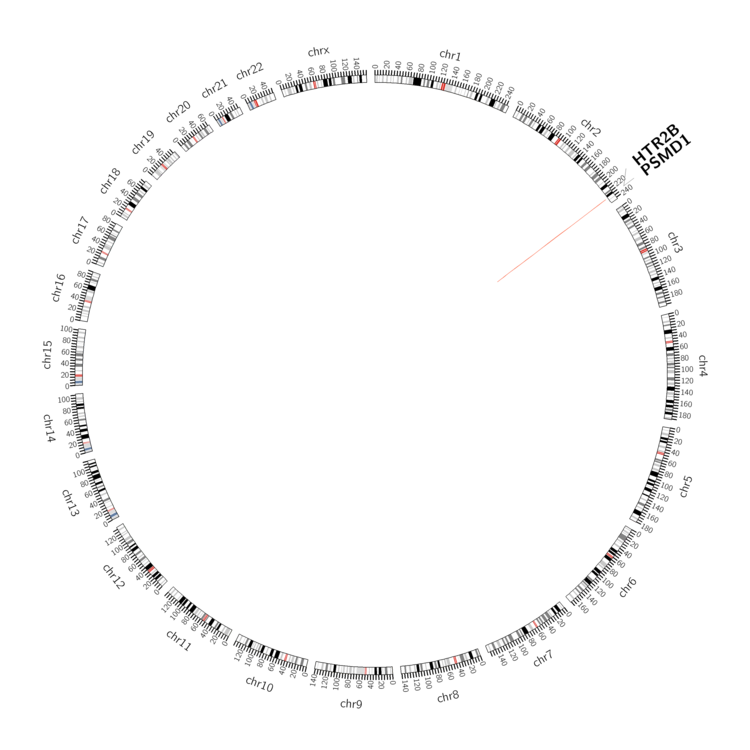 |
| - For Inter-chromosomal Variations |
| There's no inter-chromosomal structural variation. |
| - For Intra-chromosomal Variations |
| * Intra-chromosomal variantions includes 'intrachromosomal amplicon to amplicon', 'intrachromosomal amplicon to non-amplified dna', 'intrachromosomal deletion', 'intrachromosomal fold-back inversion', 'intrachromosomal inversion', 'intrachromosomal tandem duplication', 'Intrachromosomal unknown type', 'intrachromosomal with inverted orientation', 'intrachromosomal with non-inverted orientation'. |
 |
| Sample | Symbol_a | Chr_a | Start_a | End_a | Symbol_b | Chr_b | Start_b | End_b |
| ovary | PSMD1 | chr2 | 231931976 | 231931996 | PSMD1 | chr2 | 231953437 | 231953457 |
| ovary | PSMD1 | chr2 | 232030759 | 232030779 | HTR2B | chr2 | 231973346 | 231973366 |
| pancreas | PSMD1 | chr2 | 231923765 | 231923785 | PSMD1 | chr2 | 231923823 | 231923843 |
| cf) Tissue number; Tissue name (1;Breast, 2;Central_nervous_system, 3;Haematopoietic_and_lymphoid_tissue, 4;Large_intestine, 5;Liver, 6;Lung, 7;Ovary, 8;Pancreas, 9;Prostate, 10;Skin, 11;Soft_tissue, 12;Upper_aerodigestive_tract) |
| * From mRNA Sanger sequences, Chitars2.0 arranged chimeric transcripts. This table shows PSMD1 related fusion information. |
| ID | Head Gene | Tail Gene | Accession | Gene_a | qStart_a | qEnd_a | Chromosome_a | tStart_a | tEnd_a | Gene_a | qStart_a | qEnd_a | Chromosome_a | tStart_a | tEnd_a |
| BE769099 | TRIM26 | 20 | 297 | 6 | 1445216 | 1445492 | PSMD1 | 290 | 384 | 2 | 232035509 | 232035604 | |
| DA454373 | PSMD1 | 1 | 322 | 2 | 232029976 | 232035428 | PSMD1 | 319 | 572 | 2 | 231927240 | 231931723 | |
| BU730843 | ATP2B3 | 18 | 272 | X | 152835166 | 152835420 | PSMD1 | 270 | 755 | 2 | 232030589 | 232037436 | |
| Top |
| There's no copy number variation information in COSMIC data for this gene. |
| Top |
|
 |
| Top |
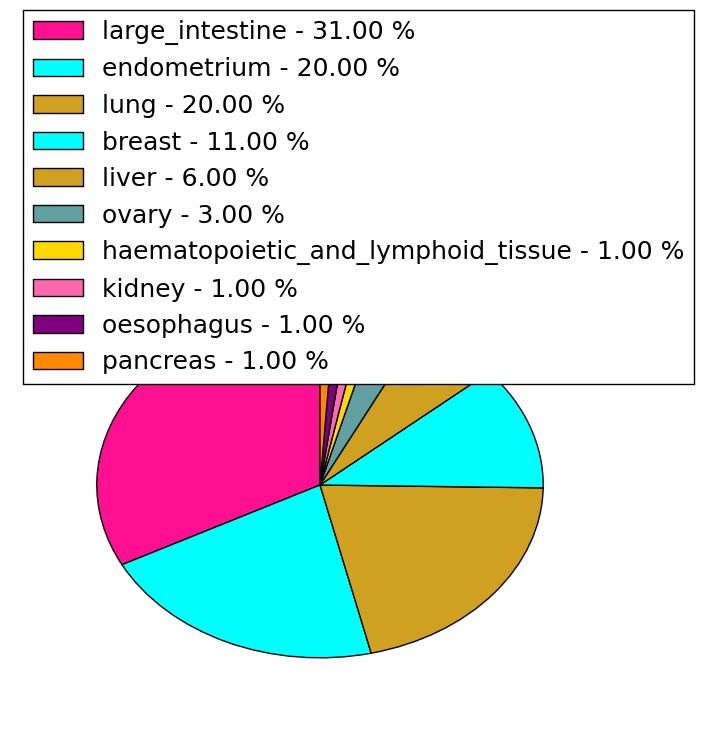
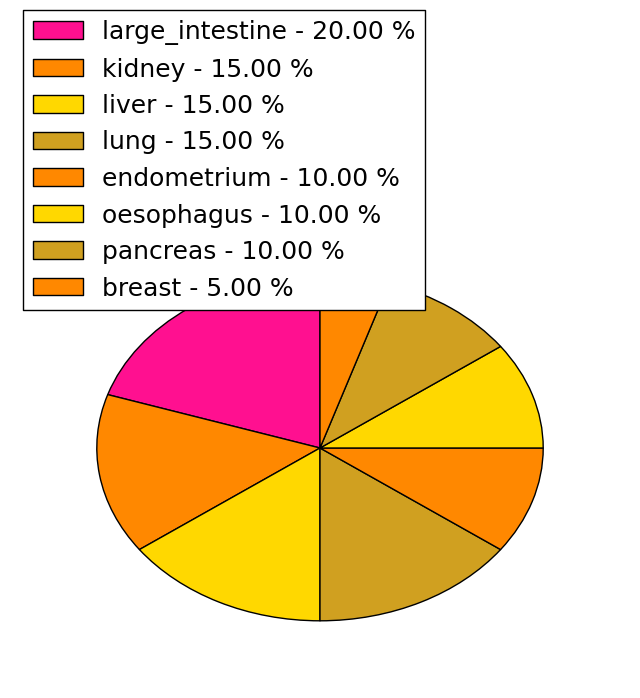
| Stat. for Non-Synonymous SNVs (# total SNVs=60) | (# total SNVs=20) |
 |  |
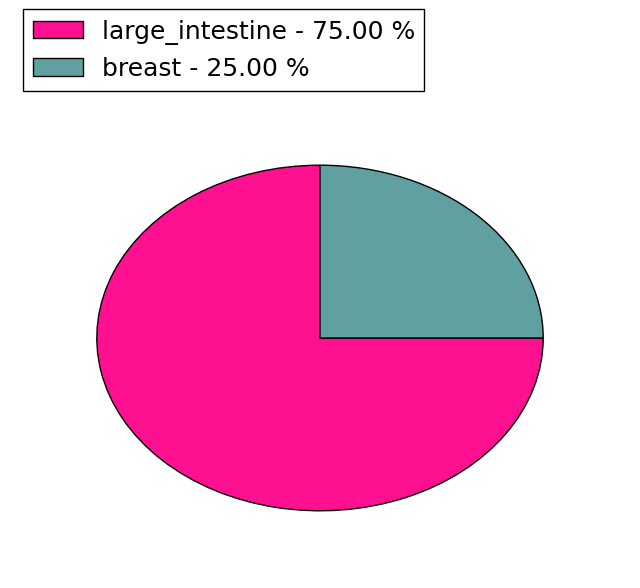
(# total SNVs=4) | (# total SNVs=3) |
 |  |
| Top |
| * When you move the cursor on each content, you can see more deailed mutation information on the Tooltip. Those are primary_site,primary_histology,mutation(aa),pubmedID. |
| GRCh37 position | Mutation(aa) | Unique sampleID count |
| chr2:231937097-231937097 | p.N283N | 2 |
| chr2:232035319-232035319 | p.E919K | 2 |
| chr2:232035369-232035369 | p.I935I | 2 |
| chr2:231934886-231934886 | p.? | 2 |
| chr2:231944984-231944984 | p.I457V | 2 |
| chr2:231948391-231948391 | p.R546C | 2 |
| chr2:231937121-231937121 | p.E291D | 2 |
| chr2:231943447-231943447 | p.S382S | 2 |
| chr2:231927025-231927025 | p.V42I | 2 |
| chr2:231949808-231949808 | p.R600* | 2 |
| Top |
|
 |
| Point Mutation/ Tissue ID | 1 | 2 | 3 | 4 | 5 | 6 | 7 | 8 | 9 | 10 | 11 | 12 | 13 | 14 | 15 | 16 | 17 | 18 | 19 | 20 |
| # sample | 2 | 3 | 13 | 2 | 4 | 3 | 6 | 1 | 6 | 4 | 8 | |||||||||
| # mutation | 2 | 3 | 17 | 2 | 4 | 3 | 6 | 1 | 8 | 4 | 11 | |||||||||
| nonsynonymous SNV | 2 | 3 | 13 | 1 | 1 | 3 | 4 | 1 | 5 | 4 | 9 | |||||||||
| synonymous SNV | 4 | 1 | 3 | 2 | 3 | 2 |
| cf) Tissue ID; Tissue type (1; BLCA[Bladder Urothelial Carcinoma], 2; BRCA[Breast invasive carcinoma], 3; CESC[Cervical squamous cell carcinoma and endocervical adenocarcinoma], 4; COAD[Colon adenocarcinoma], 5; GBM[Glioblastoma multiforme], 6; Glioma Low Grade, 7; HNSC[Head and Neck squamous cell carcinoma], 8; KICH[Kidney Chromophobe], 9; KIRC[Kidney renal clear cell carcinoma], 10; KIRP[Kidney renal papillary cell carcinoma], 11; LAML[Acute Myeloid Leukemia], 12; LUAD[Lung adenocarcinoma], 13; LUSC[Lung squamous cell carcinoma], 14; OV[Ovarian serous cystadenocarcinoma ], 15; PAAD[Pancreatic adenocarcinoma], 16; PRAD[Prostate adenocarcinoma], 17; SKCM[Skin Cutaneous Melanoma], 18:STAD[Stomach adenocarcinoma], 19:THCA[Thyroid carcinoma], 20:UCEC[Uterine Corpus Endometrial Carcinoma]) |
| Top |
| * We represented just top 10 SNVs. When you move the cursor on each content, you can see more deailed mutation information on the Tooltip. Those are primary_site, primary_histology, mutation(aa), pubmedID. |
| Genomic Position | Mutation(aa) | Unique sampleID count |
| chr2:232035369 | p.R546C,PSMD1 | 2 |
| chr2:231948391 | p.I904I,PSMD1 | 2 |
| chr2:231937110 | p.L242L,PSMD1 | 1 |
| chr2:232030645 | p.G476S,PSMD1 | 1 |
| chr2:231926996 | p.G729G,PSMD1 | 1 |
| chr2:231944878 | p.V42I,PSMD1 | 1 |
| chr2:231934768 | p.V47I,PSMD1 | 1 |
| chr2:231949777 | p.S263S,PSMD1 | 1 |
| chr2:231937111 | p.D495N,PSMD1 | 1 |
| chr2:232035293 | p.V761F,PSMD1 | 1 |
| * Copy number data were extracted from TCGA using R package TCGA-Assembler. The URLs of all public data files on TCGA DCC data server were gathered on Jan-05-2015. Function ProcessCNAData in TCGA-Assembler package was used to obtain gene-level copy number value which is calculated as the average copy number of the genomic region of a gene. |
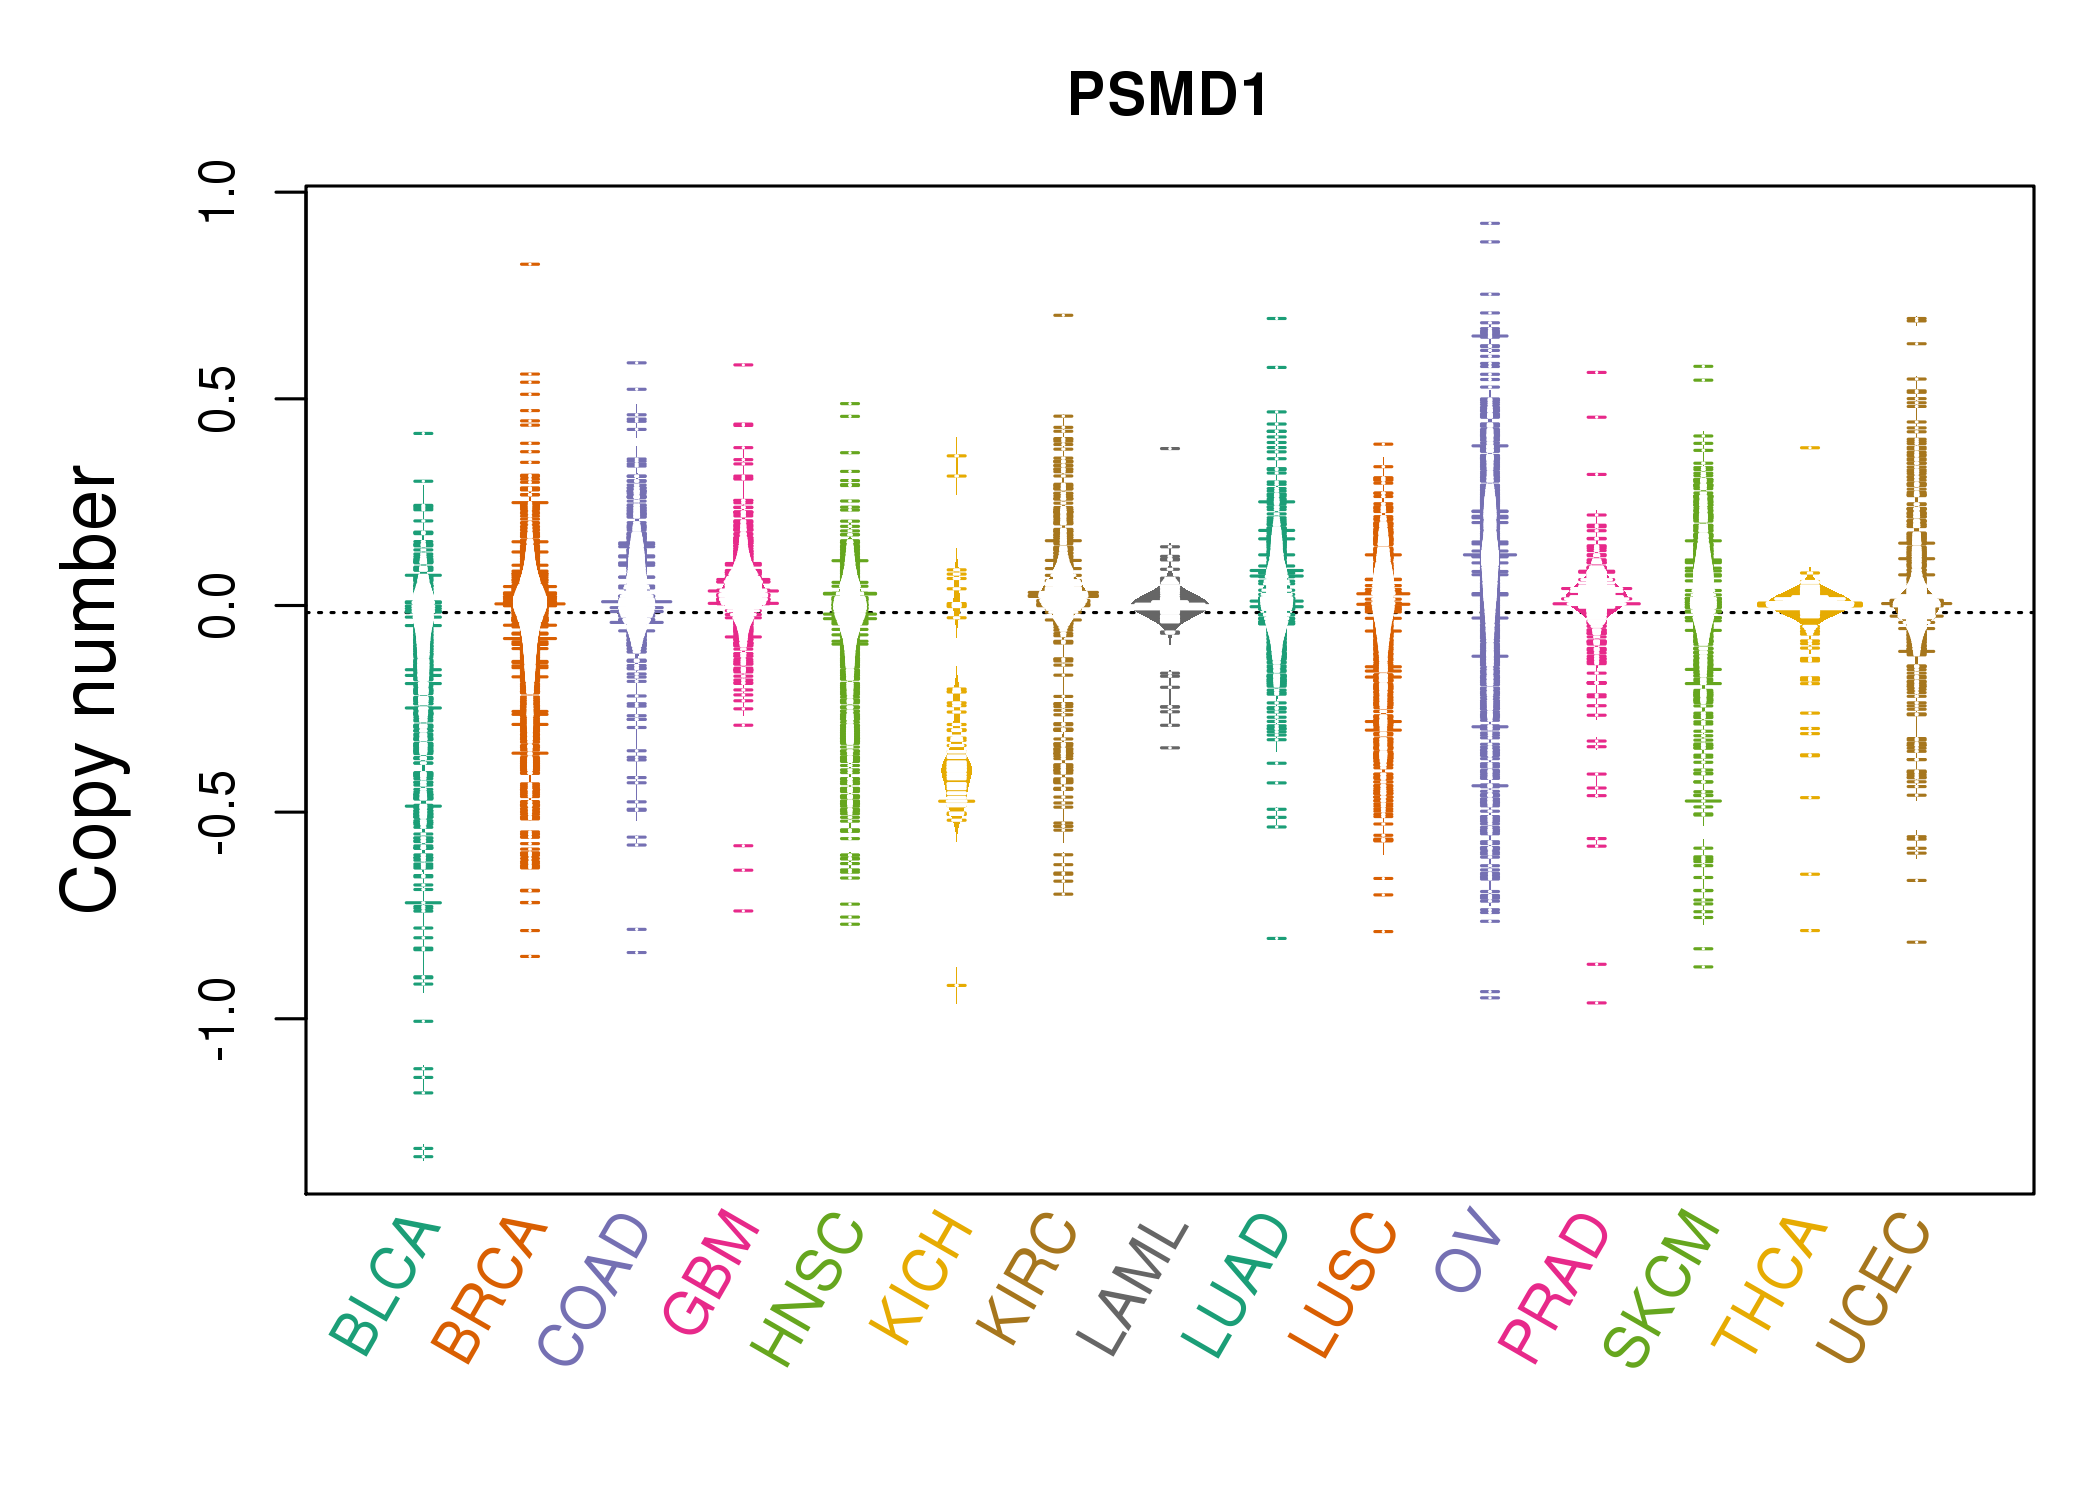 |
| cf) Tissue ID[Tissue type]: BLCA[Bladder Urothelial Carcinoma], BRCA[Breast invasive carcinoma], CESC[Cervical squamous cell carcinoma and endocervical adenocarcinoma], COAD[Colon adenocarcinoma], GBM[Glioblastoma multiforme], Glioma Low Grade, HNSC[Head and Neck squamous cell carcinoma], KICH[Kidney Chromophobe], KIRC[Kidney renal clear cell carcinoma], KIRP[Kidney renal papillary cell carcinoma], LAML[Acute Myeloid Leukemia], LUAD[Lung adenocarcinoma], LUSC[Lung squamous cell carcinoma], OV[Ovarian serous cystadenocarcinoma ], PAAD[Pancreatic adenocarcinoma], PRAD[Prostate adenocarcinoma], SKCM[Skin Cutaneous Melanoma], STAD[Stomach adenocarcinoma], THCA[Thyroid carcinoma], UCEC[Uterine Corpus Endometrial Carcinoma] |
| Top |
| Gene Expression for PSMD1 |
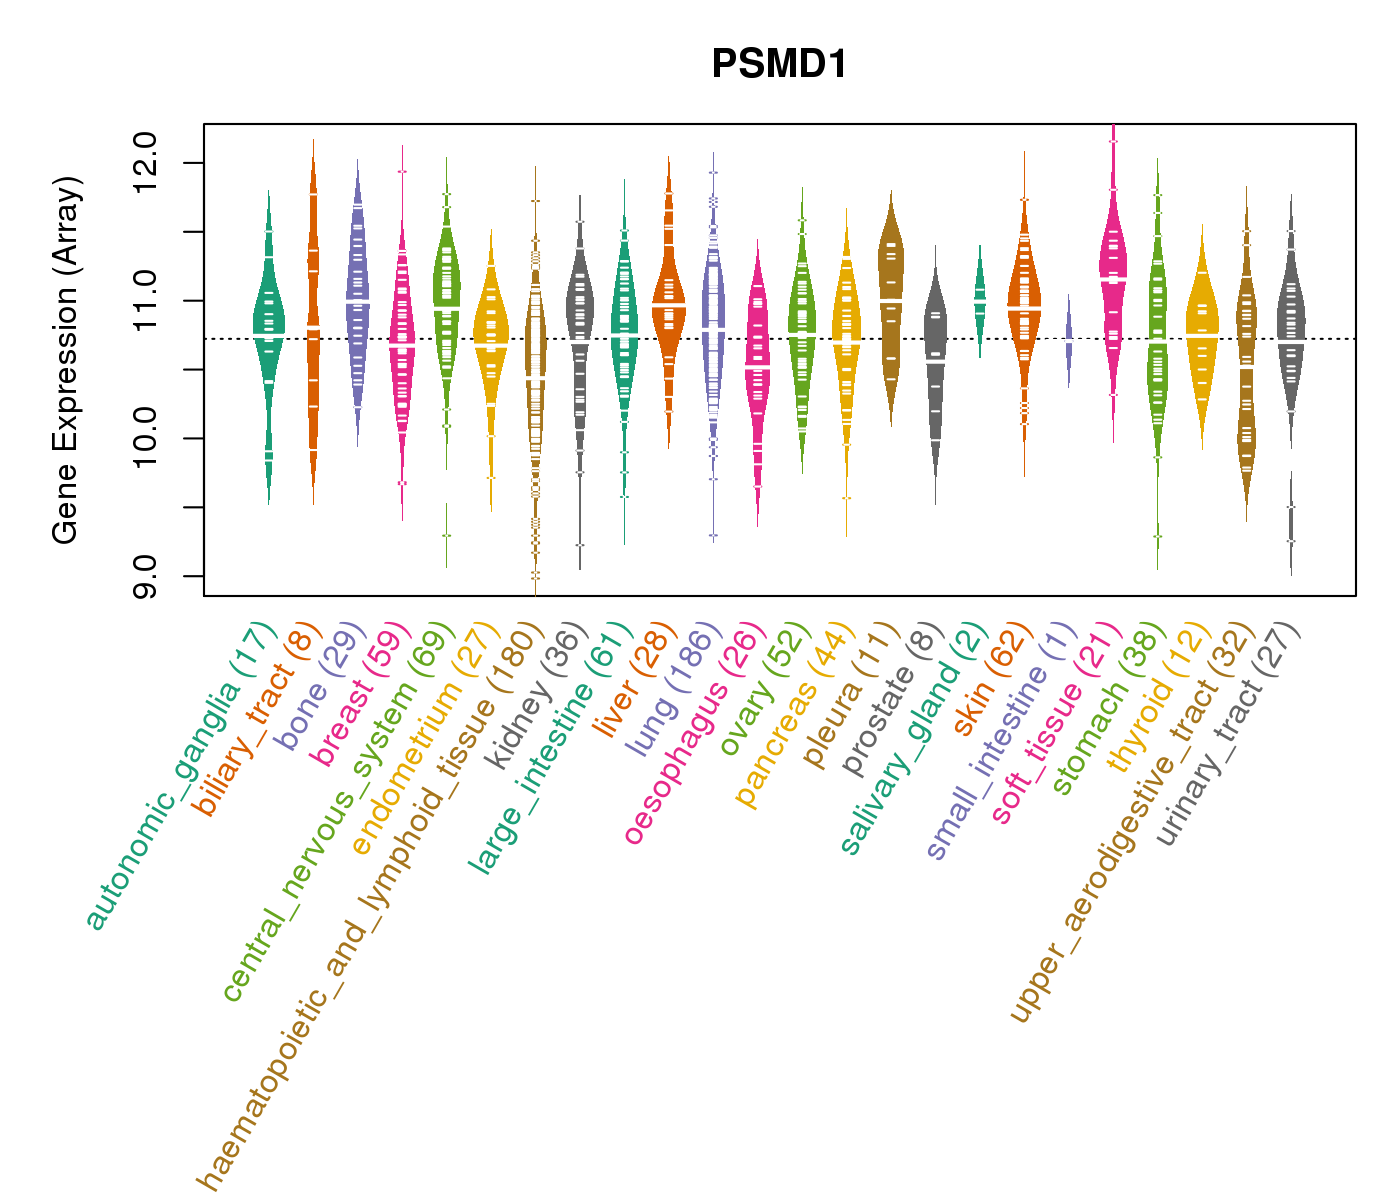
| * CCLE gene expression data were extracted from CCLE_Expression_Entrez_2012-10-18.res: Gene-centric RMA-normalized mRNA expression data. |
 |
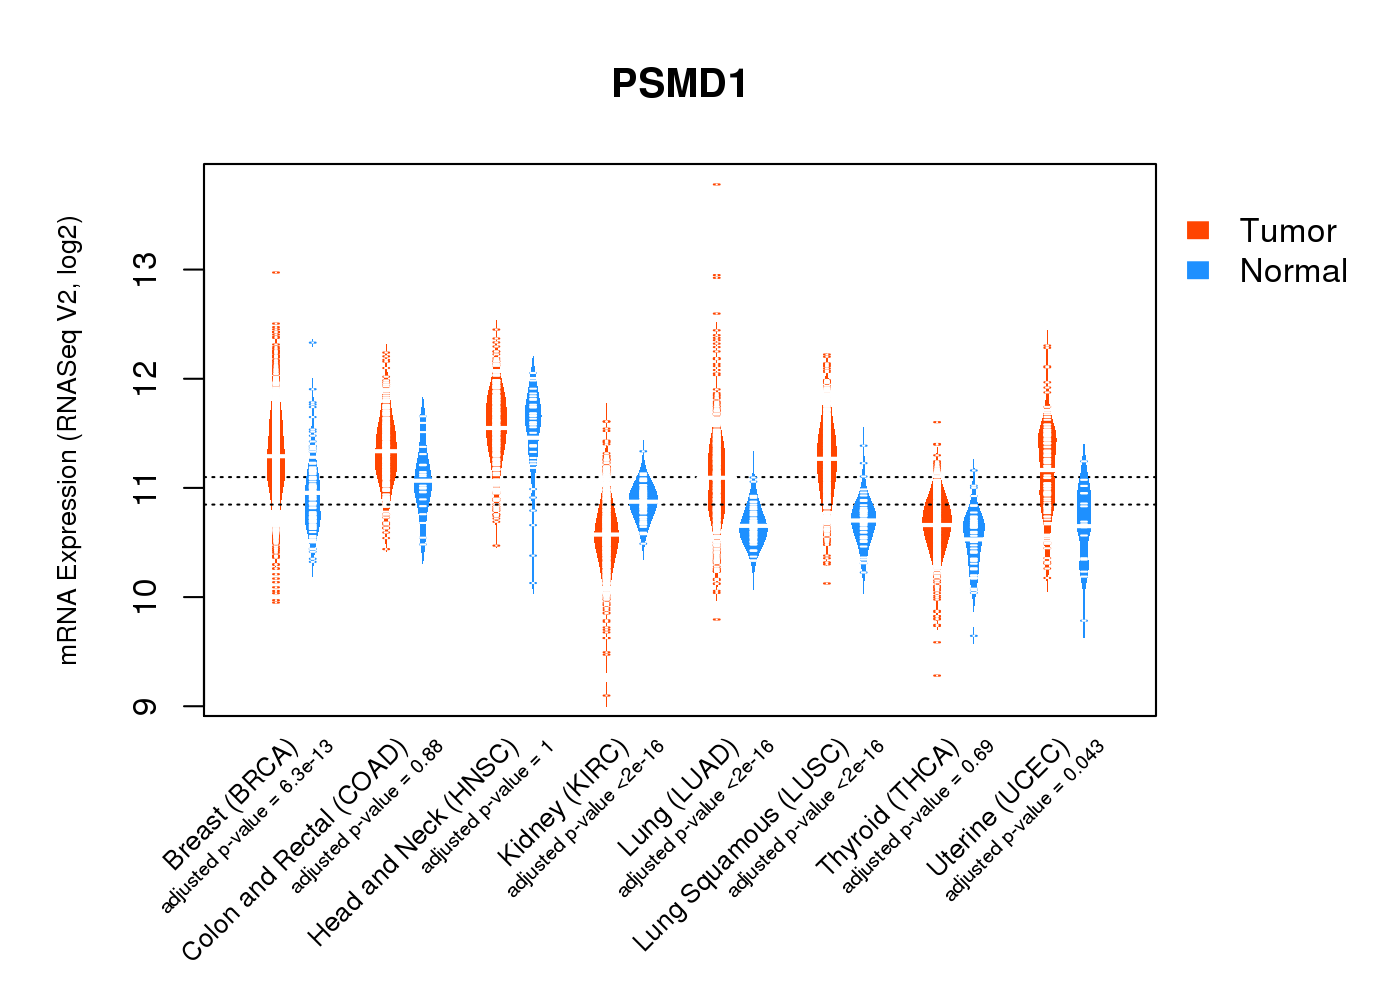
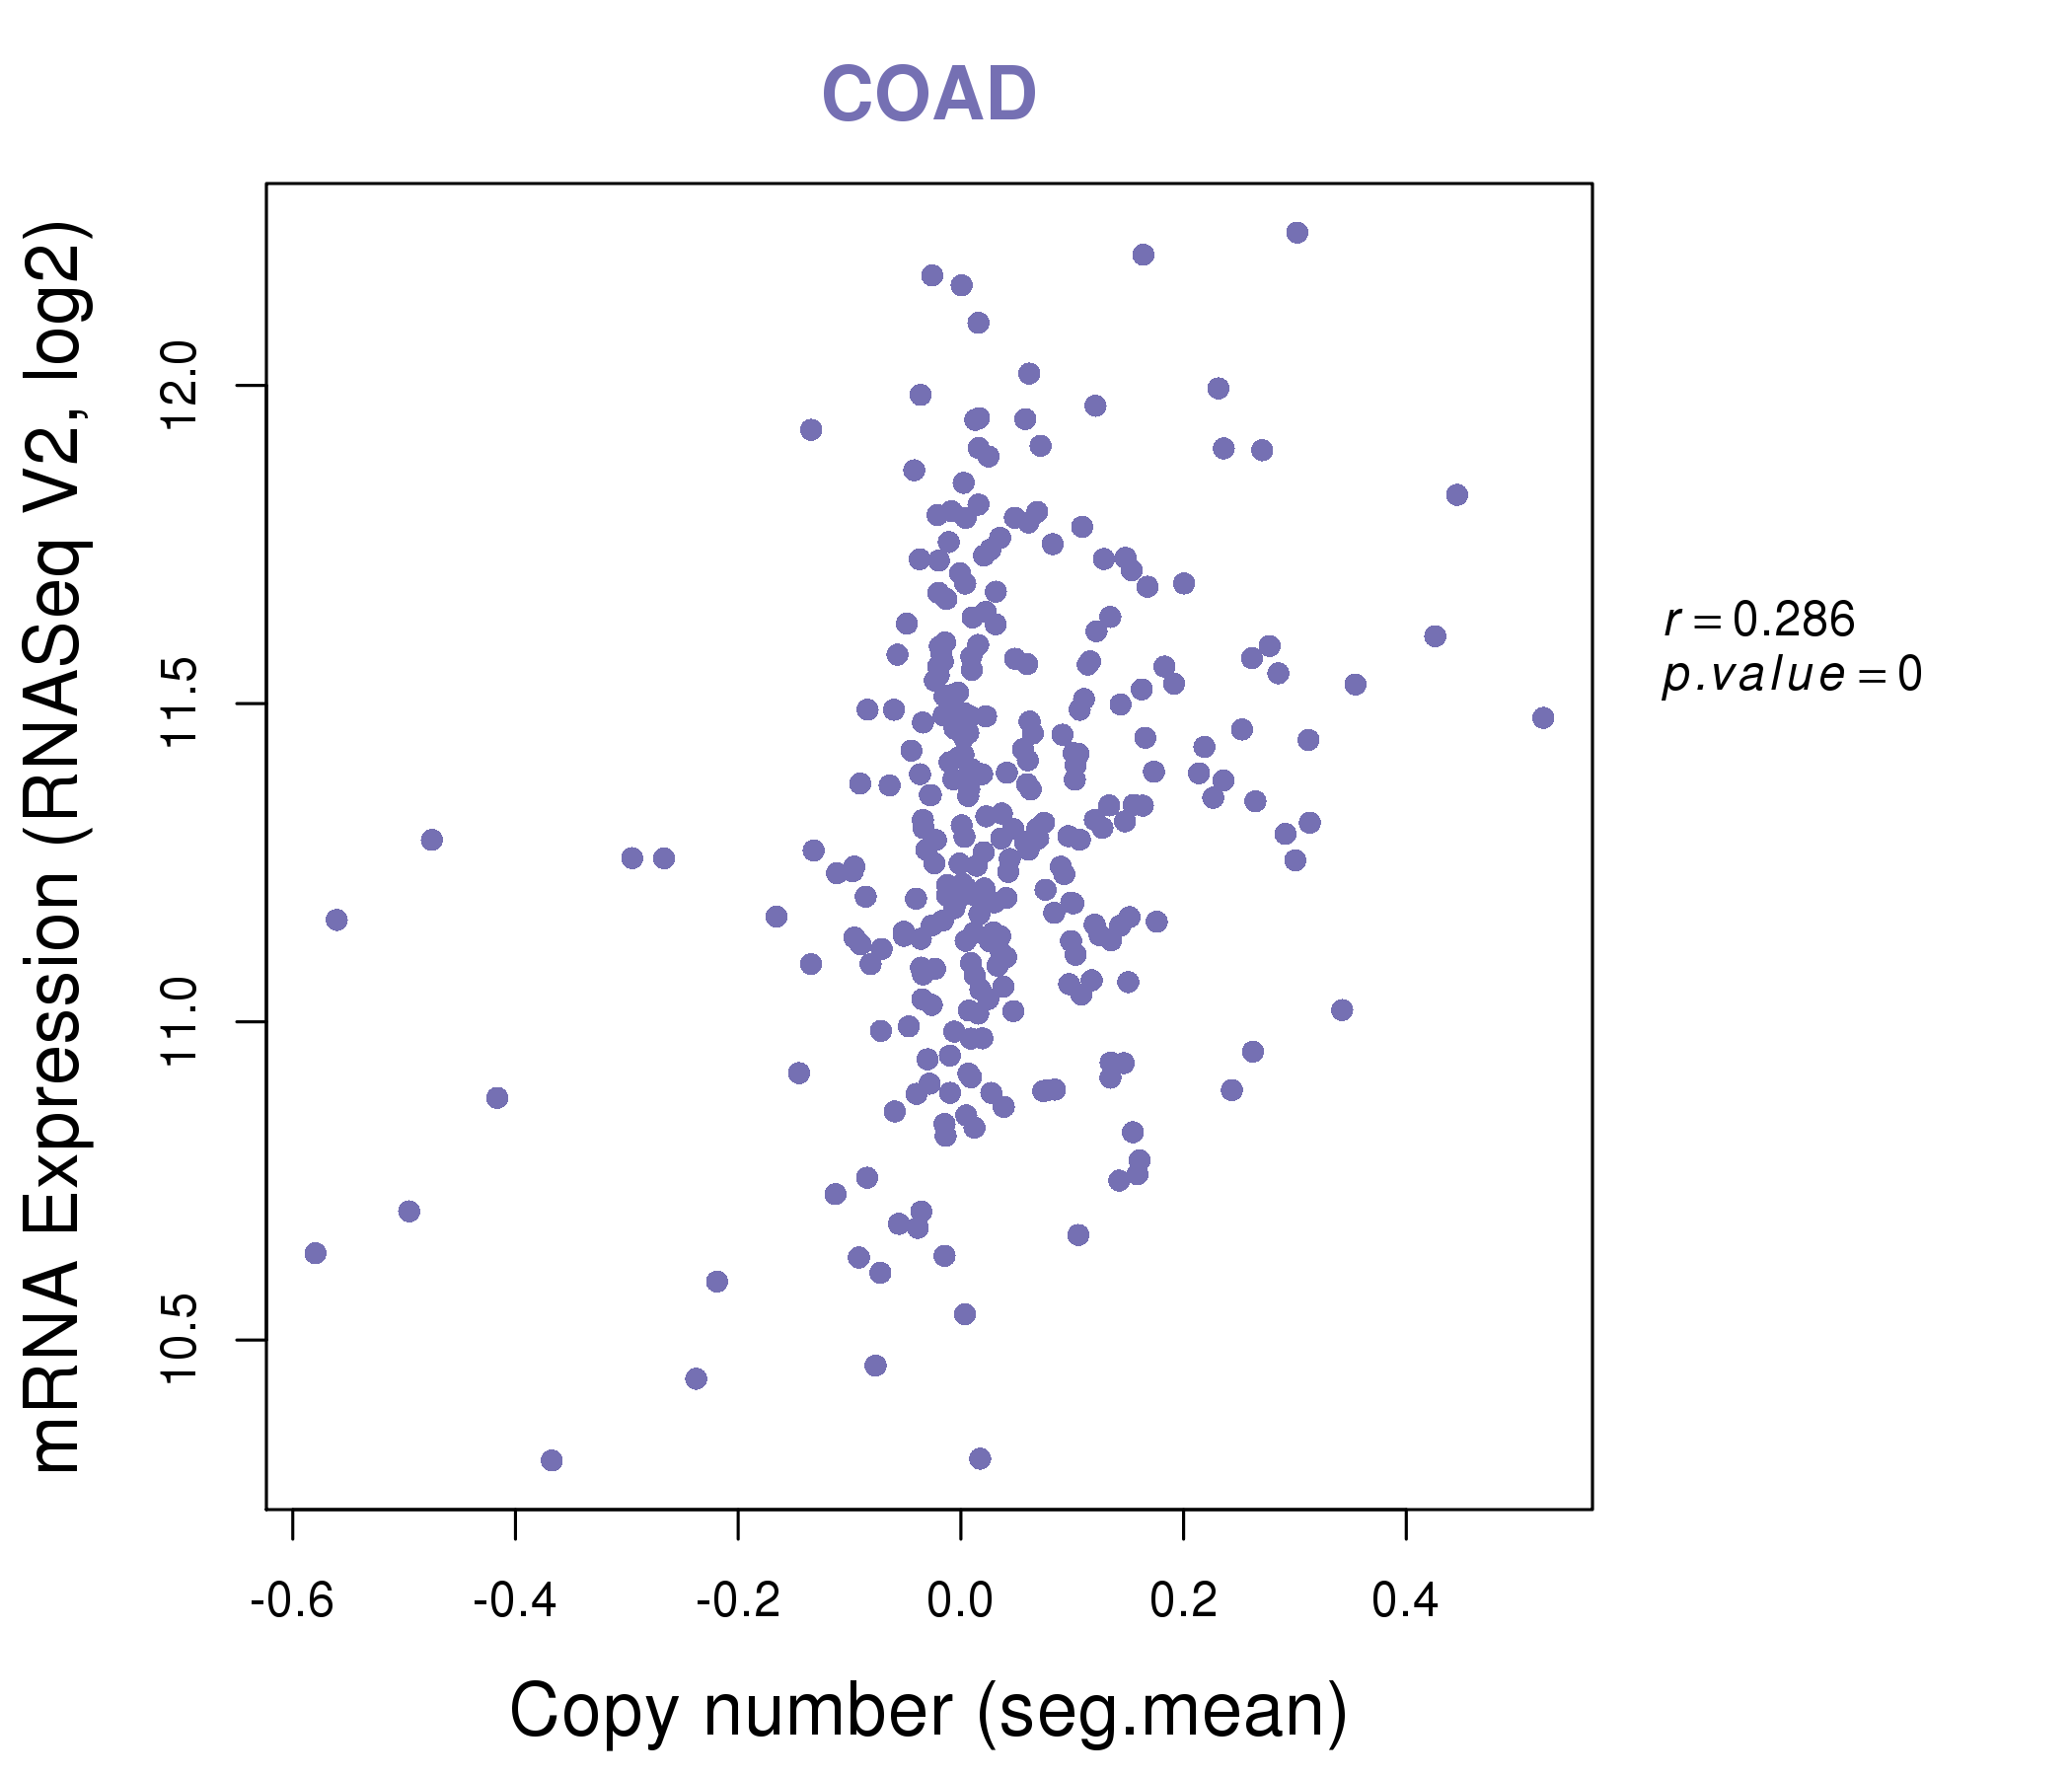
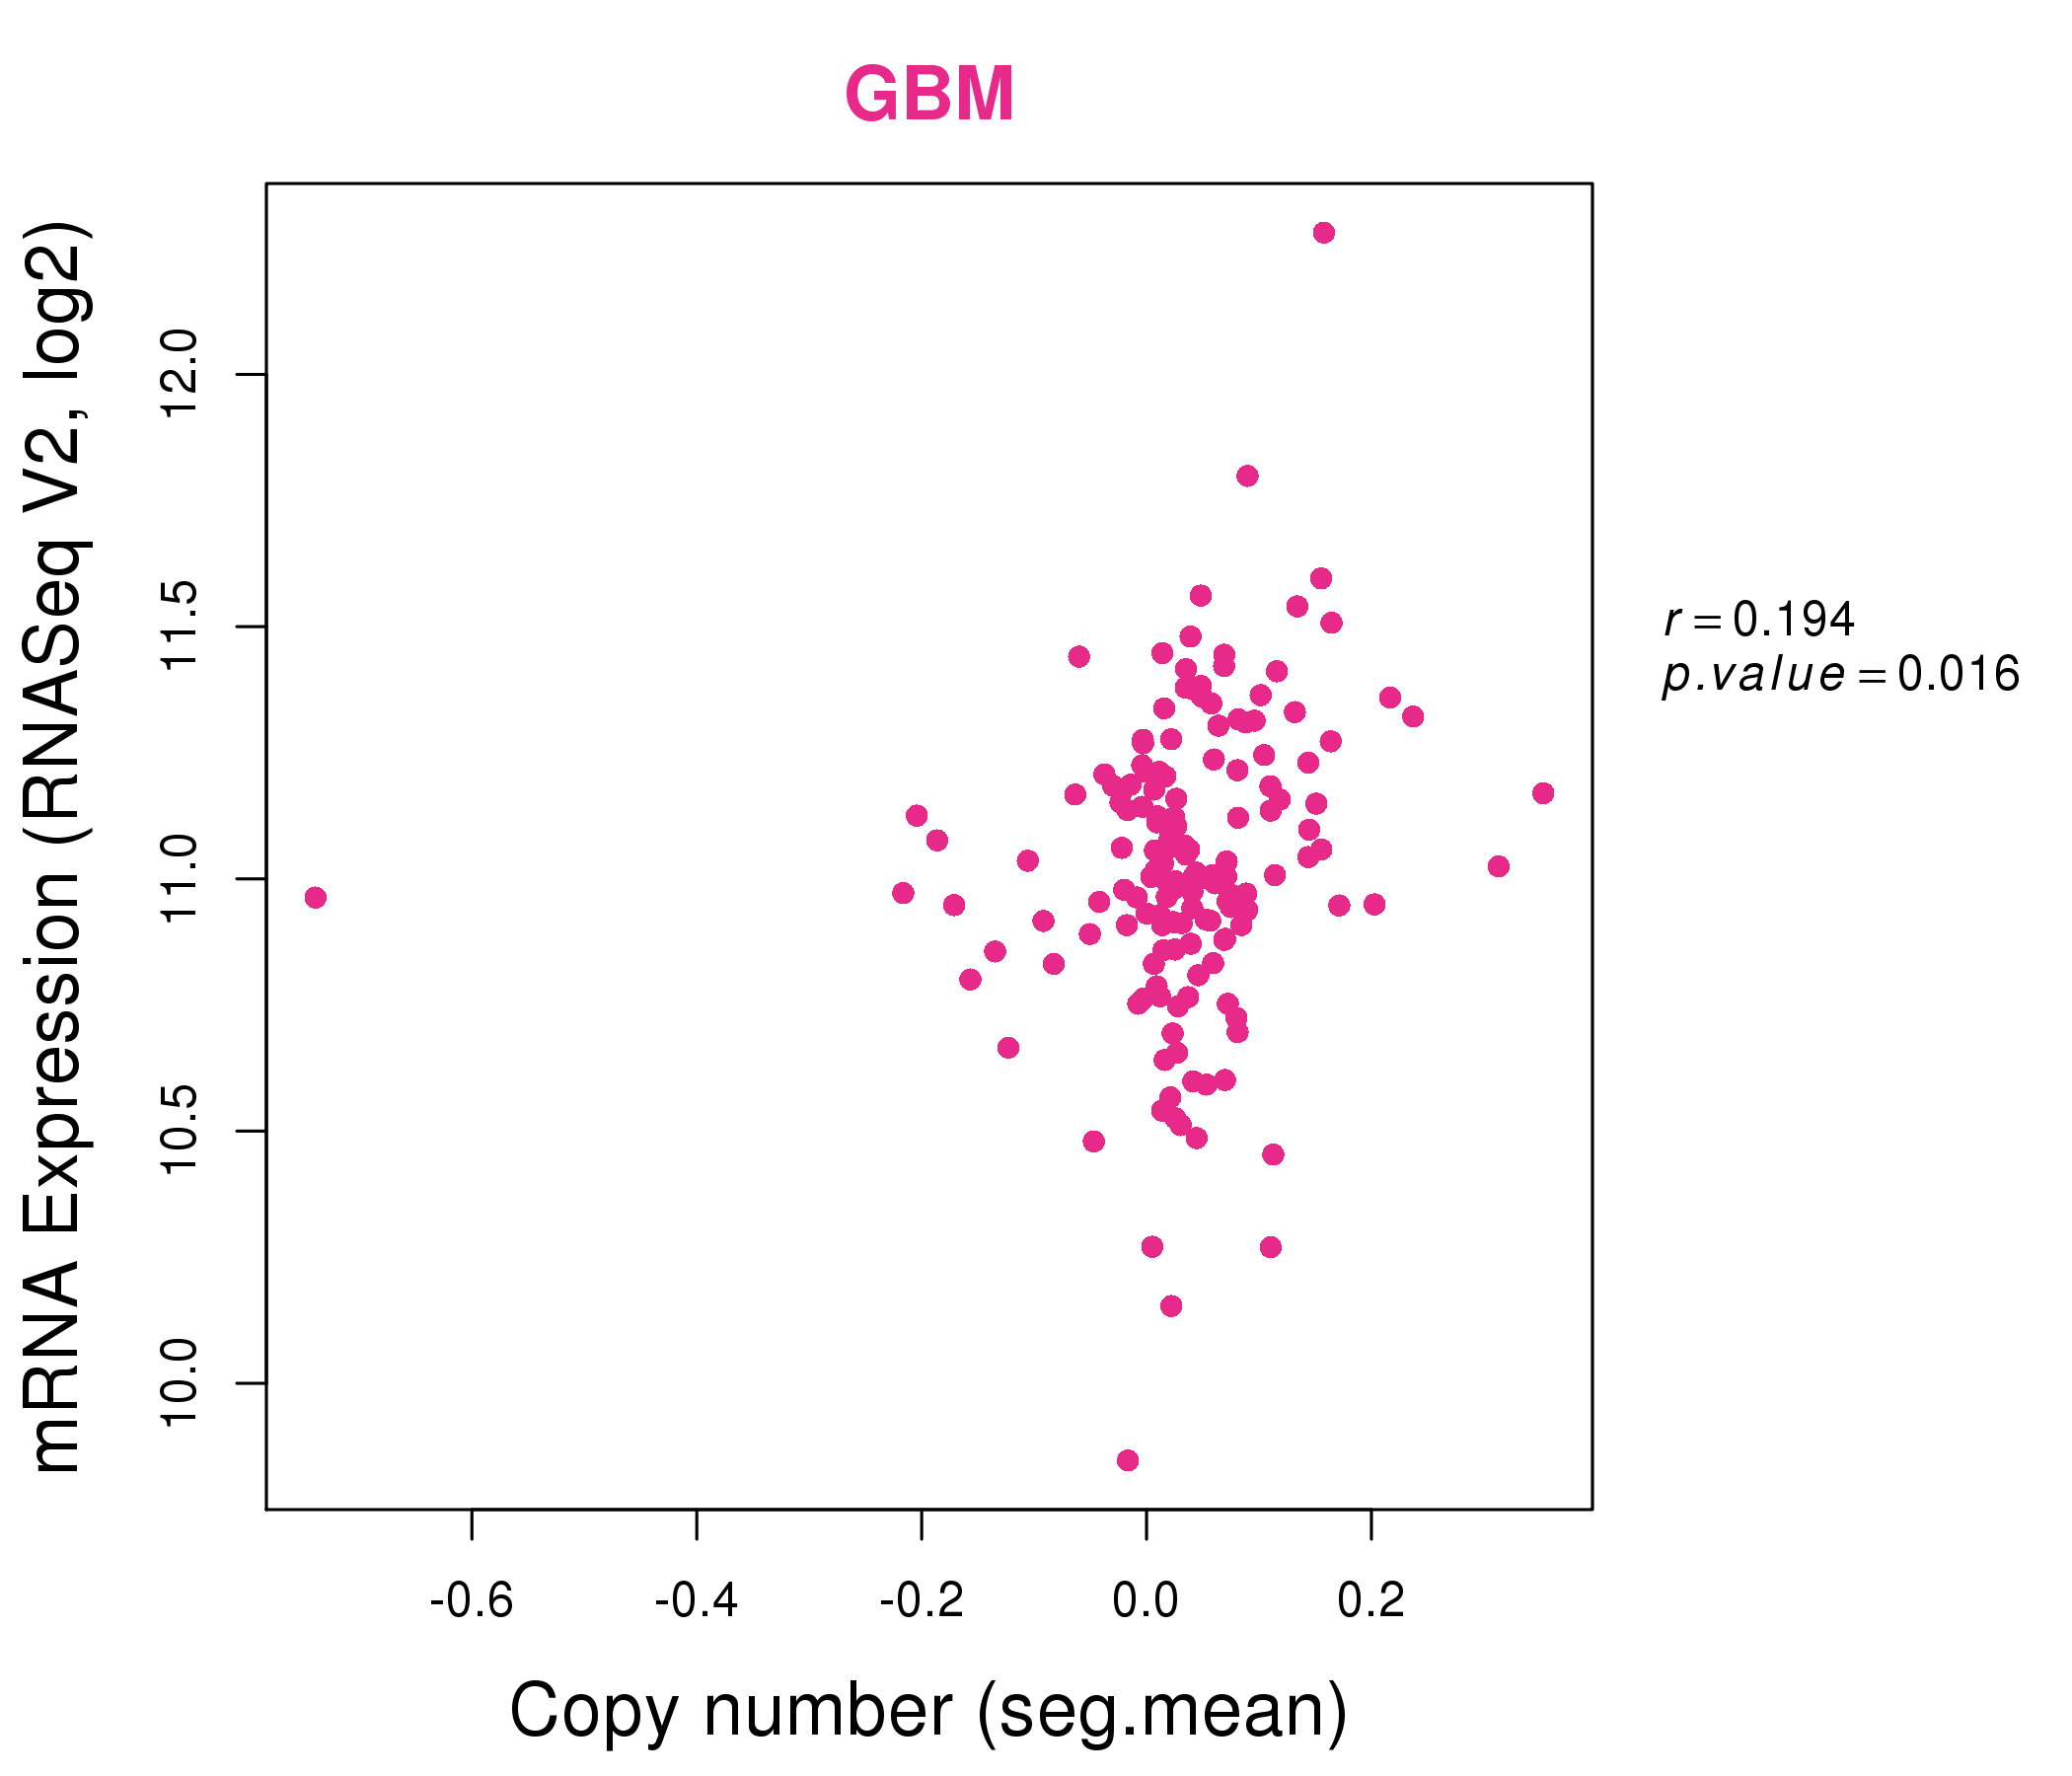
| * Normalized gene expression data of RNASeqV2 was extracted from TCGA using R package TCGA-Assembler. The URLs of all public data files on TCGA DCC data server were gathered at Jan-05-2015. Only eight cancer types have enough normal control samples for differential expression analysis. (t test, adjusted p<0.05 (using Benjamini-Hochberg FDR)) |
 |
| Top |
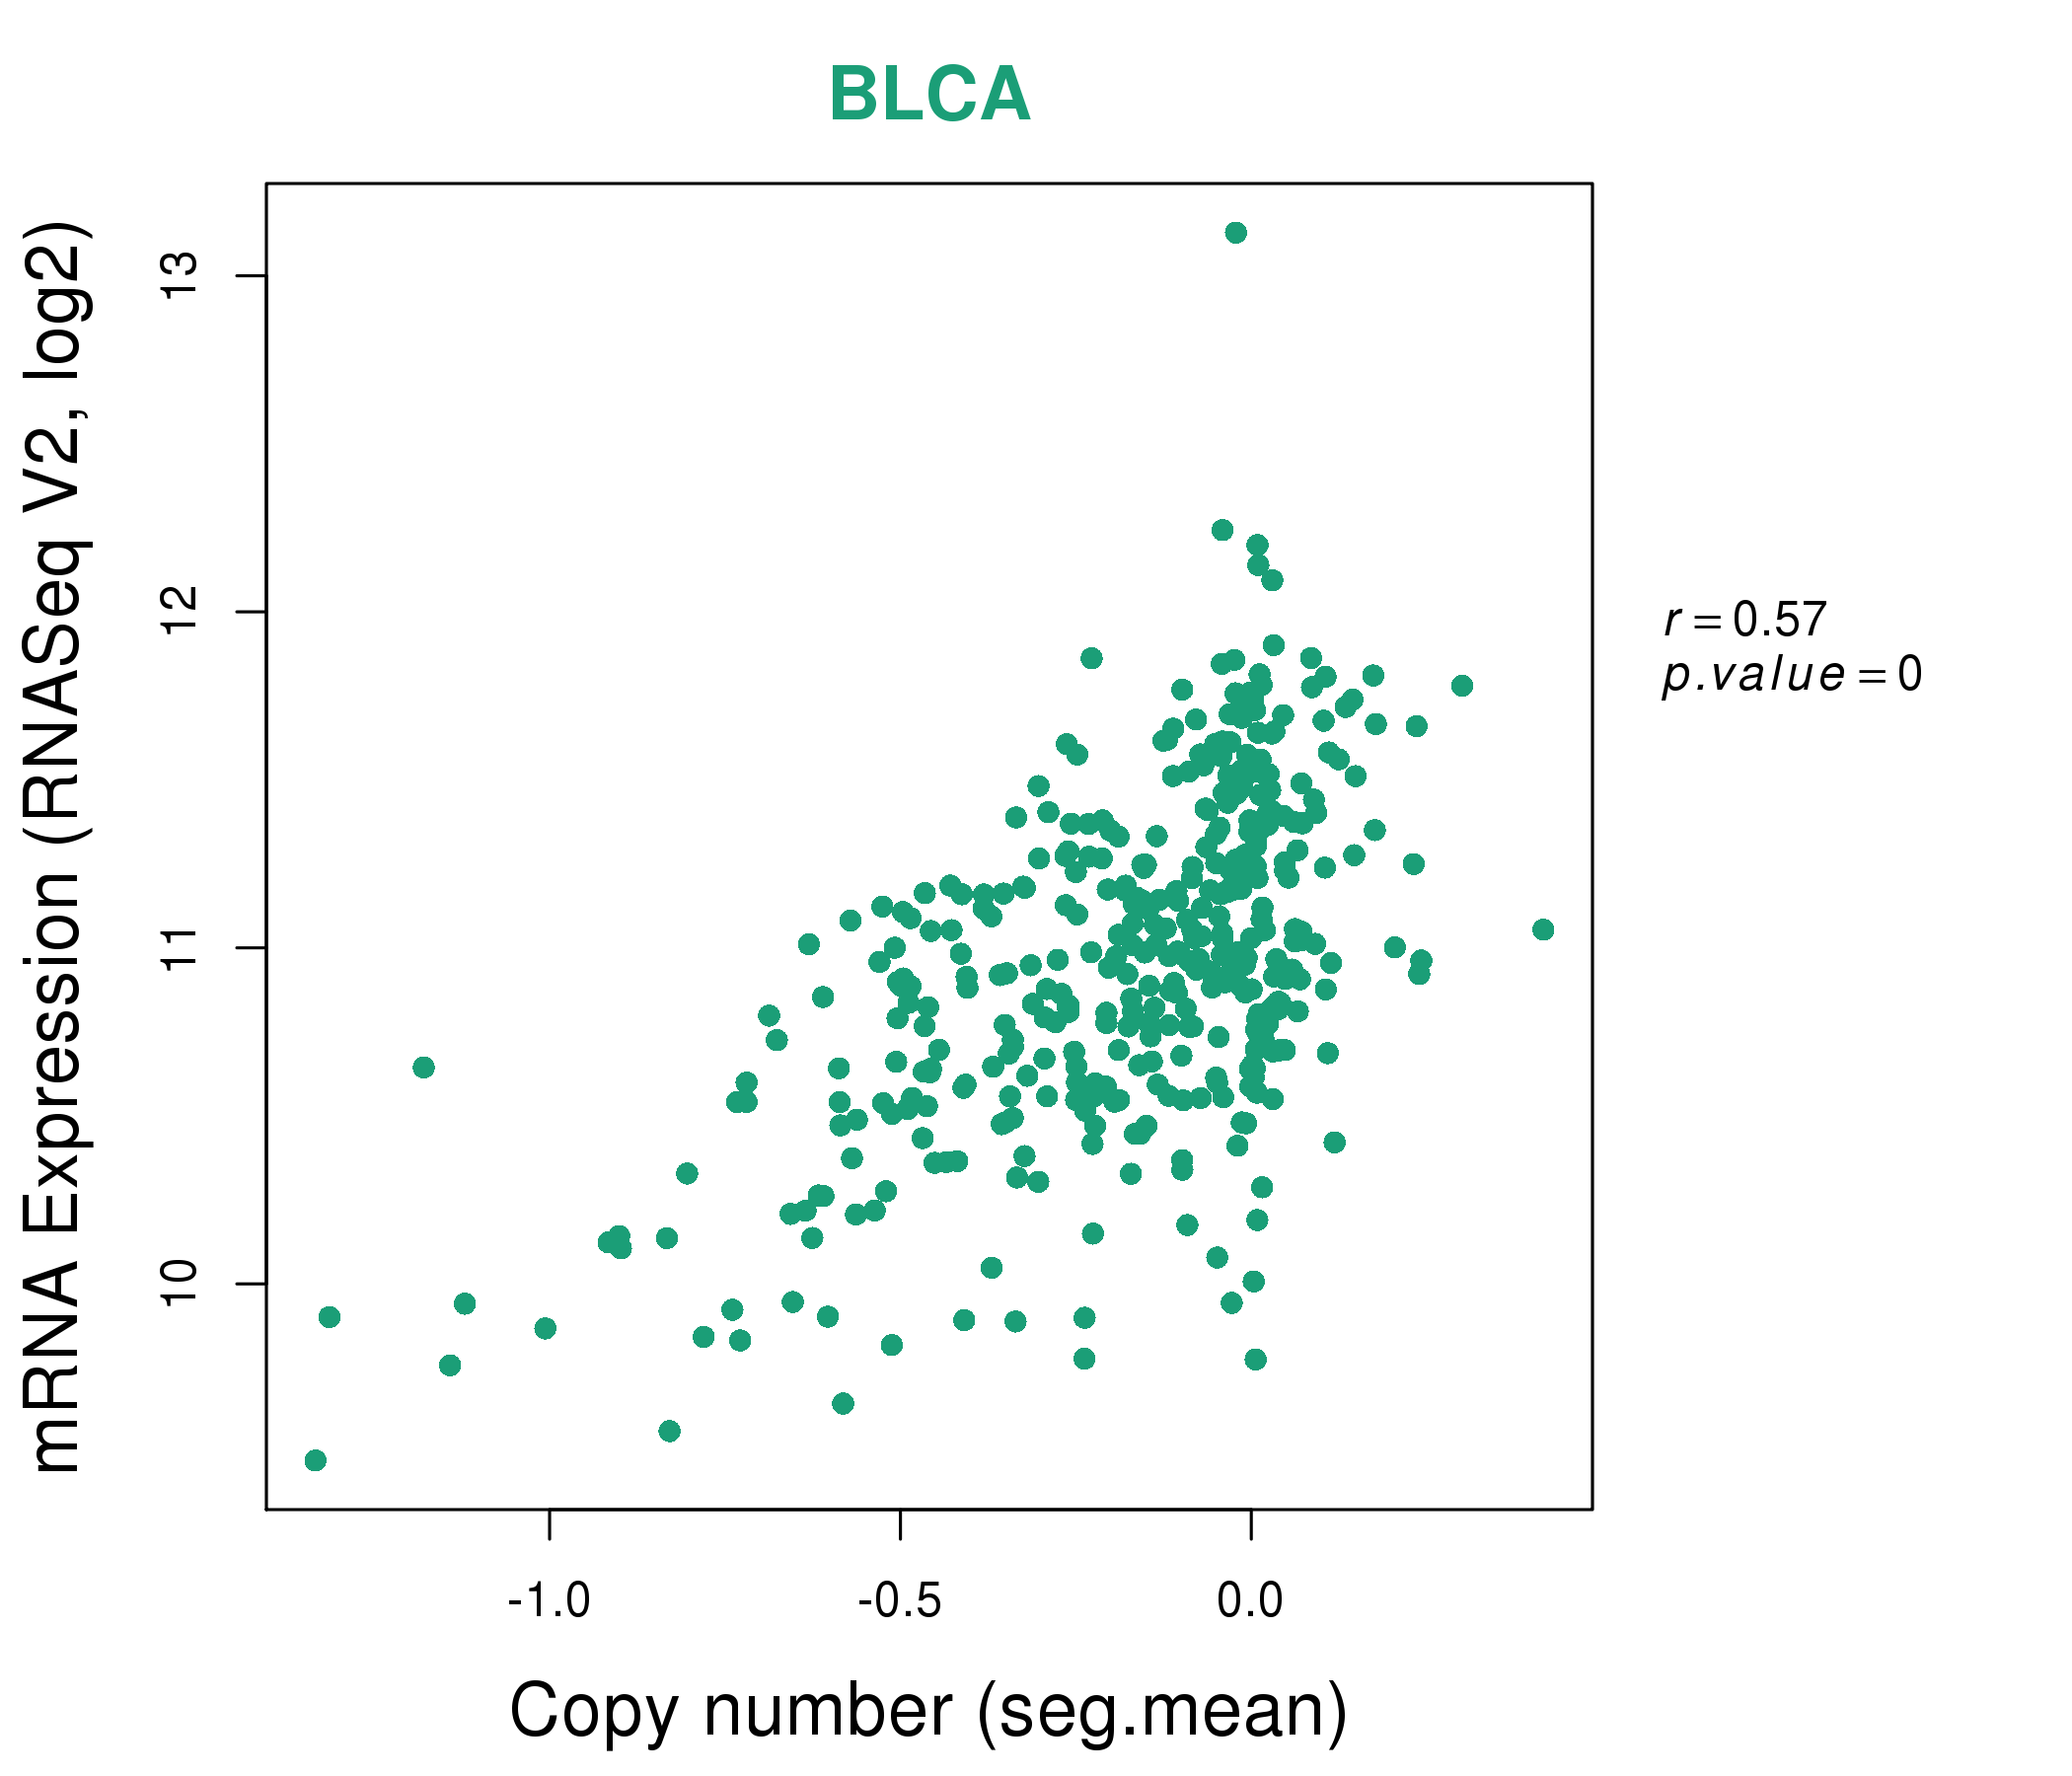
| * This plots show the correlation between CNV and gene expression. |
: Open all plots for all cancer types
 |
|
 |
|

| Top |
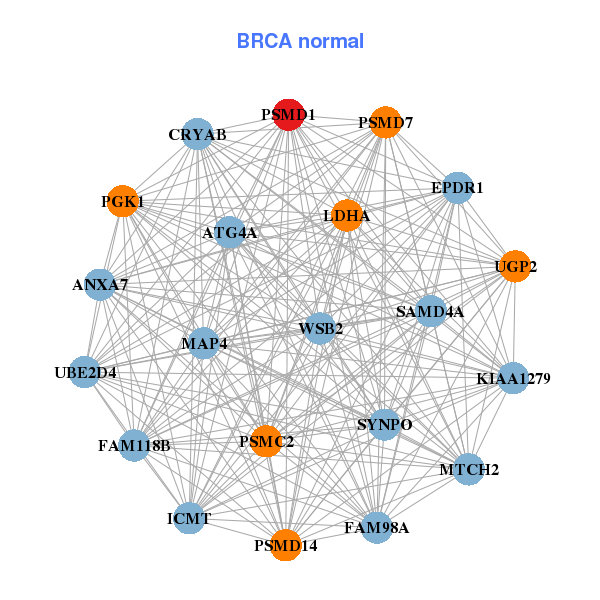
| Gene-Gene Network Information |
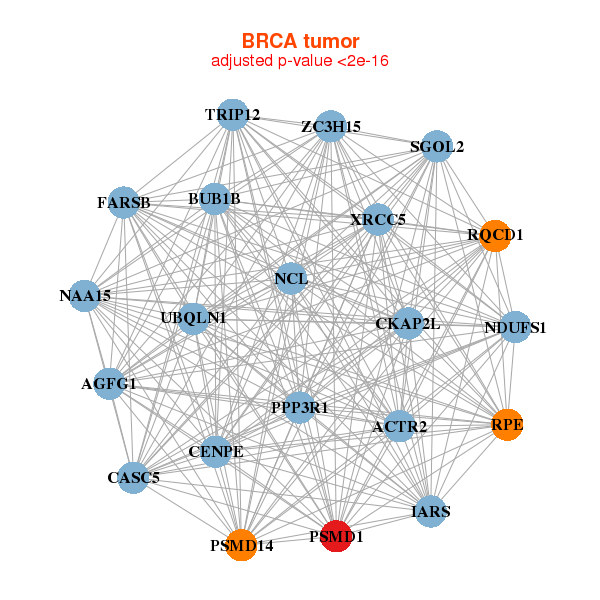
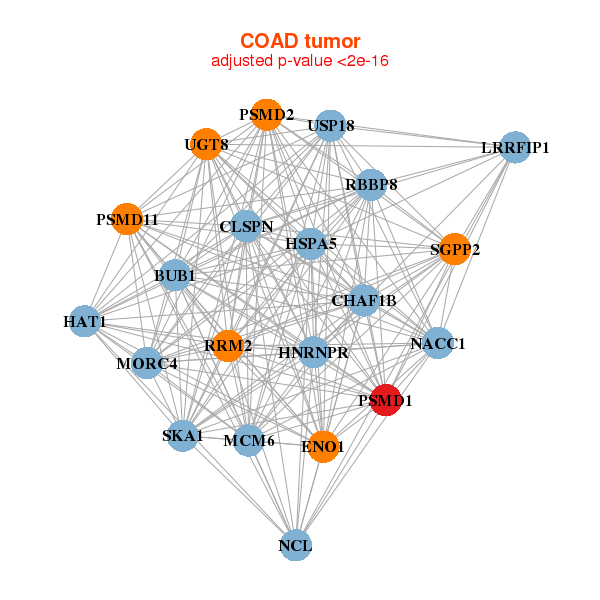
| * Co-Expression network figures were drawn using R package igraph. Only the top 20 genes with the highest correlations were shown. Red circle: input gene, orange circle: cell metabolism gene, sky circle: other gene |
: Open all plots for all cancer types
 |
| ||||
| KNSTRN,MTFR2,FARSB,KCMF1,KPNA2,NCAPG,NOP58, OIP5,ORC6,PNO1,PSMA3,PSMA4,PSMB2,PSMC2, PSMD14,PSMD1,RRM2,SNRPG,SPC25,SSB,ZC3H15 | ANXA7,ATG4A,BOLA3,C20orf24,FAM98A,GTF3A,GTF3C6, LDHA,MTCH2,PGK1,PRPS1,PSMA3,PSMC2,PSMD14, PSMD1,PSMD6,PSMD7,TIMM17A,TTC1,UBE2F,WSB2 | ||||
 |
| ||||
| CCT4,GLRX3,HSPE1,MEMO1,MRPL44,MRPS23,MYEOV2, NIF3L1,NME1,OLA1,ORC4,PNO1,PSMA1,PSMB1, PSMD14,SRSF3,SRSF7,SNRPG,SUMO1,WDR12,YWHAQ | EBNA1BP2,EIF5AL1,HAT1,HSPE1,MAGOHB,NME1,PPIL1, PSMA1,PSMA5,PSMA7,PSMC6,PSMD14,PSMD6,RAN, RPL26L1,SNRPD1,SNRPG,SSBP1,TCEB1,TOMM5,UBE2N |
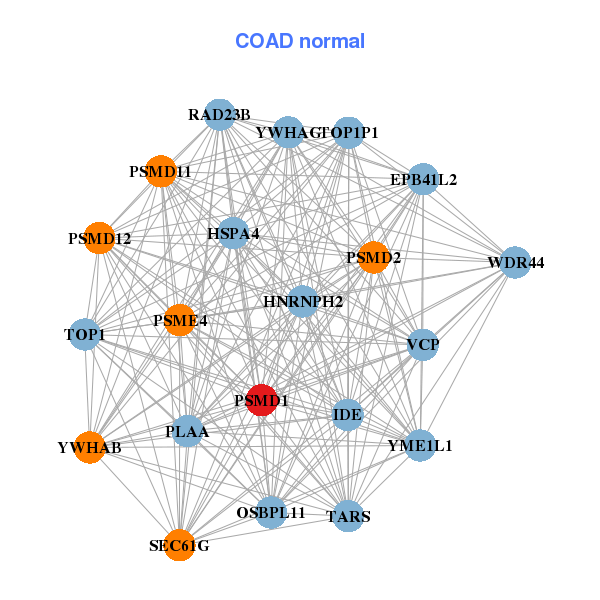
| * Co-Expression network figures were drawn using R package igraph. Only the top 20 genes with the highest correlations were shown. Red circle: input gene, orange circle: cell metabolism gene, sky circle: other gene |
: Open all plots for all cancer types
| Top |
: Open all interacting genes' information including KEGG pathway for all interacting genes from DAVID
| Top |
| Pharmacological Information for PSMD1 |
| DB Category | DB Name | DB's ID and Url link |
| Organism-specific databases | PharmGKB | PA33899; -. |
| Organism-specific databases | PharmGKB | PA33899; -. |
| Organism-specific databases | CTD | 5707; -. |
| Organism-specific databases | CTD | 5707; -. |
| * Gene Centered Interaction Network. |
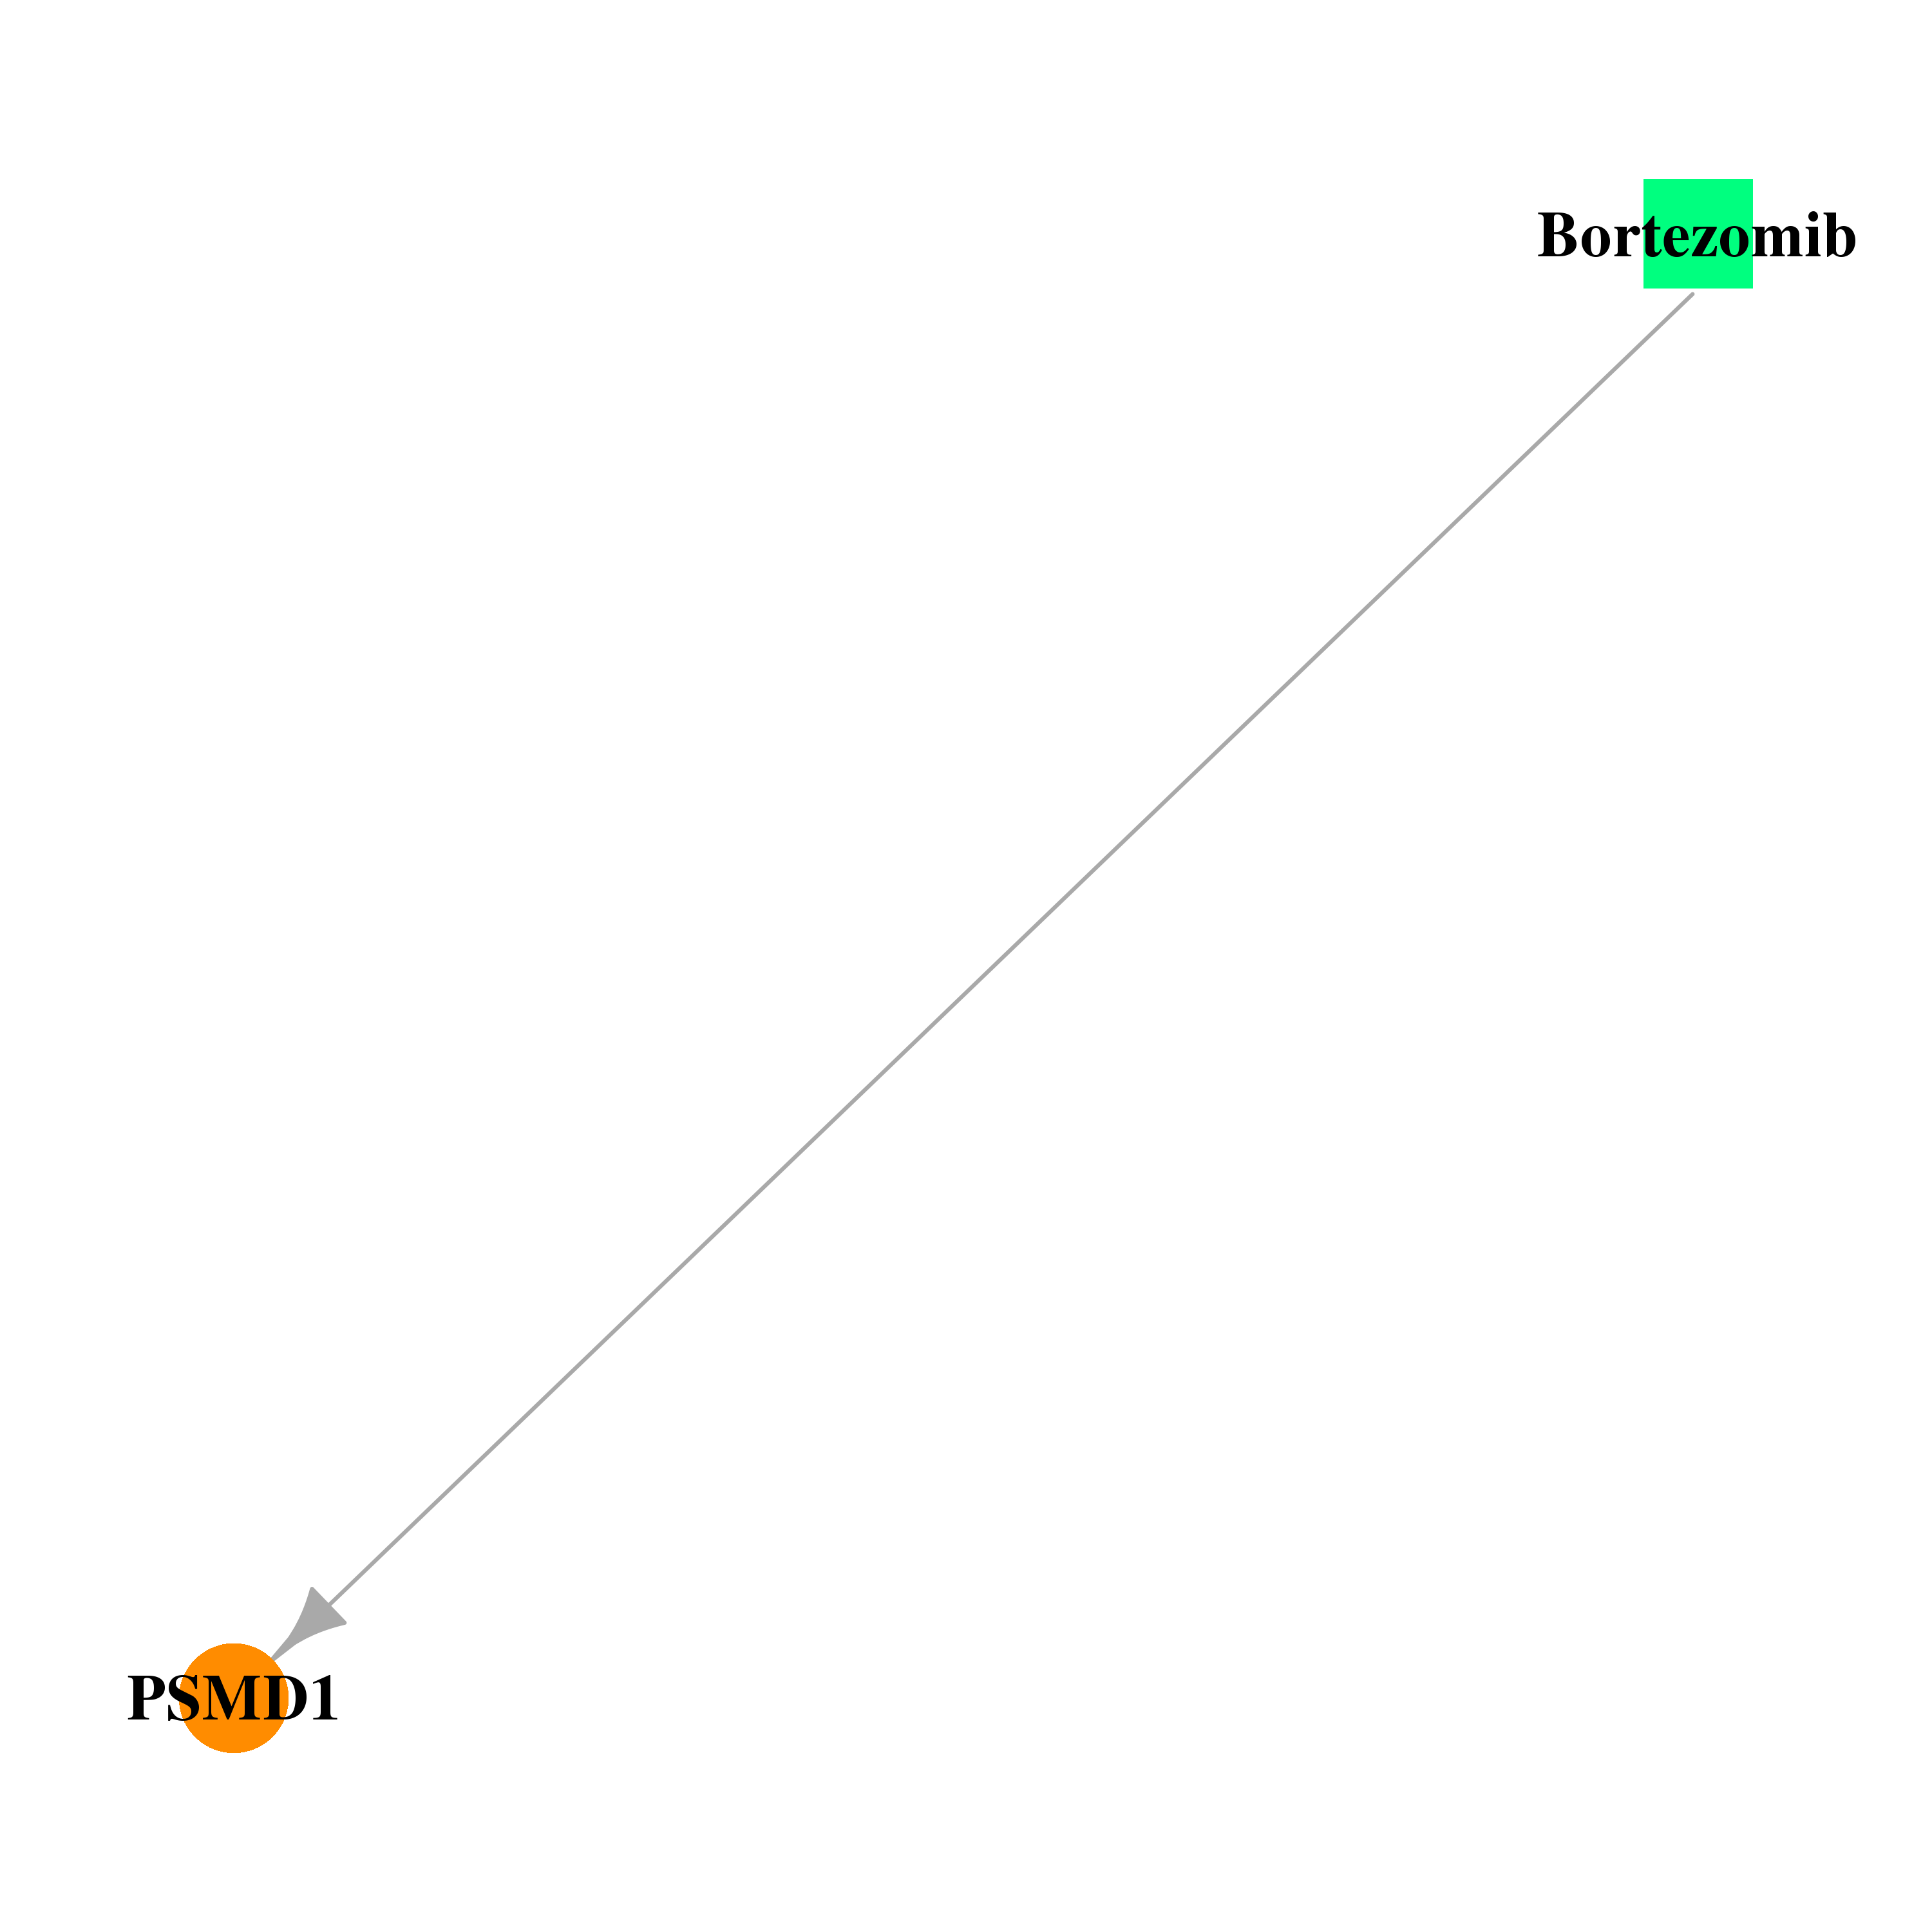 |
| * Drug Centered Interaction Network. |
| DrugBank ID | Target Name | Drug Groups | Generic Name | Drug Centered Network | Drug Structure |
| DB00188 | proteasome (prosome, macropain) 26S subunit, non-ATPase, 1 | approved; investigational | Bortezomib | 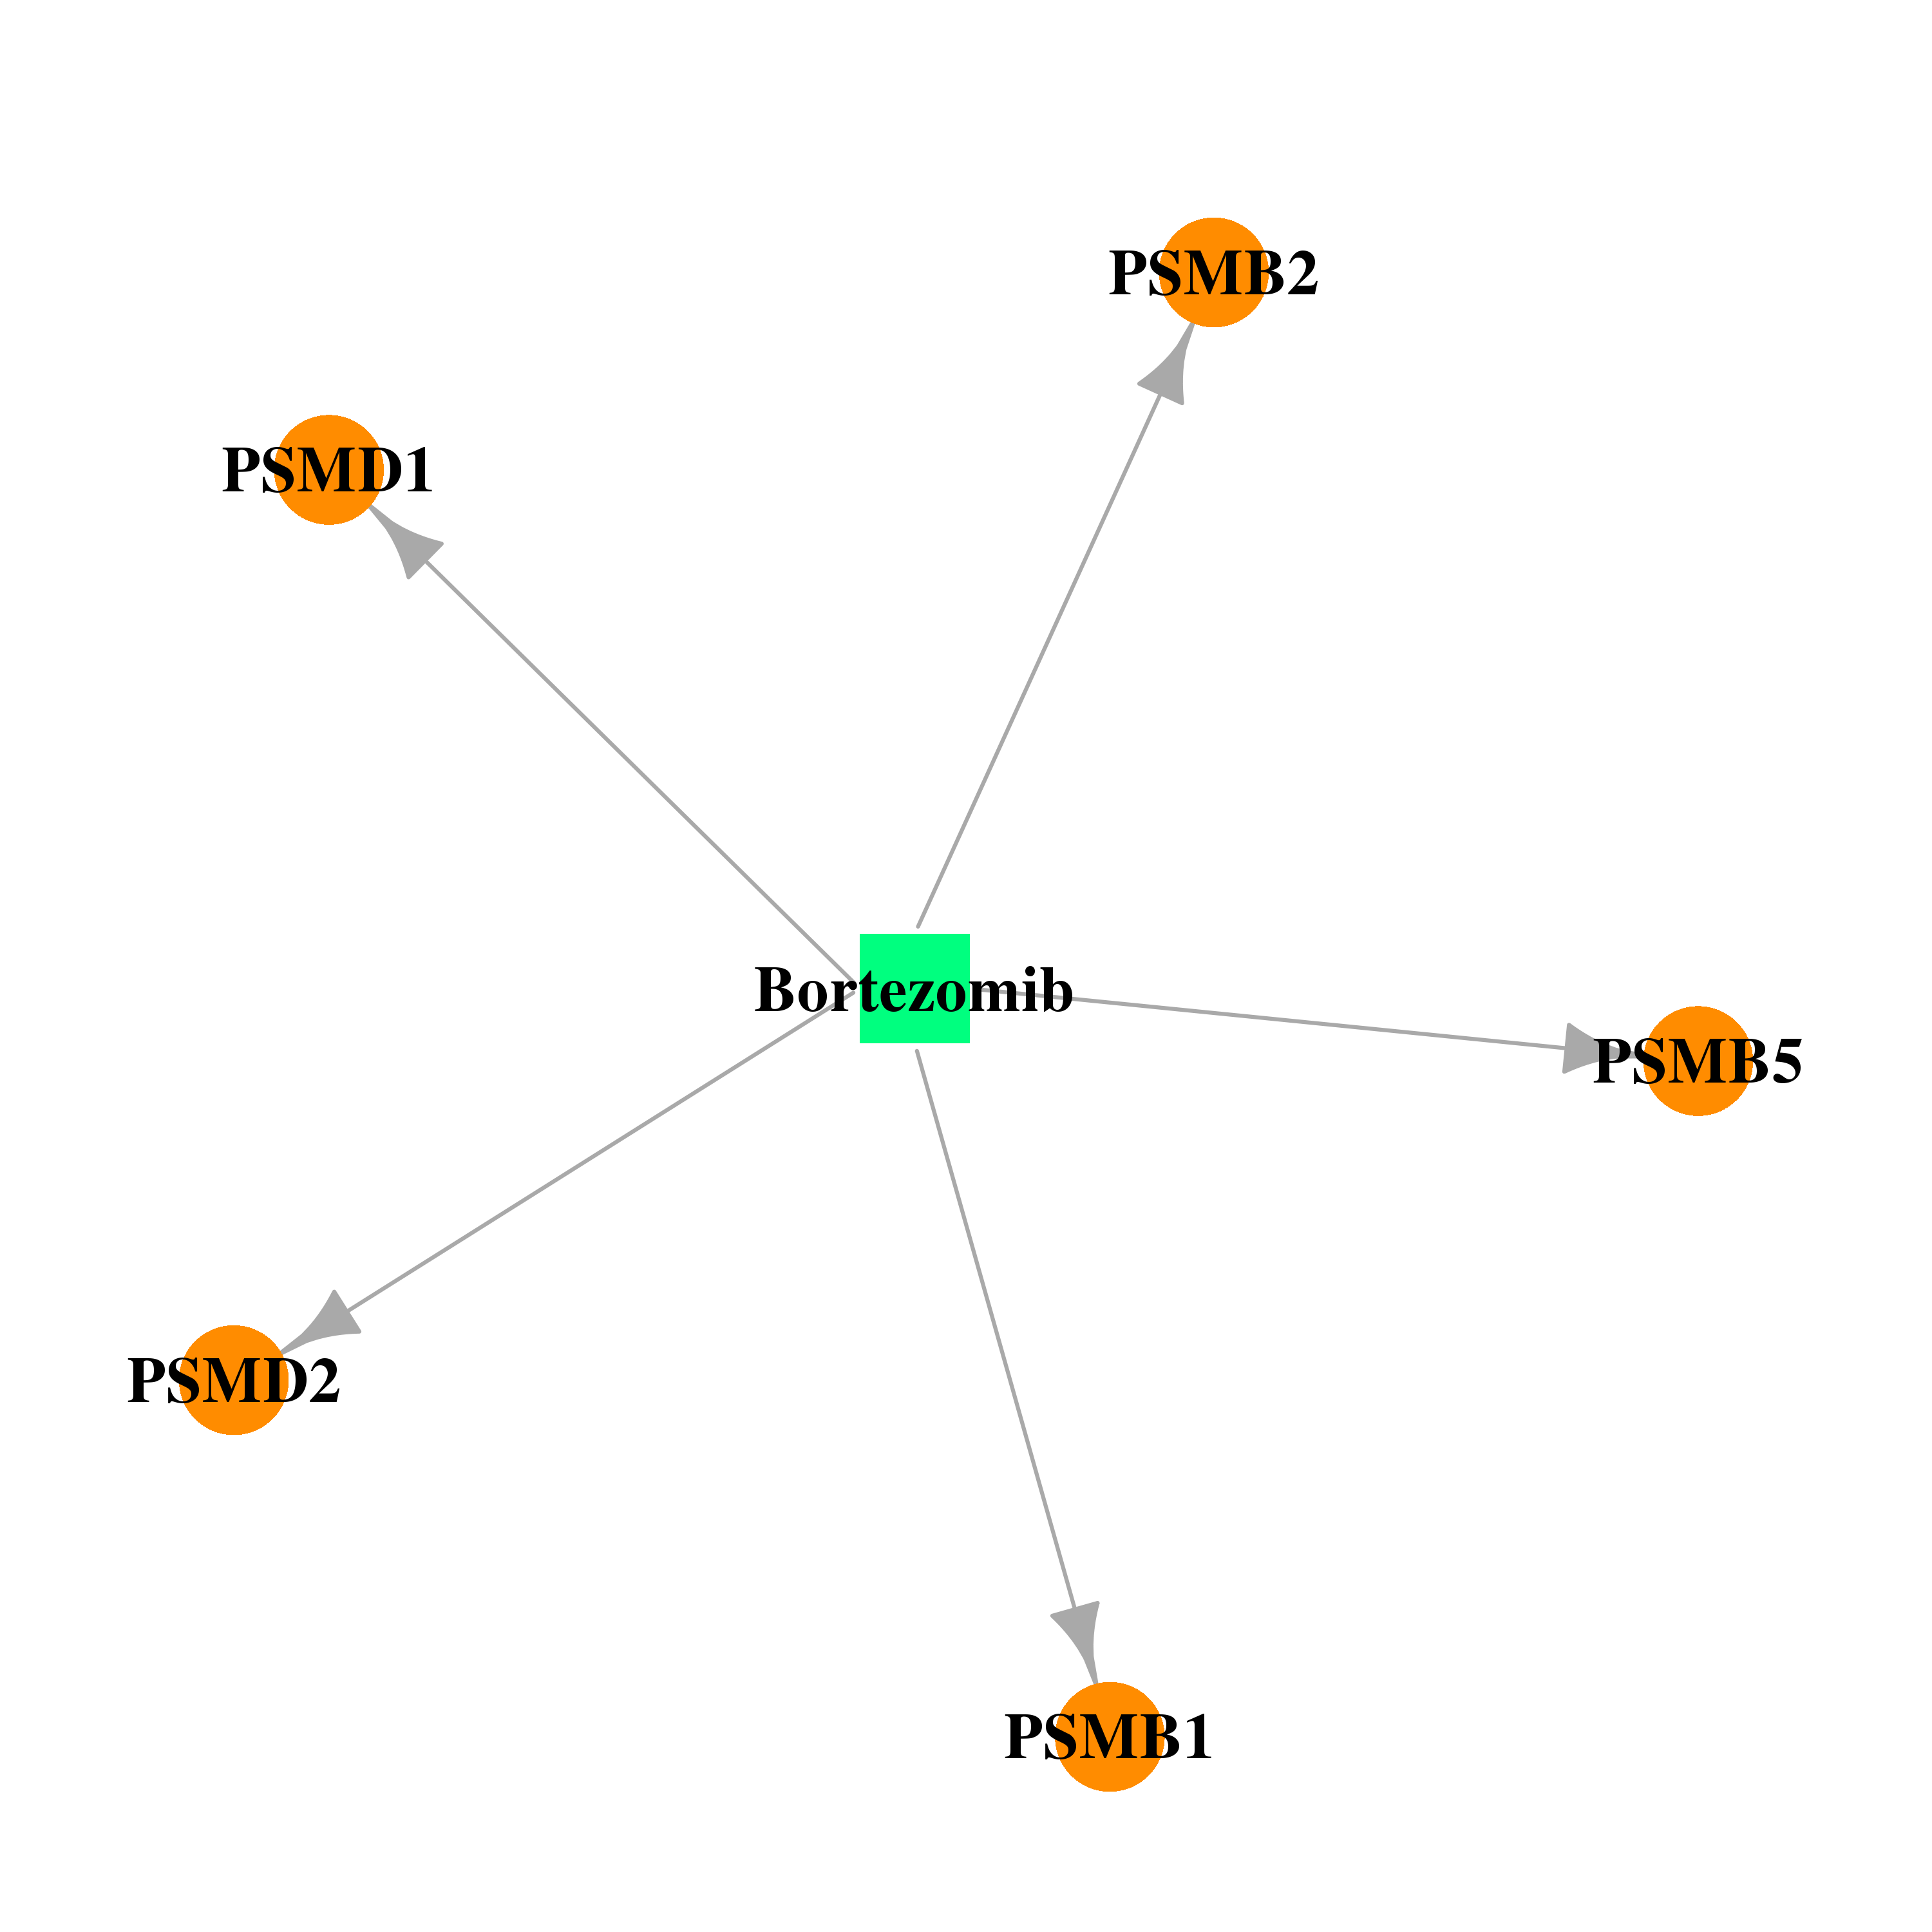 | 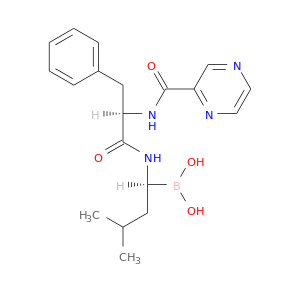 |
| Top |
| Cross referenced IDs for PSMD1 |
| * We obtained these cross-references from Uniprot database. It covers 150 different DBs, 18 categories. http://www.uniprot.org/help/cross_references_section |
: Open all cross reference information
|
Copyright © 2016-Present - The Univsersity of Texas Health Science Center at Houston @ |