|
||||||||||||||||||||||||||||||||||||||||||||||||||||||||||||||||||||||||||||||||||||||||||||||||||||||||||||||||||||||||||||||||||||||||||||||||||||||||||||||||||||||||||||||||||||||||||||||||||||||||||||||||||||||||||||||||||||||||||||||||||||||||||||||||||||||||||||||||||||||||||||||||||||||||||||||||||||||||||||||||||||||||||||||||||||||||||||
| |
| Phenotypic Information (metabolism pathway, cancer, disease, phenome) |
| |
| |
| Gene-Gene Network Information: Co-Expression Network, Interacting Genes & KEGG |
| |
|


| Gene Summary for RORA |
| Basic gene info. | Gene symbol | RORA |
| Gene name | RAR-related orphan receptor A | |
| Synonyms | NR1F1|ROR1|ROR2|ROR3|RZR-ALPHA|RZRA | |
| Cytomap | UCSC genome browser: 15q22.2 | |
| Genomic location | chr15 :60780482-60884707 | |
| Type of gene | protein-coding | |
| RefGenes | NM_002943.3, NM_134260.2,NM_134261.2,NM_134262.2, | |
| Ensembl id | ENSG00000069667 | |
| Description | ROR-alphanuclear receptor ROR-alphanuclear receptor RZR-alphanuclear receptor subfamily 1 group F member 1retinoic acid receptor-related orphan receptor alpharetinoid-related orphan receptor alphathyroid hormone nuclear receptor alpha variant 4tran | |
| Modification date | 20141222 | |
| dbXrefs | MIM : 600825 | |
| HGNC : HGNC | ||
| Ensembl : ENSG00000069667 | ||
| HPRD : 02896 | ||
| Vega : OTTHUMG00000132769 | ||
| Protein | UniProt: P35398 go to UniProt's Cross Reference DB Table | |
| Expression | CleanEX: HS_RORA | |
| BioGPS: 6095 | ||
| Gene Expression Atlas: ENSG00000069667 | ||
| The Human Protein Atlas: ENSG00000069667 | ||
| Pathway | NCI Pathway Interaction Database: RORA | |
| KEGG: RORA | ||
| REACTOME: RORA | ||
| ConsensusPathDB | ||
| Pathway Commons: RORA | ||
| Metabolism | MetaCyc: RORA | |
| HUMANCyc: RORA | ||
| Regulation | Ensembl's Regulation: ENSG00000069667 | |
| miRBase: chr15 :60,780,482-60,884,707 | ||
| TargetScan: NM_002943 | ||
| cisRED: ENSG00000069667 | ||
| Context | iHOP: RORA | |
| cancer metabolism search in PubMed: RORA | ||
| UCL Cancer Institute: RORA | ||
| Assigned class in ccmGDB | B - This gene belongs to cancer gene. | |
| Top |
| Phenotypic Information for RORA(metabolism pathway, cancer, disease, phenome) |
| Cancer | CGAP: RORA |
| Familial Cancer Database: RORA | |
| * This gene is included in those cancer gene databases. |
|
|
|
|
|
| . | ||||||||||||||||||||||||||||||||||||||||||||||||||||||||||||||||||||||||||||||||||||||||||||||||||||||||||||||||||||||||||||||||||||||||||||||||||||||||||||||||||||||||||||||||||||||||||||||||||||||||||||||||||||||||||||||||||||||||||||||||||||||||||||||||||||||||||||||||||||||||||||||||||||||||||||||||||||||||||||||||||||||||||||||||||||||
Oncogene 1 | Significant driver gene in | |||||||||||||||||||||||||||||||||||||||||||||||||||||||||||||||||||||||||||||||||||||||||||||||||||||||||||||||||||||||||||||||||||||||||||||||||||||||||||||||||||||||||||||||||||||||||||||||||||||||||||||||||||||||||||||||||||||||||||||||||||||||||||||||||||||||||||||||||||||||||||||||||||||||||||||||||||||||||||||||||||||||||||||||||||||||||||
| cf) number; DB name 1 Oncogene; http://nar.oxfordjournals.org/content/35/suppl_1/D721.long, 2 Tumor Suppressor gene; https://bioinfo.uth.edu/TSGene/, 3 Cancer Gene Census; http://www.nature.com/nrc/journal/v4/n3/abs/nrc1299.html, 4 CancerGenes; http://nar.oxfordjournals.org/content/35/suppl_1/D721.long, 5 Network of Cancer Gene; http://ncg.kcl.ac.uk/index.php, 1Therapeutic Vulnerabilities in Cancer; http://cbio.mskcc.org/cancergenomics/statius/ |
| REACTOME_METABOLISM_OF_LIPIDS_AND_LIPOPROTEINS | |
| OMIM | 600825; gene. |
| Orphanet | |
| Disease | KEGG Disease: RORA |
| MedGen: RORA (Human Medical Genetics with Condition) | |
| ClinVar: RORA | |
| Phenotype | MGI: RORA (International Mouse Phenotyping Consortium) |
| PhenomicDB: RORA | |
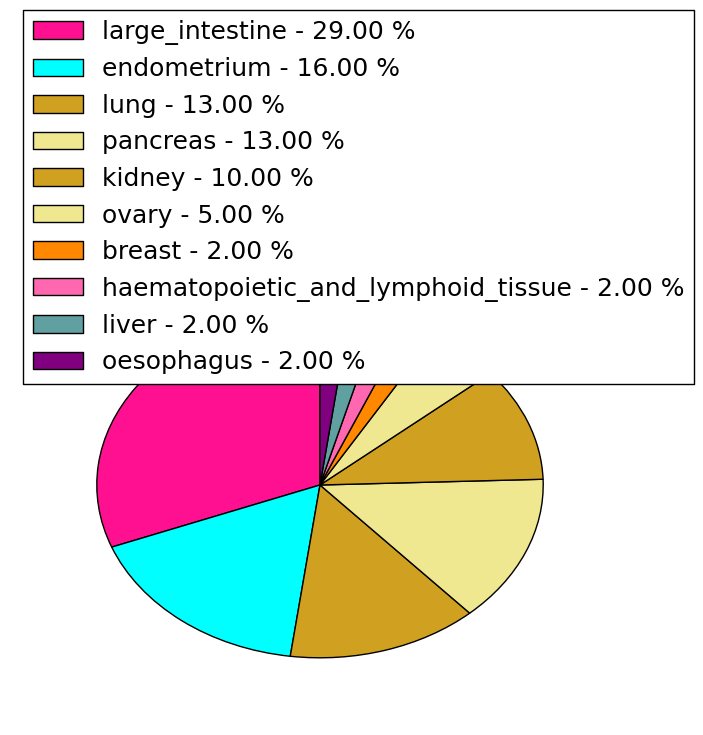
| Mutations for RORA |
| * Under tables are showing count per each tissue to give us broad intuition about tissue specific mutation patterns.You can go to the detailed page for each mutation database's web site. |
| - Statistics for Tissue and Mutation type | Top |
 |
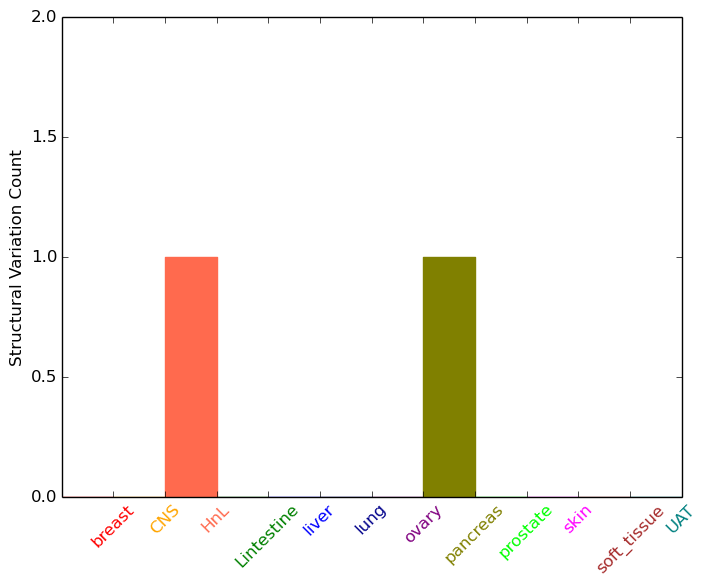
| - For Inter-chromosomal Variations |
| * Inter-chromosomal variantions includes 'interchromosomal amplicon to amplicon', 'interchromosomal amplicon to non-amplified dna', 'interchromosomal insertion', 'Interchromosomal unknown type'. |
 |
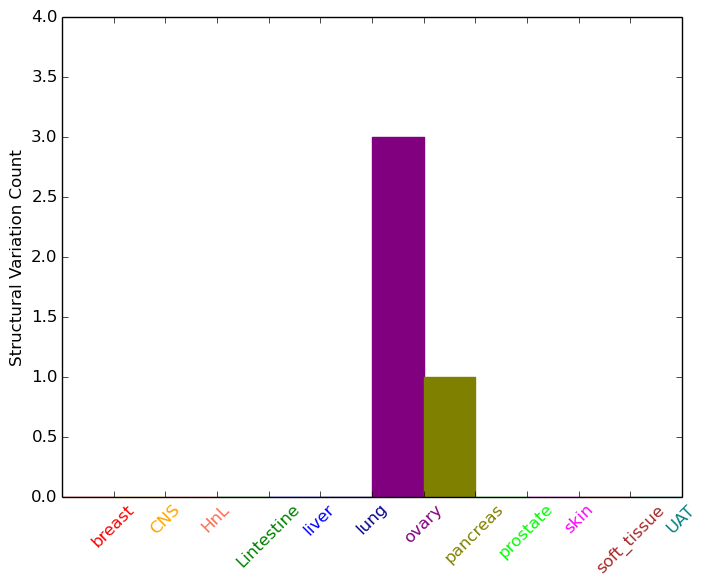
| - For Intra-chromosomal Variations |
| * Intra-chromosomal variantions includes 'intrachromosomal amplicon to amplicon', 'intrachromosomal amplicon to non-amplified dna', 'intrachromosomal deletion', 'intrachromosomal fold-back inversion', 'intrachromosomal inversion', 'intrachromosomal tandem duplication', 'Intrachromosomal unknown type', 'intrachromosomal with inverted orientation', 'intrachromosomal with non-inverted orientation'. |
 |
| Sample | Symbol_a | Chr_a | Start_a | End_a | Symbol_b | Chr_b | Start_b | End_b |
| haematopoietic_and_lymphoid_tissue | RORA | chr15 | 60808335 | 60808335 | chr17 | 68060017 | 68060017 | |
| ovary | RORA | chr15 | 60835607 | 60835627 | chr15 | 20101981 | 20102001 | |
| ovary | RORA | chr15 | 60846342 | 60846362 | chr15 | 89610402 | 89610422 | |
| ovary | RORA | chr15 | 60852131 | 60852151 | RORA | chr15 | 60853616 | 60853636 |
| pancreas | RORA | chr15 | 60830773 | 60830793 | RORA | chr15 | 60831670 | 60831690 |
| cf) Tissue number; Tissue name (1;Breast, 2;Central_nervous_system, 3;Haematopoietic_and_lymphoid_tissue, 4;Large_intestine, 5;Liver, 6;Lung, 7;Ovary, 8;Pancreas, 9;Prostate, 10;Skin, 11;Soft_tissue, 12;Upper_aerodigestive_tract) |
| * From mRNA Sanger sequences, Chitars2.0 arranged chimeric transcripts. This table shows RORA related fusion information. |
| ID | Head Gene | Tail Gene | Accession | Gene_a | qStart_a | qEnd_a | Chromosome_a | tStart_a | tEnd_a | Gene_a | qStart_a | qEnd_a | Chromosome_a | tStart_a | tEnd_a |
| BF858891 | RORA | 14 | 363 | 15 | 61371657 | 61372006 | KLK3 | 353 | 447 | 19 | 51363680 | 51363778 | |
| BF091671 | MRO | 15 | 241 | 18 | 48321742 | 48321967 | RORA | 229 | 472 | 15 | 61473945 | 61474188 | |
| CV392982 | RORA | 10 | 310 | 15 | 61343402 | 61343701 | BAI3 | 305 | 535 | 6 | 69352808 | 69353038 | |
| Top |
| Mutation type/ Tissue ID | brca | cns | cerv | endome | haematopo | kidn | Lintest | liver | lung | ns | ovary | pancre | prost | skin | stoma | thyro | urina | |||
| Total # sample | 2 | 2 | 1 | |||||||||||||||||
| GAIN (# sample) | 1 | 1 | 1 | |||||||||||||||||
| LOSS (# sample) | 1 | 1 |
| cf) Tissue ID; Tissue type (1; Breast, 2; Central_nervous_system, 3; Cervix, 4; Endometrium, 5; Haematopoietic_and_lymphoid_tissue, 6; Kidney, 7; Large_intestine, 8; Liver, 9; Lung, 10; NS, 11; Ovary, 12; Pancreas, 13; Prostate, 14; Skin, 15; Stomach, 16; Thyroid, 17; Urinary_tract) |
| Top |
|
 |
| Top |
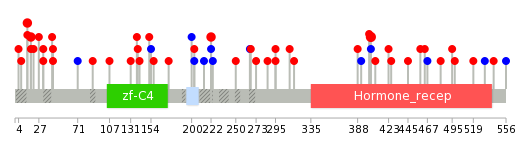
| Stat. for Non-Synonymous SNVs (# total SNVs=37) | (# total SNVs=9) |
 |  |
(# total SNVs=2) | (# total SNVs=1) |
 |  |
| Top |
| * When you move the cursor on each content, you can see more deailed mutation information on the Tooltip. Those are primary_site,primary_histology,mutation(aa),pubmedID. |
| GRCh37 position | Mutation(aa) | Unique sampleID count |
| chr15:60795033-60795033 | p.R403H | 3 |
| chr15:60919533-60919533 | p.E14G | 2 |
| chr15:60919479-60919479 | p.R32I | 2 |
| chr15:60803679-60803679 | p.S222L | 2 |
| chr15:60919495-60919495 | p.R27* | 2 |
| chr15:60803461-60803461 | p.G295S | 2 |
| chr15:60919521-60919521 | p.P18L | 2 |
| chr15:60919532-60919532 | p.E14D | 1 |
| chr15:60803545-60803545 | p.L267I | 1 |
| chr15:60806868-60806868 | p.R157H | 1 |
| Top |
|
 |
| Point Mutation/ Tissue ID | 1 | 2 | 3 | 4 | 5 | 6 | 7 | 8 | 9 | 10 | 11 | 12 | 13 | 14 | 15 | 16 | 17 | 18 | 19 | 20 |
| # sample | 1 | 1 | 6 | 1 | 2 | 1 | 8 | 3 | 2 | 4 | 5 | 12 | ||||||||
| # mutation | 1 | 1 | 5 | 1 | 2 | 1 | 9 | 3 | 2 | 3 | 5 | 14 | ||||||||
| nonsynonymous SNV | 1 | 4 | 1 | 1 | 1 | 6 | 3 | 2 | 2 | 4 | 11 | |||||||||
| synonymous SNV | 1 | 1 | 1 | 3 | 1 | 1 | 3 |
| cf) Tissue ID; Tissue type (1; BLCA[Bladder Urothelial Carcinoma], 2; BRCA[Breast invasive carcinoma], 3; CESC[Cervical squamous cell carcinoma and endocervical adenocarcinoma], 4; COAD[Colon adenocarcinoma], 5; GBM[Glioblastoma multiforme], 6; Glioma Low Grade, 7; HNSC[Head and Neck squamous cell carcinoma], 8; KICH[Kidney Chromophobe], 9; KIRC[Kidney renal clear cell carcinoma], 10; KIRP[Kidney renal papillary cell carcinoma], 11; LAML[Acute Myeloid Leukemia], 12; LUAD[Lung adenocarcinoma], 13; LUSC[Lung squamous cell carcinoma], 14; OV[Ovarian serous cystadenocarcinoma ], 15; PAAD[Pancreatic adenocarcinoma], 16; PRAD[Prostate adenocarcinoma], 17; SKCM[Skin Cutaneous Melanoma], 18:STAD[Stomach adenocarcinoma], 19:THCA[Thyroid carcinoma], 20:UCEC[Uterine Corpus Endometrial Carcinoma]) |
| Top |
| * We represented just top 10 SNVs. When you move the cursor on each content, you can see more deailed mutation information on the Tooltip. Those are primary_site, primary_histology, mutation(aa), pubmedID. |
| Genomic Position | Mutation(aa) | Unique sampleID count |
| chr15:60919533 | p.R32T,RORA | 2 |
| chr15:60970872 | p.P18L,RORA | 2 |
| chr15:60919479 | p.E14G,RORA | 2 |
| chr15:60919521 | p.T60T | 2 |
| chr15:60849084 | p.K19N,RORA | 1 |
| chr15:60919532 | p.P211T,RORA | 1 |
| chr15:60795032 | p.E88A | 1 |
| chr15:60803725 | p.G207C,RORA | 1 |
| chr15:60850430 | p.G71G | 1 |
| chr15:60795042 | p.L179F,RORA | 1 |
| * Copy number data were extracted from TCGA using R package TCGA-Assembler. The URLs of all public data files on TCGA DCC data server were gathered on Jan-05-2015. Function ProcessCNAData in TCGA-Assembler package was used to obtain gene-level copy number value which is calculated as the average copy number of the genomic region of a gene. |
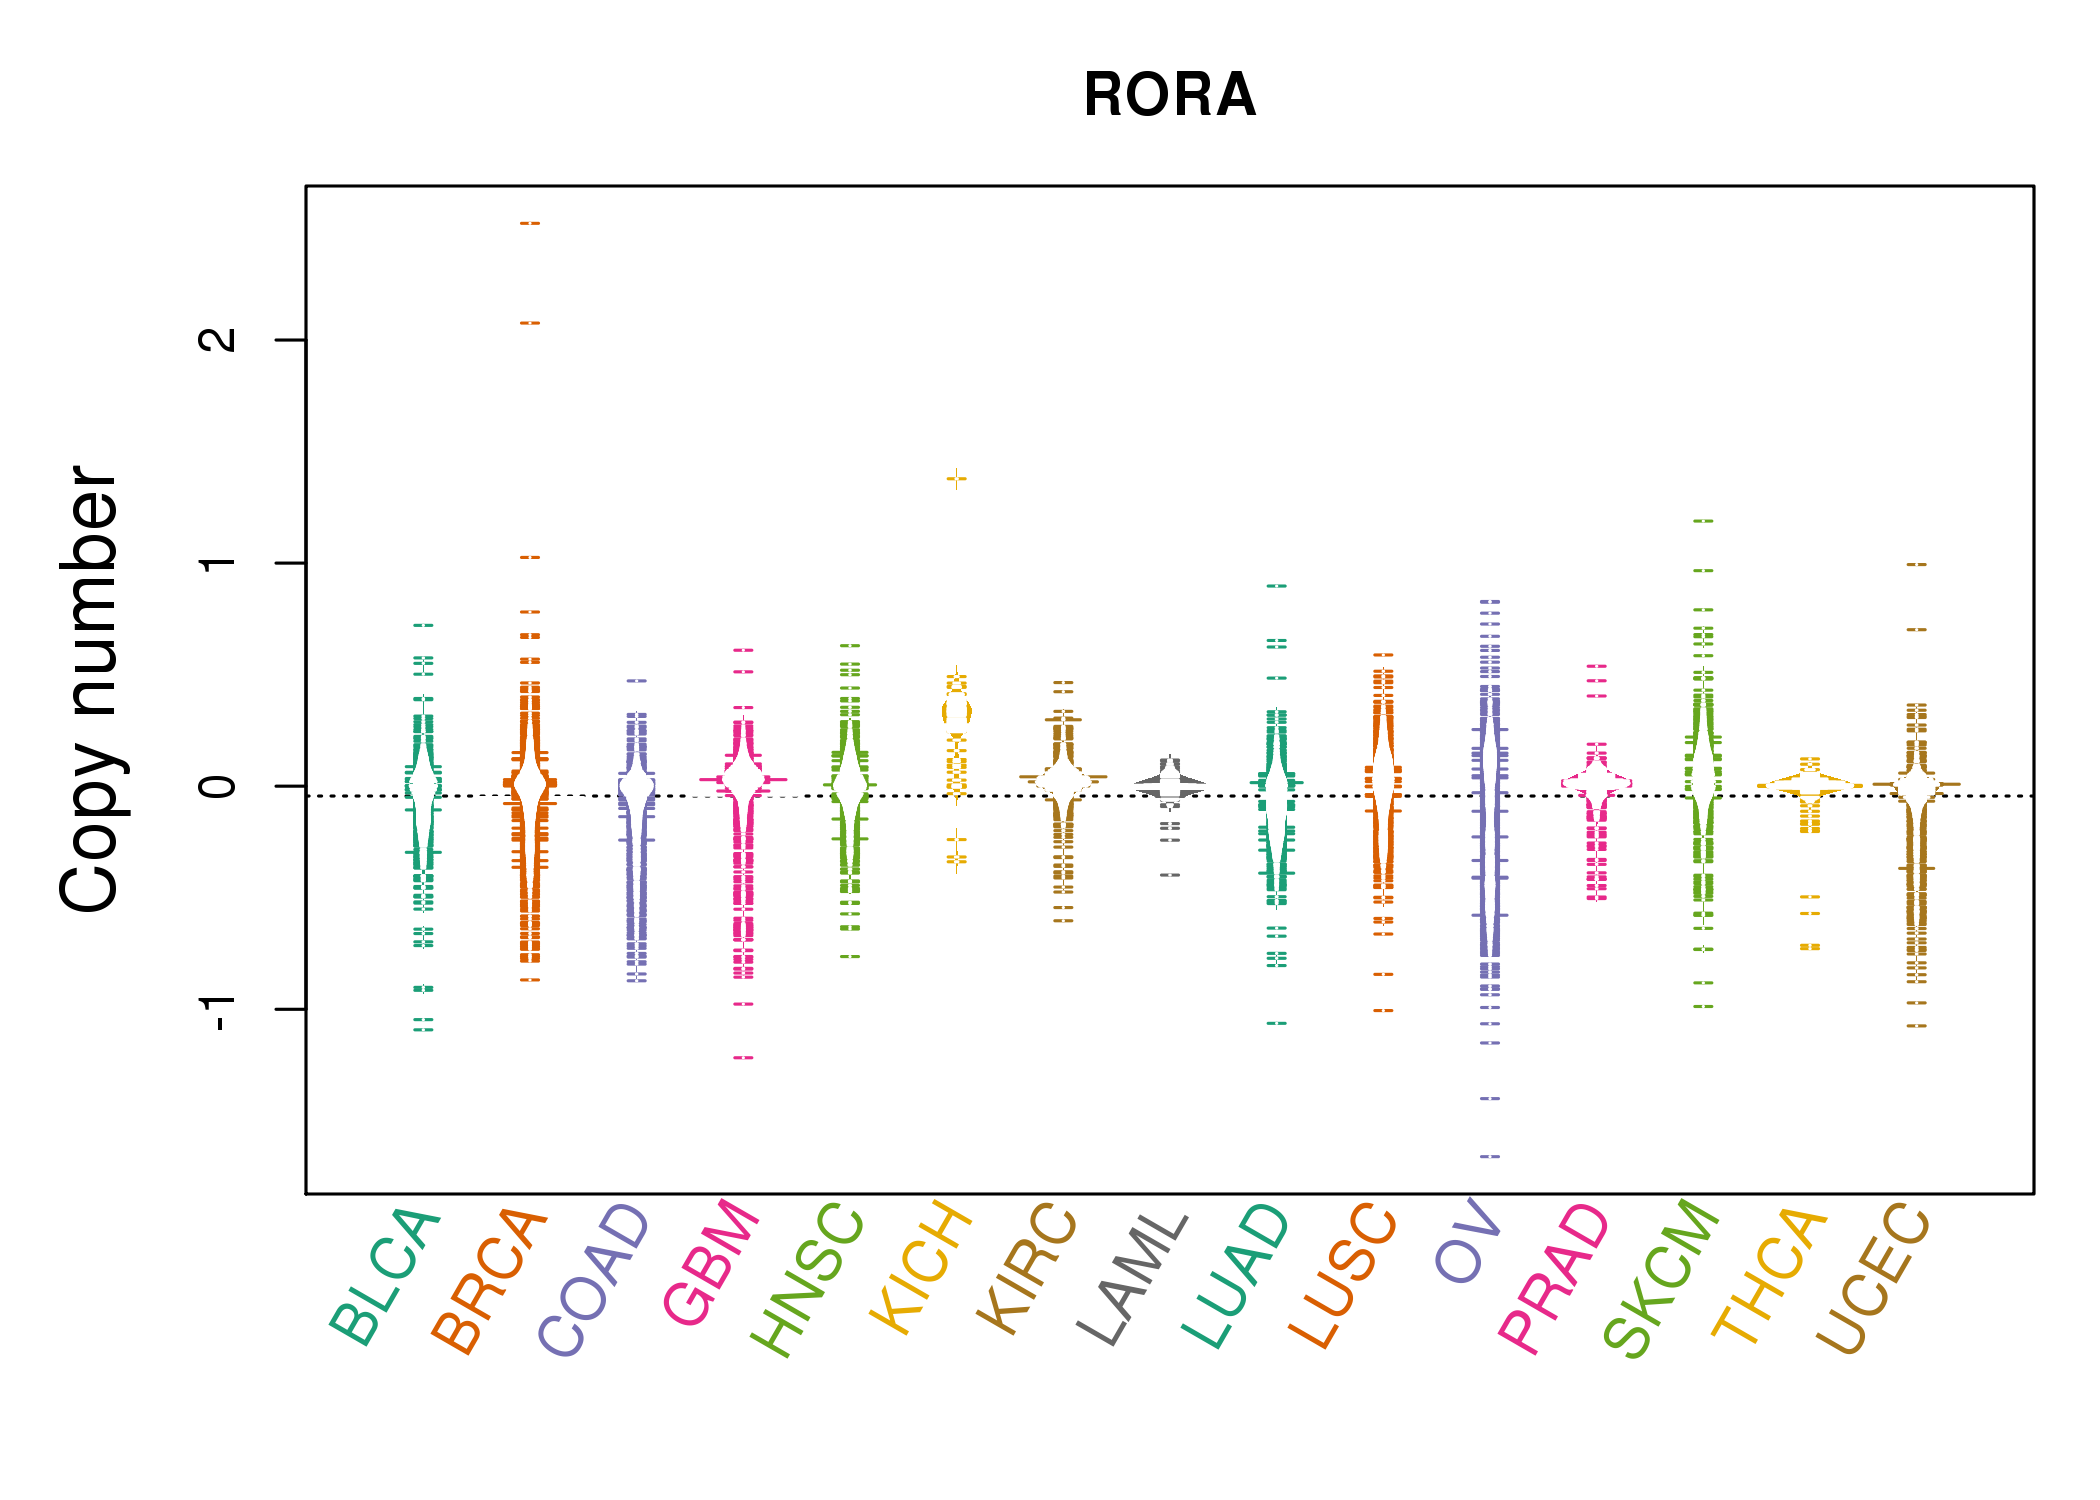 |
| cf) Tissue ID[Tissue type]: BLCA[Bladder Urothelial Carcinoma], BRCA[Breast invasive carcinoma], CESC[Cervical squamous cell carcinoma and endocervical adenocarcinoma], COAD[Colon adenocarcinoma], GBM[Glioblastoma multiforme], Glioma Low Grade, HNSC[Head and Neck squamous cell carcinoma], KICH[Kidney Chromophobe], KIRC[Kidney renal clear cell carcinoma], KIRP[Kidney renal papillary cell carcinoma], LAML[Acute Myeloid Leukemia], LUAD[Lung adenocarcinoma], LUSC[Lung squamous cell carcinoma], OV[Ovarian serous cystadenocarcinoma ], PAAD[Pancreatic adenocarcinoma], PRAD[Prostate adenocarcinoma], SKCM[Skin Cutaneous Melanoma], STAD[Stomach adenocarcinoma], THCA[Thyroid carcinoma], UCEC[Uterine Corpus Endometrial Carcinoma] |
| Top |
| Gene Expression for RORA |
| * CCLE gene expression data were extracted from CCLE_Expression_Entrez_2012-10-18.res: Gene-centric RMA-normalized mRNA expression data. |
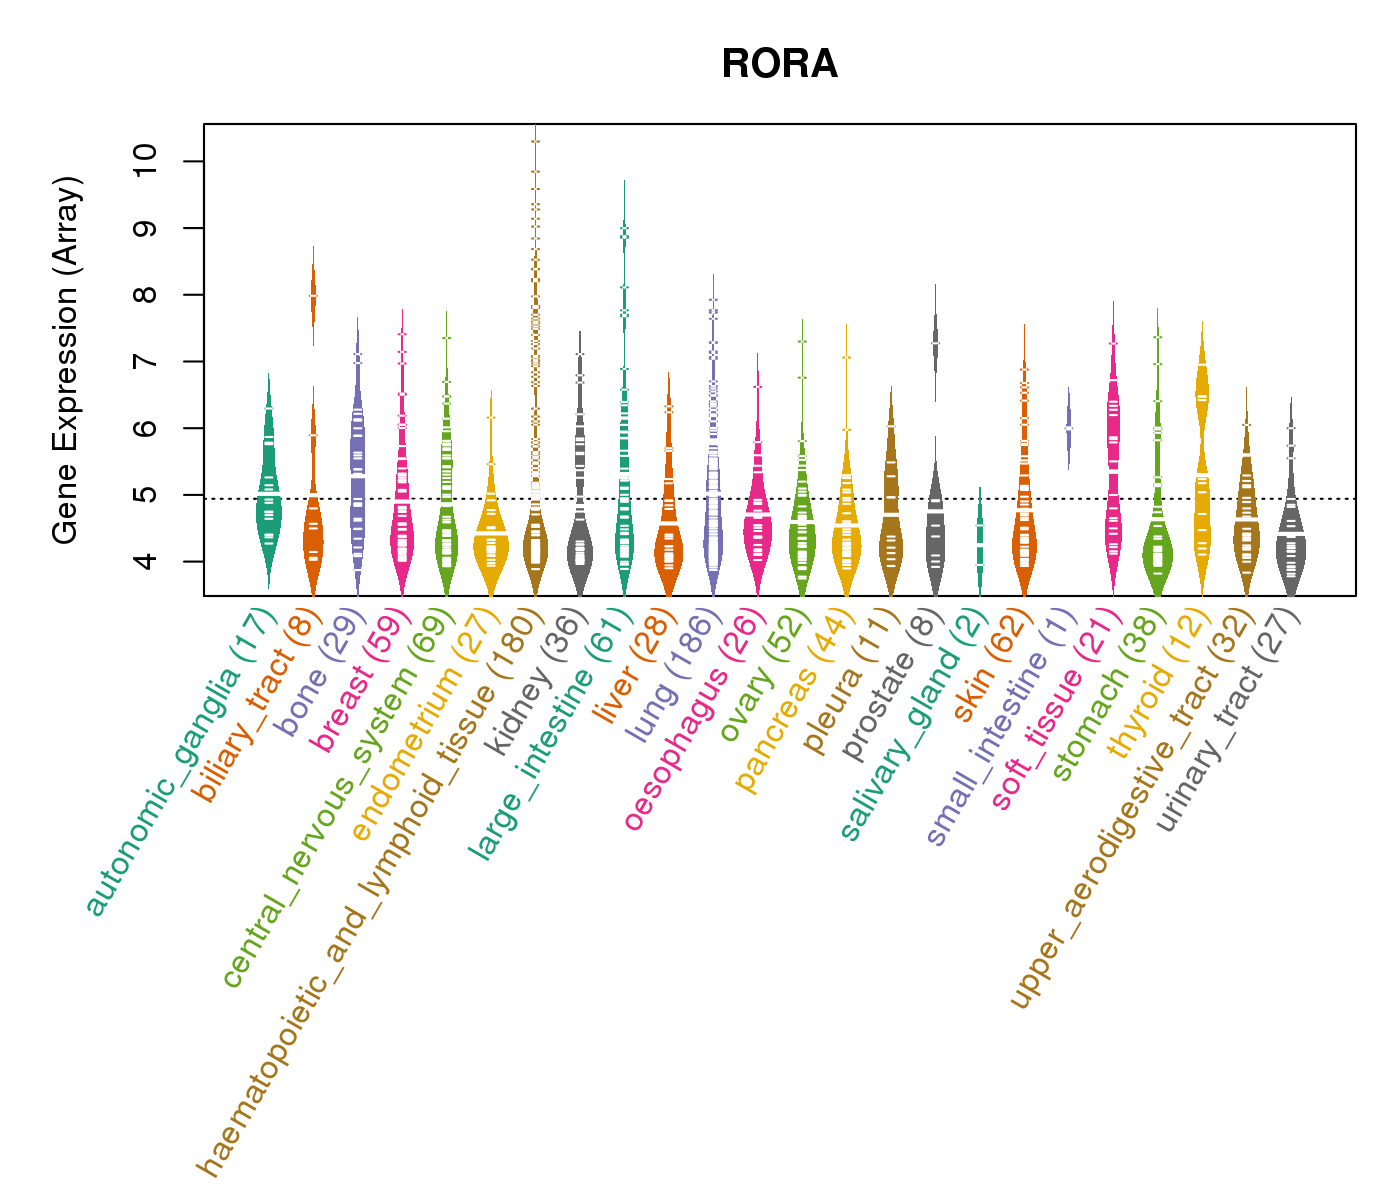 |
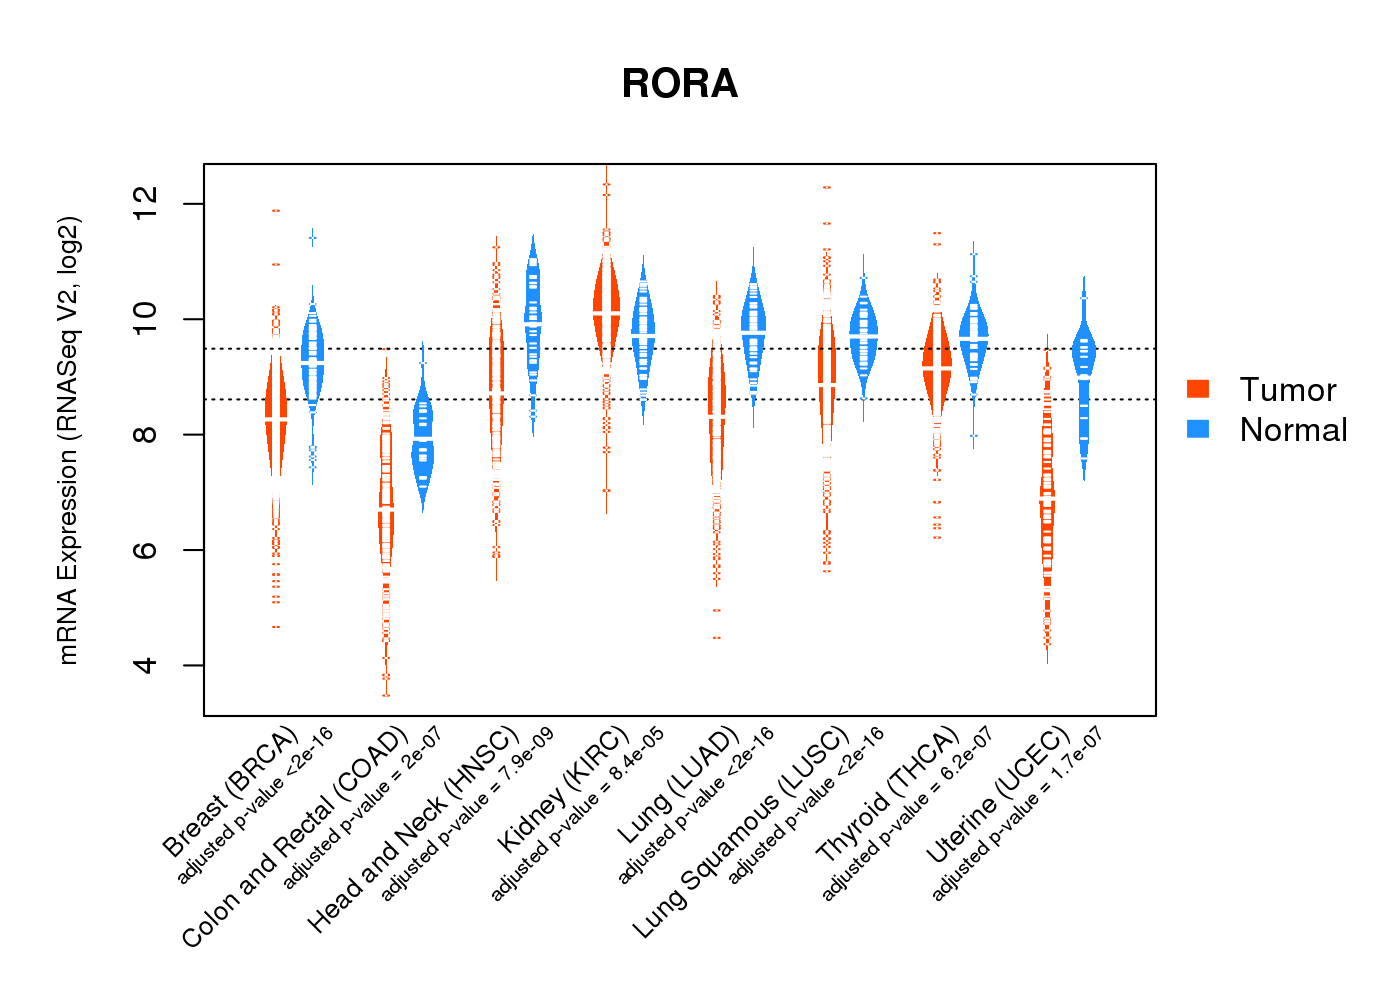
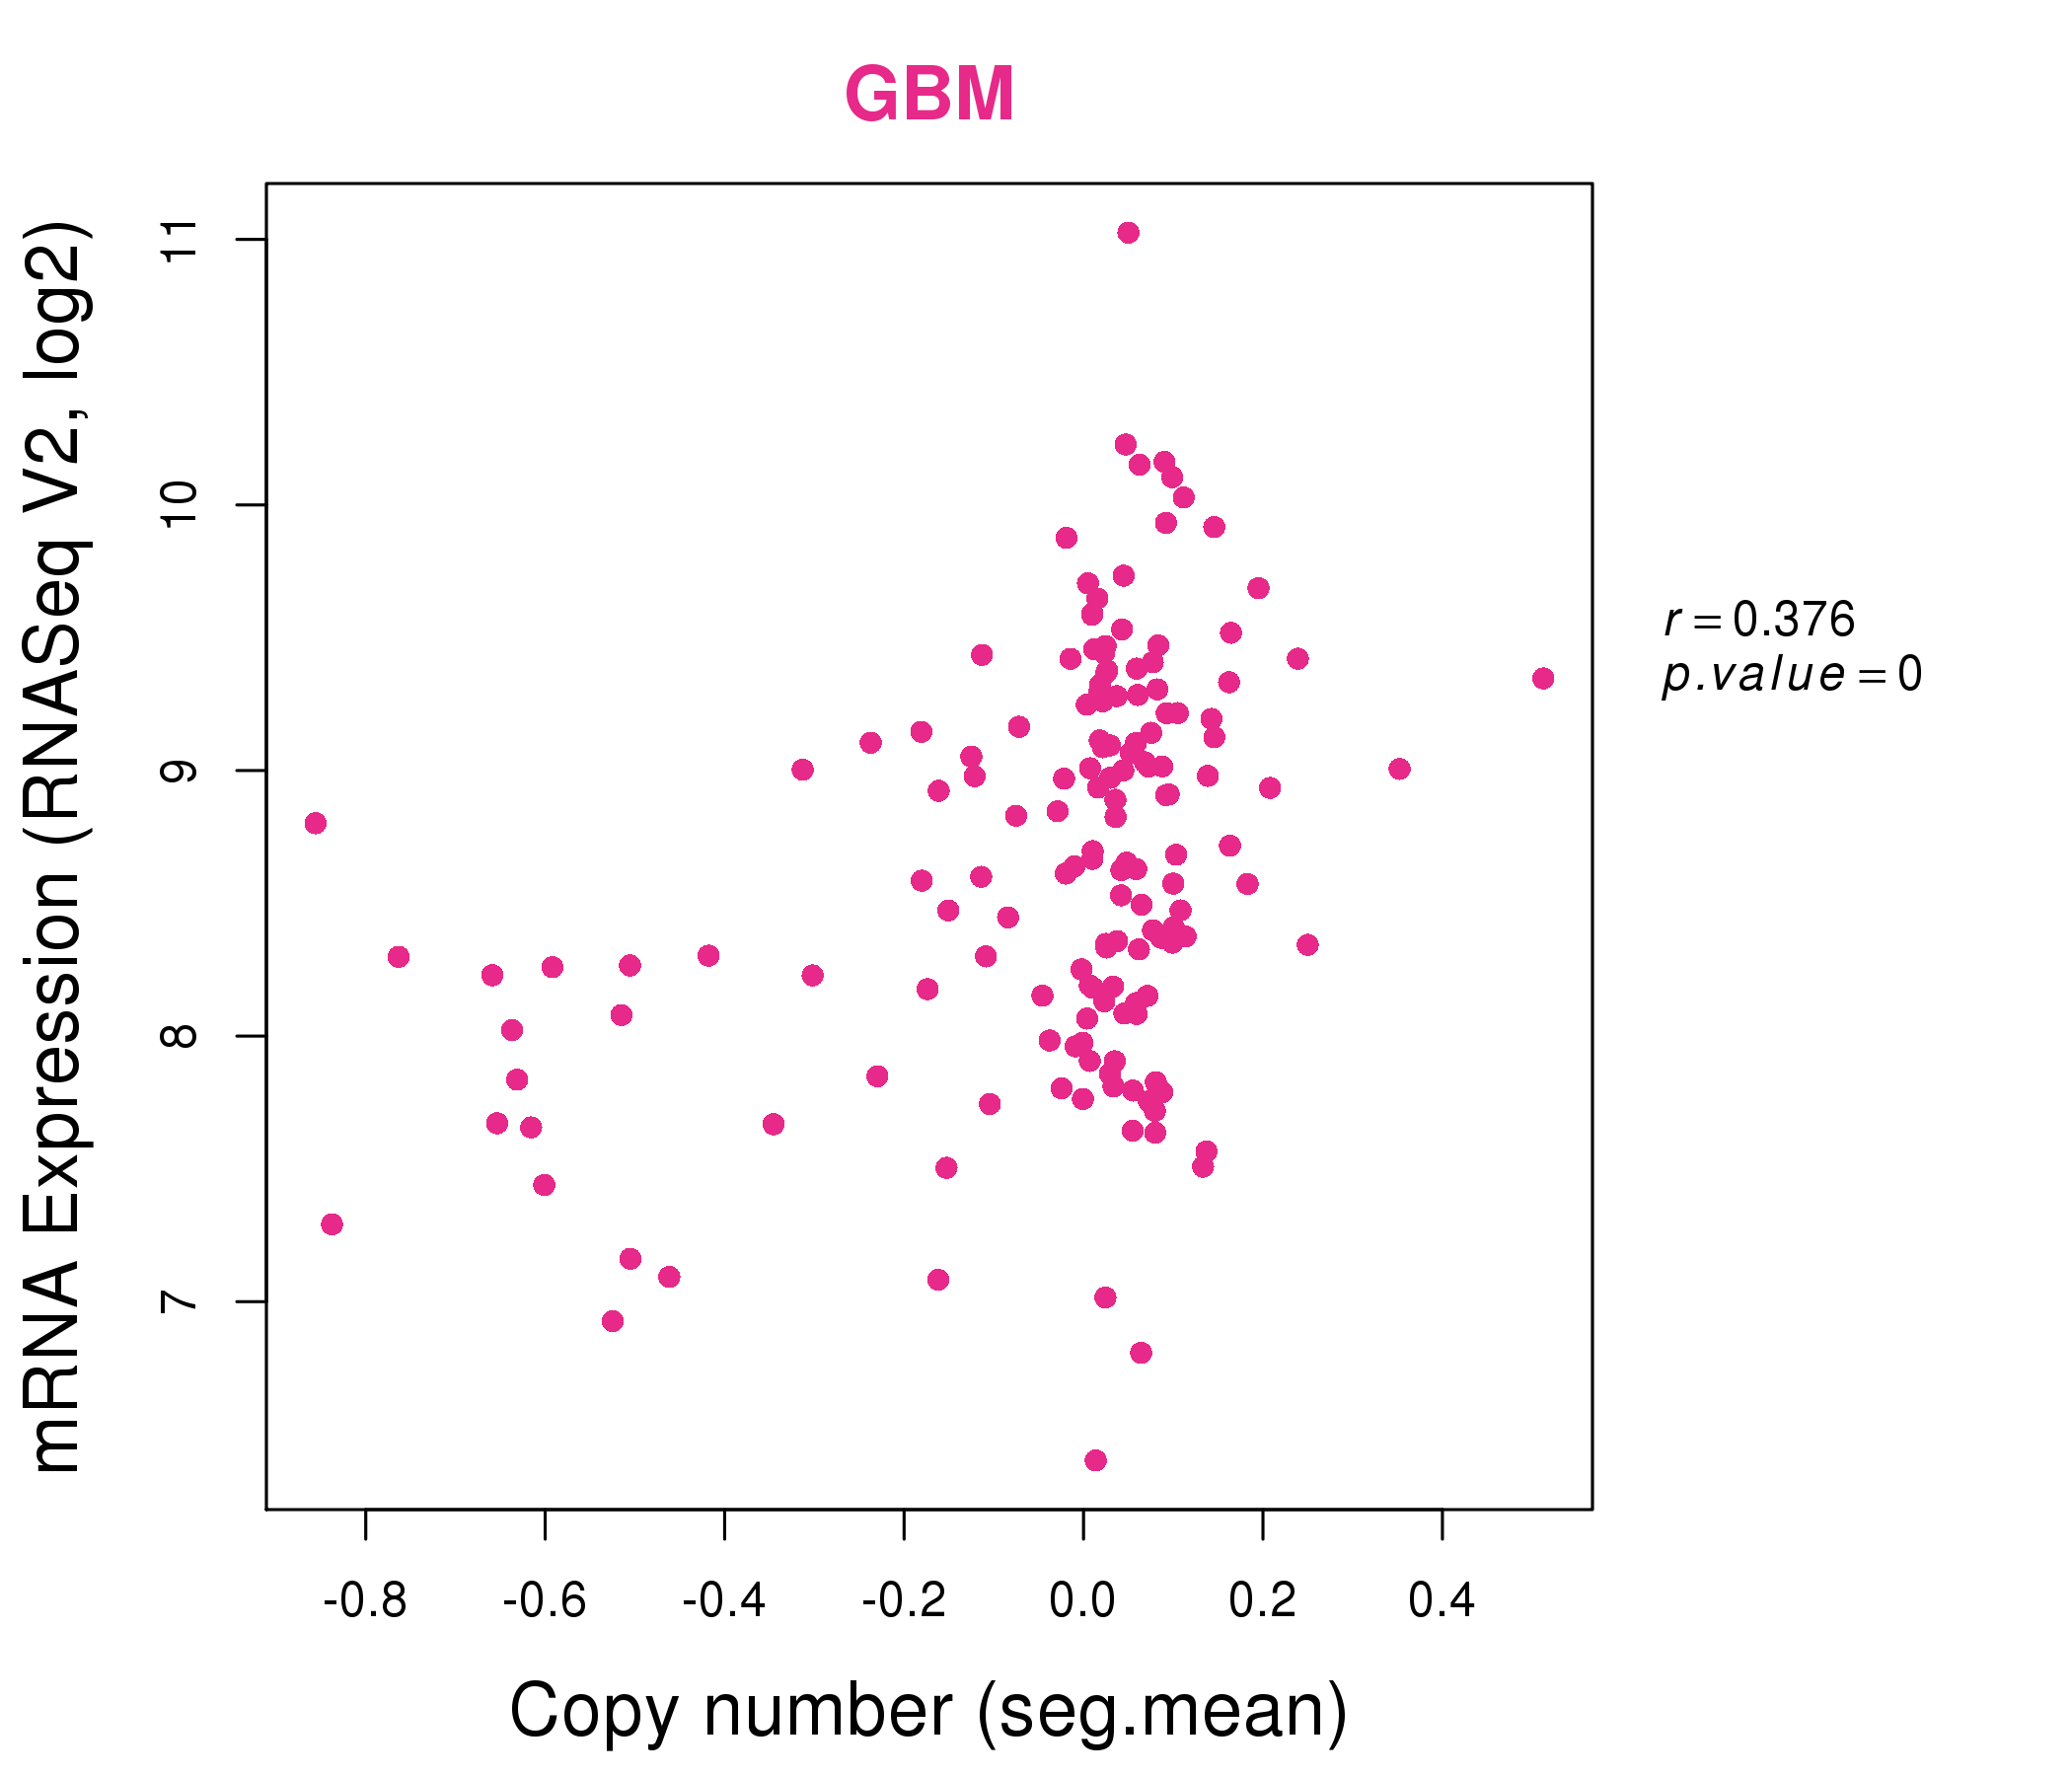
| * Normalized gene expression data of RNASeqV2 was extracted from TCGA using R package TCGA-Assembler. The URLs of all public data files on TCGA DCC data server were gathered at Jan-05-2015. Only eight cancer types have enough normal control samples for differential expression analysis. (t test, adjusted p<0.05 (using Benjamini-Hochberg FDR)) |
 |
| Top |
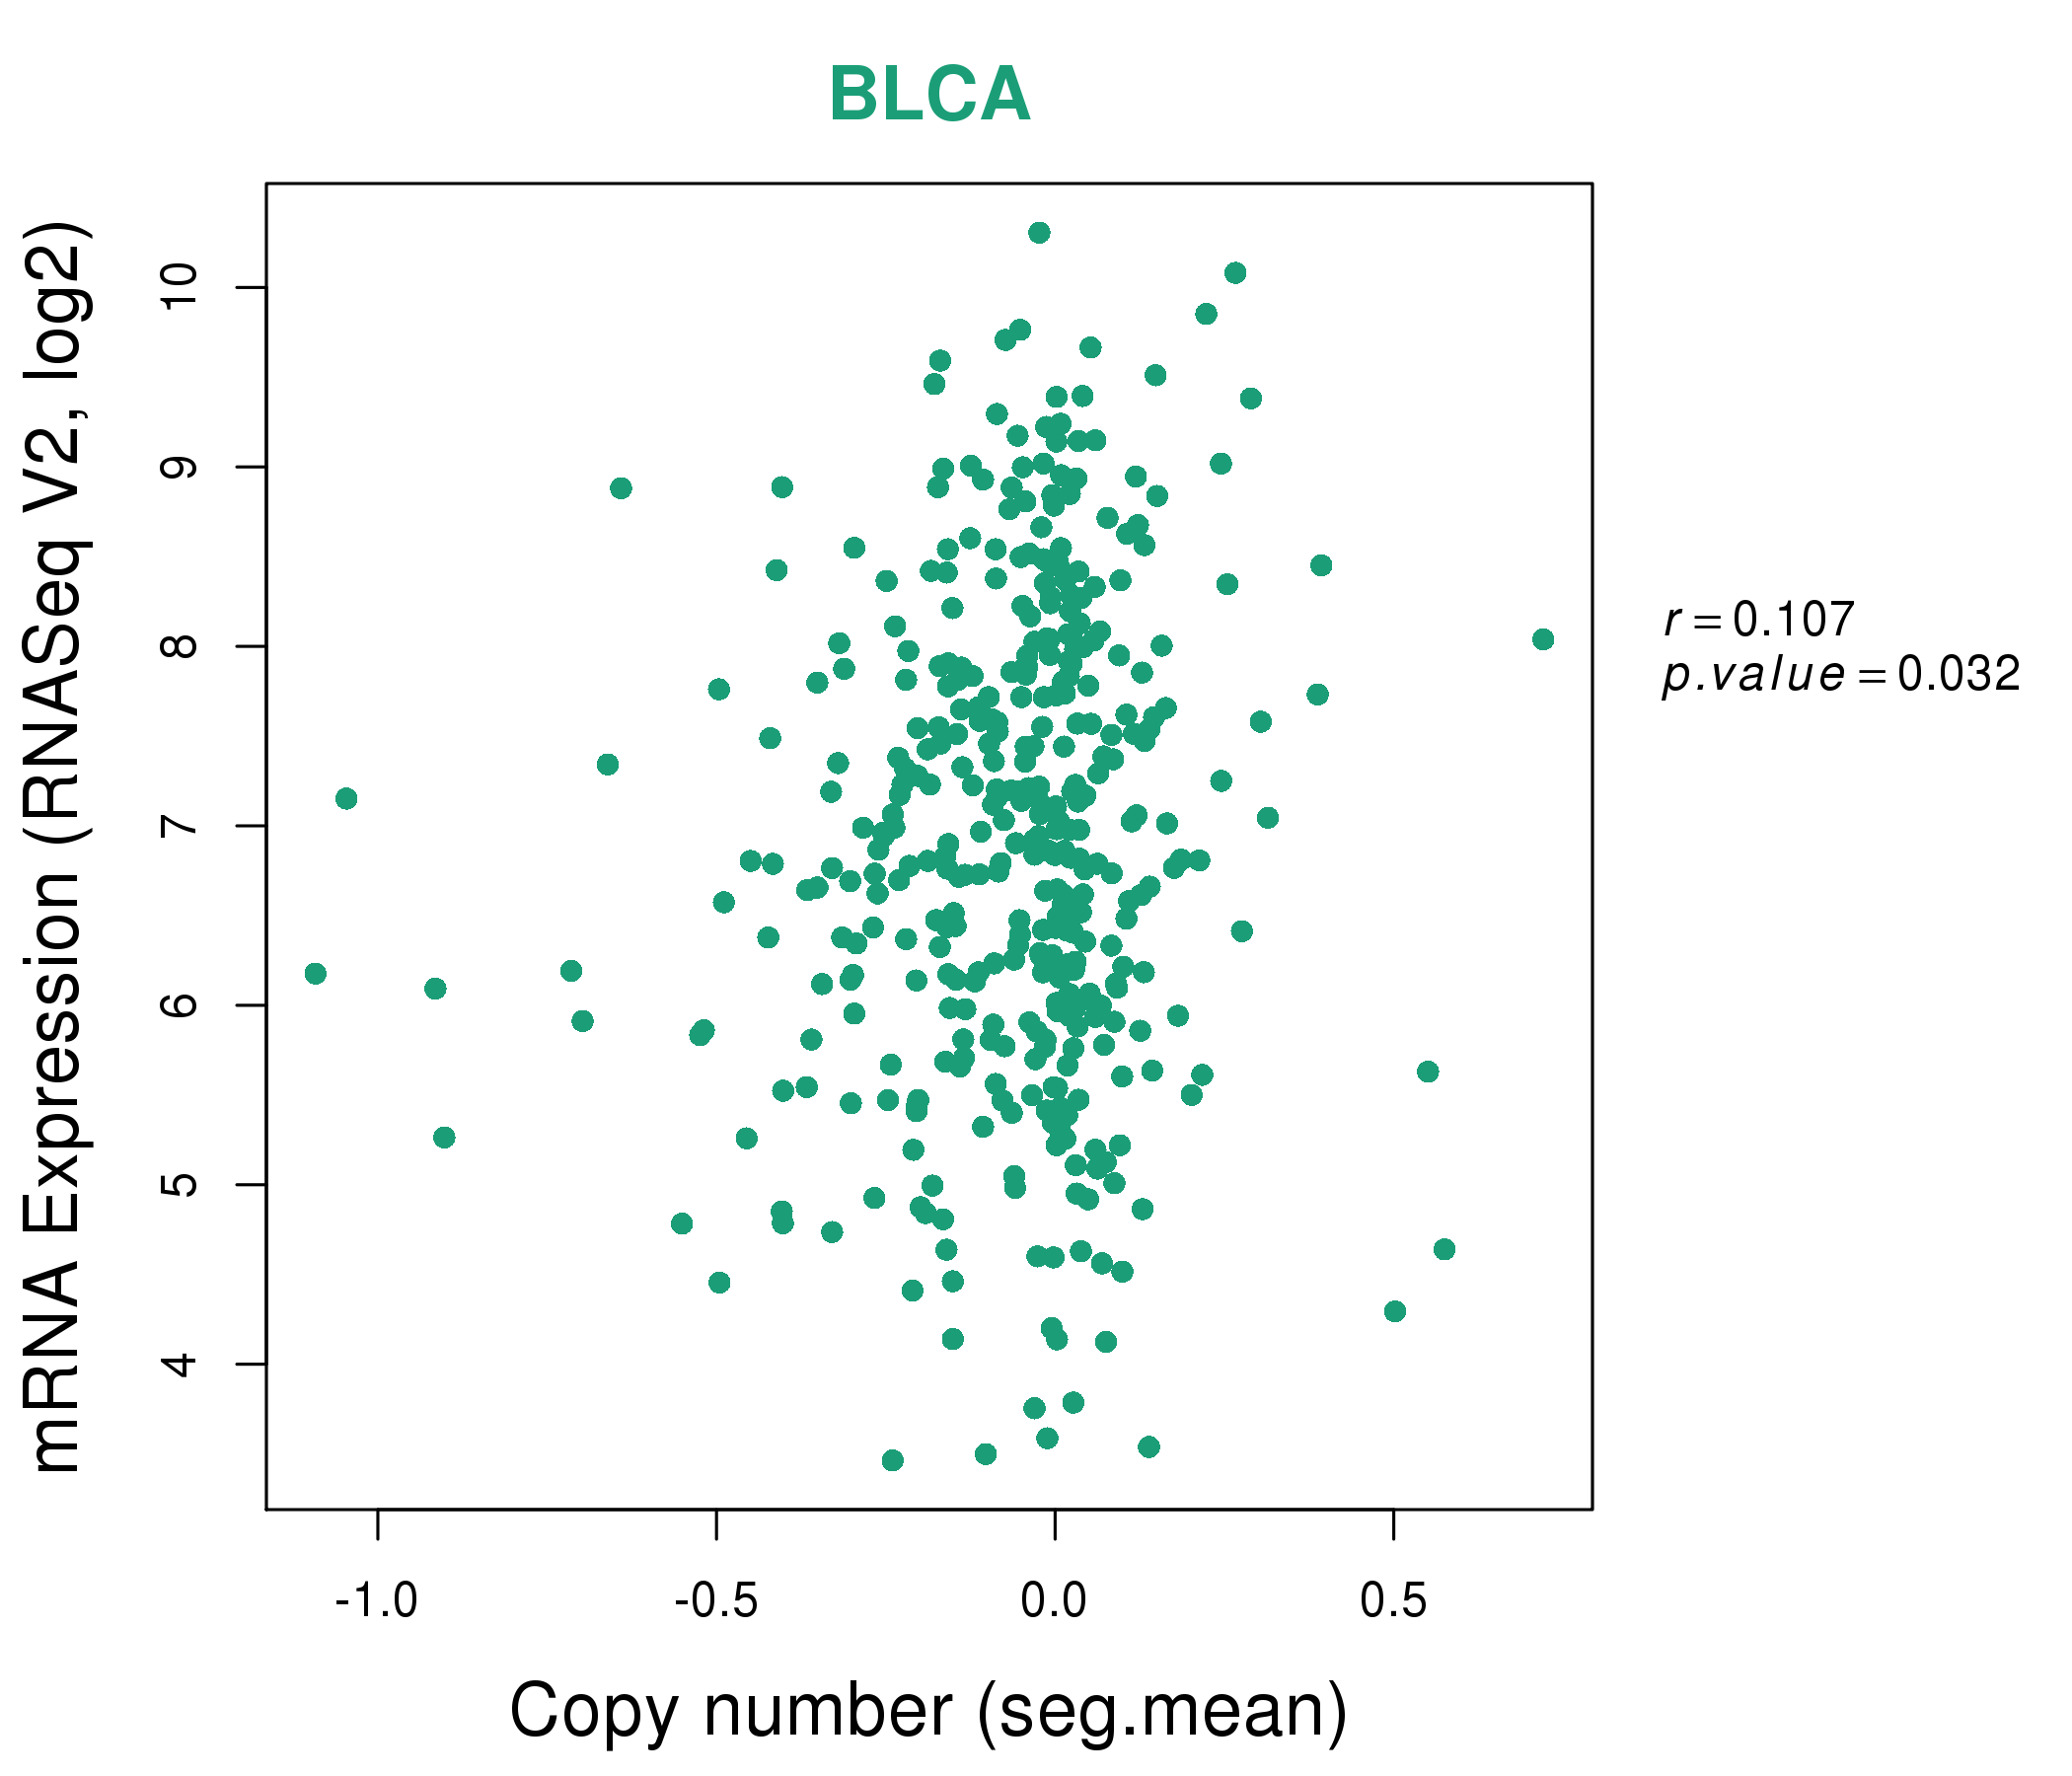
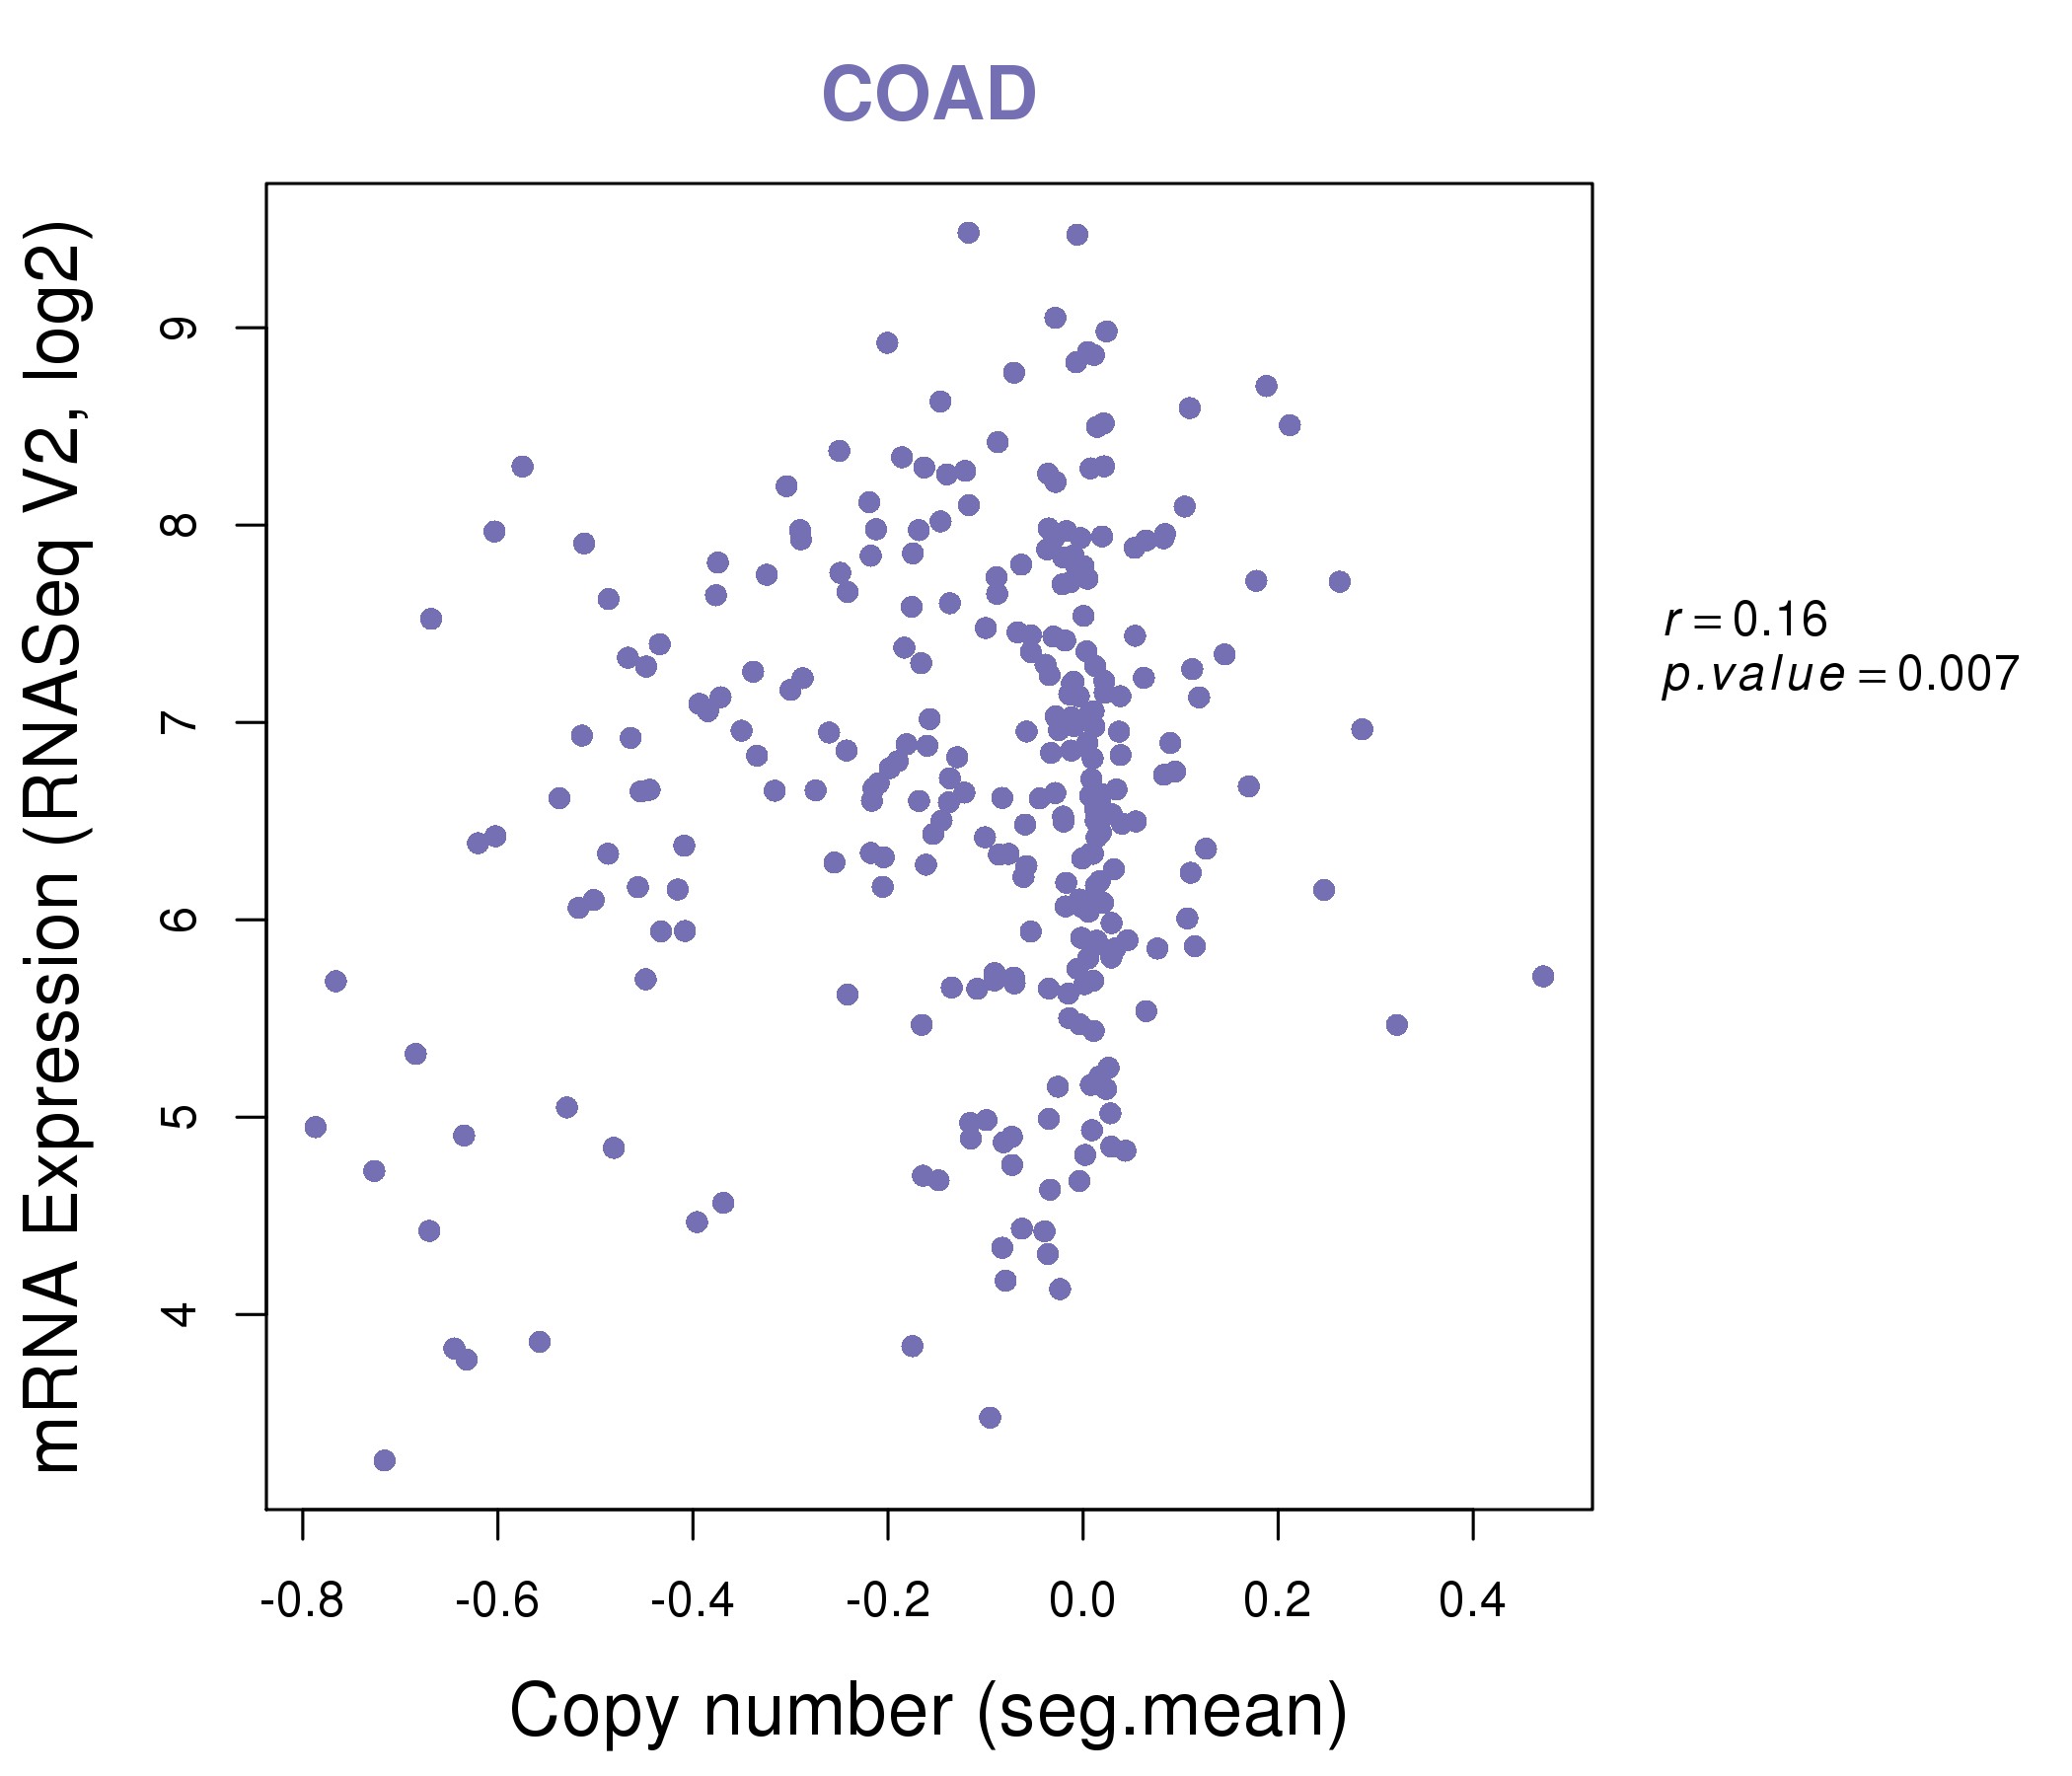
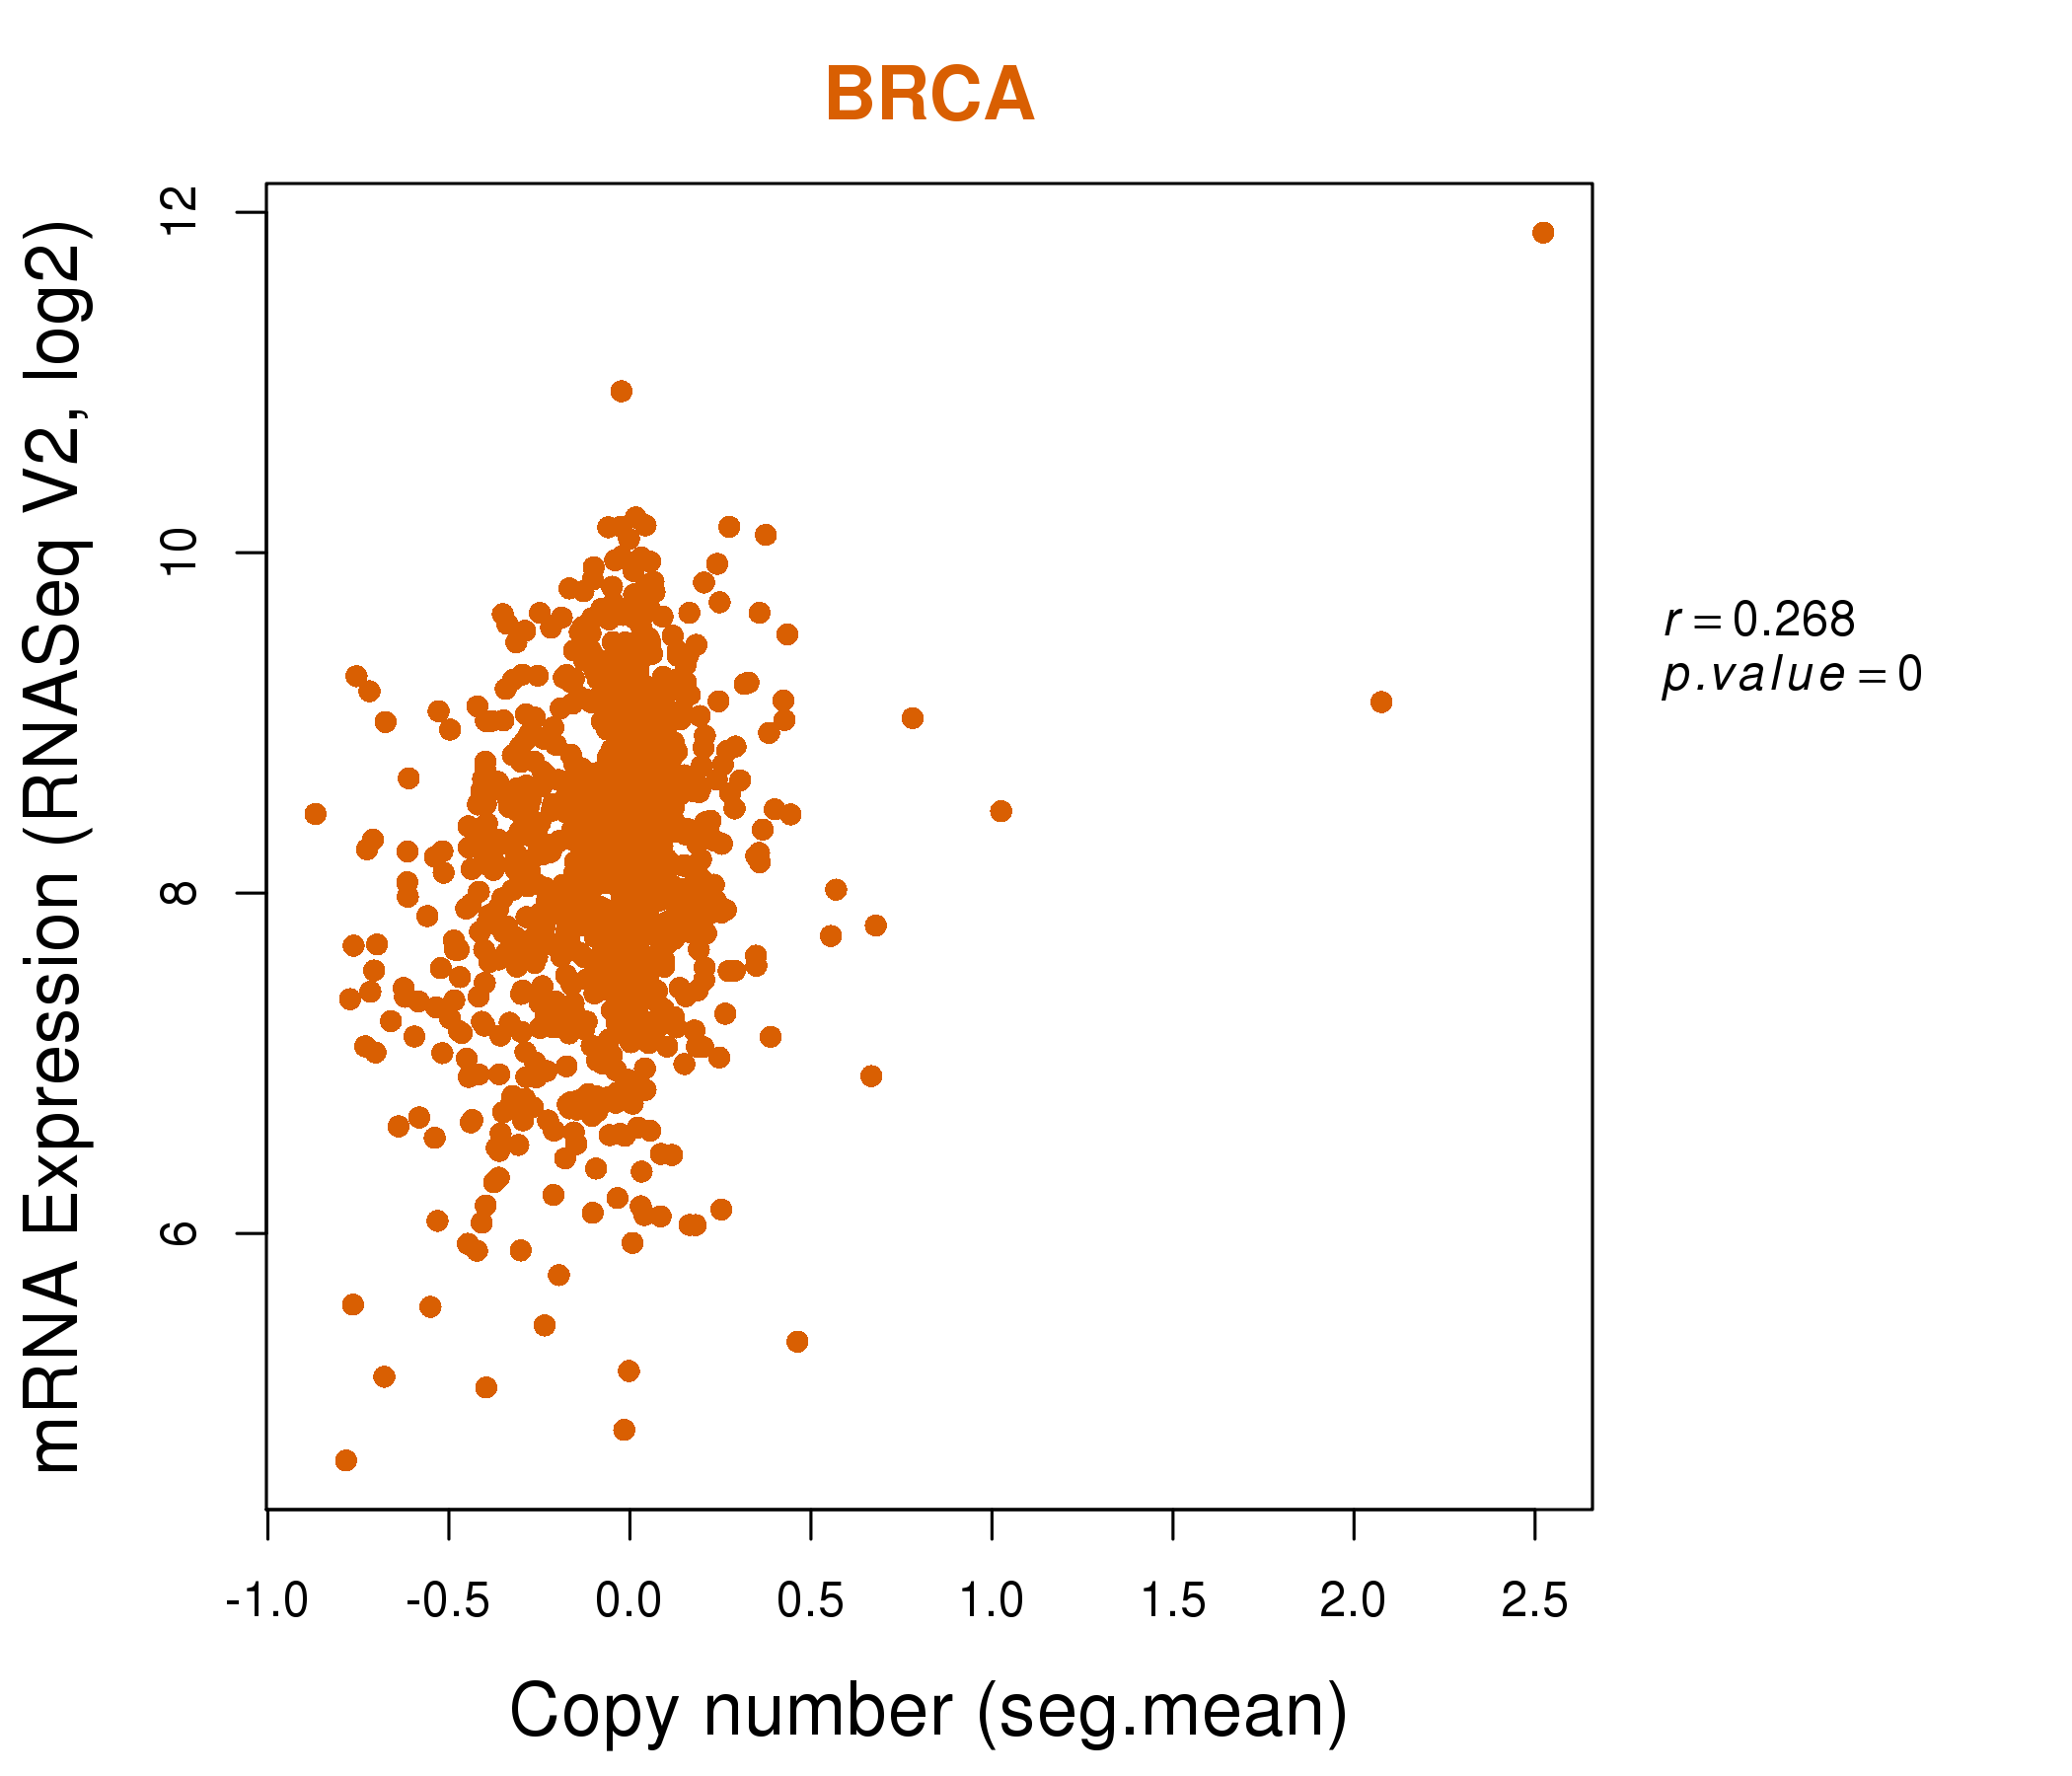
| * This plots show the correlation between CNV and gene expression. |
: Open all plots for all cancer types
 |
|
 |
|
| Top |
| Gene-Gene Network Information |
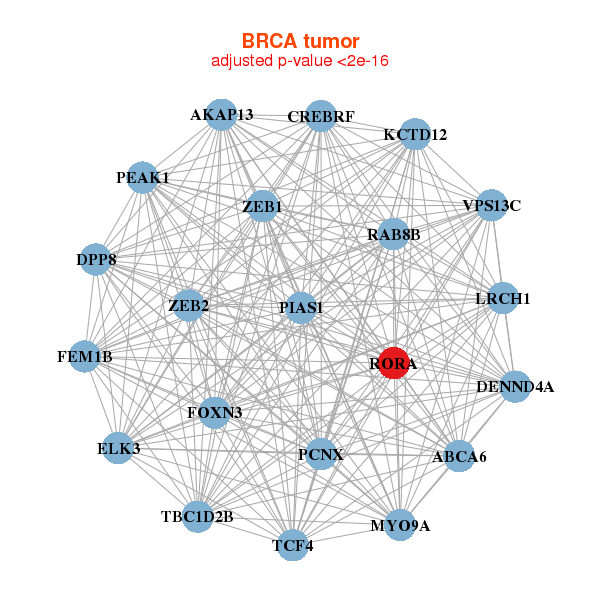
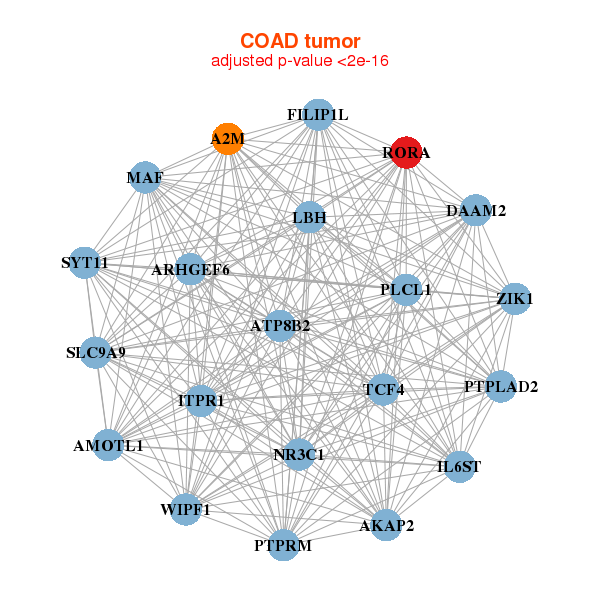
| * Co-Expression network figures were drawn using R package igraph. Only the top 20 genes with the highest correlations were shown. Red circle: input gene, orange circle: cell metabolism gene, sky circle: other gene |
: Open all plots for all cancer types
 |
| ||||
| ABCA6,AKAP13,CREBRF,DENND4A,DPP8,ELK3,FEM1B, FOXN3,KCTD12,LRCH1,MYO9A,PCNX,PIAS1,RAB8B, RORA,PEAK1,TBC1D2B,TCF4,VPS13C,ZEB1,ZEB2 | AHCYL2,CEP85L,CUL5,DENND2C,DPP8,CCSER2,HECTD1, HERC1,IBTK,KIAA2018,LOC729082,MEF2A,NEDD4,OTUD4, PPTC7,PYGO1,RORA,SOS2,TNKS2,USP15,WDR47 | ||||
 |
| ||||
| A2M,AKAP2,AMOTL1,ARHGEF6,ATP8B2,DAAM2,FILIP1L, IL6ST,ITPR1,LBH,MAF,NR3C1,PLCL1,PTPLAD2, PTPRM,RORA,SLC9A9,SYT11,TCF4,WIPF1,ZIK1 | ABCA3,EFS,ENO2,FGFR1,HSPA12A,KCNIP3,KCTD7, KLC1,LIX1L,NCAM1,NFIA,POU6F1,RIC3,RORA, SLC12A4,SLC45A1,SLC4A3,SYT11,TCF7L1,TMEM43,TRO |
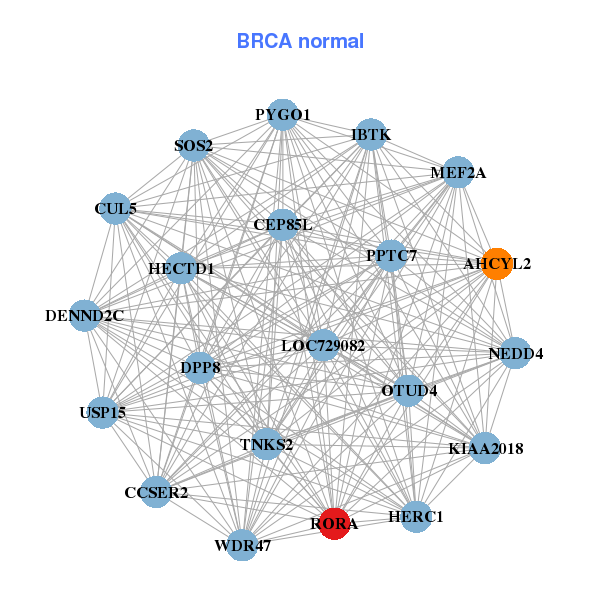
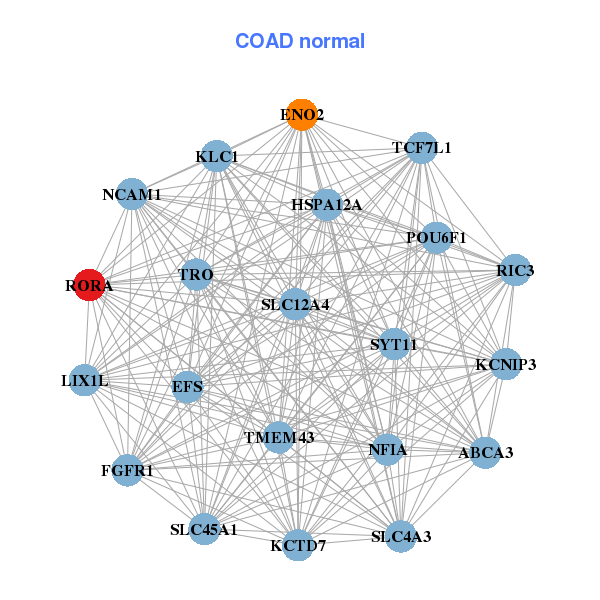
| * Co-Expression network figures were drawn using R package igraph. Only the top 20 genes with the highest correlations were shown. Red circle: input gene, orange circle: cell metabolism gene, sky circle: other gene |
: Open all plots for all cancer types
| Top |
: Open all interacting genes' information including KEGG pathway for all interacting genes from DAVID
| Top |
| Pharmacological Information for RORA |
| DB Category | DB Name | DB's ID and Url link |
| Chemistry | BindingDB | P35398; -. |
| Chemistry | ChEMBL | CHEMBL5868; -. |
| Chemistry | GuidetoPHARMACOLOGY | 598; -. |
| Organism-specific databases | PharmGKB | PA34630; -. |
| Organism-specific databases | CTD | 6095; -. |
| * Gene Centered Interaction Network. |
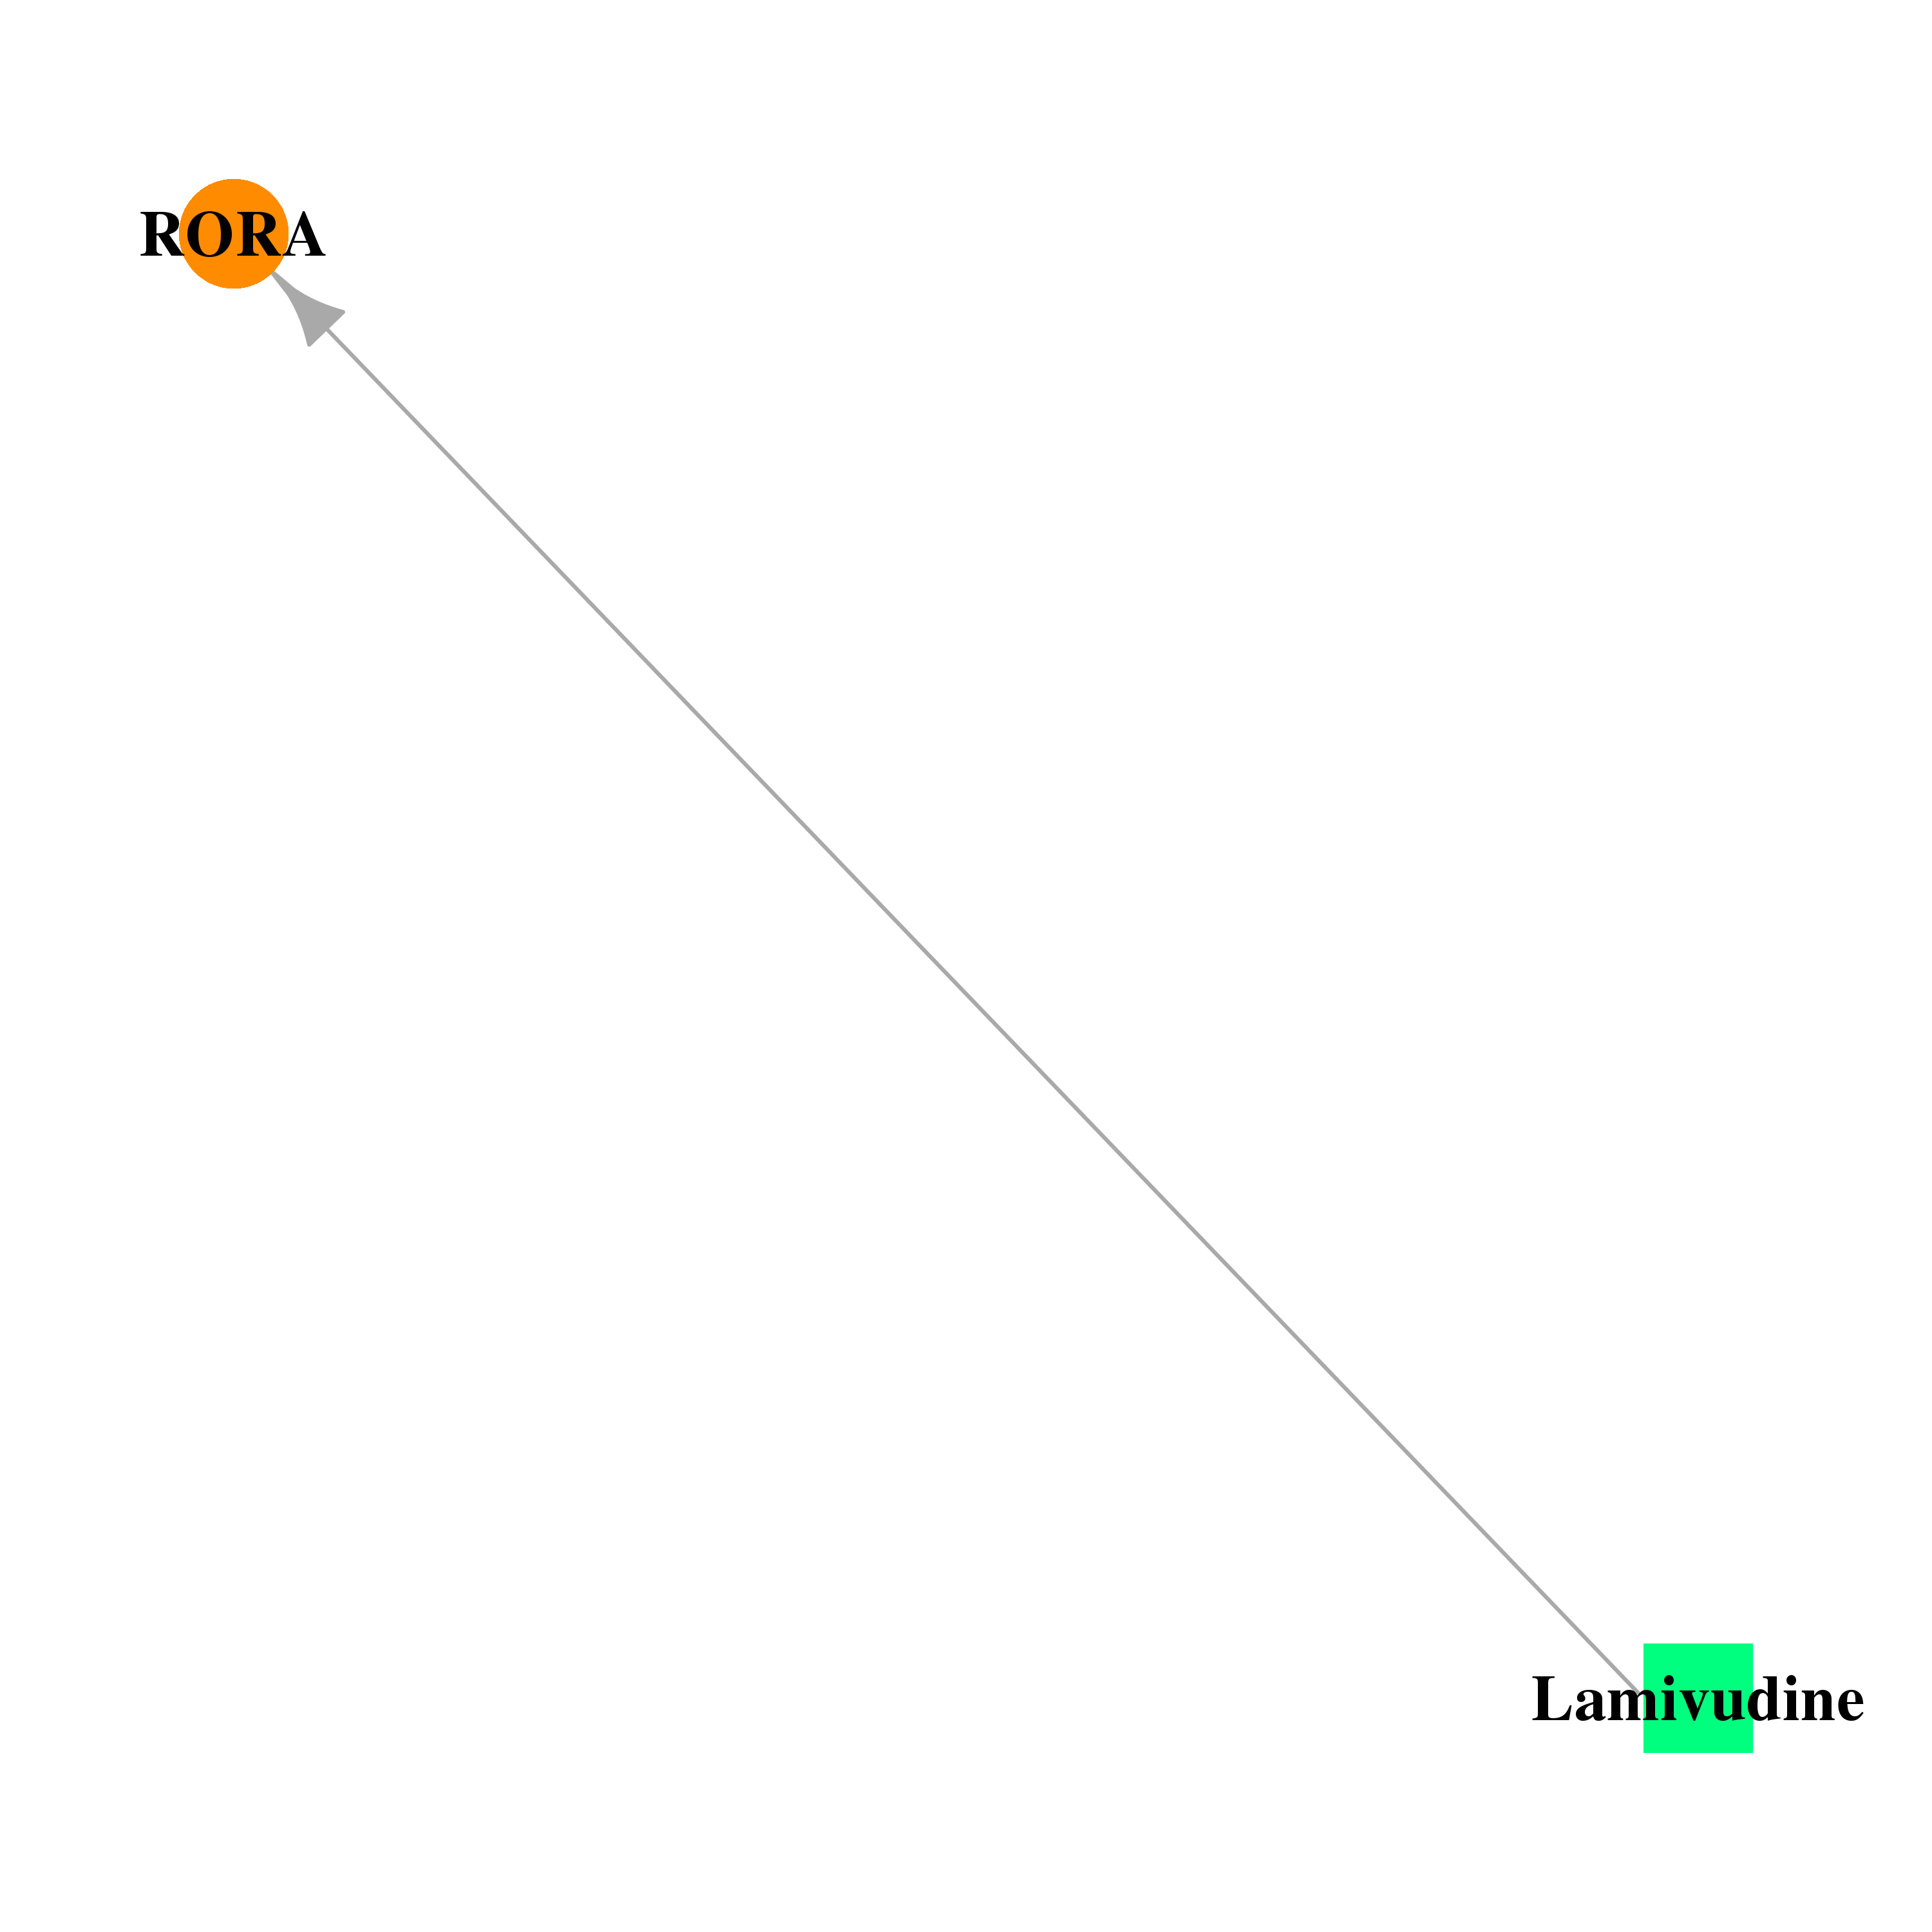 |
| * Drug Centered Interaction Network. |
| DrugBank ID | Target Name | Drug Groups | Generic Name | Drug Centered Network | Drug Structure |
| DB00709 | RAR-related orphan receptor A | approved; investigational | Lamivudine |  | 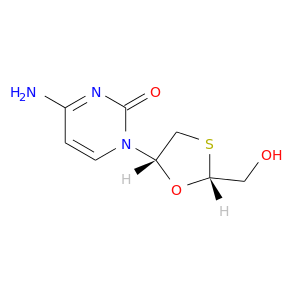 |
| Top |
| Cross referenced IDs for RORA |
| * We obtained these cross-references from Uniprot database. It covers 150 different DBs, 18 categories. http://www.uniprot.org/help/cross_references_section |
: Open all cross reference information
|
Copyright © 2016-Present - The Univsersity of Texas Health Science Center at Houston @ |