|
||||||||||||||||||||
| |
| Phenotypic Information (metabolism pathway, cancer, disease, phenome) |
| |
| |
| Gene-Gene Network Information: Co-Expression Network, Interacting Genes & KEGG |
| |
|


| Gene Summary for RPL4 |
| Basic gene info. | Gene symbol | RPL4 |
| Gene name | ribosomal protein L4 | |
| Synonyms | L4 | |
| Cytomap | UCSC genome browser: 15q22 | |
| Genomic location | chr15 :66791652-66797193 | |
| Type of gene | protein-coding | |
| RefGenes | NM_000968.3, | |
| Ensembl id | ENSG00000174444 | |
| Description | 60S ribosomal protein L160S ribosomal protein L4 | |
| Modification date | 20141207 | |
| dbXrefs | MIM : 180479 | |
| HGNC : HGNC | ||
| HPRD : 01607 | ||
| Protein | UniProt: P36578 go to UniProt's Cross Reference DB Table | |
| Expression | CleanEX: HS_RPL4 | |
| BioGPS: 6124 | ||
| Gene Expression Atlas: ENSG00000174444 | ||
| The Human Protein Atlas: ENSG00000174444 | ||
| Pathway | NCI Pathway Interaction Database: RPL4 | |
| KEGG: RPL4 | ||
| REACTOME: RPL4 | ||
| ConsensusPathDB | ||
| Pathway Commons: RPL4 | ||
| Metabolism | MetaCyc: RPL4 | |
| HUMANCyc: RPL4 | ||
| Regulation | Ensembl's Regulation: ENSG00000174444 | |
| miRBase: chr15 :66,791,652-66,797,193 | ||
| TargetScan: NM_000968 | ||
| cisRED: ENSG00000174444 | ||
| Context | iHOP: RPL4 | |
| cancer metabolism search in PubMed: RPL4 | ||
| UCL Cancer Institute: RPL4 | ||
| Assigned class in ccmGDB | B - This gene belongs to cancer gene. | |
| Top |
| Phenotypic Information for RPL4(metabolism pathway, cancer, disease, phenome) |
| Cancer | CGAP: RPL4 |
| Familial Cancer Database: RPL4 | |
| * This gene is included in those cancer gene databases. |
|
|
|
|
|
| . | ||||||||||||||
Oncogene 1 | Significant driver gene in | |||||||||||||||||||
| cf) number; DB name 1 Oncogene; http://nar.oxfordjournals.org/content/35/suppl_1/D721.long, 2 Tumor Suppressor gene; https://bioinfo.uth.edu/TSGene/, 3 Cancer Gene Census; http://www.nature.com/nrc/journal/v4/n3/abs/nrc1299.html, 4 CancerGenes; http://nar.oxfordjournals.org/content/35/suppl_1/D721.long, 5 Network of Cancer Gene; http://ncg.kcl.ac.uk/index.php, 1Therapeutic Vulnerabilities in Cancer; http://cbio.mskcc.org/cancergenomics/statius/ |
| REACTOME_METABOLISM_OF_PROTEINS REACTOME_METABOLISM_OF_MRNA REACTOME_METABOLISM_OF_RNA | |
| OMIM | 180479; gene. |
| Orphanet | |
| Disease | KEGG Disease: RPL4 |
| MedGen: RPL4 (Human Medical Genetics with Condition) | |
| ClinVar: RPL4 | |
| Phenotype | MGI: RPL4 (International Mouse Phenotyping Consortium) |
| PhenomicDB: RPL4 | |
| Mutations for RPL4 |
| * Under tables are showing count per each tissue to give us broad intuition about tissue specific mutation patterns.You can go to the detailed page for each mutation database's web site. |
| There's no structural variation information in COSMIC data for this gene. |
| * From mRNA Sanger sequences, Chitars2.0 arranged chimeric transcripts. This table shows RPL4 related fusion information. |
| ID | Head Gene | Tail Gene | Accession | Gene_a | qStart_a | qEnd_a | Chromosome_a | tStart_a | tEnd_a | Gene_a | qStart_a | qEnd_a | Chromosome_a | tStart_a | tEnd_a |
| BU540332 | TMSB10 | 4 | 164 | 2 | 85132778 | 85133222 | RPL4 | 156 | 284 | 15 | 66791658 | 66791786 | |
| DN601711 | RPL4 | 1 | 366 | 15 | 66794971 | 66795836 | ACTN1 | 363 | 748 | 14 | 69345177 | 69347620 | |
| DA300676 | RPL4 | 1 | 83 | 15 | 66795163 | 66795245 | LOC653739 | 84 | 579 | 7 | 134832839 | 134849481 | |
| DA783707 | RPL4 | 1 | 97 | 15 | 66795149 | 66795245 | HS6ST3 | 97 | 594 | 13 | 97487488 | 97487986 | |
| BG910912 | RPL4 | 1 | 313 | 15 | 66795396 | 66797157 | OGFOD2 | 314 | 827 | 12 | 123462872 | 123463558 | |
| DB504144 | RPL4 | 2 | 360 | 15 | 66795396 | 66797205 | LOC100505761 | 361 | 480 | 10 | 104215798 | 104215917 | |
| DB575395 | RPL4 | 1 | 222 | 15 | 66795396 | 66795810 | LOC100505761 | 223 | 474 | 10 | 104215798 | 104216049 | |
| BU932269 | SPCS1 | 3 | 121 | 3 | 52740135 | 52740253 | RPL4 | 115 | 652 | 15 | 66793772 | 66795784 | |
| AK290436 | TMTC3 | 1 | 2907 | 12 | 88536073 | 88589368 | RPL4 | 2900 | 3004 | 15 | 66791661 | 66791765 | |
| BC001010 | CDK4 | 681 | 772 | 12 | 58145029 | 58145120 | RPL4 | 773 | 2172 | 15 | 66791666 | 66797165 | |
| AV754796 | RPL4 | 27 | 99 | 15 | 66794352 | 66794428 | KRT222 | 84 | 284 | 17 | 38811870 | 38812069 | |
| Top |
| There's no copy number variation information in COSMIC data for this gene. |
| Top |
|
 |
| Top |
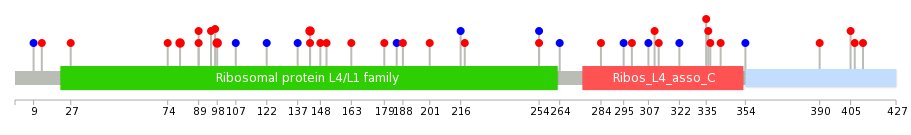
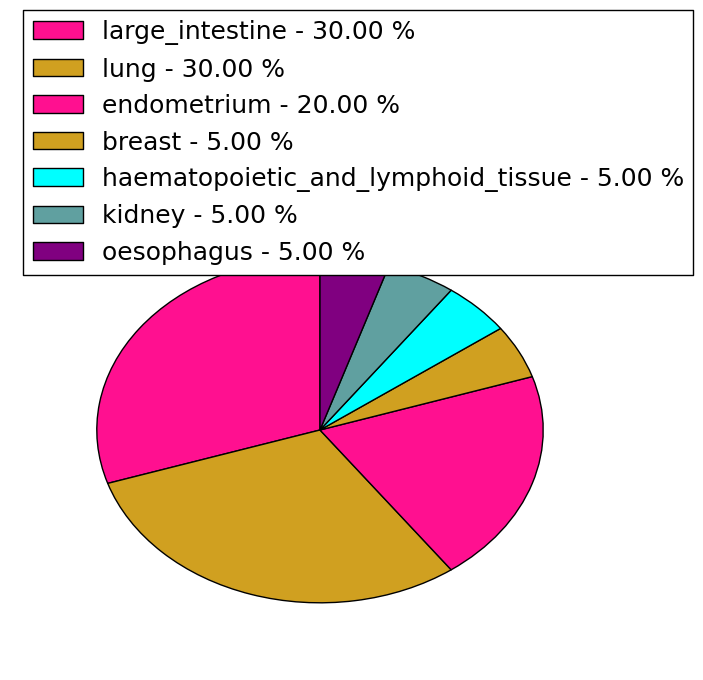
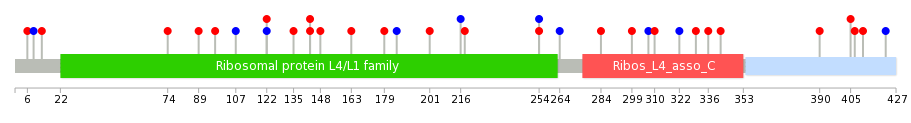
| Stat. for Non-Synonymous SNVs (# total SNVs=20) | (# total SNVs=7) |
 |  |
(# total SNVs=0) | (# total SNVs=0) |
| Top |
| * When you move the cursor on each content, you can see more deailed mutation information on the Tooltip. Those are primary_site,primary_histology,mutation(aa),pubmedID. |
| GRCh37 position | Mutation(aa) | Unique sampleID count |
| chr15:66795439-66795439 | p.R80Q | 2 |
| chr15:66794245-66794245 | p.R143C | 2 |
| chr15:66795078-66795078 | p.G98E | 2 |
| chr15:66791814-66791814 | p.K405N | 1 |
| chr15:66795082-66795082 | p.R97C | 1 |
| chr15:66792653-66792653 | p.Q299K | 1 |
| chr15:66794137-66794137 | p.D179H | 1 |
| chr15:66791860-66791860 | p.K390T | 1 |
| chr15:66795088-66795088 | p.M95V | 1 |
| chr15:66792663-66792663 | p.S295S | 1 |
| Top |
|
 |
| Point Mutation/ Tissue ID | 1 | 2 | 3 | 4 | 5 | 6 | 7 | 8 | 9 | 10 | 11 | 12 | 13 | 14 | 15 | 16 | 17 | 18 | 19 | 20 |
| # sample | 2 | 2 | 5 | 2 | 2 | 1 | 5 | 3 | 4 | 2 | 1 | 5 | ||||||||
| # mutation | 2 | 2 | 5 | 2 | 2 | 1 | 5 | 3 | 4 | 2 | 1 | 6 | ||||||||
| nonsynonymous SNV | 2 | 1 | 4 | 1 | 2 | 1 | 5 | 1 | 3 | 1 | 4 | |||||||||
| synonymous SNV | 1 | 1 | 1 | 2 | 1 | 2 | 2 |
| cf) Tissue ID; Tissue type (1; BLCA[Bladder Urothelial Carcinoma], 2; BRCA[Breast invasive carcinoma], 3; CESC[Cervical squamous cell carcinoma and endocervical adenocarcinoma], 4; COAD[Colon adenocarcinoma], 5; GBM[Glioblastoma multiforme], 6; Glioma Low Grade, 7; HNSC[Head and Neck squamous cell carcinoma], 8; KICH[Kidney Chromophobe], 9; KIRC[Kidney renal clear cell carcinoma], 10; KIRP[Kidney renal papillary cell carcinoma], 11; LAML[Acute Myeloid Leukemia], 12; LUAD[Lung adenocarcinoma], 13; LUSC[Lung squamous cell carcinoma], 14; OV[Ovarian serous cystadenocarcinoma ], 15; PAAD[Pancreatic adenocarcinoma], 16; PRAD[Prostate adenocarcinoma], 17; SKCM[Skin Cutaneous Melanoma], 18:STAD[Stomach adenocarcinoma], 19:THCA[Thyroid carcinoma], 20:UCEC[Uterine Corpus Endometrial Carcinoma]) |
| Top |
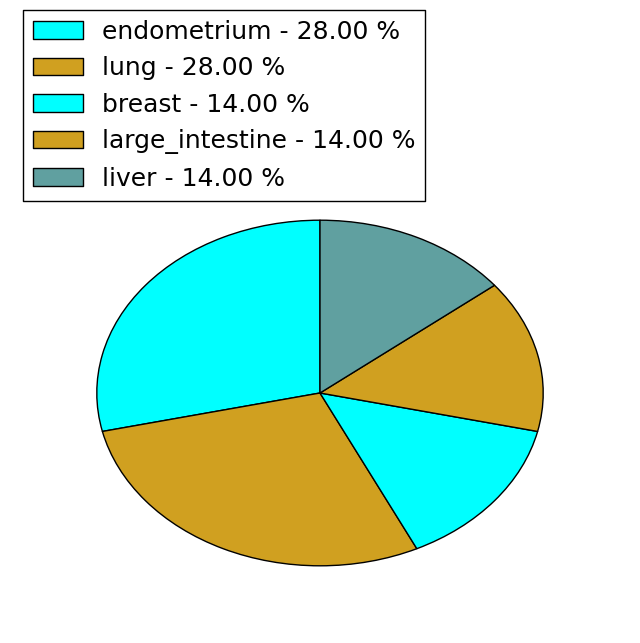
| * We represented just top 10 SNVs. When you move the cursor on each content, you can see more deailed mutation information on the Tooltip. Those are primary_site, primary_histology, mutation(aa), pubmedID. |
| Genomic Position | Mutation(aa) | Unique sampleID count |
| chr15:66791809 | p.K405N | 1 |
| chr15:66795855 | p.A185A | 1 |
| chr15:66793328 | p.K390T | 1 |
| chr15:66794245 | p.D179H | 1 |
| chr15:66791814 | p.R342C | 1 |
| chr15:66793358 | p.K163N | 1 |
| chr15:66794968 | p.R336C | 1 |
| chr15:66791860 | p.P148S | 1 |
| chr15:66793360 | p.P330Q | 1 |
| chr15:66795005 | p.R143H | 1 |
| * Copy number data were extracted from TCGA using R package TCGA-Assembler. The URLs of all public data files on TCGA DCC data server were gathered on Jan-05-2015. Function ProcessCNAData in TCGA-Assembler package was used to obtain gene-level copy number value which is calculated as the average copy number of the genomic region of a gene. |
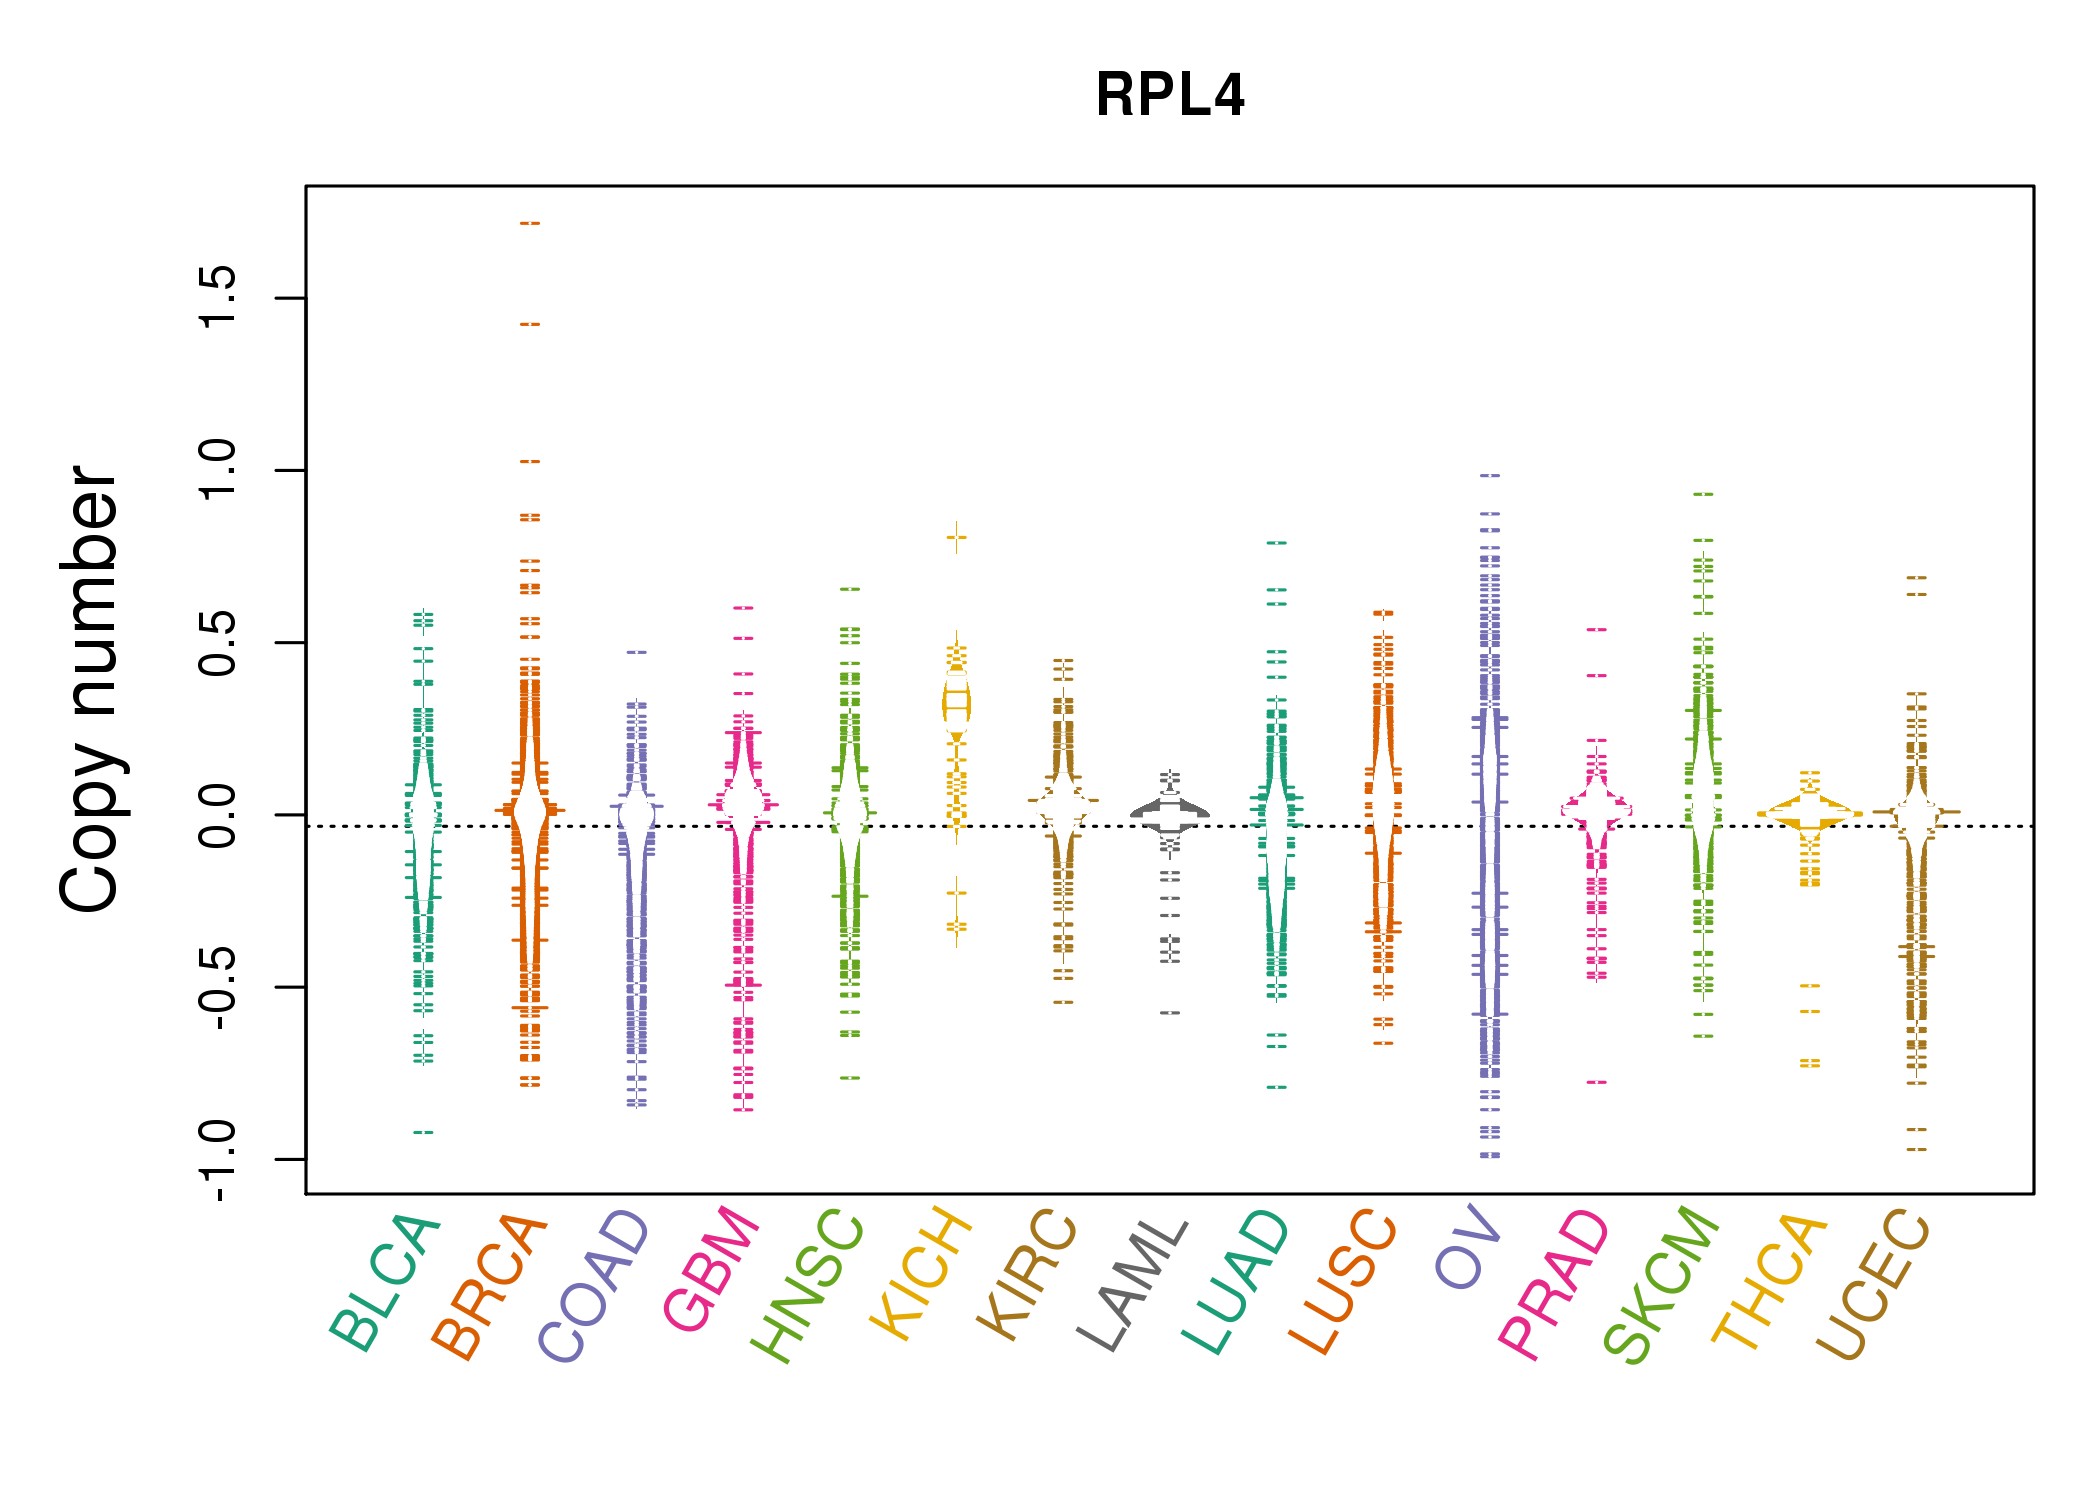 |
| cf) Tissue ID[Tissue type]: BLCA[Bladder Urothelial Carcinoma], BRCA[Breast invasive carcinoma], CESC[Cervical squamous cell carcinoma and endocervical adenocarcinoma], COAD[Colon adenocarcinoma], GBM[Glioblastoma multiforme], Glioma Low Grade, HNSC[Head and Neck squamous cell carcinoma], KICH[Kidney Chromophobe], KIRC[Kidney renal clear cell carcinoma], KIRP[Kidney renal papillary cell carcinoma], LAML[Acute Myeloid Leukemia], LUAD[Lung adenocarcinoma], LUSC[Lung squamous cell carcinoma], OV[Ovarian serous cystadenocarcinoma ], PAAD[Pancreatic adenocarcinoma], PRAD[Prostate adenocarcinoma], SKCM[Skin Cutaneous Melanoma], STAD[Stomach adenocarcinoma], THCA[Thyroid carcinoma], UCEC[Uterine Corpus Endometrial Carcinoma] |
| Top |
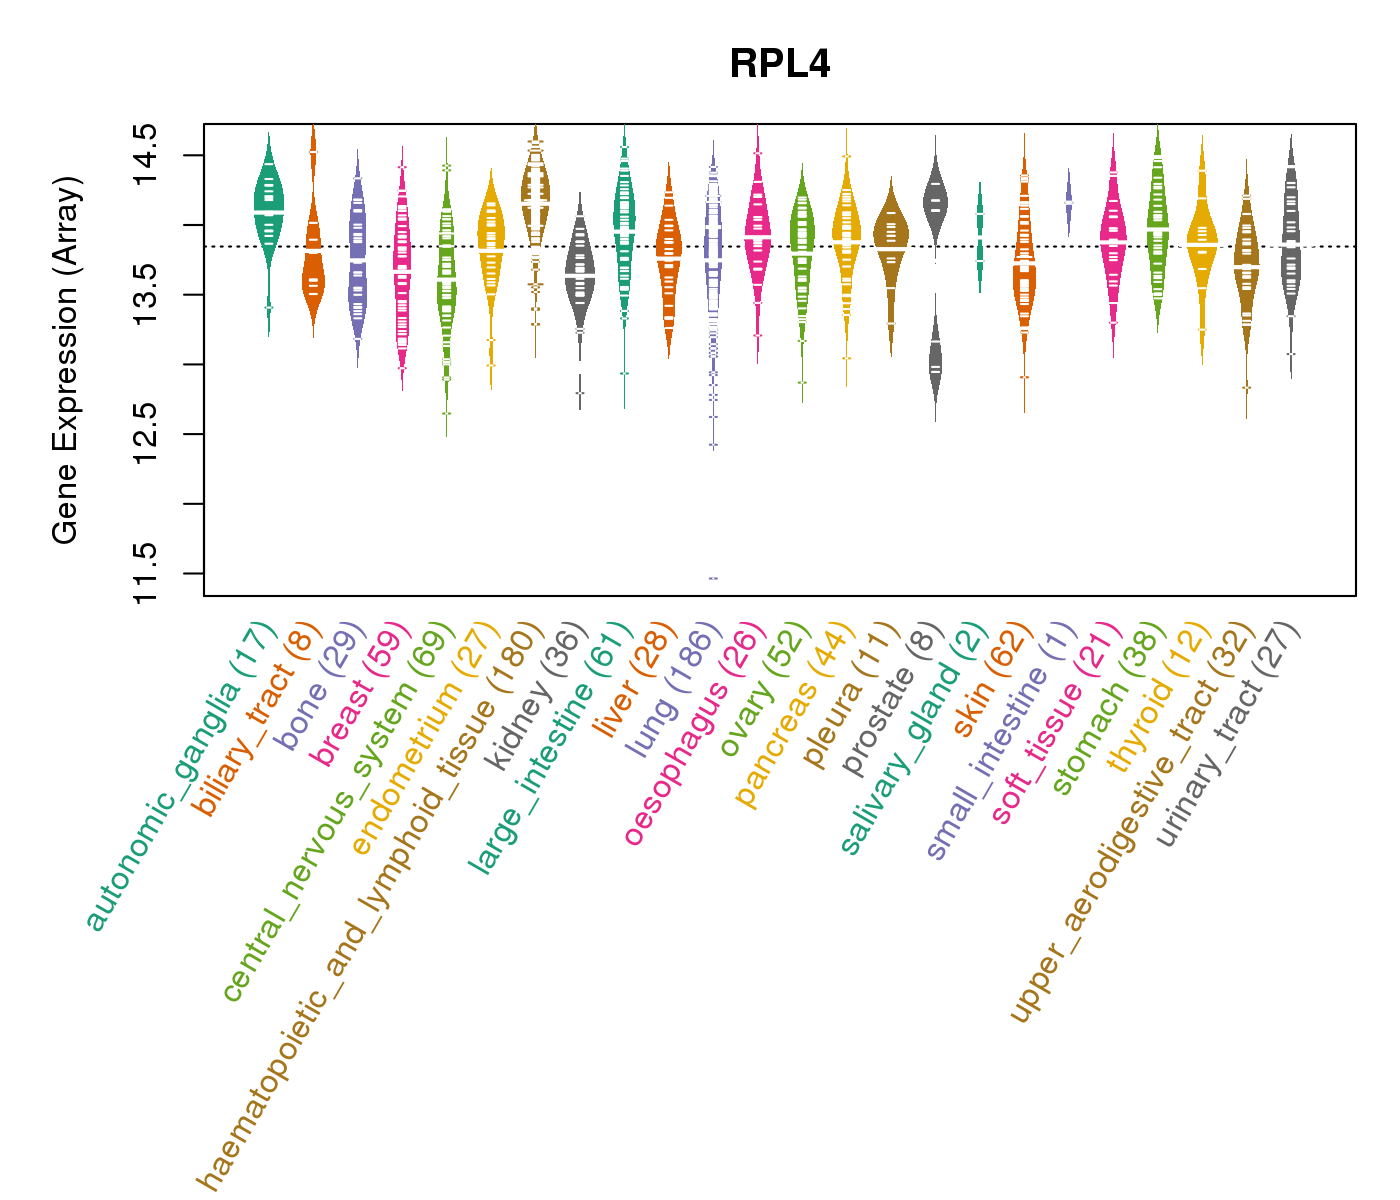
| Gene Expression for RPL4 |
| * CCLE gene expression data were extracted from CCLE_Expression_Entrez_2012-10-18.res: Gene-centric RMA-normalized mRNA expression data. |
 |
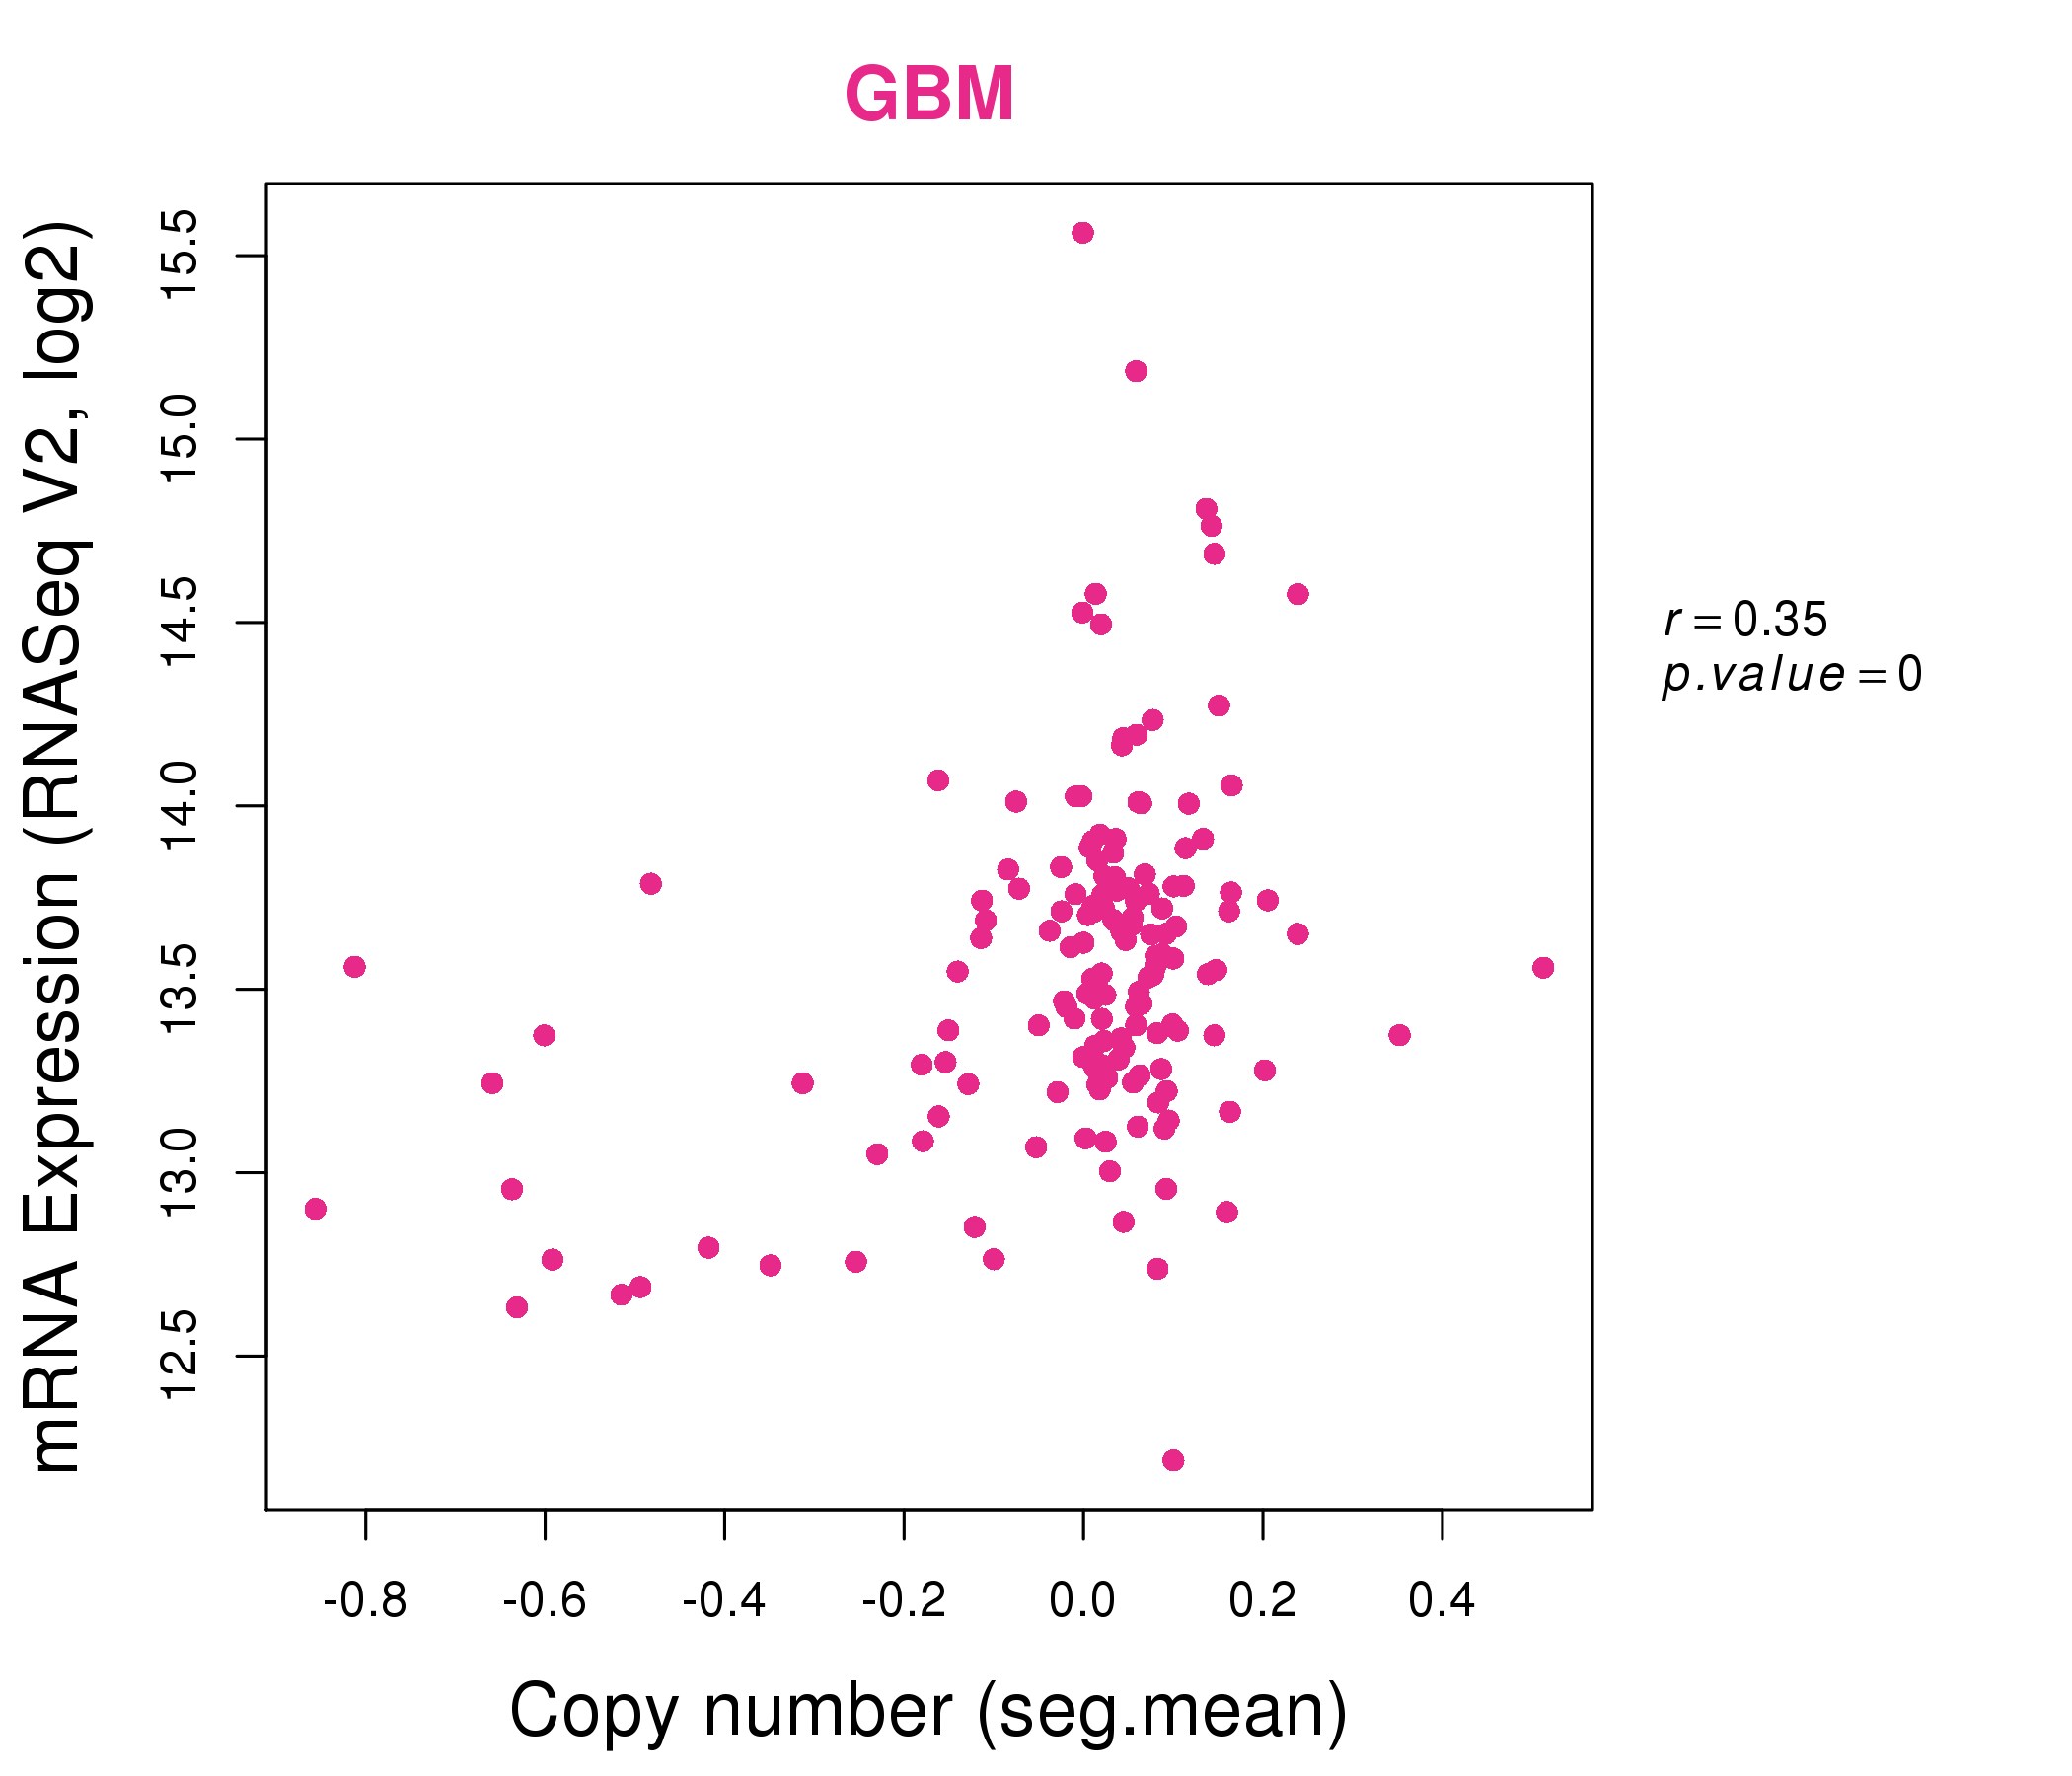
| * Normalized gene expression data of RNASeqV2 was extracted from TCGA using R package TCGA-Assembler. The URLs of all public data files on TCGA DCC data server were gathered at Jan-05-2015. Only eight cancer types have enough normal control samples for differential expression analysis. (t test, adjusted p<0.05 (using Benjamini-Hochberg FDR)) |
 |
| Top |
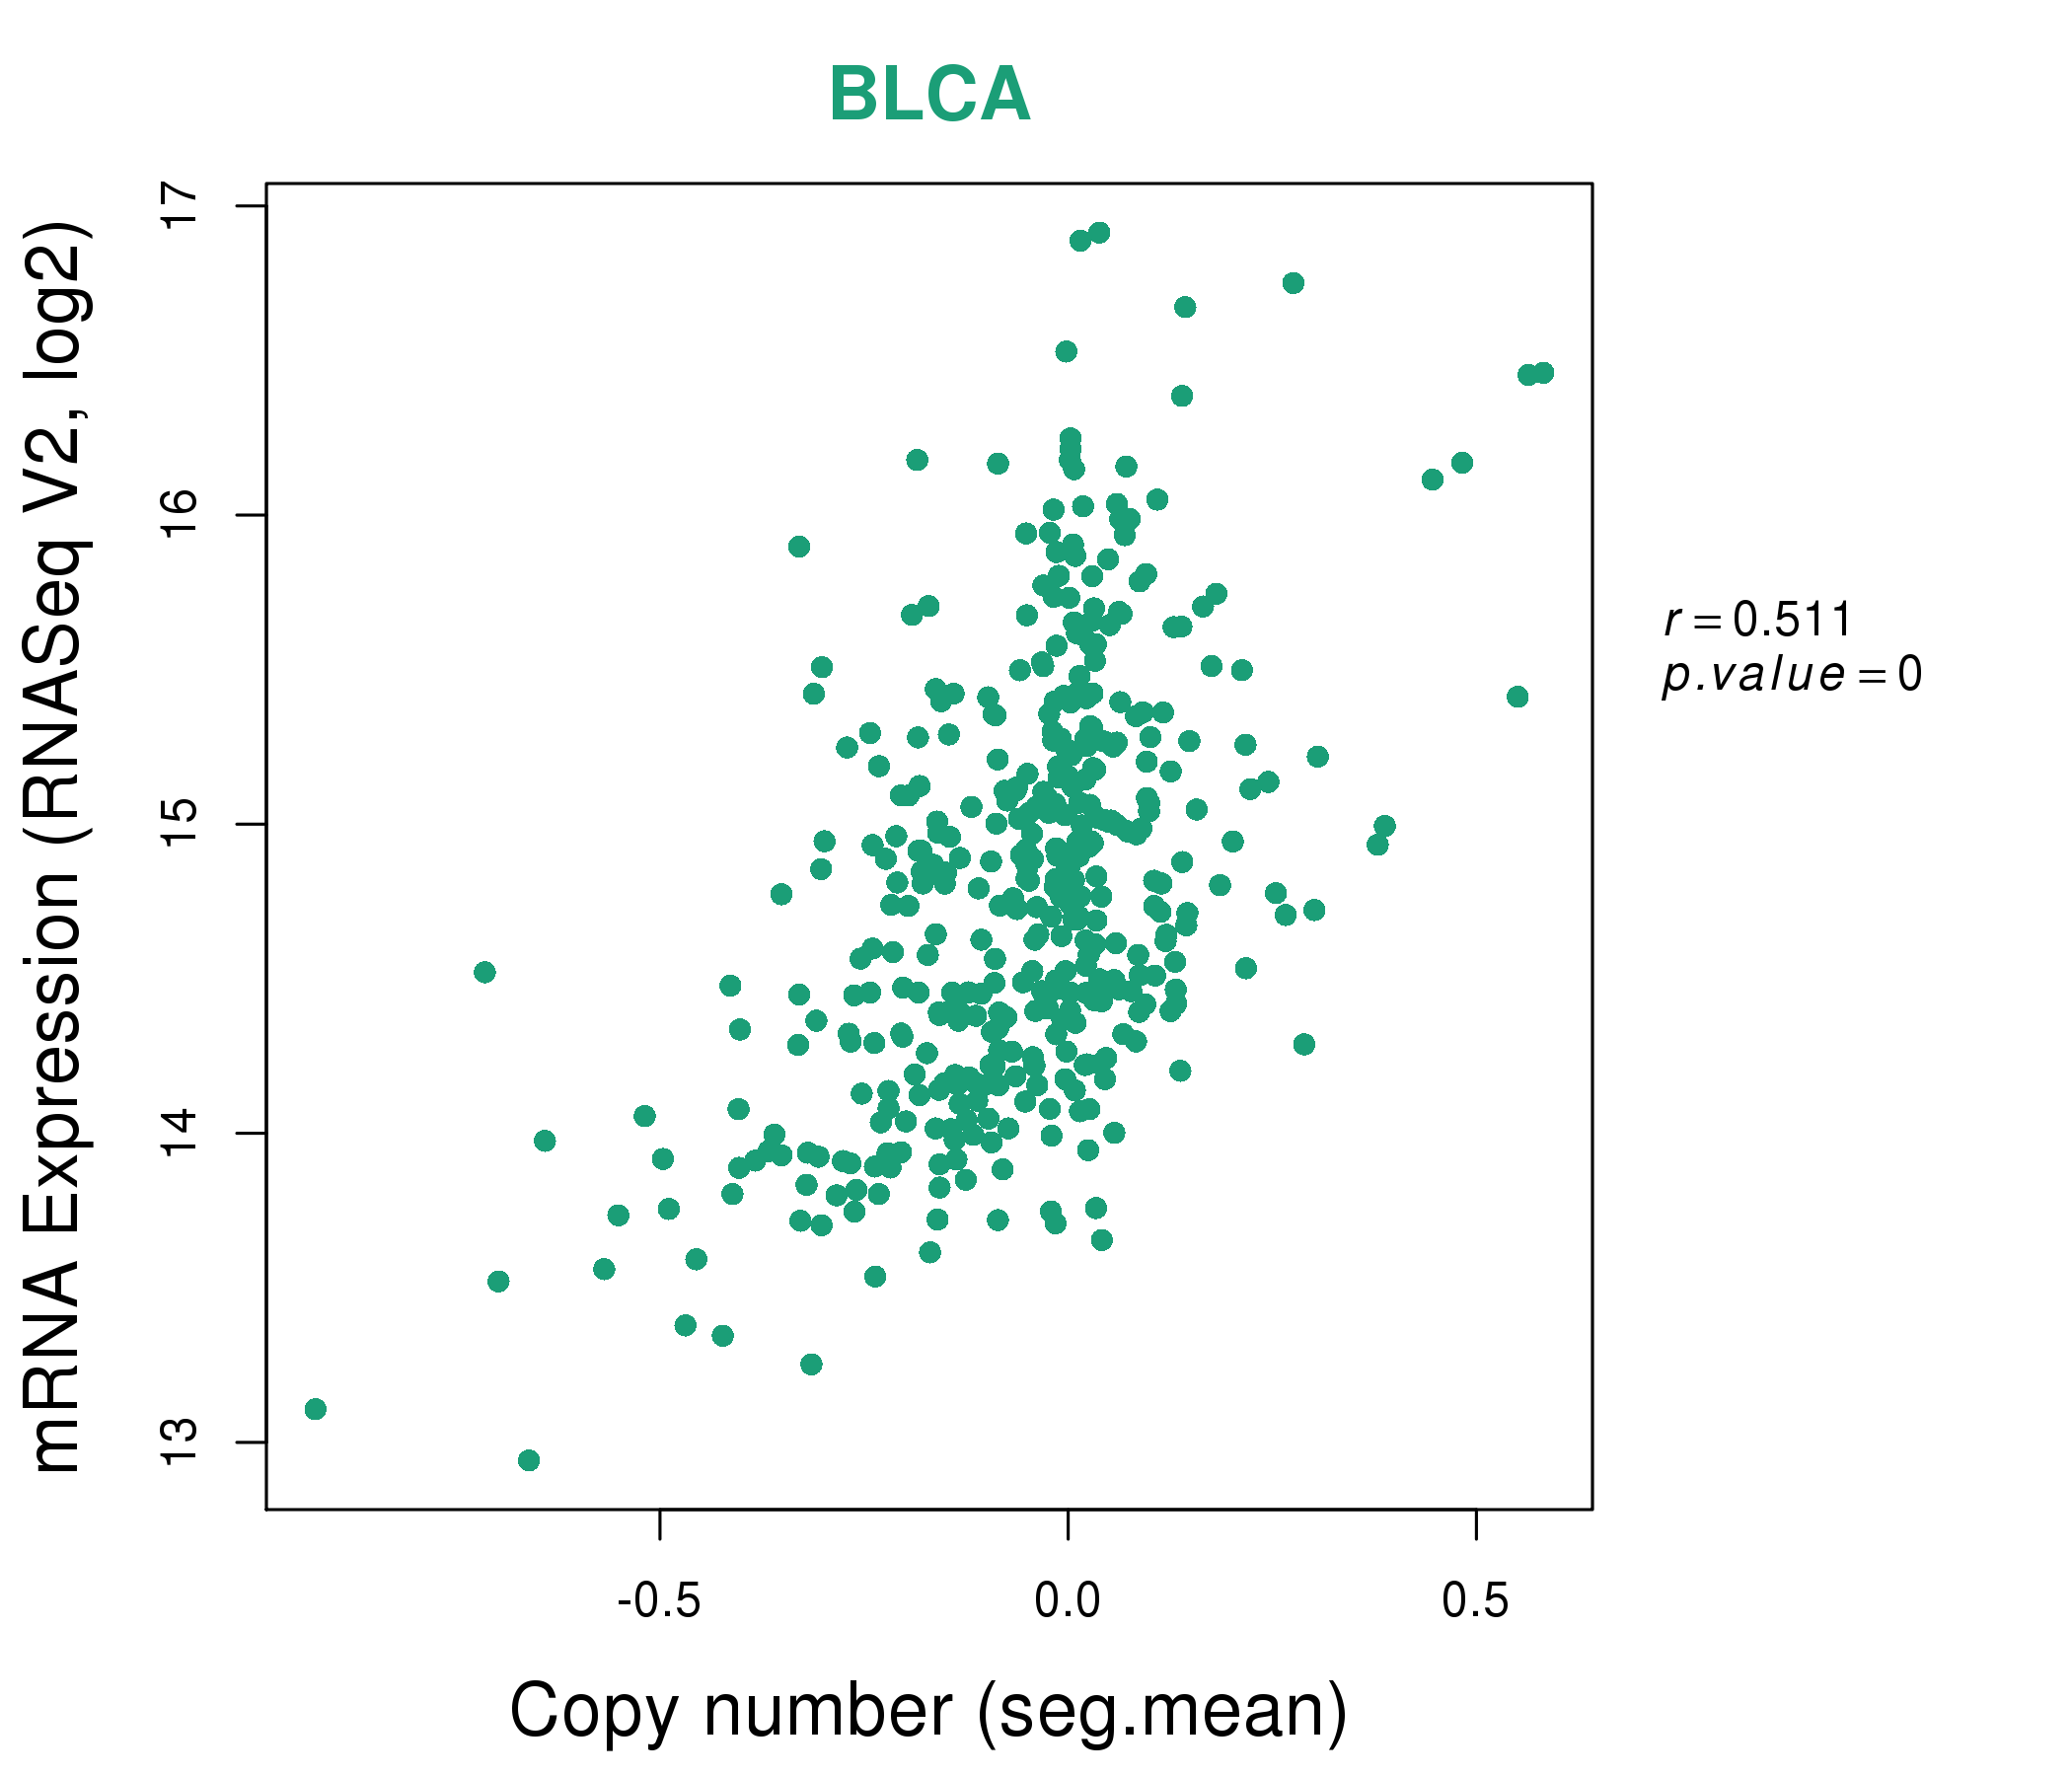
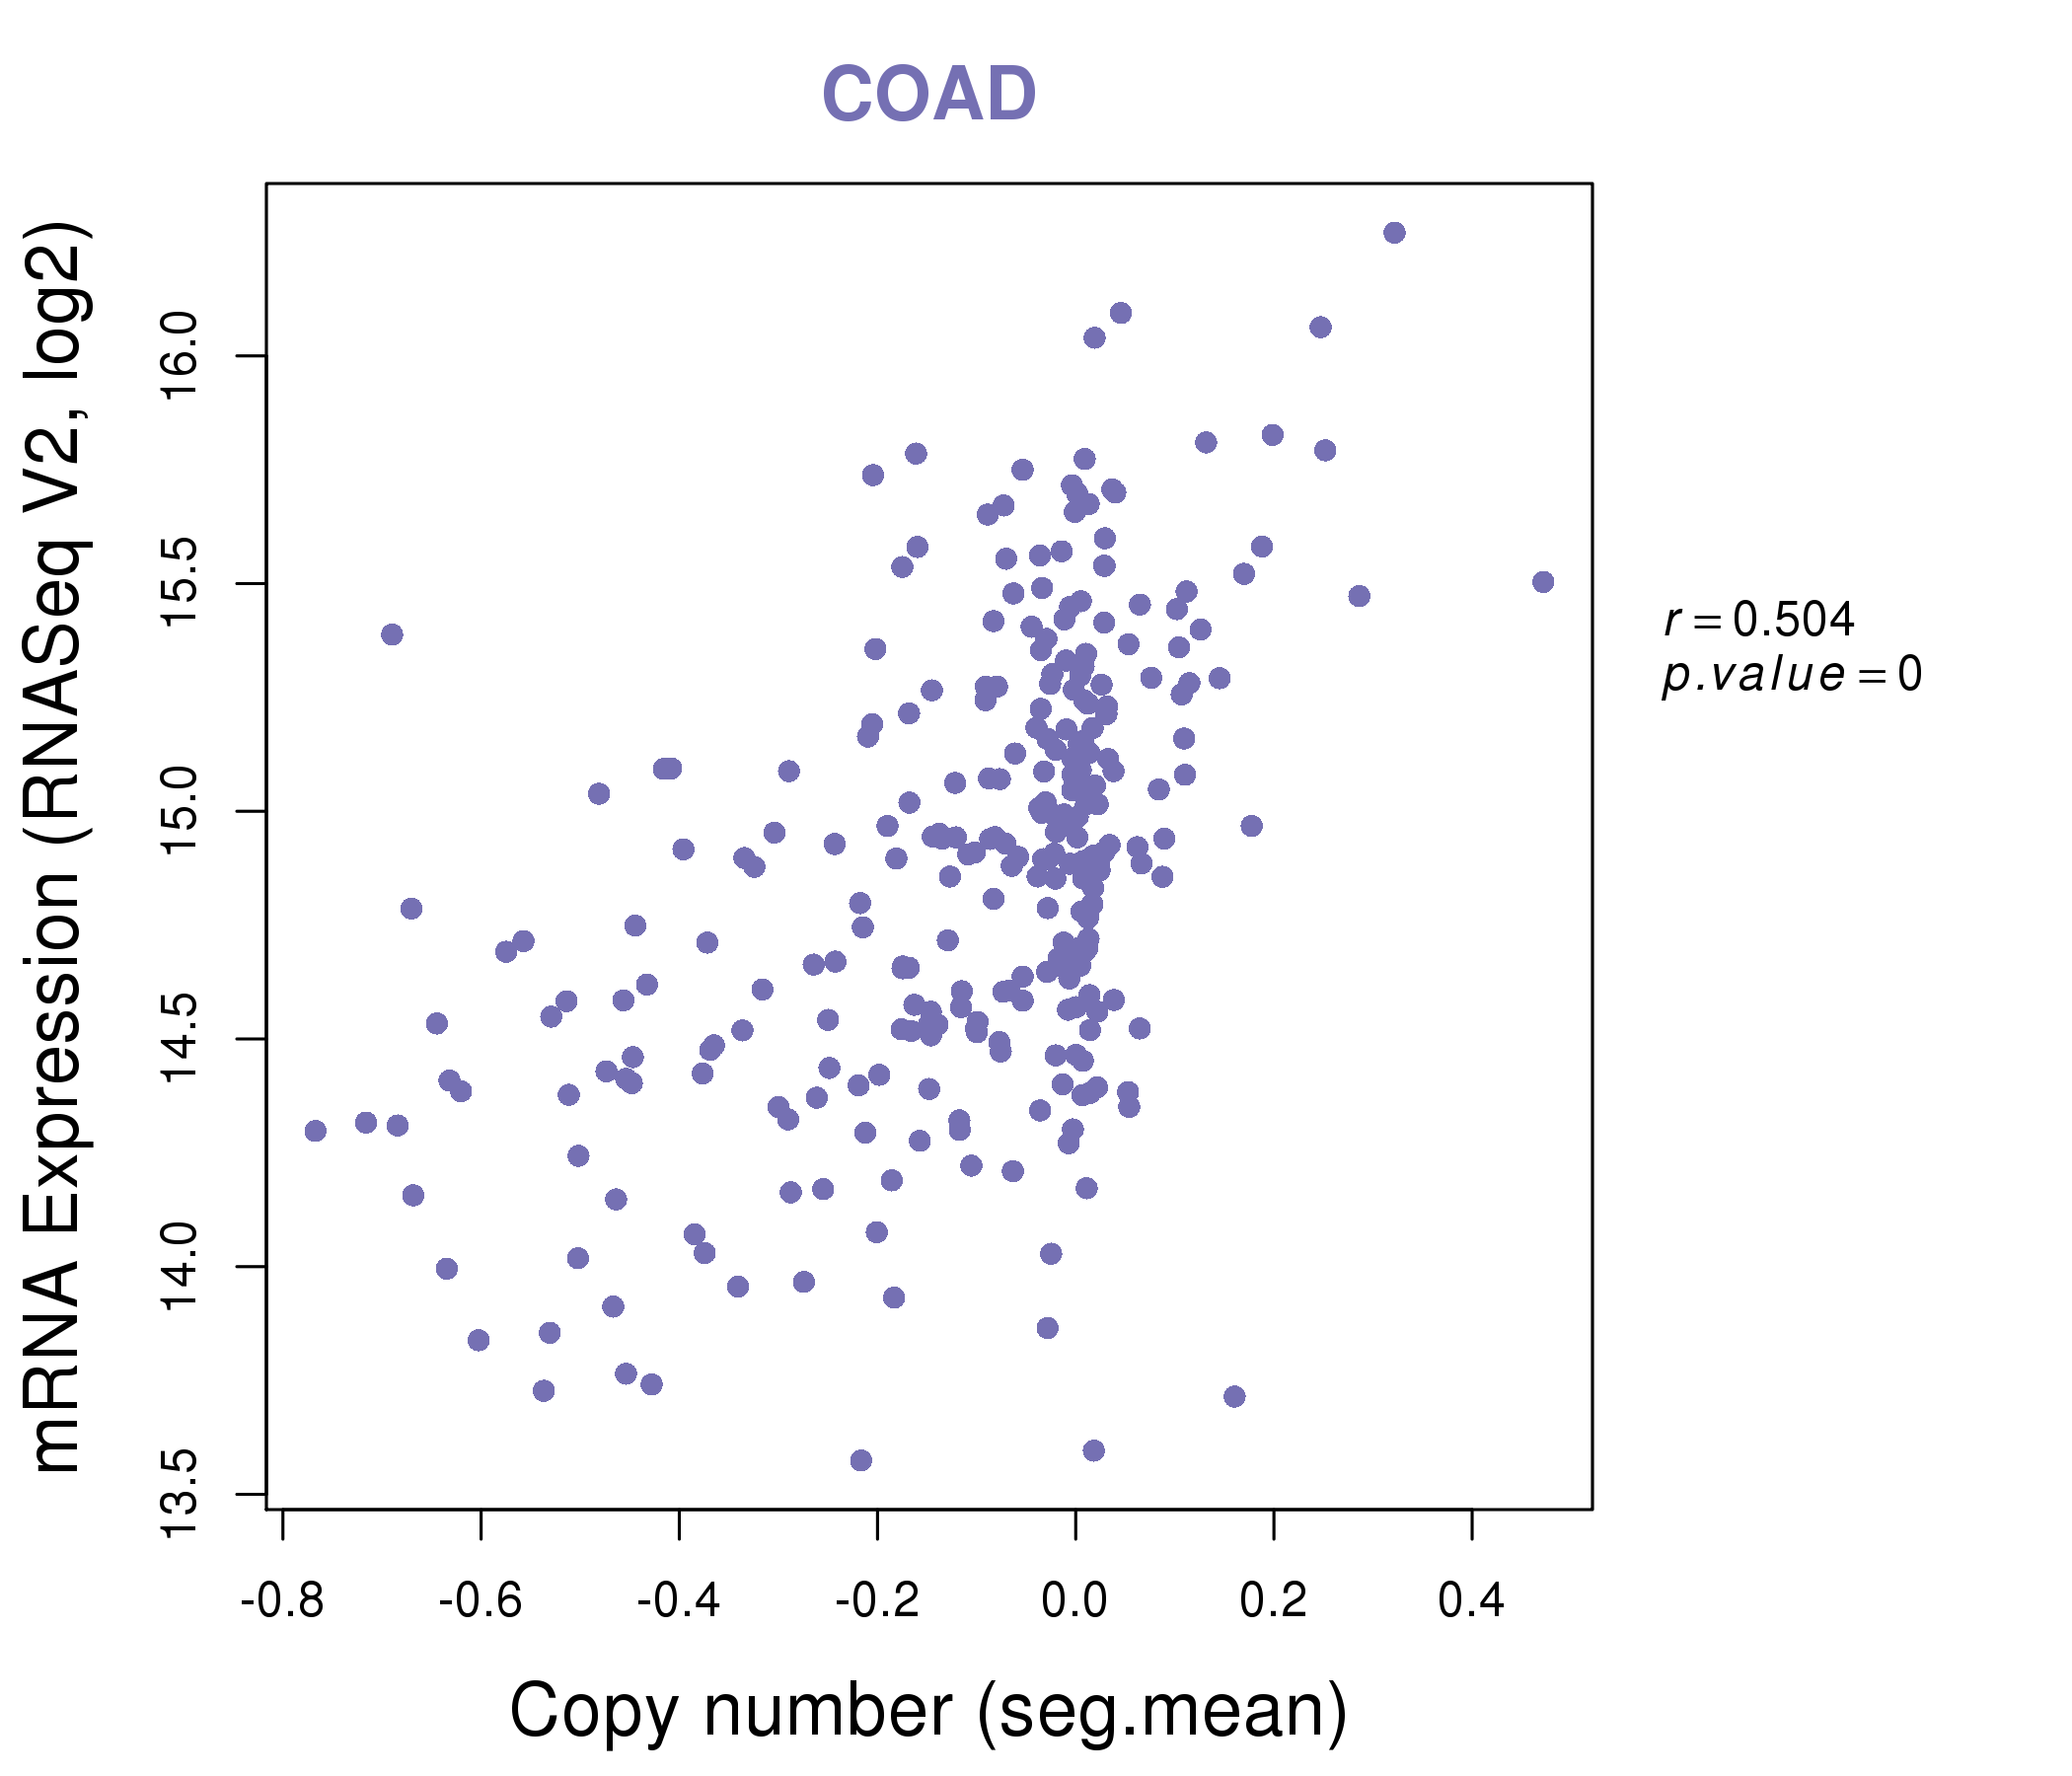
| * This plots show the correlation between CNV and gene expression. |
: Open all plots for all cancer types
 |
|
 |
|

| Top |
| Gene-Gene Network Information |
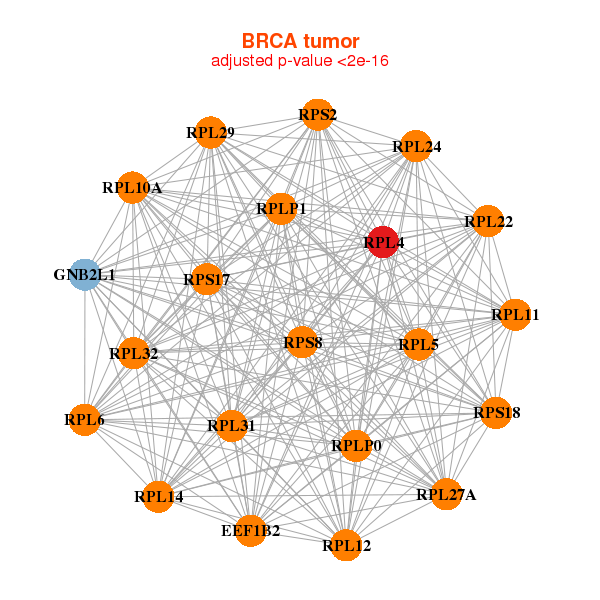
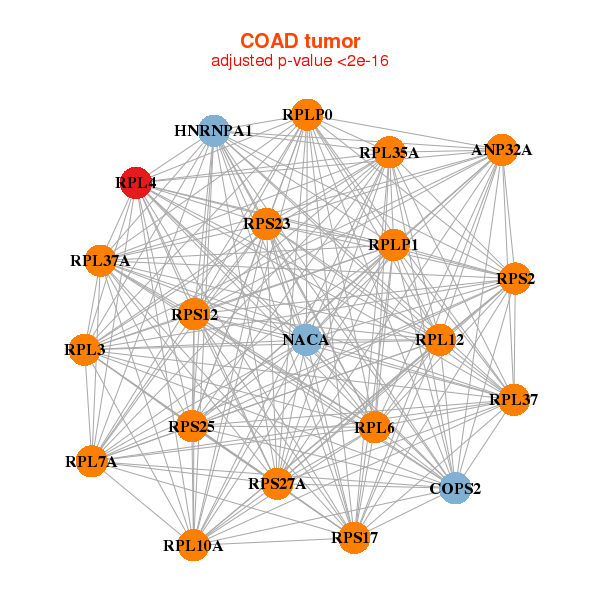
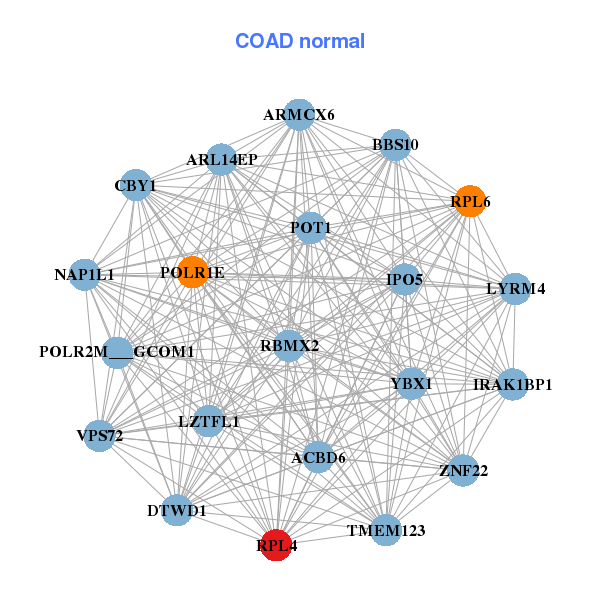
| * Co-Expression network figures were drawn using R package igraph. Only the top 20 genes with the highest correlations were shown. Red circle: input gene, orange circle: cell metabolism gene, sky circle: other gene |
: Open all plots for all cancer types
 |
|
| ATP5G2,NACA,PFDN5,RPL10,RPL10A,RPL11,RPL13A, RPL29,RPL31,RPL34,RPL36,RPL37A,RPL41,RPL7A, RPLP0,RPS14,RPS23,RPS26,RPS29,RPS4X,RPS9 | BTF3,CCT4,RPL14,RPL15,RPL23A,RPL24,RPL30, RPL32,RPL35A,RPL37,RPL38,RPL41,RPL6,RPS11, RPS15A,RPS24,RPS2,RPS29,RPS3A,RPS4X,RPS7 |
 |
|
| EEF1A1,EEF1A1P9,LRRC75A-AS1,PFDN5,RPL10A,RPL13A,RPL18A, RPL36,RPL41,RPLP0,RPS11,RPS14,RPS16,RPS29, RPS3,RPS3A,RPS5,RPS8,RPS9,RPSA,RPSAP58 | C12orf57,DPY30,FAU,PFDN5,RPL15,RPL24,RPL27A, RPL35,RPL35A,RPL41,RPL5,RPS11,RPS13,RPS18, RPS3A,RPS5,RPS6,RPS7,RPSAP58,SNRPD2,SSR2 |
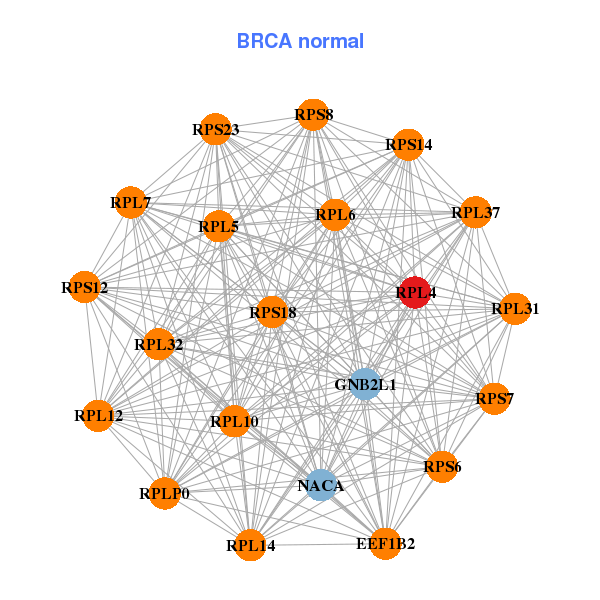
| * Co-Expression network figures were drawn using R package igraph. Only the top 20 genes with the highest correlations were shown. Red circle: input gene, orange circle: cell metabolism gene, sky circle: other gene |
: Open all plots for all cancer types
| Top |
: Open all interacting genes' information including KEGG pathway for all interacting genes from DAVID
| Top |
| Pharmacological Information for RPL4 |
| There's no related Drug. |
| Top |
| Cross referenced IDs for RPL4 |
| * We obtained these cross-references from Uniprot database. It covers 150 different DBs, 18 categories. http://www.uniprot.org/help/cross_references_section |
: Open all cross reference information
|
Copyright © 2016-Present - The Univsersity of Texas Health Science Center at Houston @ |