|
||||||||||||||||||||||||||||||||||||||||||||||||||||||||||||||||||||||||||||||||||||||||||||||||||||||||||||||||||||||||||||||||||||||||||||||||||||||||||||||||||||||||||||||||||||||||||||||||||||||||||||||||||||||||||||||||||||||||||||||||||||||||||||||||||||||||||||||||||||||||||||||||||||||||||||||||||||||||||
| |
| Phenotypic Information (metabolism pathway, cancer, disease, phenome) |
| |
| |
| Gene-Gene Network Information: Co-Expression Network, Interacting Genes & KEGG |
| |
|


| Gene Summary for RPS3 |
| Top |
| Phenotypic Information for RPS3(metabolism pathway, cancer, disease, phenome) |
| Cancer | CGAP: RPS3 |
| Familial Cancer Database: RPS3 | |
| * This gene is included in those cancer gene databases. |
|
|
|
|
|
| . | ||||||||||||||||||||||||||||||||||||||||||||||||||||||||||||||||||||||||||||||||||||||||||||||||||||||||||||||||||||||||||||||||||||||||||||||||||||||||||||||||||||||||||||||||||||||||||||||||||||||||||||||||||||||||||||||||||||||||||||||||||||||||||||||||||||||||||||||||||||||||||||||||||||||||||||||||||||
Oncogene 1 | Significant driver gene in | |||||||||||||||||||||||||||||||||||||||||||||||||||||||||||||||||||||||||||||||||||||||||||||||||||||||||||||||||||||||||||||||||||||||||||||||||||||||||||||||||||||||||||||||||||||||||||||||||||||||||||||||||||||||||||||||||||||||||||||||||||||||||||||||||||||||||||||||||||||||||||||||||||||||||||||||||||||||||
| cf) number; DB name 1 Oncogene; http://nar.oxfordjournals.org/content/35/suppl_1/D721.long, 2 Tumor Suppressor gene; https://bioinfo.uth.edu/TSGene/, 3 Cancer Gene Census; http://www.nature.com/nrc/journal/v4/n3/abs/nrc1299.html, 4 CancerGenes; http://nar.oxfordjournals.org/content/35/suppl_1/D721.long, 5 Network of Cancer Gene; http://ncg.kcl.ac.uk/index.php, 1Therapeutic Vulnerabilities in Cancer; http://cbio.mskcc.org/cancergenomics/statius/ |
| REACTOME_METABOLISM_OF_PROTEINS REACTOME_METABOLISM_OF_MRNA REACTOME_METABOLISM_OF_RNA | |
| OMIM | 600454; gene. |
| Orphanet | |
| Disease | KEGG Disease: RPS3 |
| MedGen: RPS3 (Human Medical Genetics with Condition) | |
| ClinVar: RPS3 | |
| Phenotype | MGI: RPS3 (International Mouse Phenotyping Consortium) |
| PhenomicDB: RPS3 | |
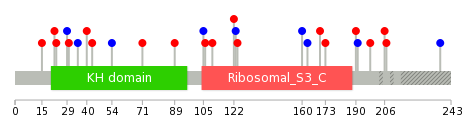
| Mutations for RPS3 |
| * Under tables are showing count per each tissue to give us broad intuition about tissue specific mutation patterns.You can go to the detailed page for each mutation database's web site. |
| There's no structural variation information in COSMIC data for this gene. |
| * From mRNA Sanger sequences, Chitars2.0 arranged chimeric transcripts. This table shows RPS3 related fusion information. |
| ID | Head Gene | Tail Gene | Accession | Gene_a | qStart_a | qEnd_a | Chromosome_a | tStart_a | tEnd_a | Gene_a | qStart_a | qEnd_a | Chromosome_a | tStart_a | tEnd_a |
| AK172736 | ANK3 | 1 | 1228 | 10 | 62267257 | 62493082 | RPS3 | 1221 | 1441 | 11 | 75115767 | 75116732 | |
| BM823567 | VSIG1 | 1 | 76 | X | 107322056 | 107322131 | RPS3 | 77 | 433 | 11 | 75110563 | 75113468 | |
| DA636472 | RPS3 | 1 | 141 | 11 | 75115469 | 75115609 | ARMC5 | 140 | 522 | 16 | 31471296 | 31473701 | |
| BG028694 | SET | 1 | 564 | 9 | 131454995 | 131457000 | RPS3 | 560 | 641 | 11 | 75115861 | 75116688 | |
| BM856177 | VSIG1 | 1 | 76 | X | 107322056 | 107322131 | RPS3 | 77 | 319 | 11 | 75110563 | 75112736 | |
| BP262829 | RPS3 | 1 | 318 | 11 | 75110562 | 75113427 | C7orf31 | 312 | 567 | 7 | 25219619 | 25219874 | |
| BM844689 | RPS3 | 10 | 291 | 11 | 75110563 | 75112774 | CLDN4 | 281 | 392 | 7 | 73245834 | 73245945 | |
| BQ084066 | VSIG1 | 1 | 76 | X | 107322056 | 107322131 | RPS3 | 77 | 266 | 11 | 75110563 | 75111868 | |
| BQ084386 | VSIG1 | 1 | 76 | X | 107322056 | 107322131 | RPS3 | 77 | 217 | 11 | 75110563 | 75111819 | |
| BC017103 | MOB2 | 1 | 830 | 11 | 1576495 | 1577324 | RPS3 | 831 | 1633 | 11 | 75110600 | 75116733 | |
| Top |
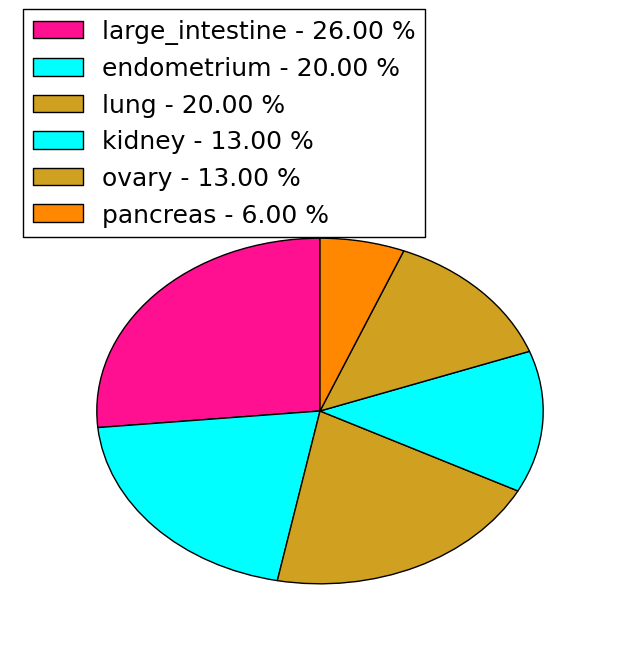
| Mutation type/ Tissue ID | brca | cns | cerv | endome | haematopo | kidn | Lintest | liver | lung | ns | ovary | pancre | prost | skin | stoma | thyro | urina | |||
| Total # sample | 2 | |||||||||||||||||||
| GAIN (# sample) | 2 | |||||||||||||||||||
| LOSS (# sample) |
| cf) Tissue ID; Tissue type (1; Breast, 2; Central_nervous_system, 3; Cervix, 4; Endometrium, 5; Haematopoietic_and_lymphoid_tissue, 6; Kidney, 7; Large_intestine, 8; Liver, 9; Lung, 10; NS, 11; Ovary, 12; Pancreas, 13; Prostate, 14; Skin, 15; Stomach, 16; Thyroid, 17; Urinary_tract) |
| Top |
|
 |
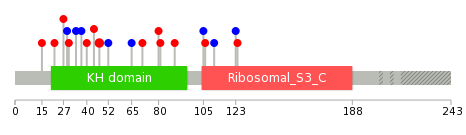
| Top |
| Stat. for Non-Synonymous SNVs (# total SNVs=15) | (# total SNVs=7) |
 |  |
(# total SNVs=0) | (# total SNVs=0) |
| Top |
| * When you move the cursor on each content, you can see more deailed mutation information on the Tooltip. Those are primary_site,primary_histology,mutation(aa),pubmedID. |
| GRCh37 position | Mutation(aa) | Unique sampleID count |
| chr11:75115193-75115193 | p.S160S | 1 |
| chr11:75112674-75112675 | p.? | 1 |
| chr11:75115202-75115202 | p.P163P | 1 |
| chr11:75112684-75112684 | p.R54R | 1 |
| chr11:75115222-75115222 | p.T170I | 1 |
| chr11:75112734-75112734 | p.A71D | 1 |
| chr11:75115230-75115230 | p.R173C | 1 |
| chr11:75111750-75111750 | p.G15R | 1 |
| chr11:75113406-75113406 | p.E89A | 1 |
| chr11:75115745-75115745 | p.L190V | 1 |
| Top |
|
 |
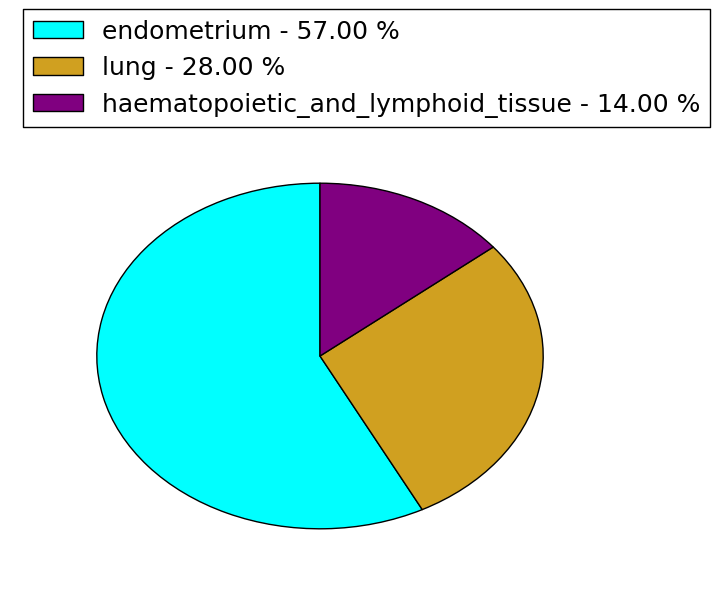
| Point Mutation/ Tissue ID | 1 | 2 | 3 | 4 | 5 | 6 | 7 | 8 | 9 | 10 | 11 | 12 | 13 | 14 | 15 | 16 | 17 | 18 | 19 | 20 |
| # sample | 3 | 1 | 2 | 4 | 1 | 2 | 1 | 7 | ||||||||||||
| # mutation | 3 | 1 | 2 | 4 | 1 | 2 | 1 | 7 | ||||||||||||
| nonsynonymous SNV | 3 | 1 | 2 | 2 | 1 | 1 | 3 | |||||||||||||
| synonymous SNV | 2 | 2 | 4 |
| cf) Tissue ID; Tissue type (1; BLCA[Bladder Urothelial Carcinoma], 2; BRCA[Breast invasive carcinoma], 3; CESC[Cervical squamous cell carcinoma and endocervical adenocarcinoma], 4; COAD[Colon adenocarcinoma], 5; GBM[Glioblastoma multiforme], 6; Glioma Low Grade, 7; HNSC[Head and Neck squamous cell carcinoma], 8; KICH[Kidney Chromophobe], 9; KIRC[Kidney renal clear cell carcinoma], 10; KIRP[Kidney renal papillary cell carcinoma], 11; LAML[Acute Myeloid Leukemia], 12; LUAD[Lung adenocarcinoma], 13; LUSC[Lung squamous cell carcinoma], 14; OV[Ovarian serous cystadenocarcinoma ], 15; PAAD[Pancreatic adenocarcinoma], 16; PRAD[Prostate adenocarcinoma], 17; SKCM[Skin Cutaneous Melanoma], 18:STAD[Stomach adenocarcinoma], 19:THCA[Thyroid carcinoma], 20:UCEC[Uterine Corpus Endometrial Carcinoma]) |
| Top |
| * We represented just top 10 SNVs. When you move the cursor on each content, you can see more deailed mutation information on the Tooltip. Those are primary_site, primary_histology, mutation(aa), pubmedID. |
| Genomic Position | Mutation(aa) | Unique sampleID count |
| chr11:75115230 | p.R47C,RPS3 | 2 |
| chr11:75115793 | p.S34S,RPS3 | 1 |
| chr11:75113455 | p.P37P,RPS3 | 1 |
| chr11:75115797 | p.T44I,RPS3 | 1 |
| chr11:75113456 | p.R52R,RPS3 | 1 |
| chr11:75115888 | p.G15R,RPS3 | 1 |
| chr11:75115080 | p.P65P,RPS3 | 1 |
| chr11:75111750 | p.N22K,RPS3 | 1 |
| chr11:75115084 | p.D80N,RPS3 | 1 |
| chr11:75111773 | p.R27W,RPS3 | 1 |
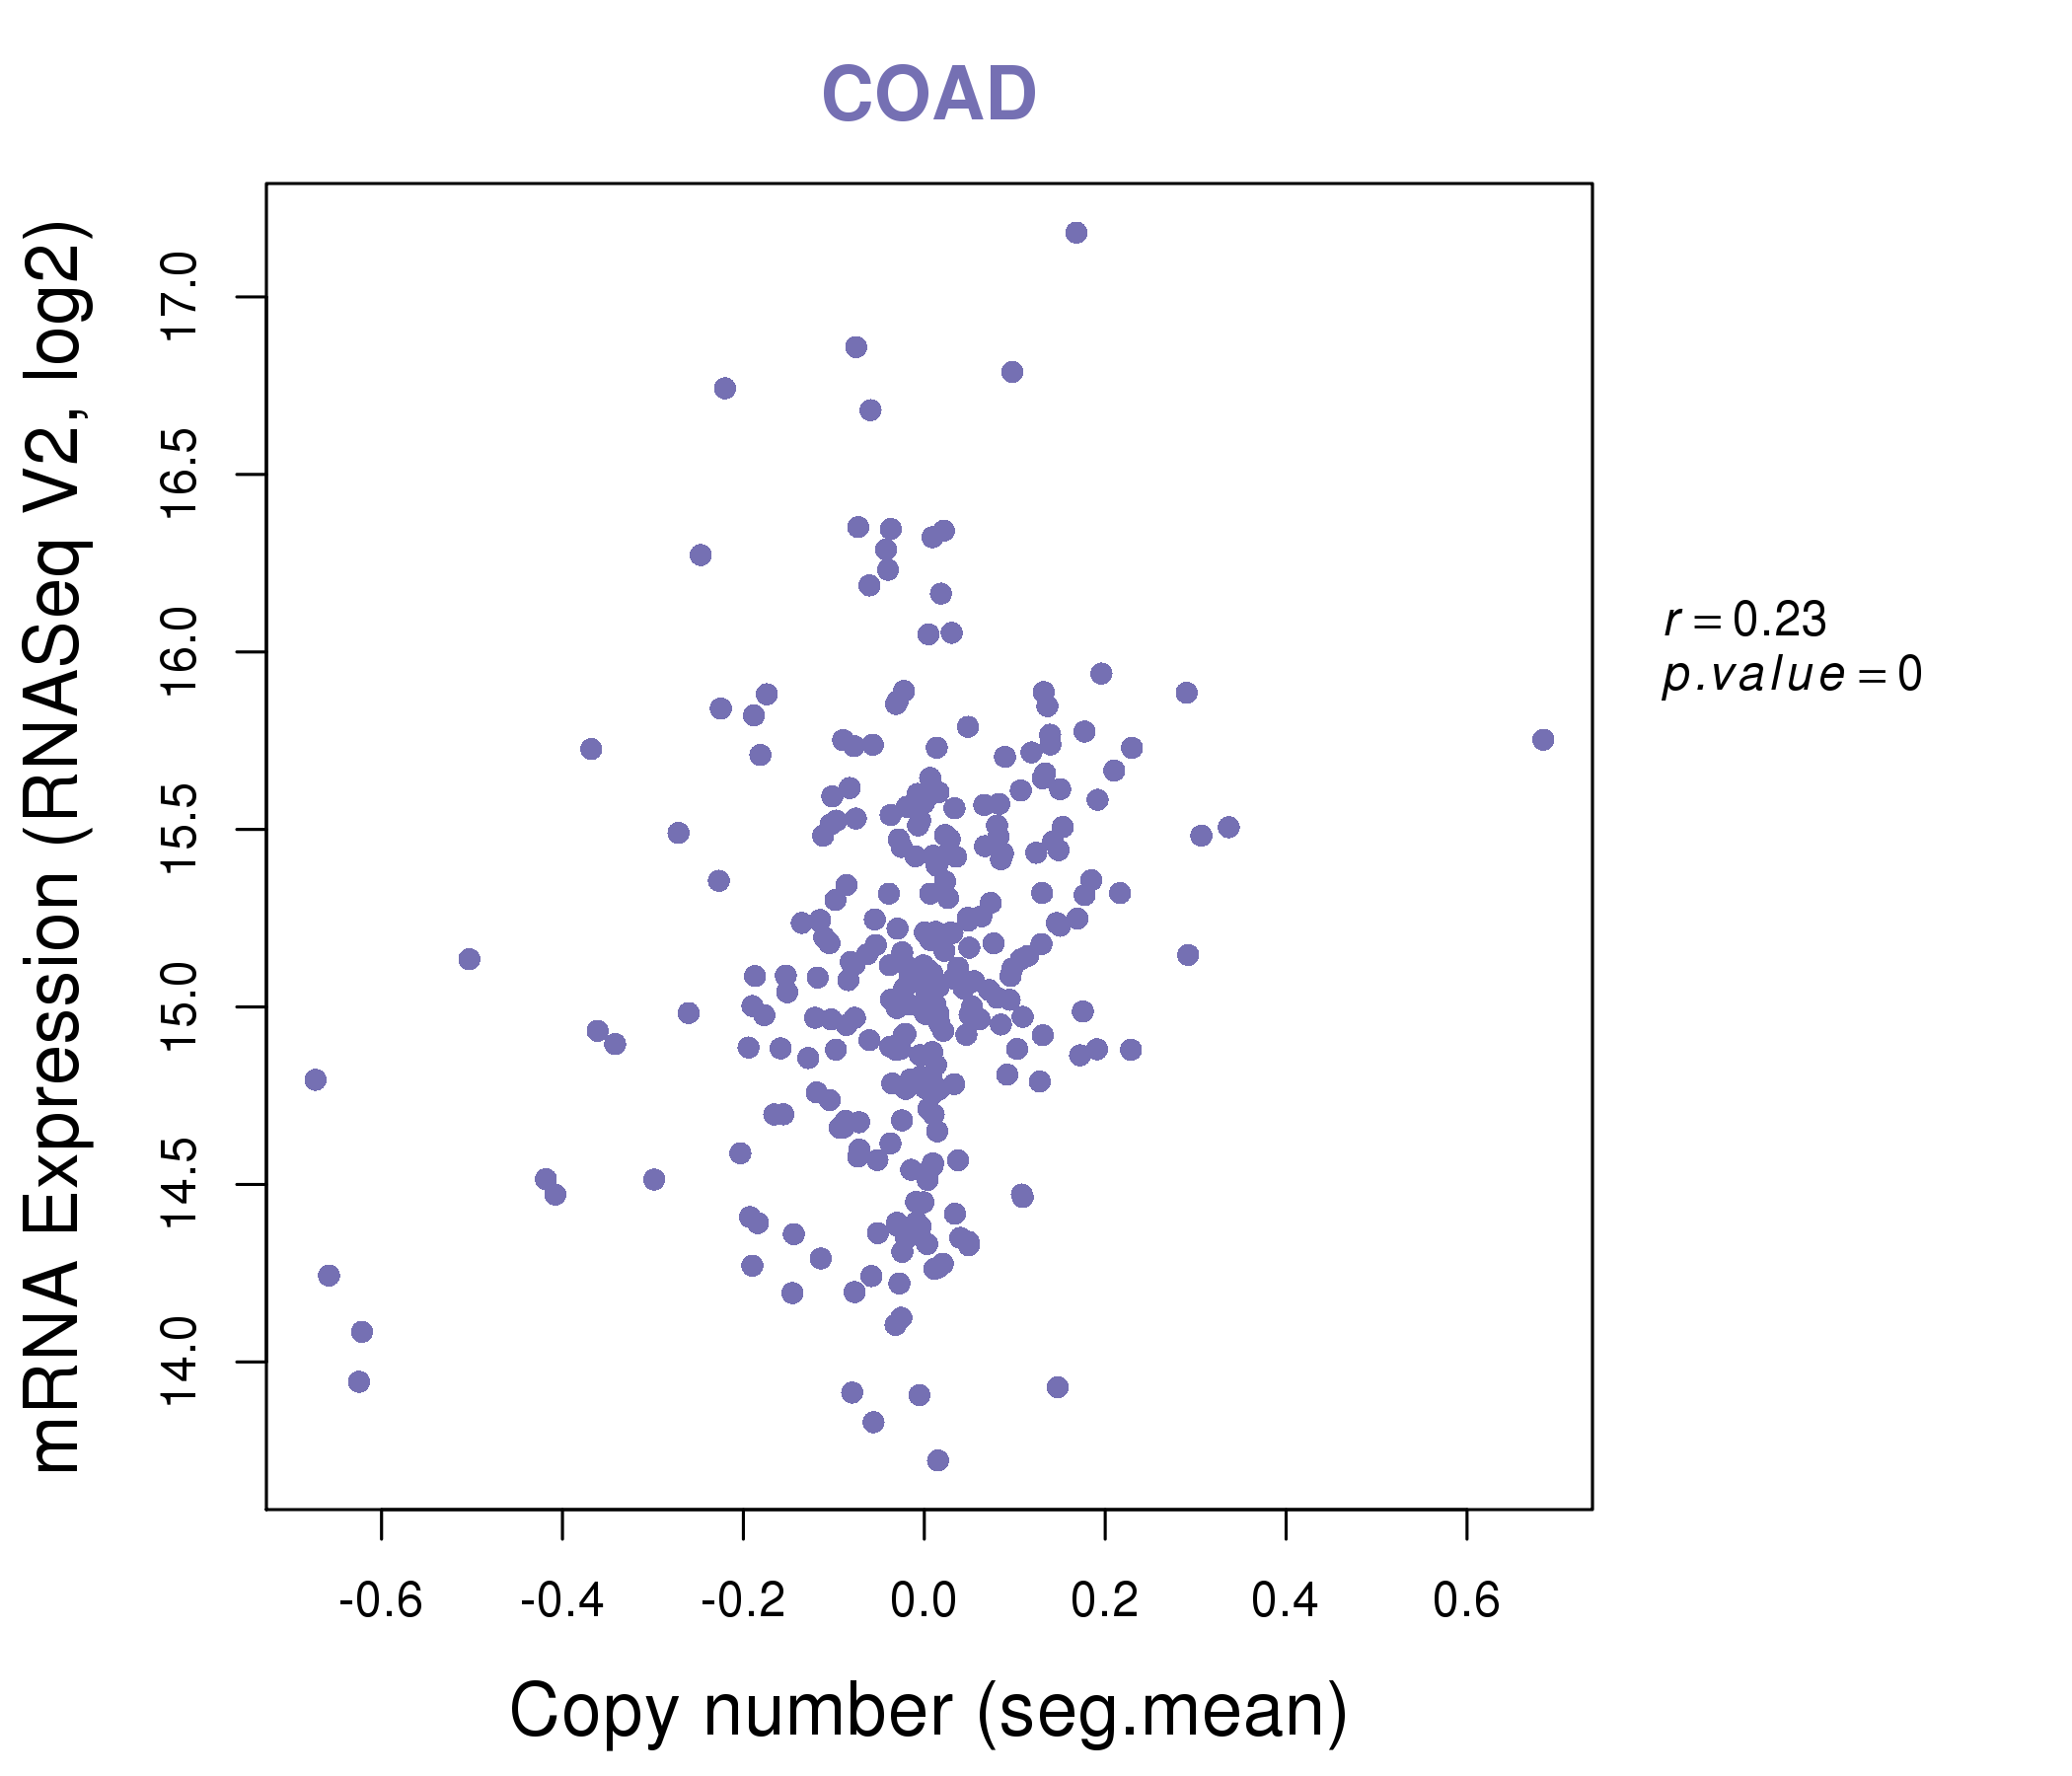
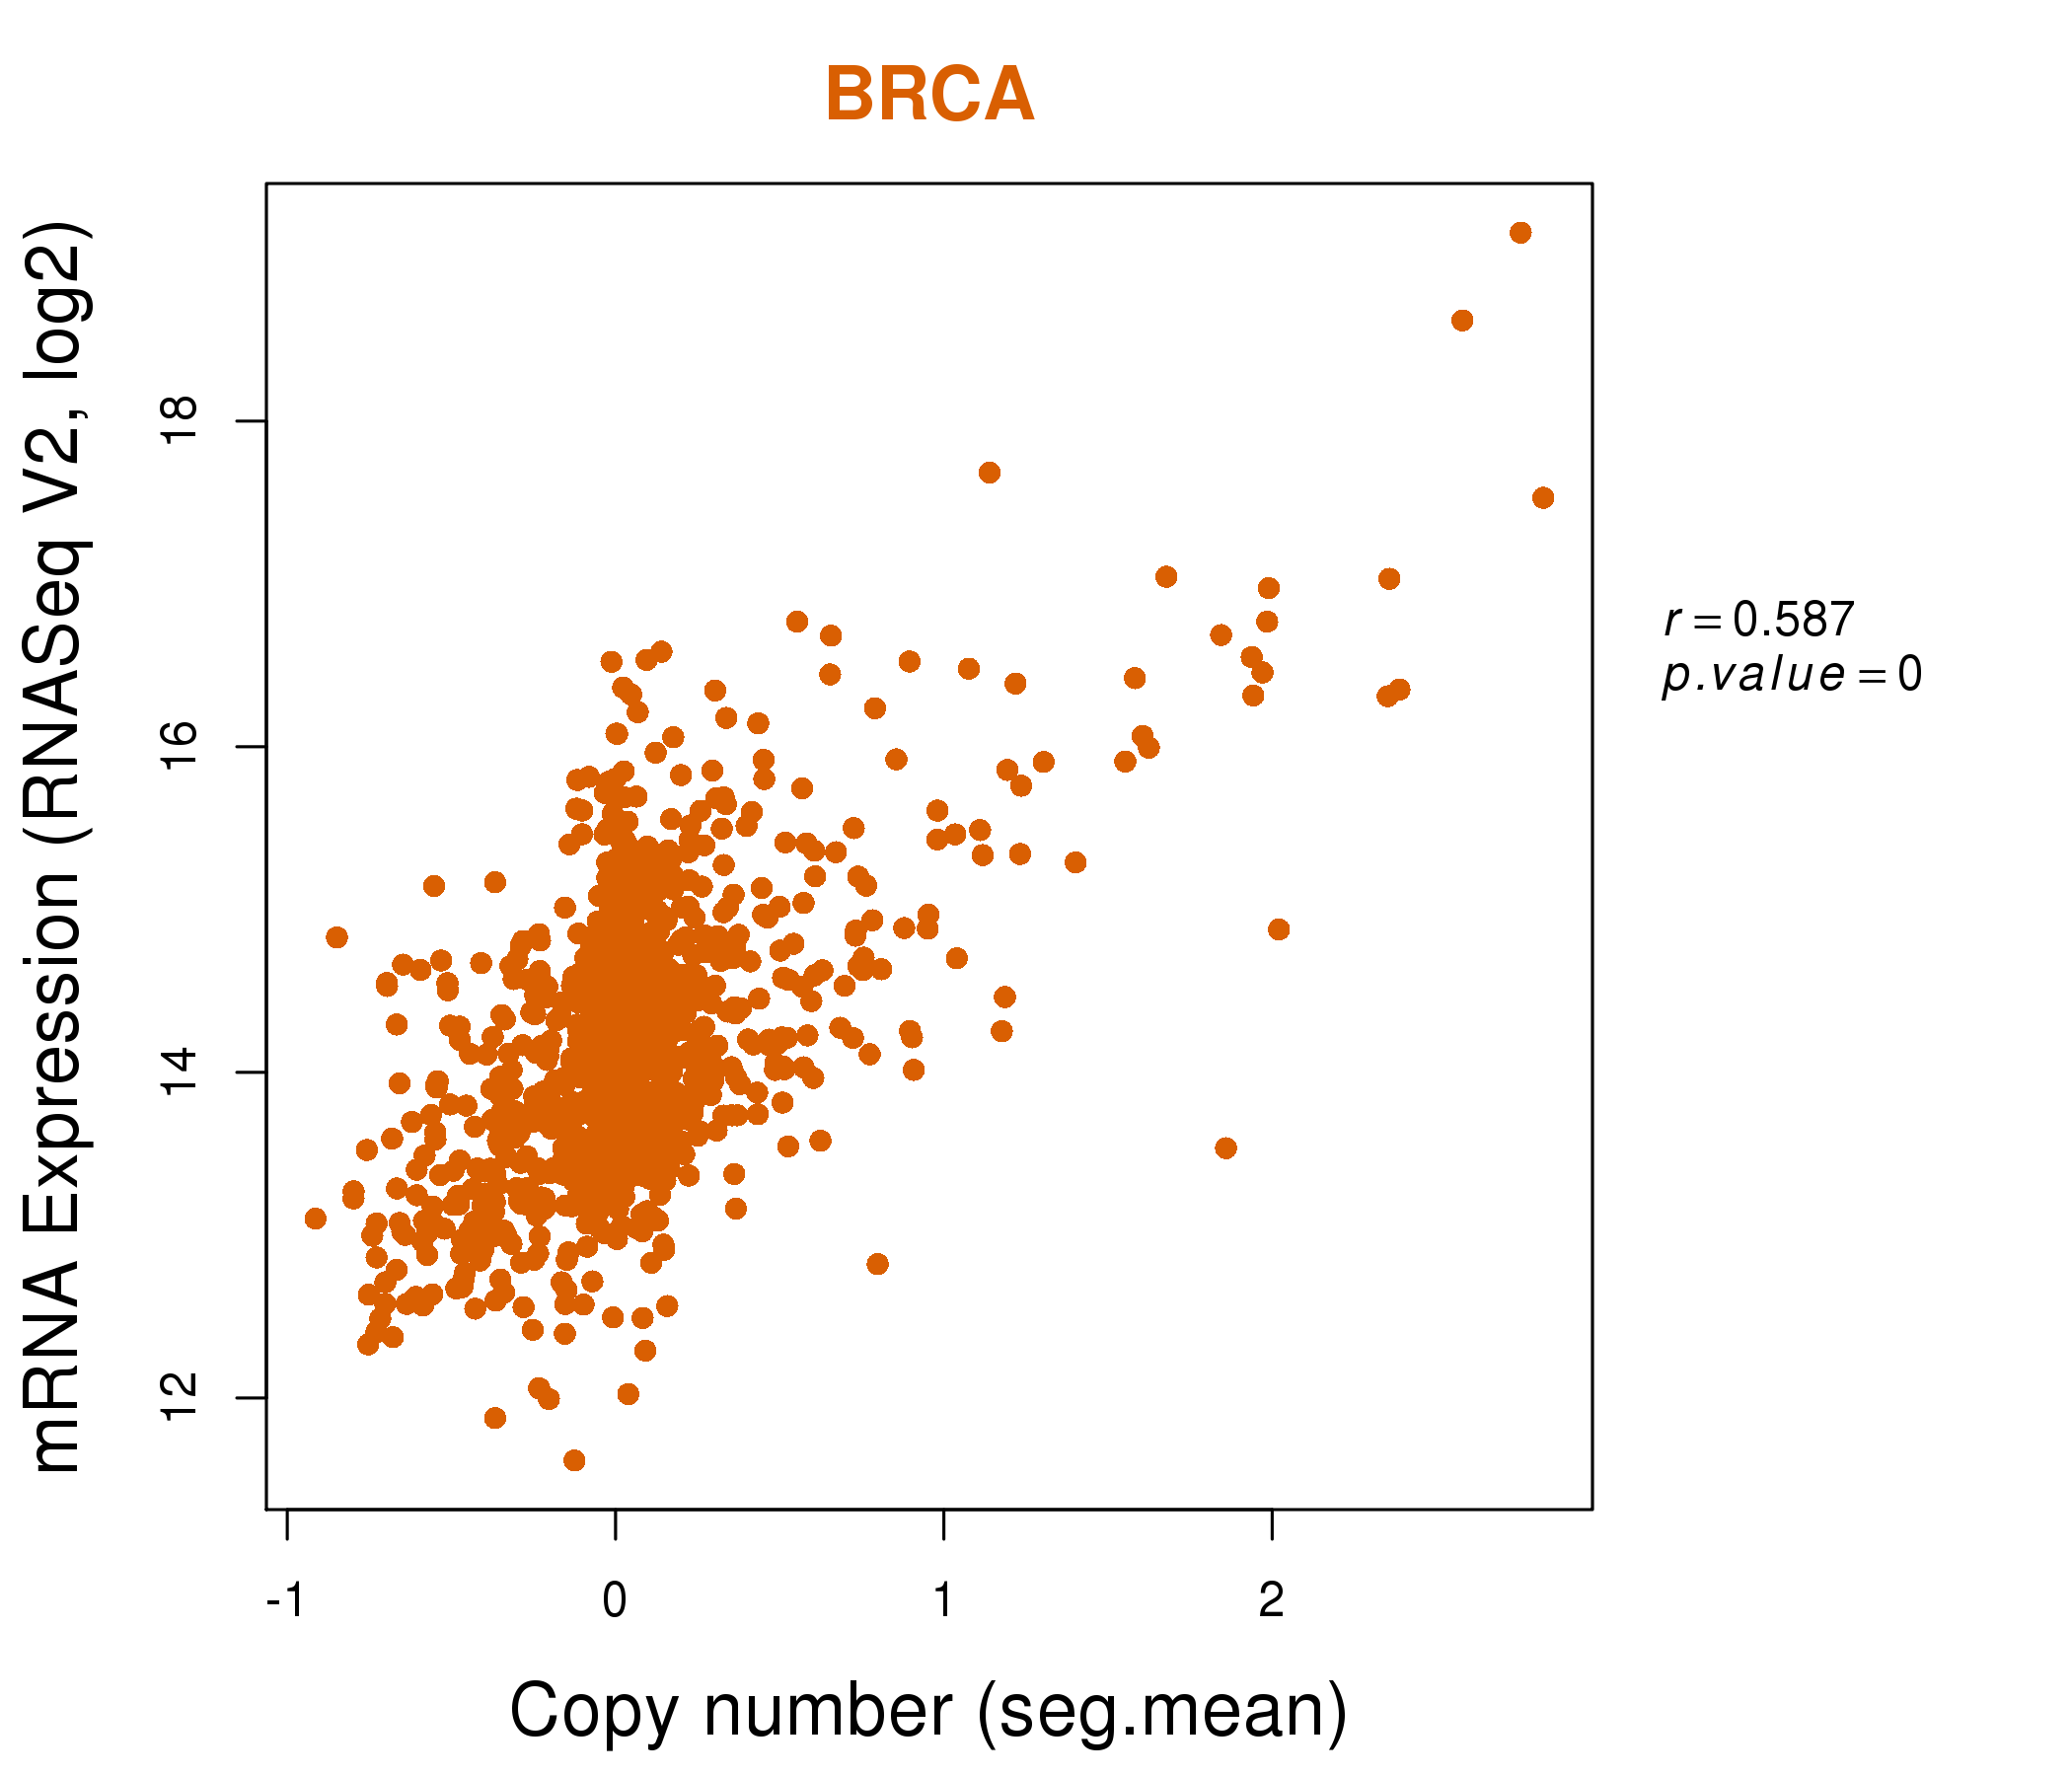
| * Copy number data were extracted from TCGA using R package TCGA-Assembler. The URLs of all public data files on TCGA DCC data server were gathered on Jan-05-2015. Function ProcessCNAData in TCGA-Assembler package was used to obtain gene-level copy number value which is calculated as the average copy number of the genomic region of a gene. |
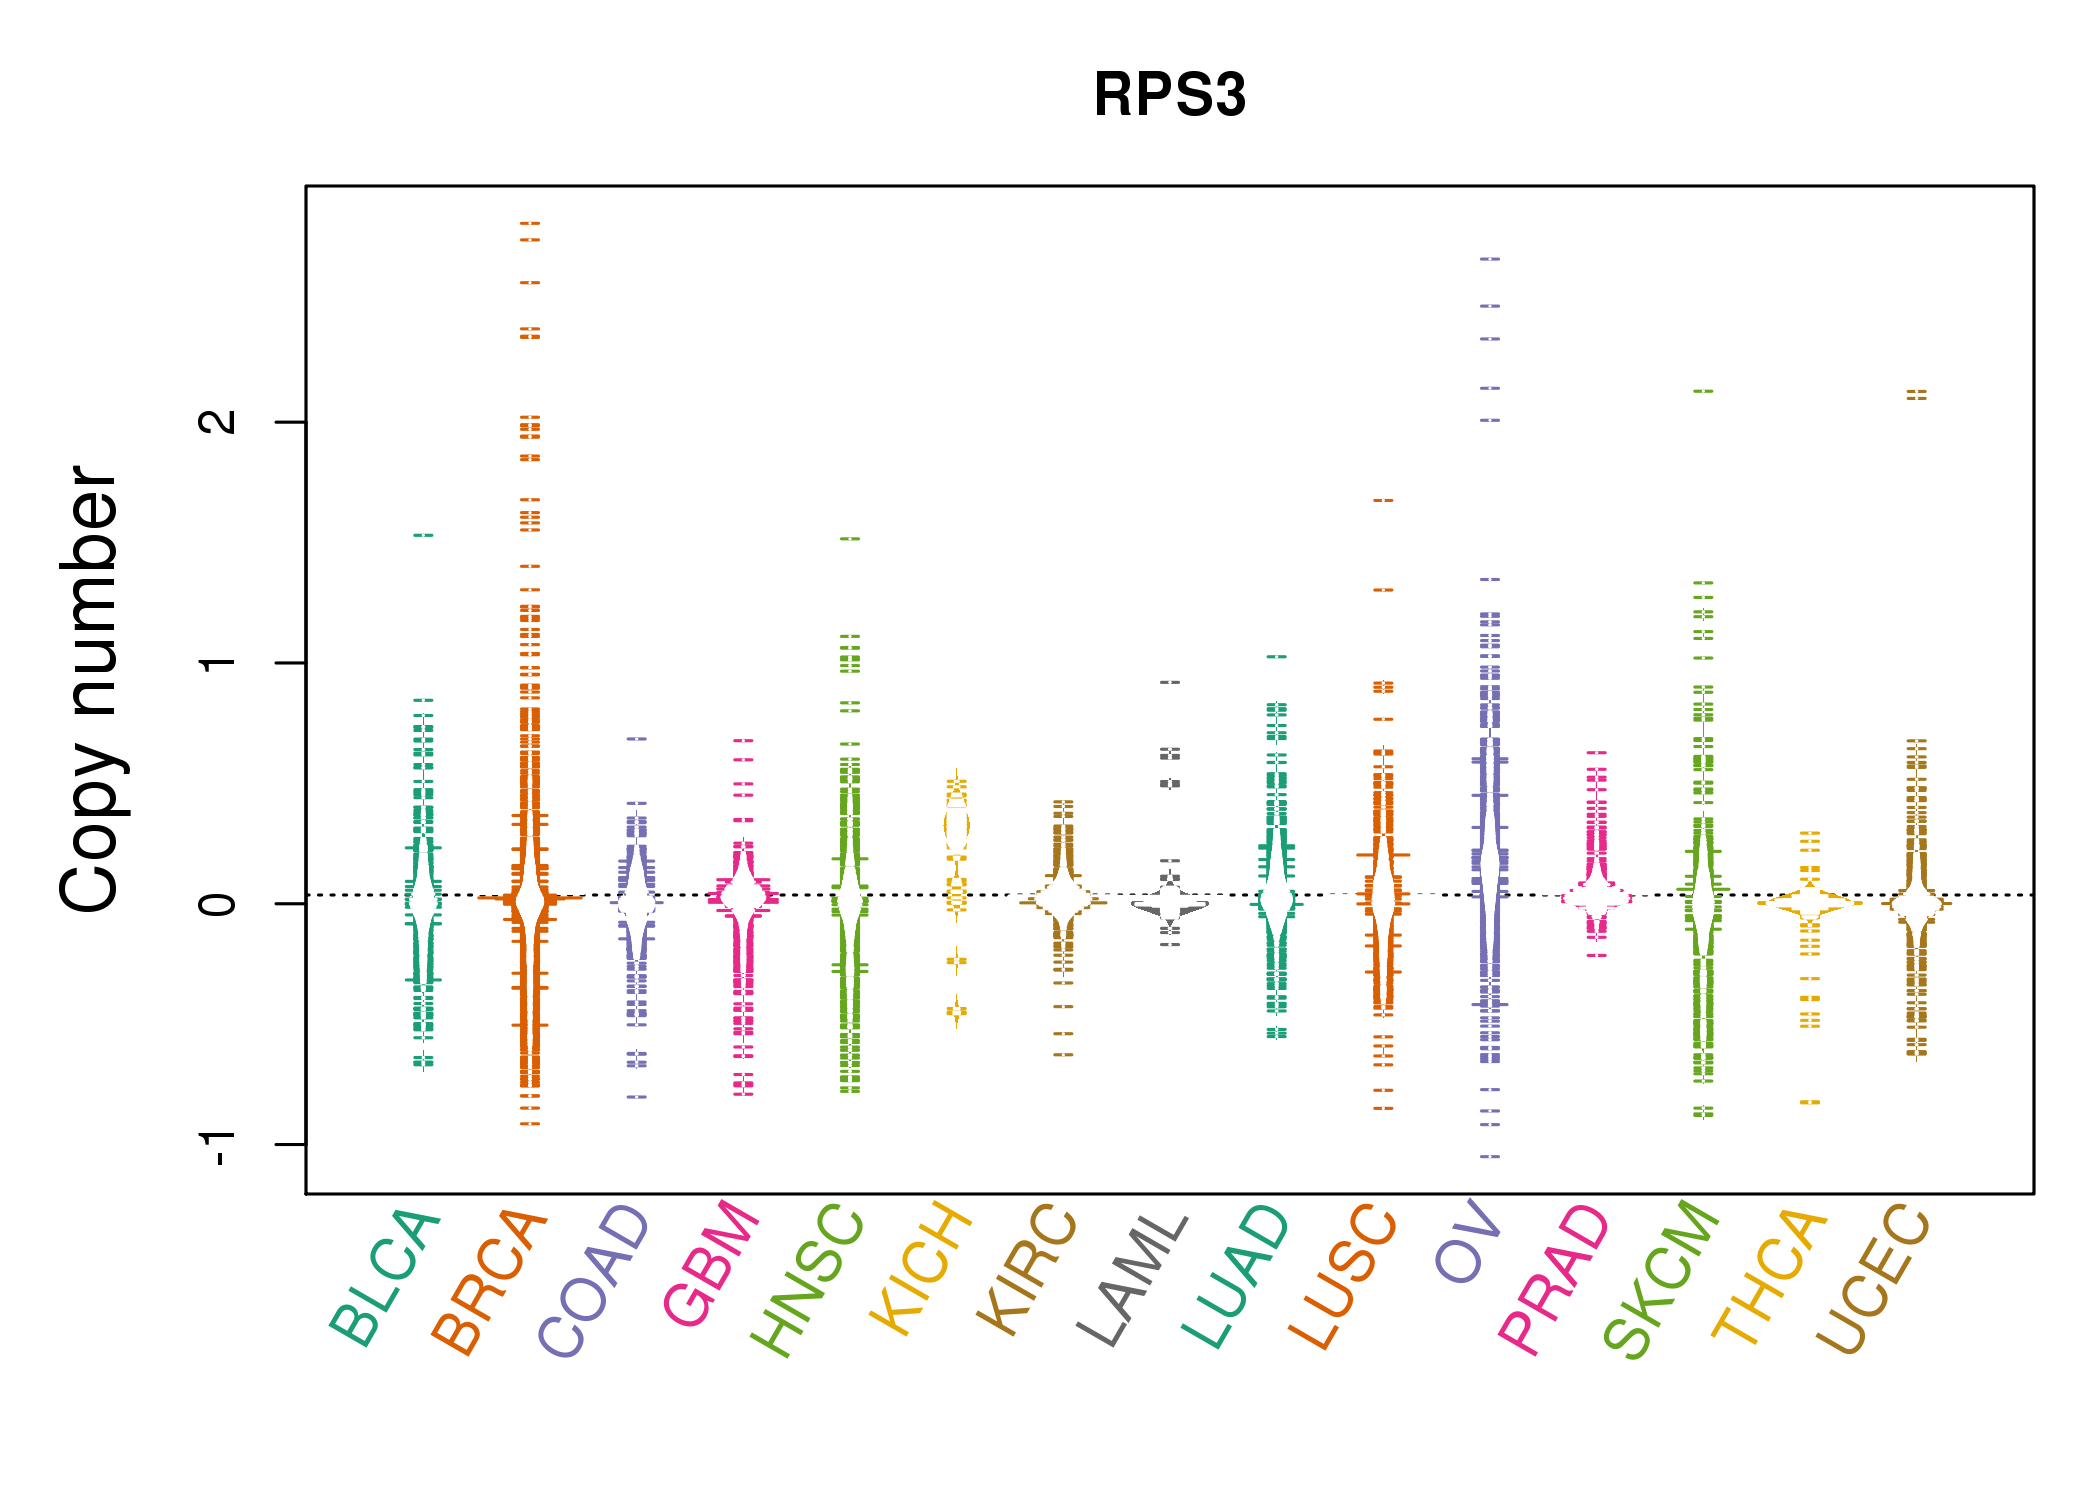 |
| cf) Tissue ID[Tissue type]: BLCA[Bladder Urothelial Carcinoma], BRCA[Breast invasive carcinoma], CESC[Cervical squamous cell carcinoma and endocervical adenocarcinoma], COAD[Colon adenocarcinoma], GBM[Glioblastoma multiforme], Glioma Low Grade, HNSC[Head and Neck squamous cell carcinoma], KICH[Kidney Chromophobe], KIRC[Kidney renal clear cell carcinoma], KIRP[Kidney renal papillary cell carcinoma], LAML[Acute Myeloid Leukemia], LUAD[Lung adenocarcinoma], LUSC[Lung squamous cell carcinoma], OV[Ovarian serous cystadenocarcinoma ], PAAD[Pancreatic adenocarcinoma], PRAD[Prostate adenocarcinoma], SKCM[Skin Cutaneous Melanoma], STAD[Stomach adenocarcinoma], THCA[Thyroid carcinoma], UCEC[Uterine Corpus Endometrial Carcinoma] |
| Top |
| Gene Expression for RPS3 |
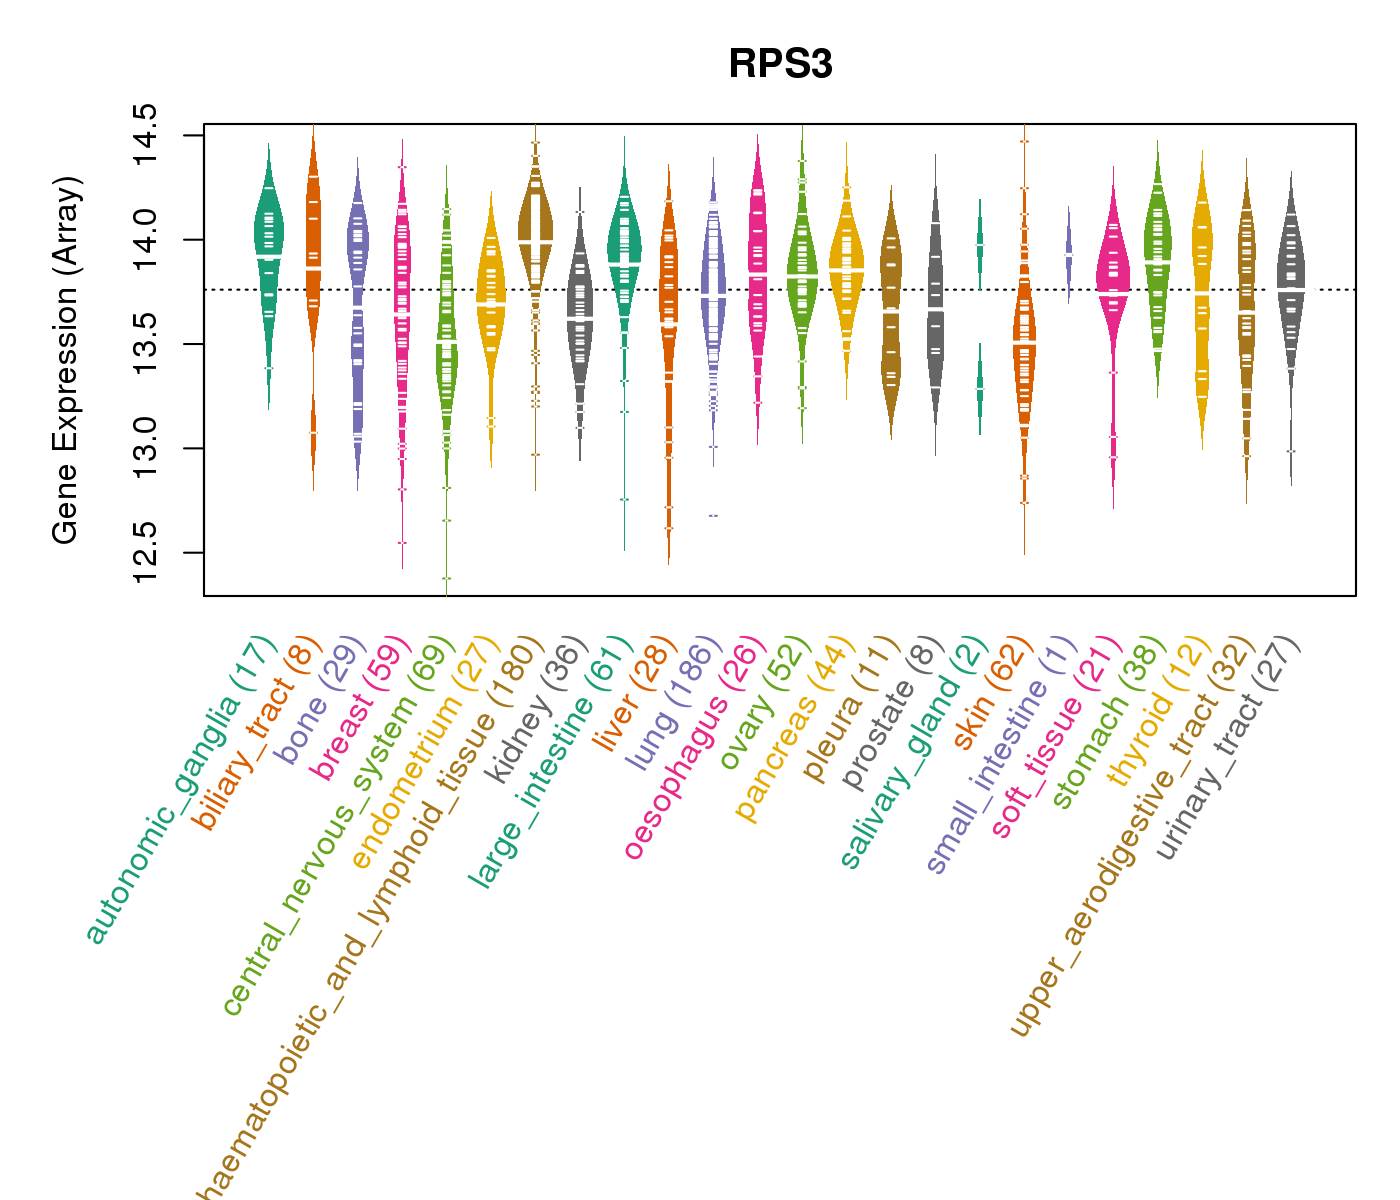
| * CCLE gene expression data were extracted from CCLE_Expression_Entrez_2012-10-18.res: Gene-centric RMA-normalized mRNA expression data. |
 |
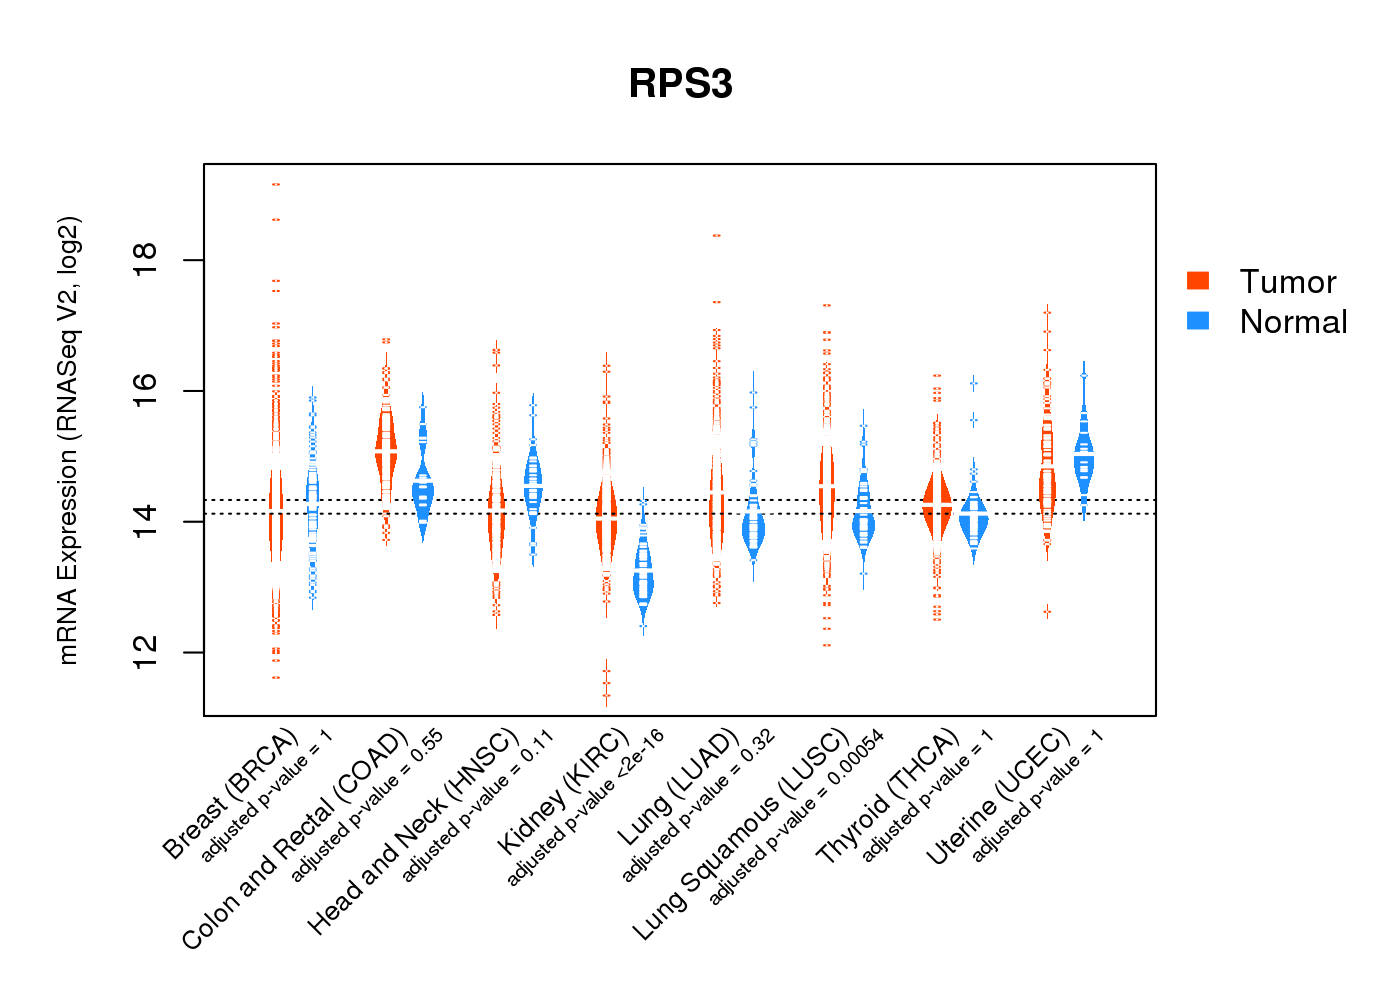
| * Normalized gene expression data of RNASeqV2 was extracted from TCGA using R package TCGA-Assembler. The URLs of all public data files on TCGA DCC data server were gathered at Jan-05-2015. Only eight cancer types have enough normal control samples for differential expression analysis. (t test, adjusted p<0.05 (using Benjamini-Hochberg FDR)) |
 |
| Top |
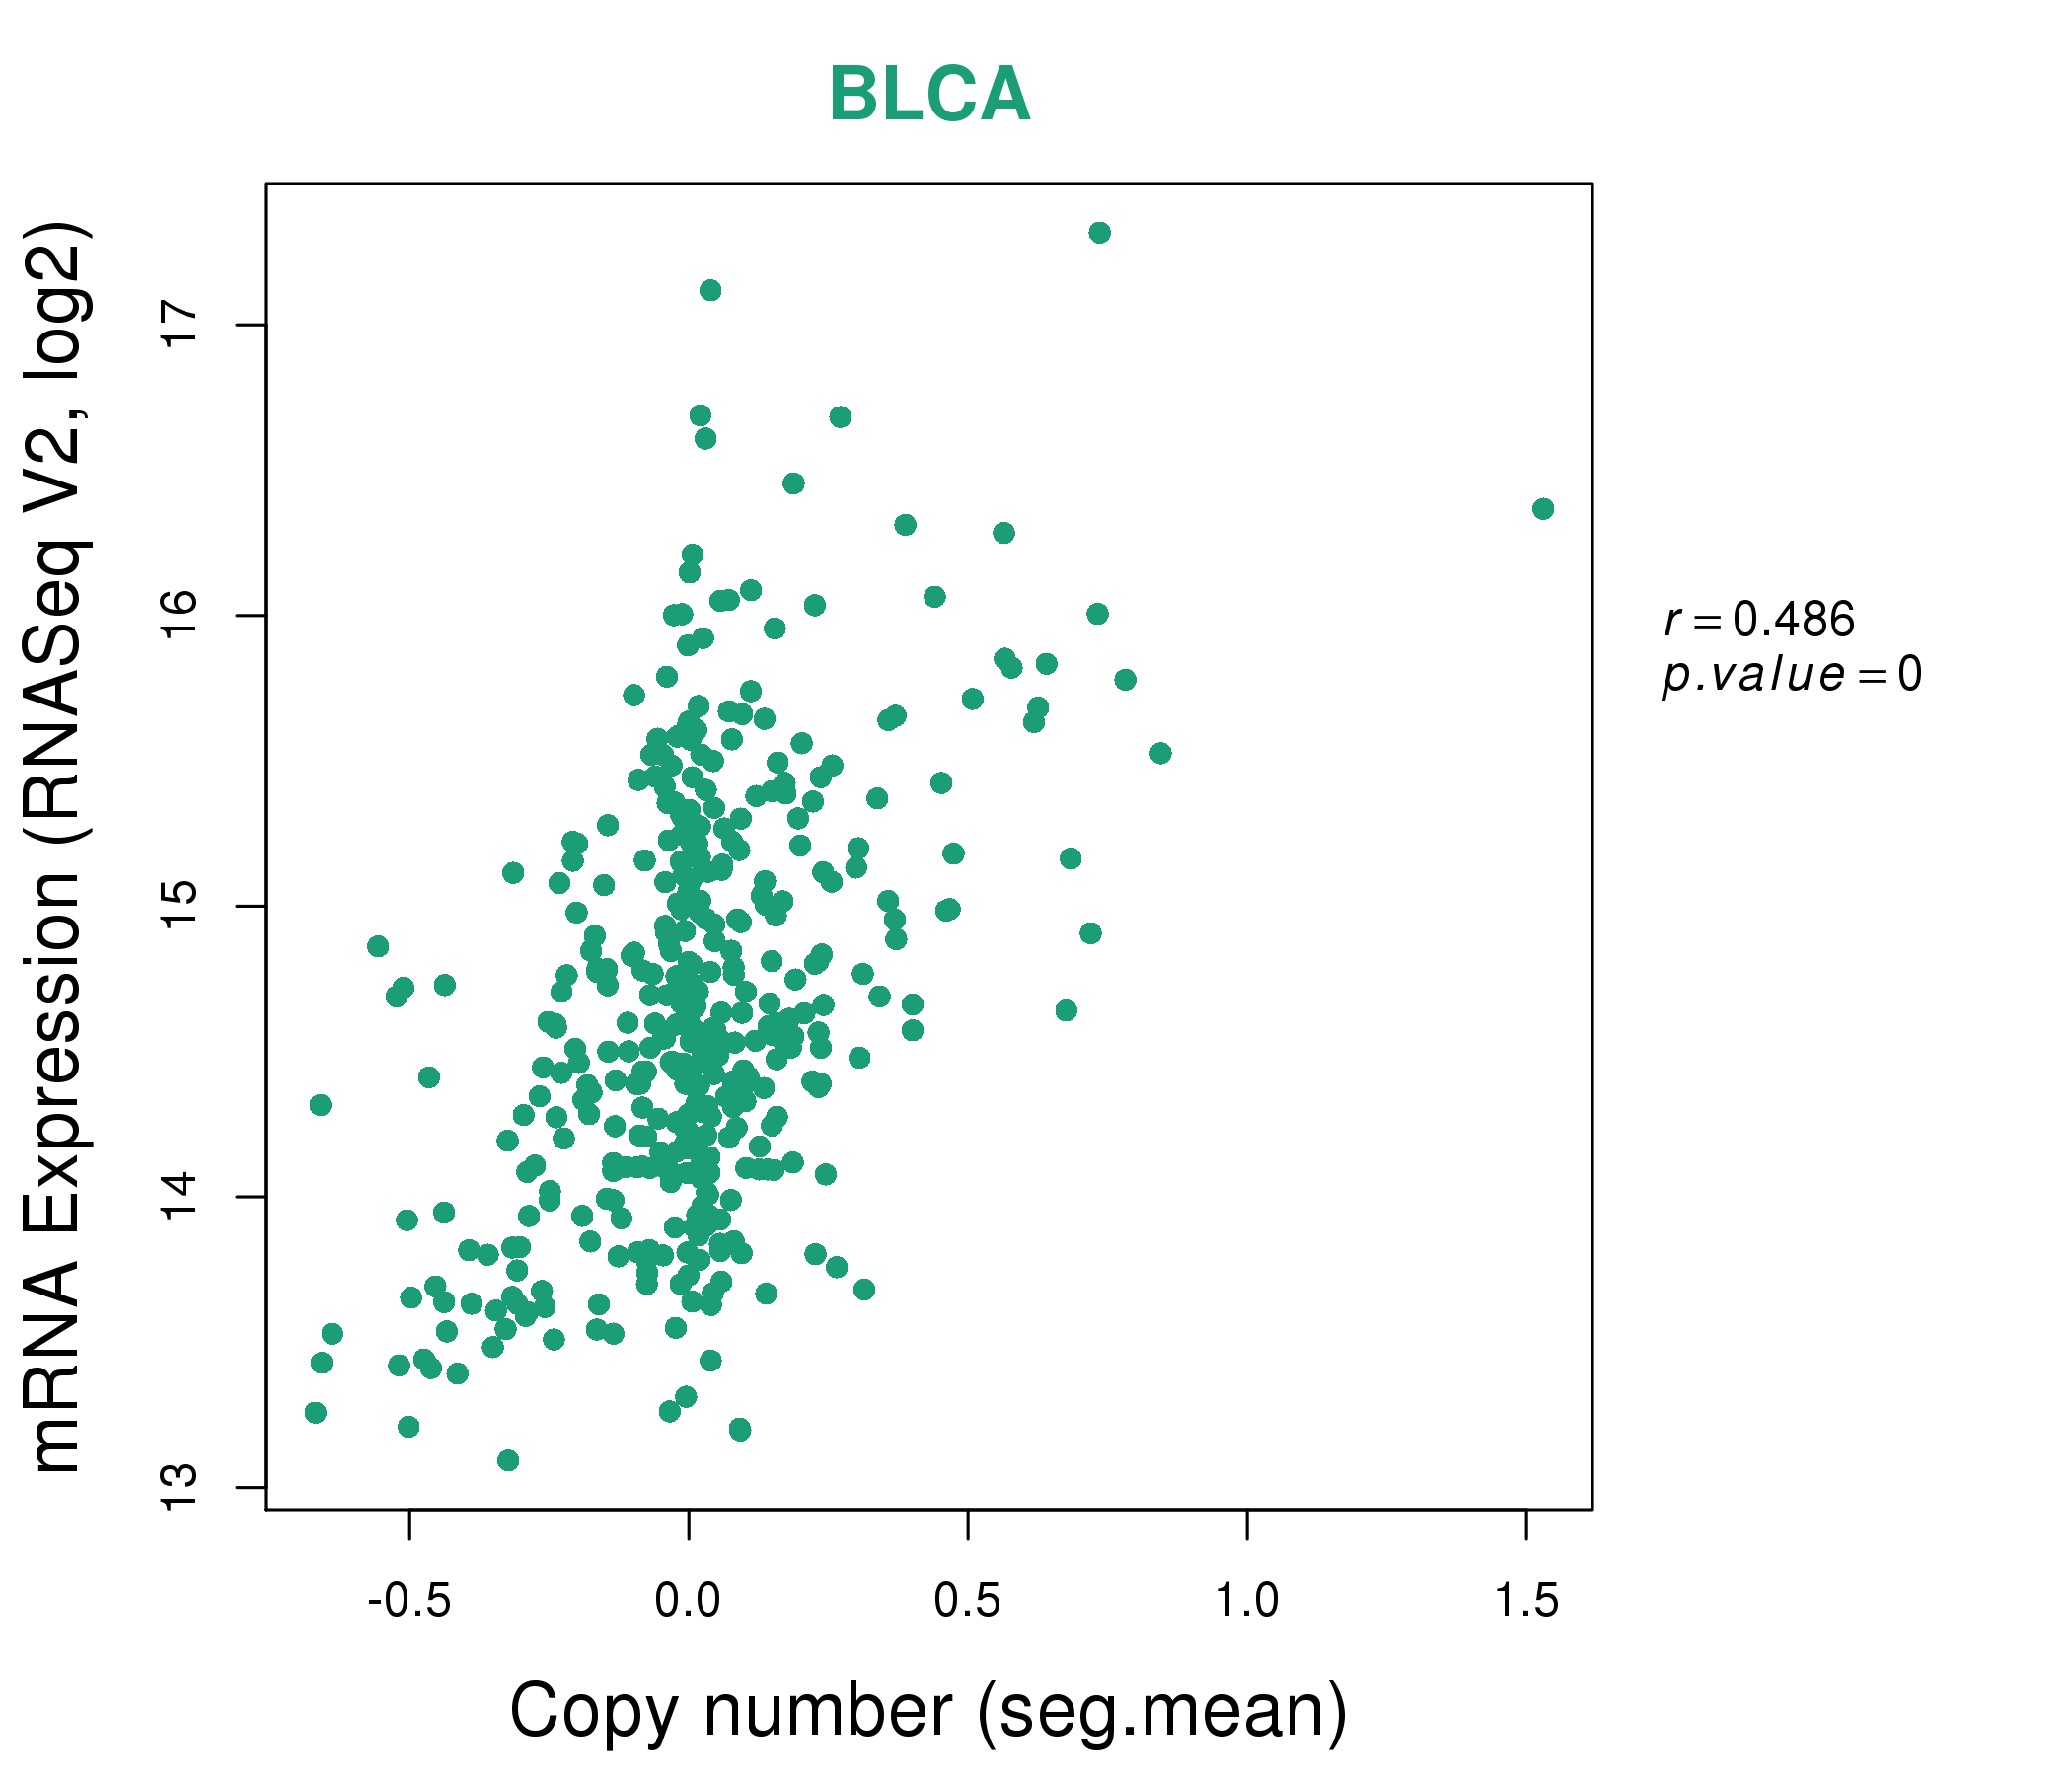
| * This plots show the correlation between CNV and gene expression. |
: Open all plots for all cancer types
 |
|
 |
|

| Top |
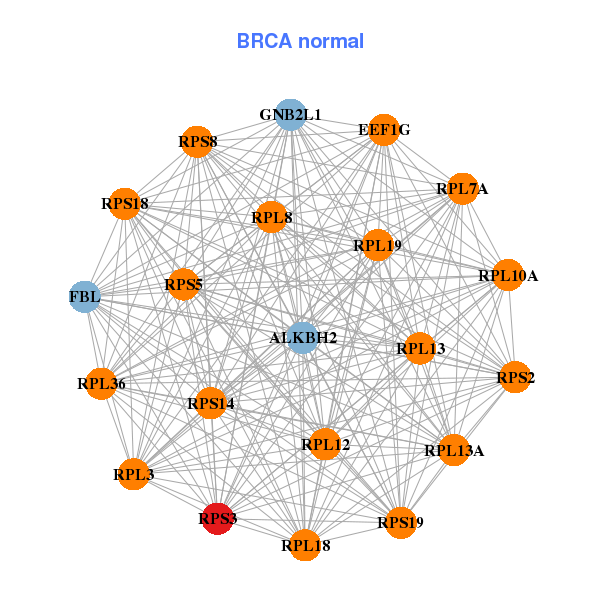
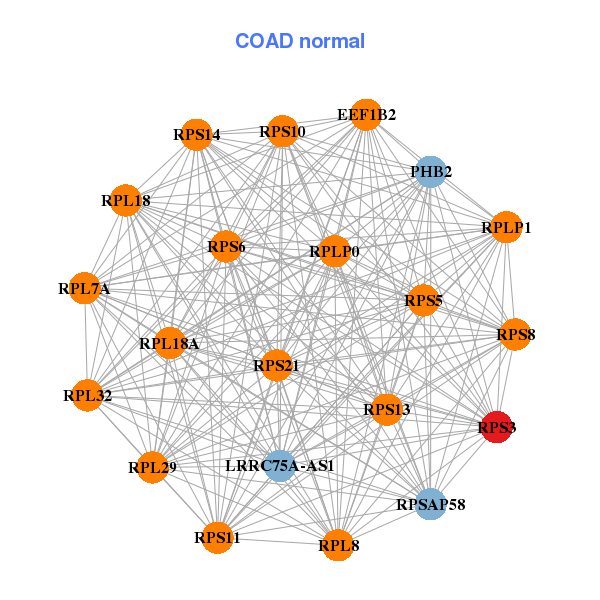
| Gene-Gene Network Information |
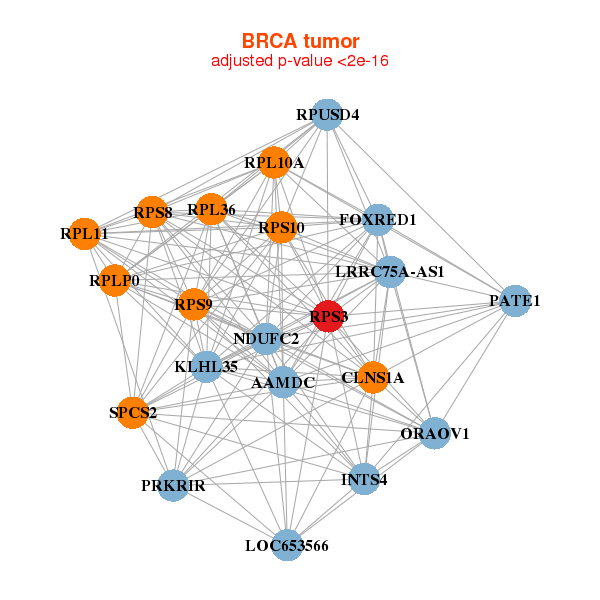
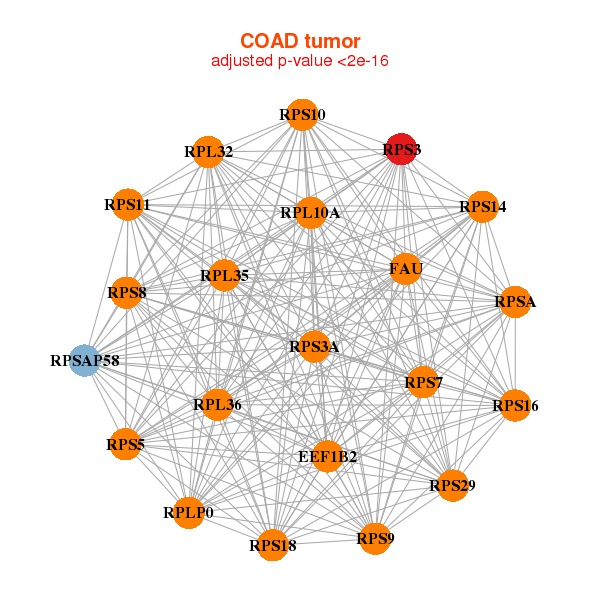
| * Co-Expression network figures were drawn using R package igraph. Only the top 20 genes with the highest correlations were shown. Red circle: input gene, orange circle: cell metabolism gene, sky circle: other gene |
: Open all plots for all cancer types
 |
|
| EEF1A1,EEF1A1P9,EEF1B2,EEF1G,RPL10A,RPL11,RPL17, RPL22,RPL27,RPL31,RPL34,RPL3,RPL5,RPL6, RPL7A,RPS14,RPS18,RPS23,RPS3A,RPS4X,RPS8 | BTF3,CCT4,DPH5,EEF1B2,NPM1,RPL15,RPL22, RPL32,RPL35A,RPL41,RPL5,RPL6,RPL7,RPS15A, RPS23,RPS24,RPS27A,RPS3A,RPS4X,RPS6,RPS7 |
 |
|
| EEF1A1,EEF1A1P9,EEF1B2,RPL10A,RPL15,RPL18A,RPL35, RPL41,RPS10,RPS14,RPS18,RPS29,RPS3,RPS3A, RPS5,RPS6,RPS7,RPS8,RPS9,RPSA,RPSAP58 | DPY30,EEF1B2,MED28,PFDN5,RPL24,RPL27A,RPL35, RPL41,RPL5,RPS10,RPS14,RPS18,RPS3A,RPS5, RPS6,RPS7,RPS8,RPSAP58,RSL24D1,TMEM14B,TPT1 |
| * Co-Expression network figures were drawn using R package igraph. Only the top 20 genes with the highest correlations were shown. Red circle: input gene, orange circle: cell metabolism gene, sky circle: other gene |
: Open all plots for all cancer types
| Top |
: Open all interacting genes' information including KEGG pathway for all interacting genes from DAVID
| Top |
| Pharmacological Information for RPS3 |
| There's no related Drug. |
| Top |
| Cross referenced IDs for RPS3 |
| * We obtained these cross-references from Uniprot database. It covers 150 different DBs, 18 categories. http://www.uniprot.org/help/cross_references_section |
: Open all cross reference information
|
Copyright © 2016-Present - The Univsersity of Texas Health Science Center at Houston @ |