|
||||||||||||||||||||
| |
| Phenotypic Information (metabolism pathway, cancer, disease, phenome) |
| |
| |
| Gene-Gene Network Information: Co-Expression Network, Interacting Genes & KEGG |
| |
|


| Gene Summary for BGN |
| Basic gene info. | Gene symbol | BGN |
| Gene name | biglycan | |
| Synonyms | DSPG1|PG-S1|PGI|SLRR1A | |
| Cytomap | UCSC genome browser: Xq28 | |
| Genomic location | chrX :152760346-152775004 | |
| Type of gene | protein-coding | |
| RefGenes | NM_001711.4, | |
| Ensembl id | ENSG00000269168 | |
| Description | biglycan proteoglycanbone/cartilage proteoglycan Ibone/cartilage proteoglycan-Idermatan sulphate proteoglycan Ismall leucine-rich protein 1A | |
| Modification date | 20141222 | |
| dbXrefs | MIM : 301870 | |
| HGNC : HGNC | ||
| Ensembl : ENSG00000182492 | ||
| HPRD : 02359 | ||
| Vega : OTTHUMG00000024205 | ||
| Protein | UniProt: P21810 go to UniProt's Cross Reference DB Table | |
| Expression | CleanEX: HS_BGN | |
| BioGPS: 633 | ||
| Gene Expression Atlas: ENSG00000269168 | ||
| The Human Protein Atlas: ENSG00000269168 | ||
| Pathway | NCI Pathway Interaction Database: BGN | |
| KEGG: BGN | ||
| REACTOME: BGN | ||
| ConsensusPathDB | ||
| Pathway Commons: BGN | ||
| Metabolism | MetaCyc: BGN | |
| HUMANCyc: BGN | ||
| Regulation | Ensembl's Regulation: ENSG00000269168 | |
| miRBase: chrX :152,760,346-152,775,004 | ||
| TargetScan: NM_001711 | ||
| cisRED: ENSG00000269168 | ||
| Context | iHOP: BGN | |
| cancer metabolism search in PubMed: BGN | ||
| UCL Cancer Institute: BGN | ||
| Assigned class in ccmGDB | B - This gene belongs to cancer gene. | |
| Top |
| Phenotypic Information for BGN(metabolism pathway, cancer, disease, phenome) |
| Cancer | CGAP: BGN |
| Familial Cancer Database: BGN | |
| * This gene is included in those cancer gene databases. |
|
|
|
|
|
| . | ||||||||||||||
Oncogene 1 | Significant driver gene in | |||||||||||||||||||
| cf) number; DB name 1 Oncogene; http://nar.oxfordjournals.org/content/35/suppl_1/D721.long, 2 Tumor Suppressor gene; https://bioinfo.uth.edu/TSGene/, 3 Cancer Gene Census; http://www.nature.com/nrc/journal/v4/n3/abs/nrc1299.html, 4 CancerGenes; http://nar.oxfordjournals.org/content/35/suppl_1/D721.long, 5 Network of Cancer Gene; http://ncg.kcl.ac.uk/index.php, 1Therapeutic Vulnerabilities in Cancer; http://cbio.mskcc.org/cancergenomics/statius/ |
| REACTOME_METABOLISM_OF_CARBOHYDRATES | |
| OMIM | 301870; gene. |
| Orphanet | |
| Disease | KEGG Disease: BGN |
| MedGen: BGN (Human Medical Genetics with Condition) | |
| ClinVar: BGN | |
| Phenotype | MGI: BGN (International Mouse Phenotyping Consortium) |
| PhenomicDB: BGN | |
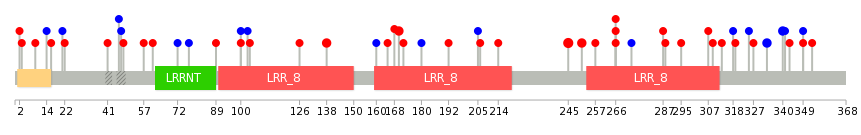
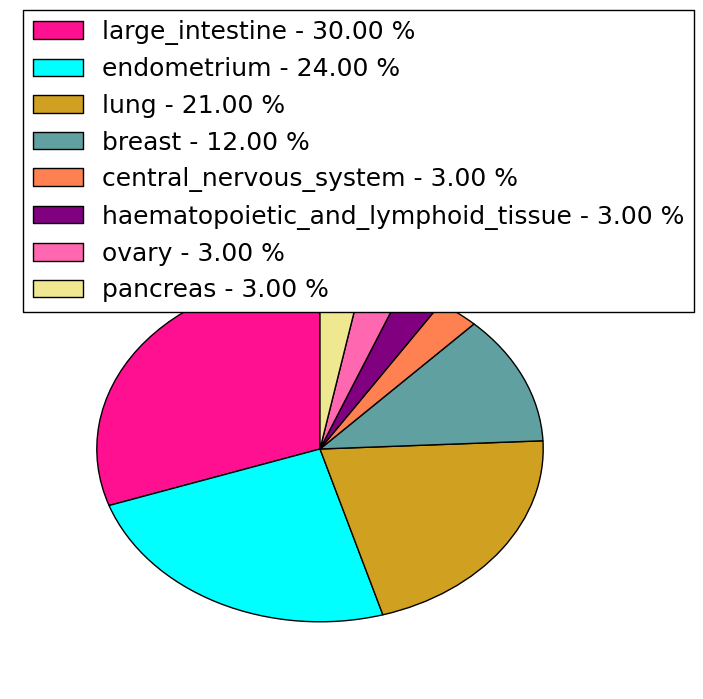
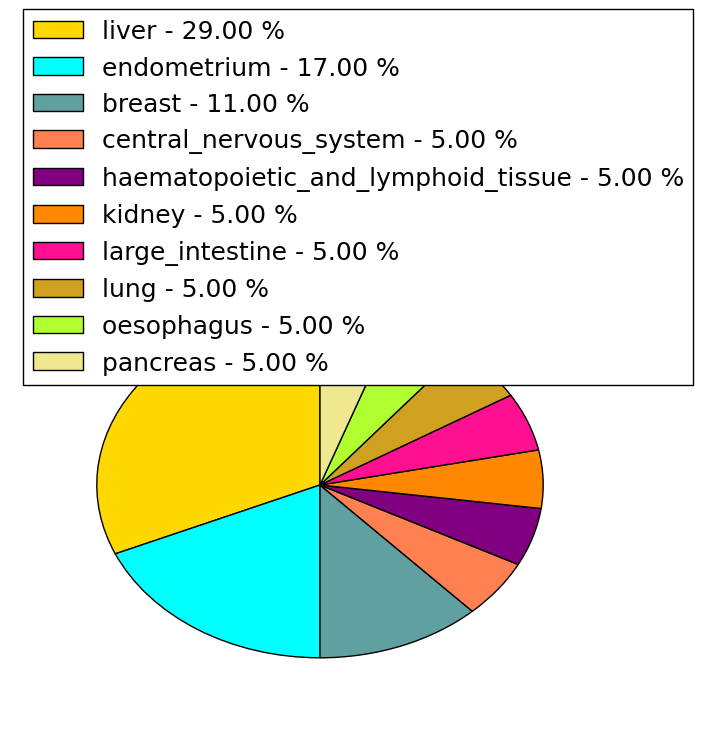
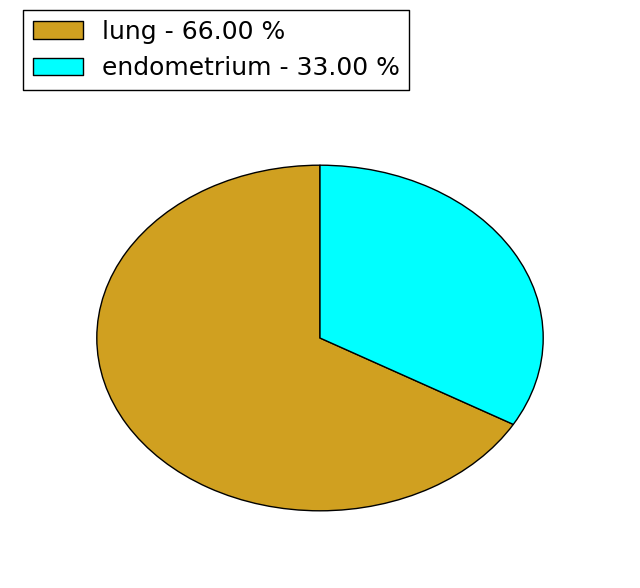
| Mutations for BGN |
| * Under tables are showing count per each tissue to give us broad intuition about tissue specific mutation patterns.You can go to the detailed page for each mutation database's web site. |
| There's no structural variation information in COSMIC data for this gene. |
| * From mRNA Sanger sequences, Chitars2.0 arranged chimeric transcripts. This table shows BGN related fusion information. |
| ID | Head Gene | Tail Gene | Accession | Gene_a | qStart_a | qEnd_a | Chromosome_a | tStart_a | tEnd_a | Gene_a | qStart_a | qEnd_a | Chromosome_a | tStart_a | tEnd_a |
| BF871520 | ADCY9 | 1 | 68 | 16 | 4099044 | 4099111 | BGN | 59 | 160 | X | 152774633 | 152774735 | |
| AW613805 | NFKBIB | 1 | 303 | 19 | 39398899 | 39399204 | BGN | 297 | 429 | X | 152774168 | 152774300 | |
| BU617112 | BGN | 19 | 553 | X | 152774480 | 152775004 | NCL | 552 | 696 | 2 | 232321418 | 232321799 | |
| AX746813 | TSHZ1 | 1 | 2984 | 18 | 72922752 | 72999940 | BGN | 2978 | 3370 | X | 152774612 | 152775004 | |
| ES309565 | LRRFIP2 | 24 | 103 | 3 | 37190498 | 37216077 | BGN | 100 | 368 | X | 152774210 | 152774478 | |
| BF437005 | BGN | 5 | 201 | X | 152774808 | 152775004 | ADAMTS1 | 197 | 540 | 21 | 28209980 | 28210323 | |
| BF930412 | SLC25A26 | 9 | 287 | 3 | 66436618 | 66436898 | BGN | 285 | 350 | X | 152771406 | 152771471 | |
| DB313457 | BGN | 1 | 393 | X | 152774612 | 152775004 | TSHZ1 | 387 | 535 | 18 | 72999792 | 72999940 | |
| BF985568 | SUPT6H | 30 | 195 | 17 | 27027444 | 27028038 | BGN | 188 | 351 | X | 152773754 | 152773917 | |
| BQ183196 | BGN | 19 | 539 | X | 152774467 | 152775004 | PPP1R12B | 529 | 556 | 1 | 202469358 | 202469394 | |
| AW340724 | BGN | 1 | 251 | X | 152774754 | 152775004 | FLNC | 248 | 520 | 7 | 128478739 | 128480617 | |
| Top |
| There's no copy number variation information in COSMIC data for this gene. |
| Top |
|
 |
| Top |
| Stat. for Non-Synonymous SNVs (# total SNVs=33) | (# total SNVs=17) |
 |  |
(# total SNVs=3) | (# total SNVs=0) |
 |
| Top |
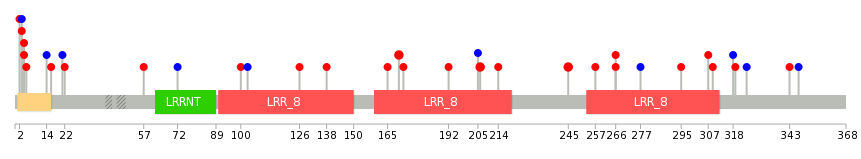
| * When you move the cursor on each content, you can see more deailed mutation information on the Tooltip. Those are primary_site,primary_histology,mutation(aa),pubmedID. |
| GRCh37 position | Mutation(aa) | Unique sampleID count |
| chr23:152772344-152772344 | p.E245K | 3 |
| chr23:152771381-152771381 | p.R138W | 2 |
| chr23:152773795-152773795 | p.N333N | 2 |
| chr23:152773816-152773816 | p.N340N | 2 |
| chr23:152772362-152772362 | p.R251C | 2 |
| chr23:152771478-152771478 | p.R170H | 2 |
| chr23:152771484-152771484 | p.R172H | 2 |
| chr23:152772036-152772036 | p.F205F | 1 |
| chr23:152770230-152770230 | p.S47S | 1 |
| chr23:152772553-152772553 | p.L273L | 1 |
| Top |
|
 |
| Point Mutation/ Tissue ID | 1 | 2 | 3 | 4 | 5 | 6 | 7 | 8 | 9 | 10 | 11 | 12 | 13 | 14 | 15 | 16 | 17 | 18 | 19 | 20 |
| # sample | 1 | 2 | 6 | 1 | 7 | 1 | 3 | 3 | 1 | 8 | ||||||||||
| # mutation | 2 | 2 | 6 | 1 | 9 | 1 | 3 | 3 | 1 | 9 | ||||||||||
| nonsynonymous SNV | 1 | 1 | 6 | 6 | 1 | 3 | 2 | 1 | 6 | |||||||||||
| synonymous SNV | 1 | 1 | 1 | 3 | 1 | 3 |
| cf) Tissue ID; Tissue type (1; BLCA[Bladder Urothelial Carcinoma], 2; BRCA[Breast invasive carcinoma], 3; CESC[Cervical squamous cell carcinoma and endocervical adenocarcinoma], 4; COAD[Colon adenocarcinoma], 5; GBM[Glioblastoma multiforme], 6; Glioma Low Grade, 7; HNSC[Head and Neck squamous cell carcinoma], 8; KICH[Kidney Chromophobe], 9; KIRC[Kidney renal clear cell carcinoma], 10; KIRP[Kidney renal papillary cell carcinoma], 11; LAML[Acute Myeloid Leukemia], 12; LUAD[Lung adenocarcinoma], 13; LUSC[Lung squamous cell carcinoma], 14; OV[Ovarian serous cystadenocarcinoma ], 15; PAAD[Pancreatic adenocarcinoma], 16; PRAD[Prostate adenocarcinoma], 17; SKCM[Skin Cutaneous Melanoma], 18:STAD[Stomach adenocarcinoma], 19:THCA[Thyroid carcinoma], 20:UCEC[Uterine Corpus Endometrial Carcinoma]) |
| Top |
| * We represented just top 10 SNVs. When you move the cursor on each content, you can see more deailed mutation information on the Tooltip. Those are primary_site, primary_histology, mutation(aa), pubmedID. |
| Genomic Position | Mutation(aa) | Unique sampleID count |
| chrX:152772037 | p.R170H | 2 |
| chrX:152772344 | p.D206N | 2 |
| chrX:152771478 | p.E245K | 2 |
| chrX:152773722 | p.I126N | 1 |
| chrX:152770154 | p.S309Y | 1 |
| chrX:152772036 | p.R138W | 1 |
| chrX:152773750 | p.N318N | 1 |
| chrX:152770259 | p.R165S | 1 |
| chrX:152773751 | p.D319N | 1 |
| chrX:152770093 | p.W2R | 1 |
| * Copy number data were extracted from TCGA using R package TCGA-Assembler. The URLs of all public data files on TCGA DCC data server were gathered on Jan-05-2015. Function ProcessCNAData in TCGA-Assembler package was used to obtain gene-level copy number value which is calculated as the average copy number of the genomic region of a gene. |
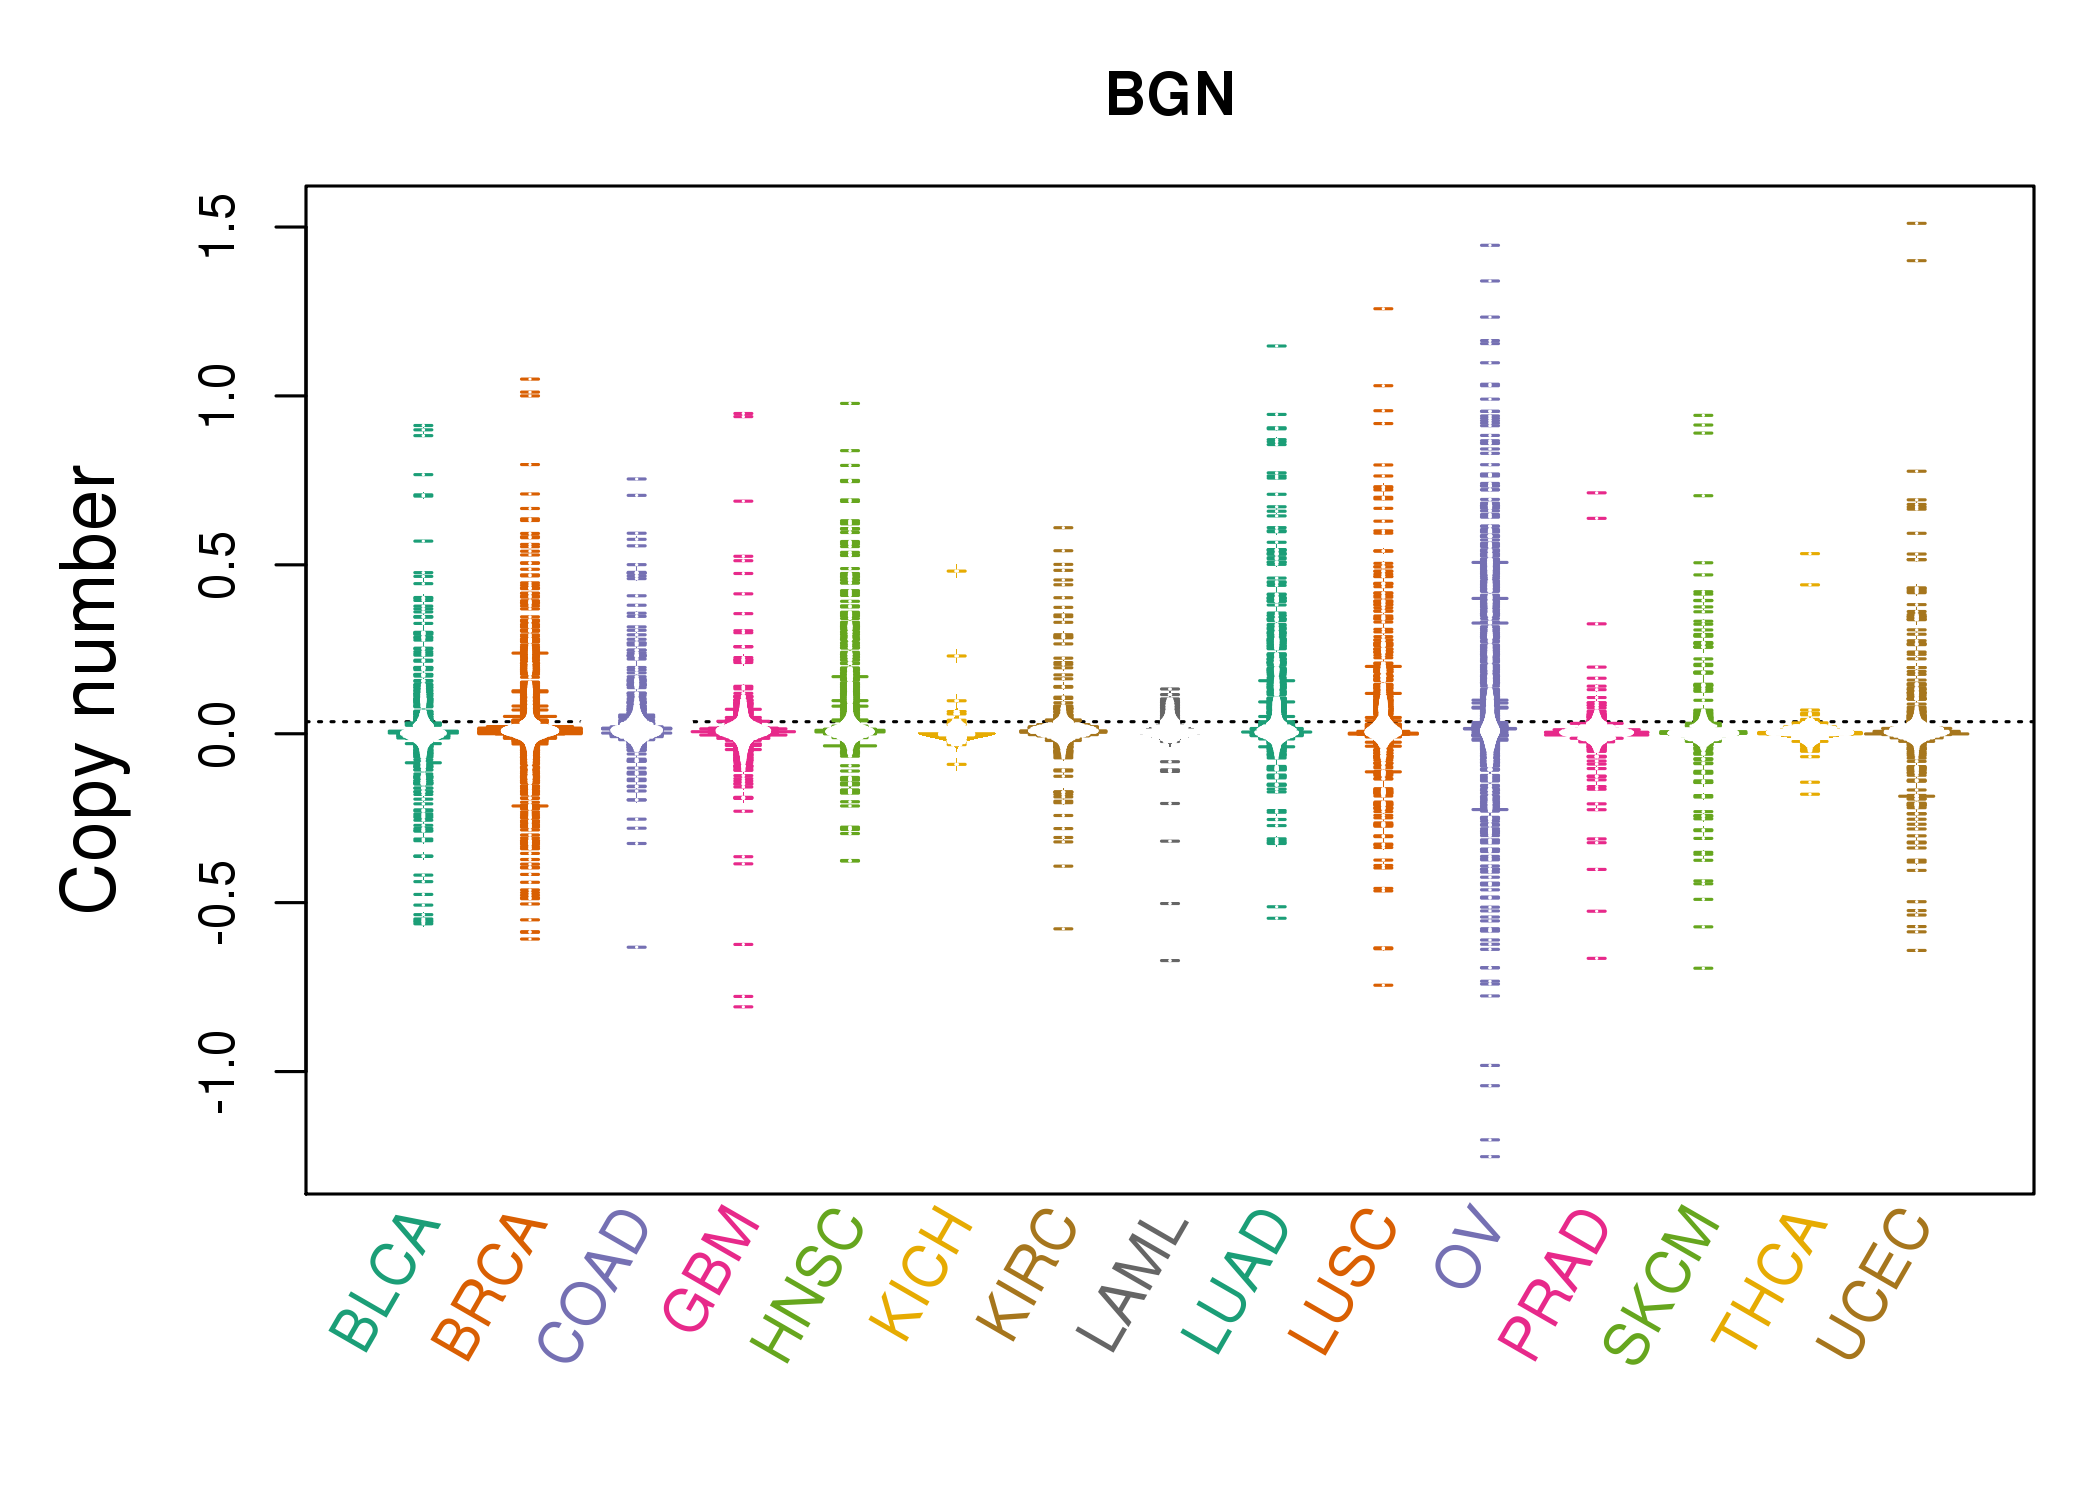 |
| cf) Tissue ID[Tissue type]: BLCA[Bladder Urothelial Carcinoma], BRCA[Breast invasive carcinoma], CESC[Cervical squamous cell carcinoma and endocervical adenocarcinoma], COAD[Colon adenocarcinoma], GBM[Glioblastoma multiforme], Glioma Low Grade, HNSC[Head and Neck squamous cell carcinoma], KICH[Kidney Chromophobe], KIRC[Kidney renal clear cell carcinoma], KIRP[Kidney renal papillary cell carcinoma], LAML[Acute Myeloid Leukemia], LUAD[Lung adenocarcinoma], LUSC[Lung squamous cell carcinoma], OV[Ovarian serous cystadenocarcinoma ], PAAD[Pancreatic adenocarcinoma], PRAD[Prostate adenocarcinoma], SKCM[Skin Cutaneous Melanoma], STAD[Stomach adenocarcinoma], THCA[Thyroid carcinoma], UCEC[Uterine Corpus Endometrial Carcinoma] |
| Top |
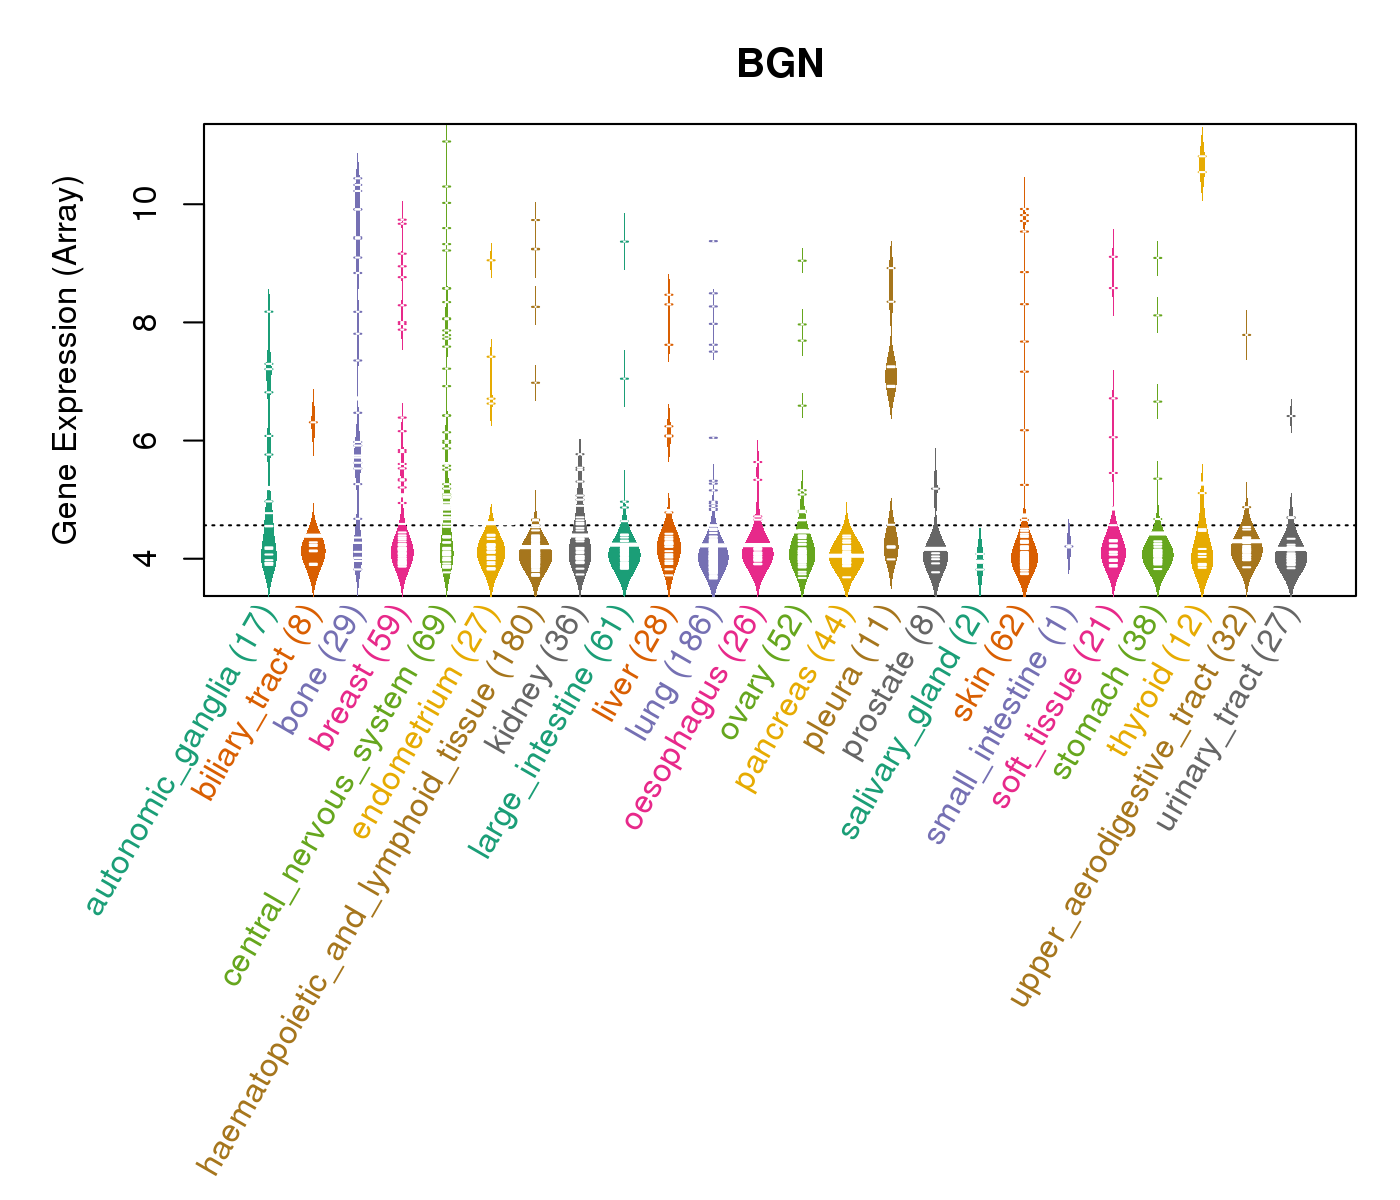
| Gene Expression for BGN |
| * CCLE gene expression data were extracted from CCLE_Expression_Entrez_2012-10-18.res: Gene-centric RMA-normalized mRNA expression data. |
 |
| * Normalized gene expression data of RNASeqV2 was extracted from TCGA using R package TCGA-Assembler. The URLs of all public data files on TCGA DCC data server were gathered at Jan-05-2015. Only eight cancer types have enough normal control samples for differential expression analysis. (t test, adjusted p<0.05 (using Benjamini-Hochberg FDR)) |
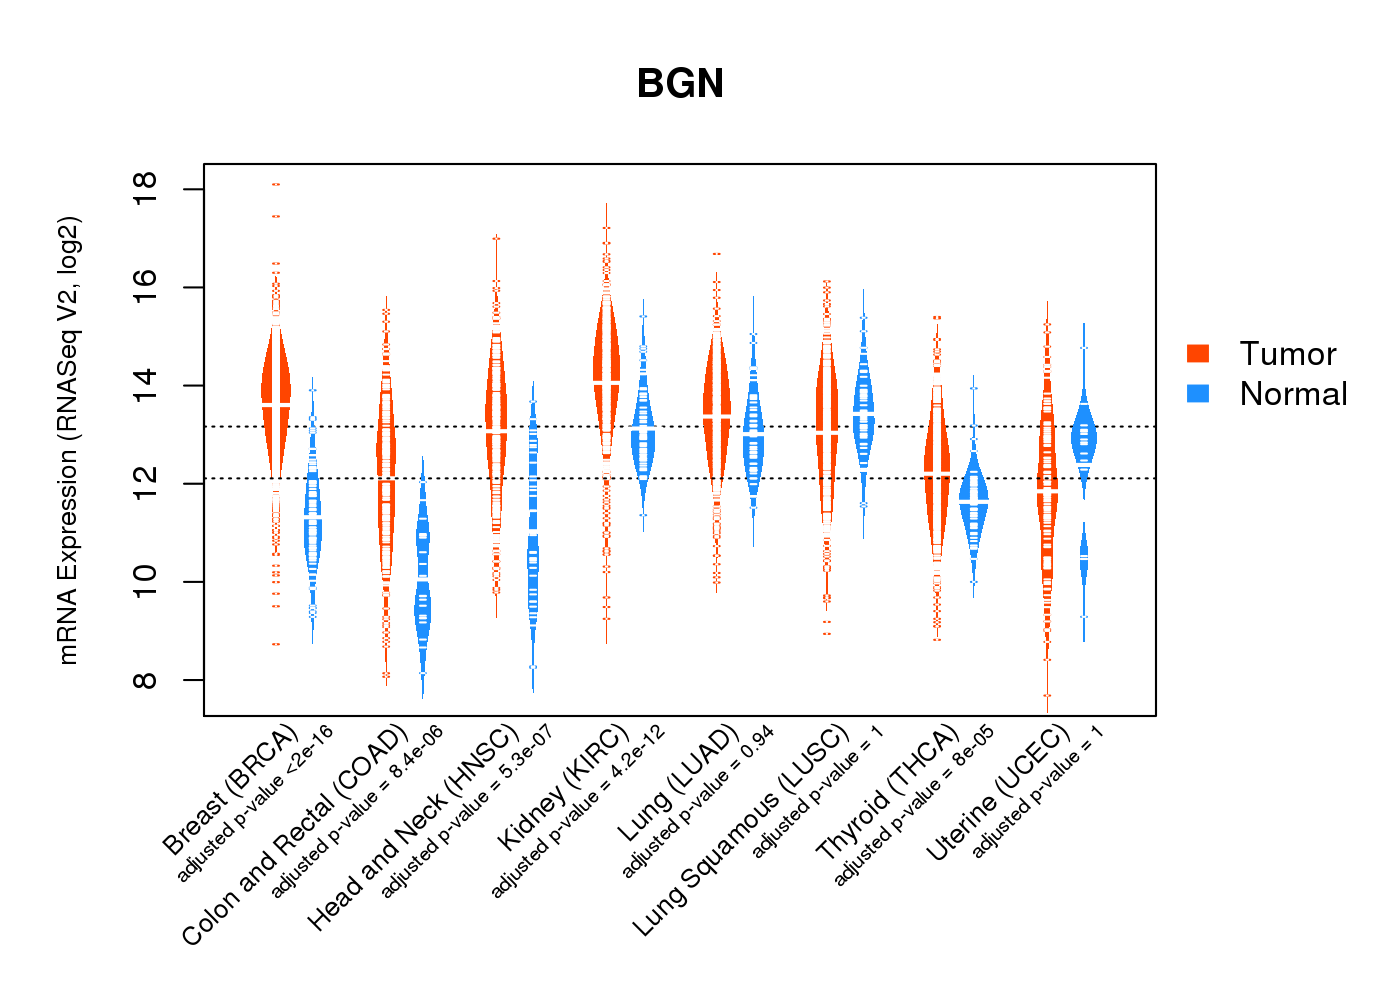 |
| Top |
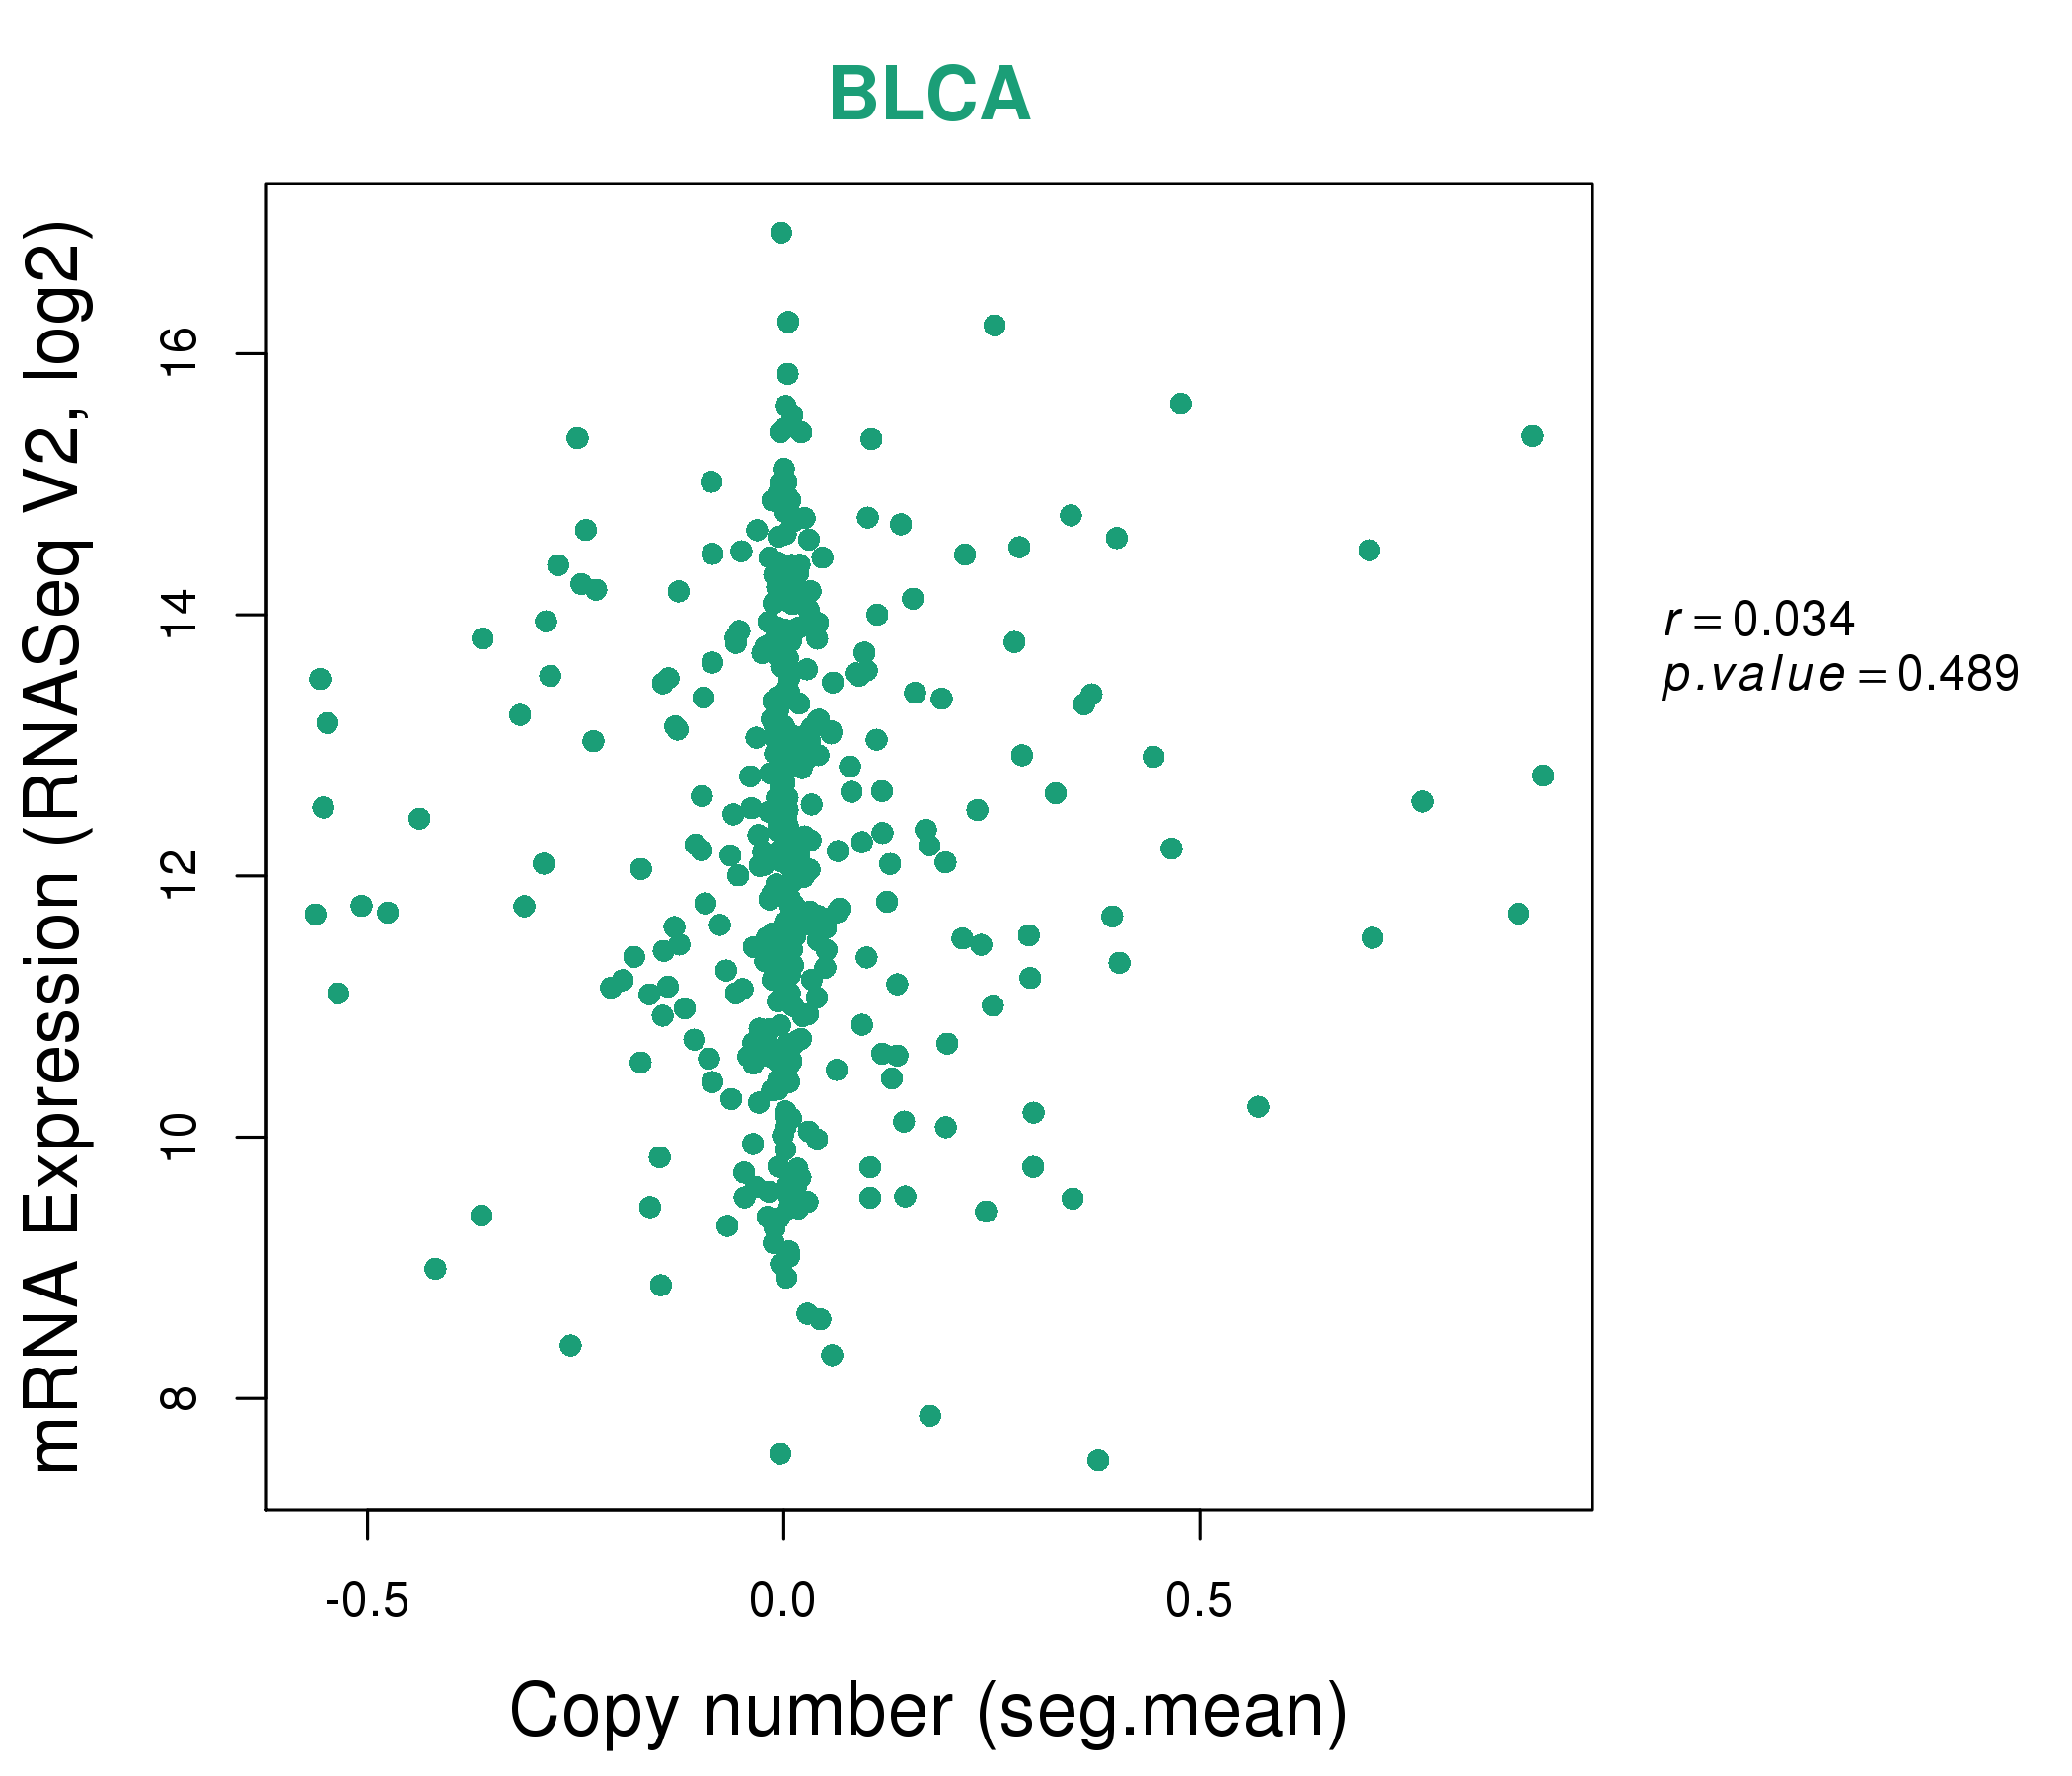
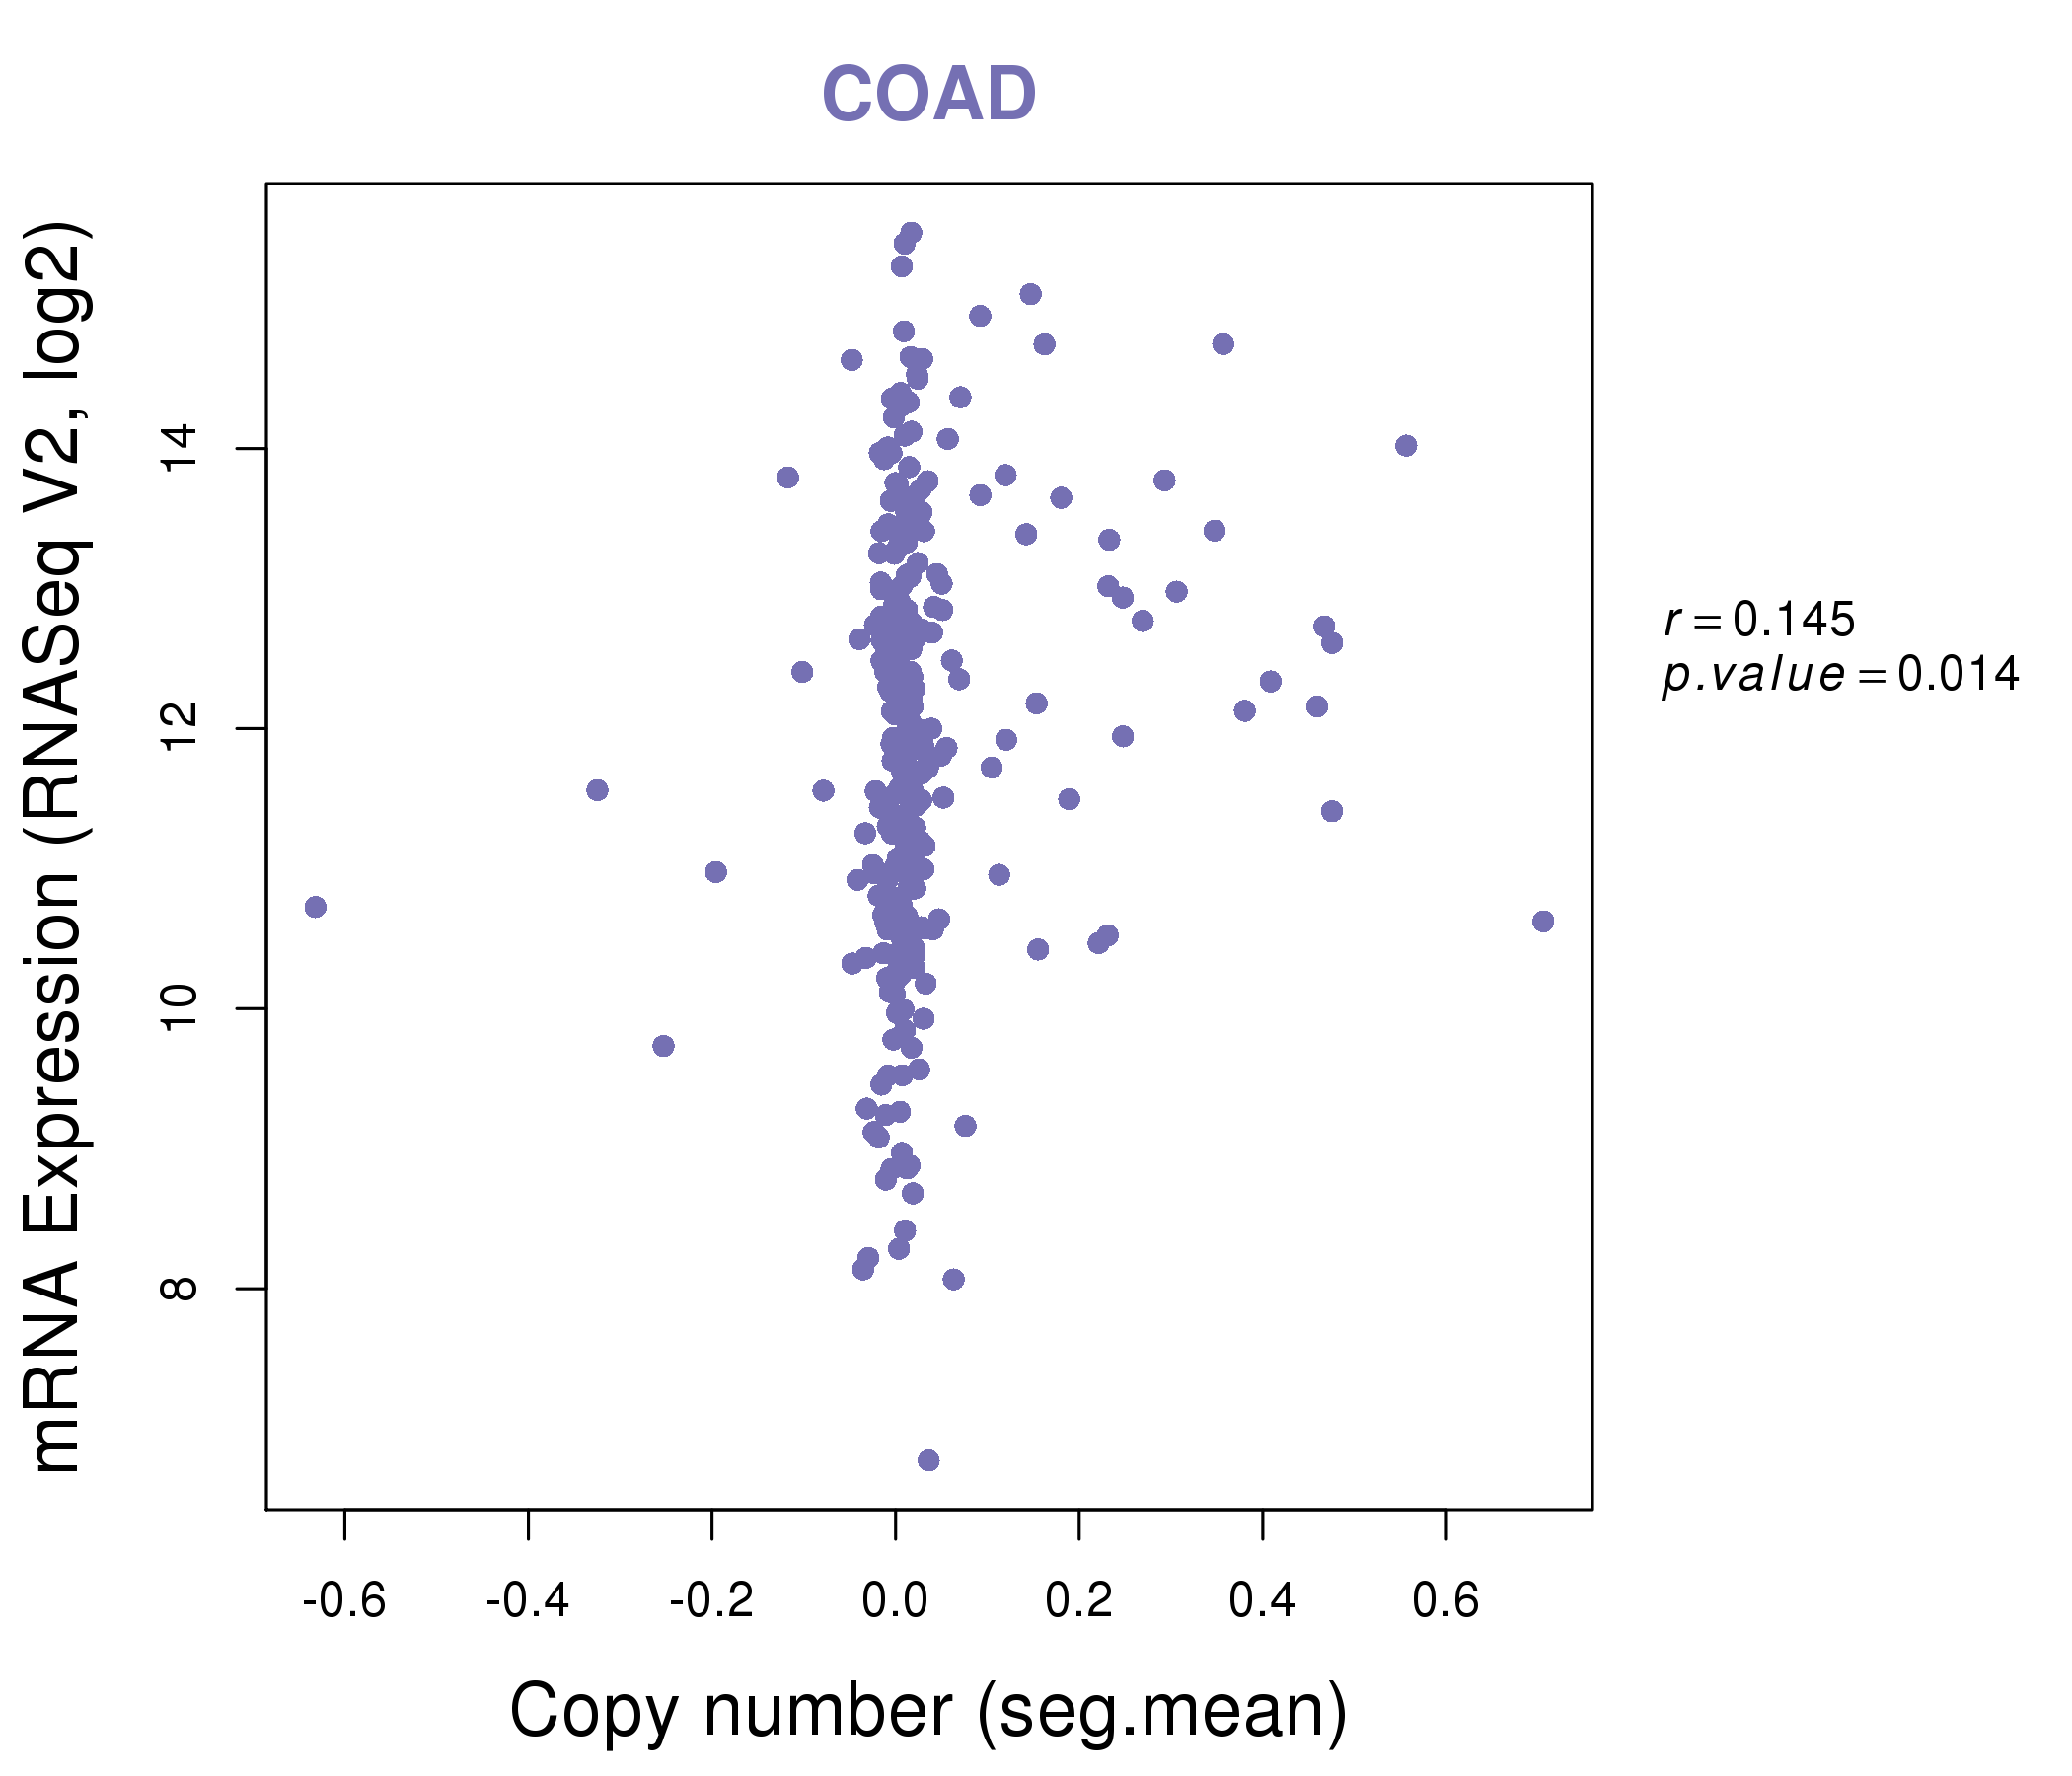
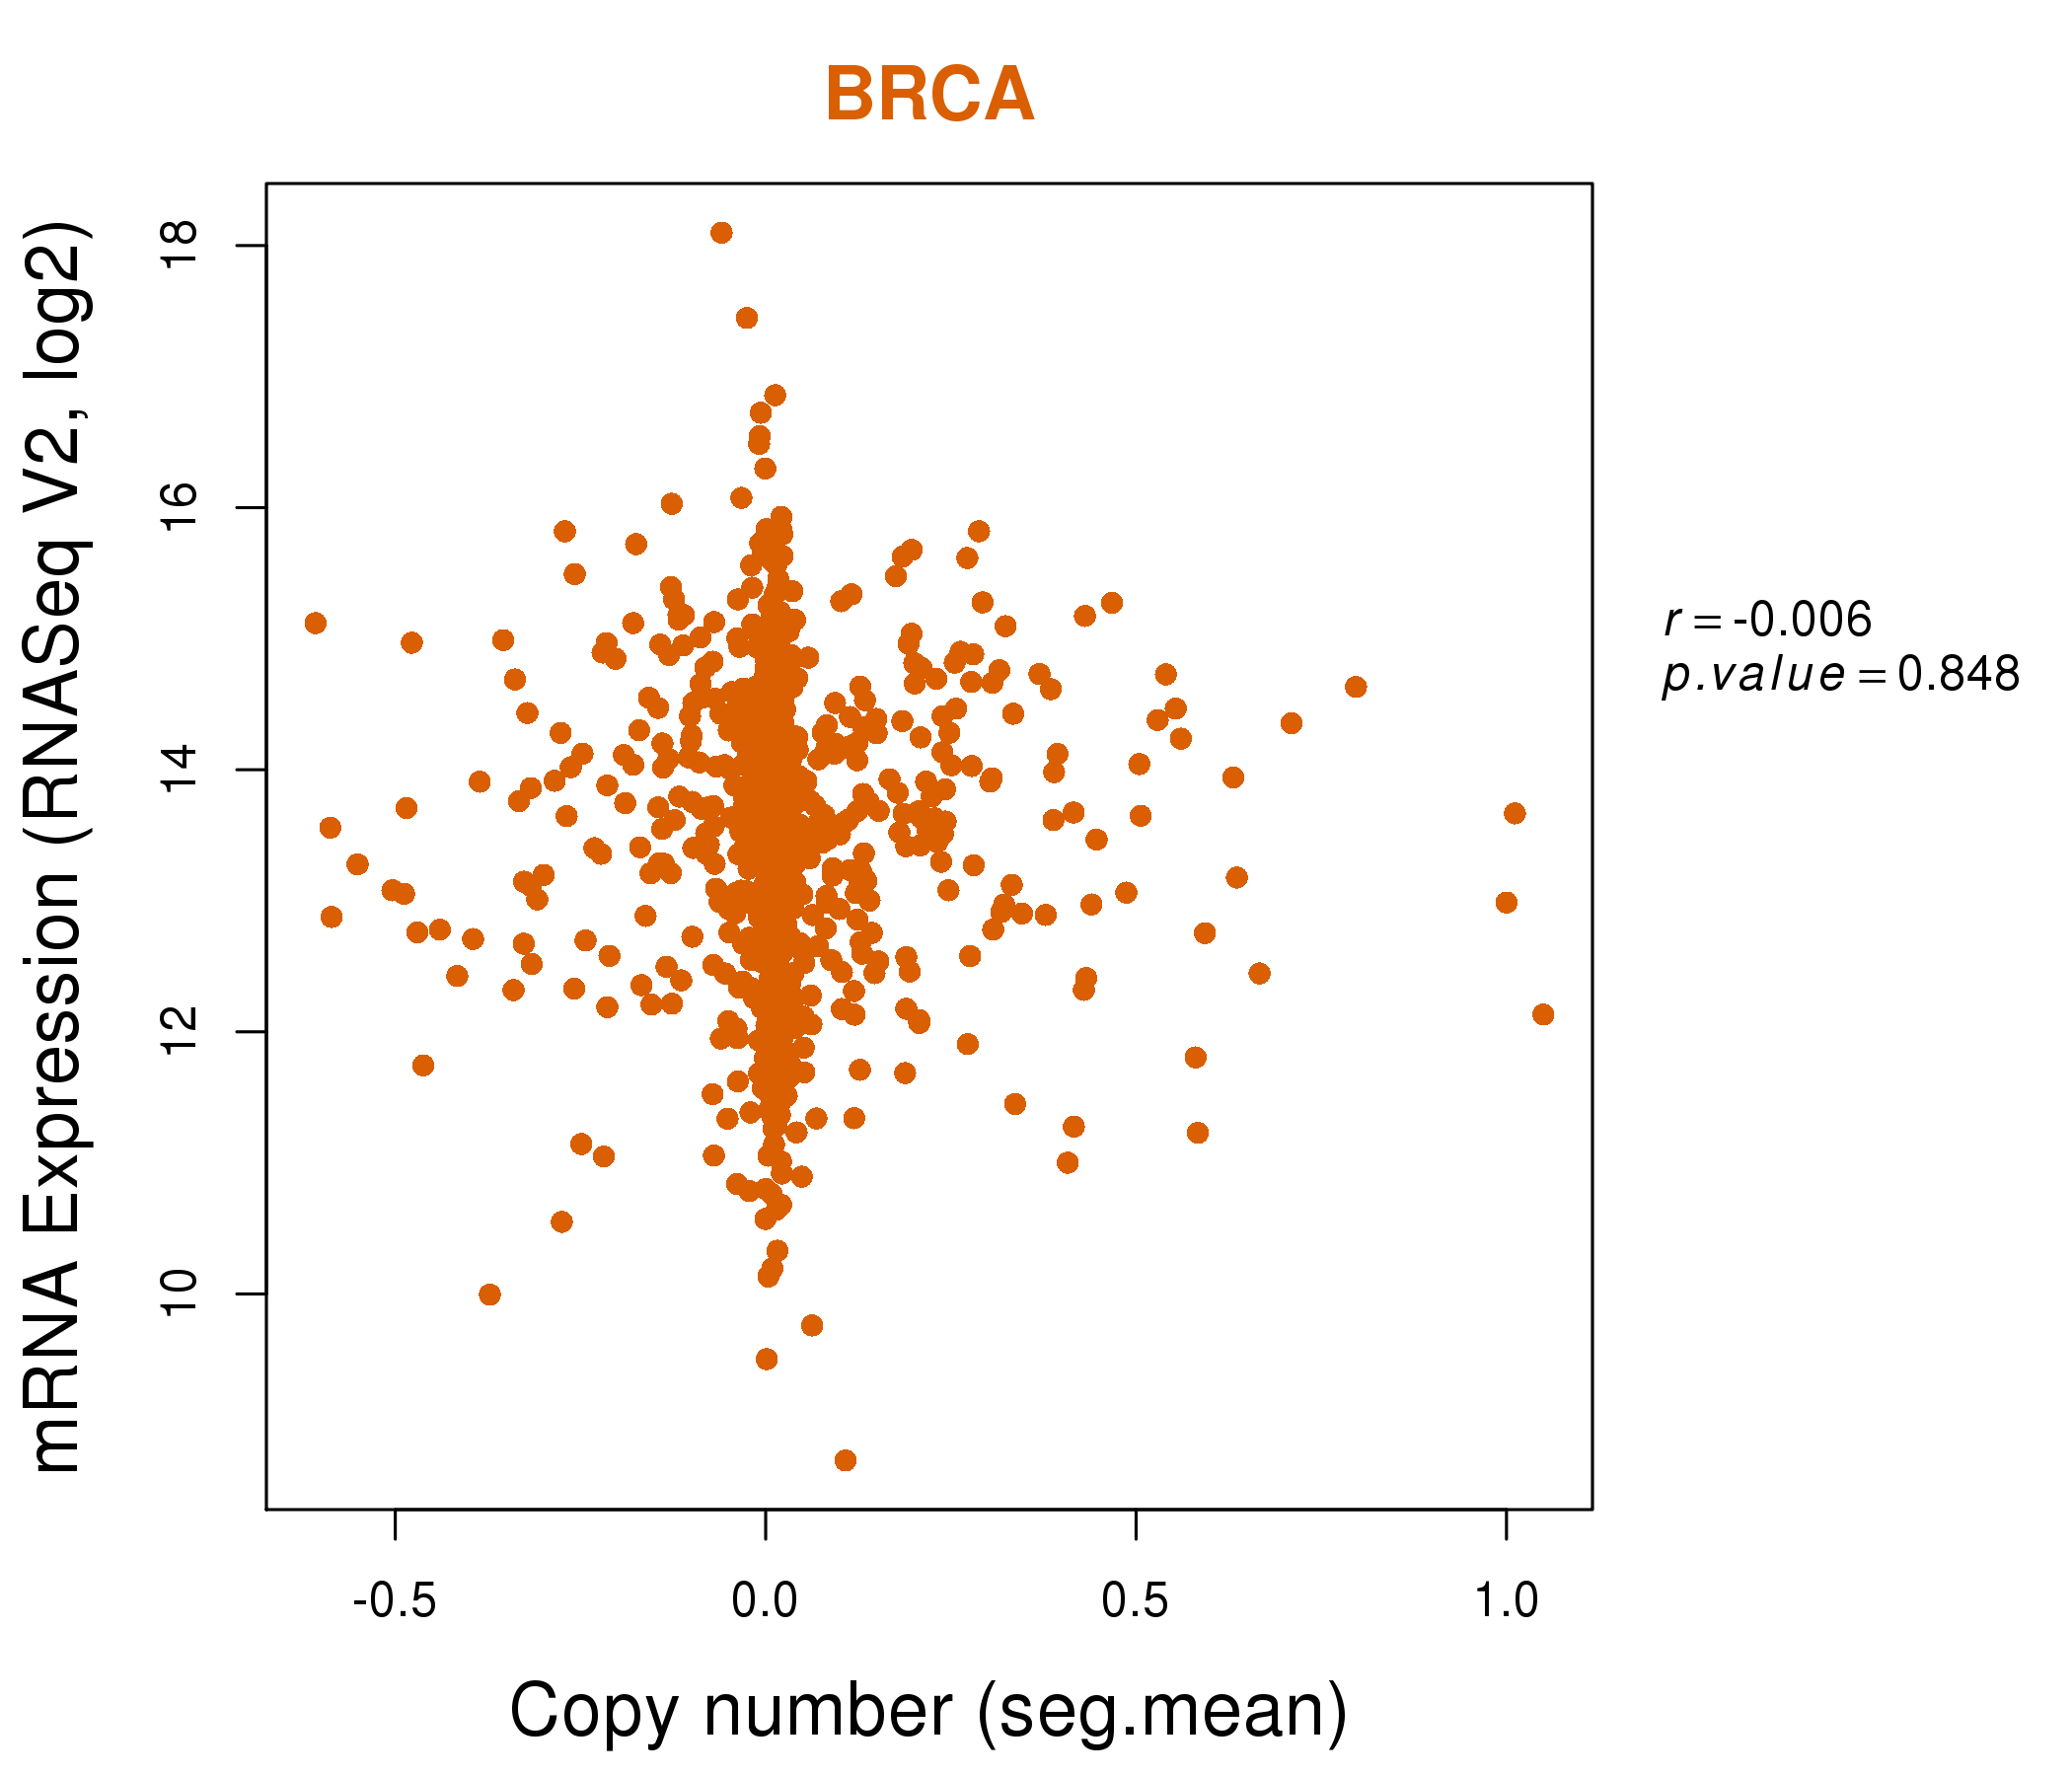
| * This plots show the correlation between CNV and gene expression. |
: Open all plots for all cancer types
 |
|
 |
|

| Top |
| Gene-Gene Network Information |
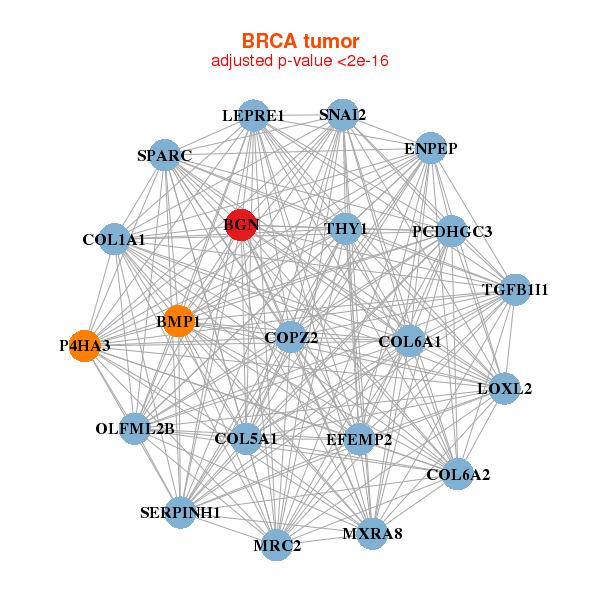
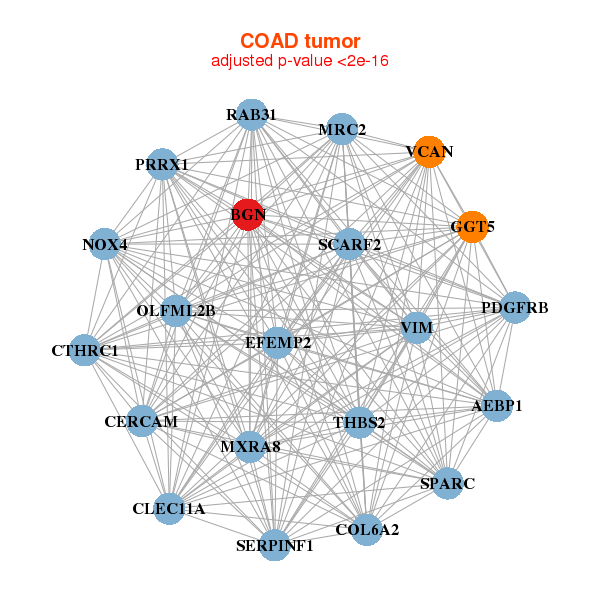
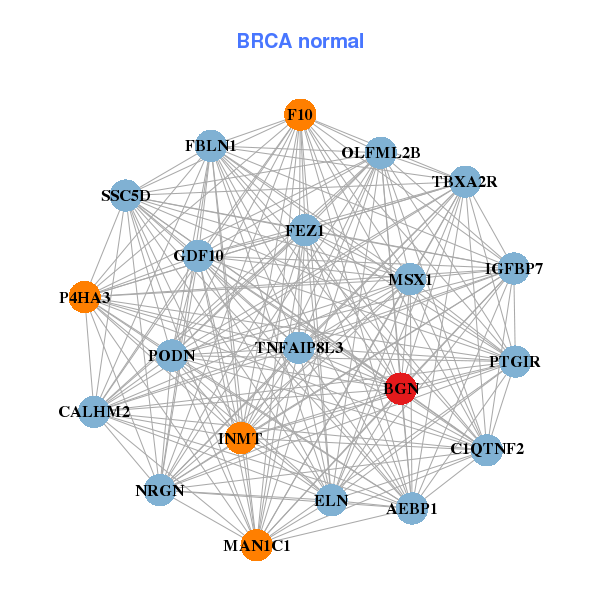
| * Co-Expression network figures were drawn using R package igraph. Only the top 20 genes with the highest correlations were shown. Red circle: input gene, orange circle: cell metabolism gene, sky circle: other gene |
: Open all plots for all cancer types
 |
|
| BGN,BMP1,COL1A1,COL5A1,COL6A1,COL6A2,COPZ2, EFEMP2,ENPEP,LEPRE1,LOXL2,MRC2,MXRA8,OLFML2B, P4HA3,PCDHGC3,SERPINH1,SNAI2,SPARC,TGFB1I1,THY1 | AEBP1,BGN,C1QTNF2,CALHM2,ELN,F10,FBLN1, FEZ1,GDF10,IGFBP7,INMT,MAN1C1,MSX1,NRGN, OLFML2B,P4HA3,PODN,PTGIR,SSC5D,TBXA2R,TNFAIP8L3 |
 |
|
| AEBP1,BGN,CERCAM,CLEC11A,COL6A2,CTHRC1,EFEMP2, GGT5,MRC2,MXRA8,NOX4,OLFML2B,PDGFRB,PRRX1, RAB31,SCARF2,SERPINF1,SPARC,THBS2,VCAN,VIM | ADAMTS5,AEBP1,BGN,C3,CCDC3,CHRD,CPT1C, DCLK1,EBF1,EDNRA,FAM198A,LRRC32,MFAP2,MFGE8, NOTCH3,NRIP2,PDGFRB,SPON2,THSD7A,VCAN,WTIP |
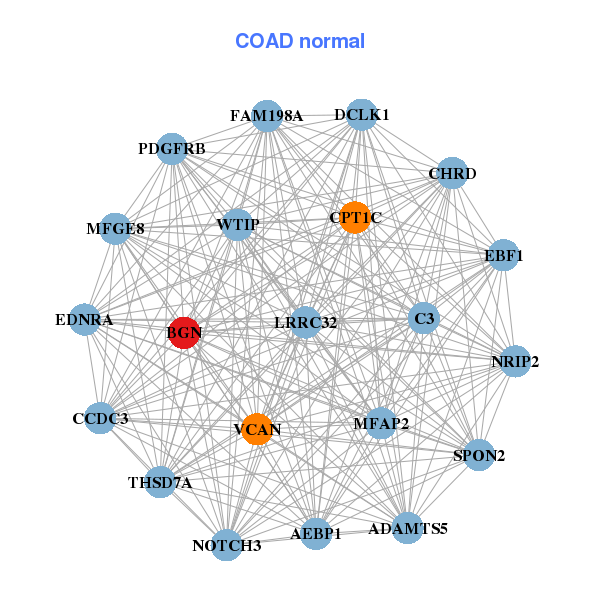
| * Co-Expression network figures were drawn using R package igraph. Only the top 20 genes with the highest correlations were shown. Red circle: input gene, orange circle: cell metabolism gene, sky circle: other gene |
: Open all plots for all cancer types
| Top |
: Open all interacting genes' information including KEGG pathway for all interacting genes from DAVID
| Top |
| Pharmacological Information for BGN |
| There's no related Drug. |
| Top |
| Cross referenced IDs for BGN |
| * We obtained these cross-references from Uniprot database. It covers 150 different DBs, 18 categories. http://www.uniprot.org/help/cross_references_section |
: Open all cross reference information
|
Copyright © 2016-Present - The Univsersity of Texas Health Science Center at Houston @ |