|
|||||||||||||||||||||||||||||||||||||||||||||||||||||||||||||||||||||||||||||||||||||||||||||||||||||||||||||||||||||||||||||||||||||||||||||||||||||||||||||||||||||||||||||||||||||||||||||||||||||||||||||||||||||||||||||||||||||||||||||||||||||||||||||||||||||||||||||||||||||||||||||||||||||||||||||||||||||||||||||||||||||||||||||||||||
| |
| Phenotypic Information (metabolism pathway, cancer, disease, phenome) |
| |
| |
| Gene-Gene Network Information: Co-Expression Network, Interacting Genes & KEGG |
| |
|


| Gene Summary for SDC2 |
| Basic gene info. | Gene symbol | SDC2 |
| Gene name | syndecan 2 | |
| Synonyms | CD362|HSPG|HSPG1|SYND2 | |
| Cytomap | UCSC genome browser: 8q22-q23 | |
| Genomic location | chr8 :97505881-97624037 | |
| Type of gene | protein-coding | |
| RefGenes | NM_002998.3, | |
| Ensembl id | ENSG00000169439 | |
| Description | cell surface-associated heparan sulfate proteoglycan 1fibroglycanheparan sulfate proteoglycan 1, cell surface-associatedheparan sulfate proteoglycan core proteinsyndecan proteoglycan 2syndecan-2 | |
| Modification date | 20141222 | |
| dbXrefs | MIM : 142460 | |
| HGNC : HGNC | ||
| Ensembl : ENSG00000169439 | ||
| HPRD : 00803 | ||
| Vega : OTTHUMG00000164689 | ||
| Protein | UniProt: P34741 go to UniProt's Cross Reference DB Table | |
| Expression | CleanEX: HS_SDC2 | |
| BioGPS: 6383 | ||
| Gene Expression Atlas: ENSG00000169439 | ||
| The Human Protein Atlas: ENSG00000169439 | ||
| Pathway | NCI Pathway Interaction Database: SDC2 | |
| KEGG: SDC2 | ||
| REACTOME: SDC2 | ||
| ConsensusPathDB | ||
| Pathway Commons: SDC2 | ||
| Metabolism | MetaCyc: SDC2 | |
| HUMANCyc: SDC2 | ||
| Regulation | Ensembl's Regulation: ENSG00000169439 | |
| miRBase: chr8 :97,505,881-97,624,037 | ||
| TargetScan: NM_002998 | ||
| cisRED: ENSG00000169439 | ||
| Context | iHOP: SDC2 | |
| cancer metabolism search in PubMed: SDC2 | ||
| UCL Cancer Institute: SDC2 | ||
| Assigned class in ccmGDB | B - This gene belongs to cancer gene. | |
| Top |
| Phenotypic Information for SDC2(metabolism pathway, cancer, disease, phenome) |
| Cancer | CGAP: SDC2 |
| Familial Cancer Database: SDC2 | |
| * This gene is included in those cancer gene databases. |
|
|
|
|
|
| . | |||||||||||||||||||||||||||||||||||||||||||||||||||||||||||||||||||||||||||||||||||||||||||||||||||||||||||||||||||||||||||||||||||||||||||||||||||||||||||||||||||||||||||||||||||||||||||||||||||||||||||||||||||||||||||||||||||||||||||||||||||||||||||||||||||||||||||||||||||||||||||||||||||||||||||||||||||||||||||||||||||||||||||||
Oncogene 1 | Significant driver gene in | ||||||||||||||||||||||||||||||||||||||||||||||||||||||||||||||||||||||||||||||||||||||||||||||||||||||||||||||||||||||||||||||||||||||||||||||||||||||||||||||||||||||||||||||||||||||||||||||||||||||||||||||||||||||||||||||||||||||||||||||||||||||||||||||||||||||||||||||||||||||||||||||||||||||||||||||||||||||||||||||||||||||||||||||||||
| cf) number; DB name 1 Oncogene; http://nar.oxfordjournals.org/content/35/suppl_1/D721.long, 2 Tumor Suppressor gene; https://bioinfo.uth.edu/TSGene/, 3 Cancer Gene Census; http://www.nature.com/nrc/journal/v4/n3/abs/nrc1299.html, 4 CancerGenes; http://nar.oxfordjournals.org/content/35/suppl_1/D721.long, 5 Network of Cancer Gene; http://ncg.kcl.ac.uk/index.php, 1Therapeutic Vulnerabilities in Cancer; http://cbio.mskcc.org/cancergenomics/statius/ |
| REACTOME_METABOLISM_OF_CARBOHYDRATES | |
| OMIM | 142460; gene. |
| Orphanet | |
| Disease | KEGG Disease: SDC2 |
| MedGen: SDC2 (Human Medical Genetics with Condition) | |
| ClinVar: SDC2 | |
| Phenotype | MGI: SDC2 (International Mouse Phenotyping Consortium) |
| PhenomicDB: SDC2 | |
| Mutations for SDC2 |
| * Under tables are showing count per each tissue to give us broad intuition about tissue specific mutation patterns.You can go to the detailed page for each mutation database's web site. |
| - Statistics for Tissue and Mutation type | Top |
 |
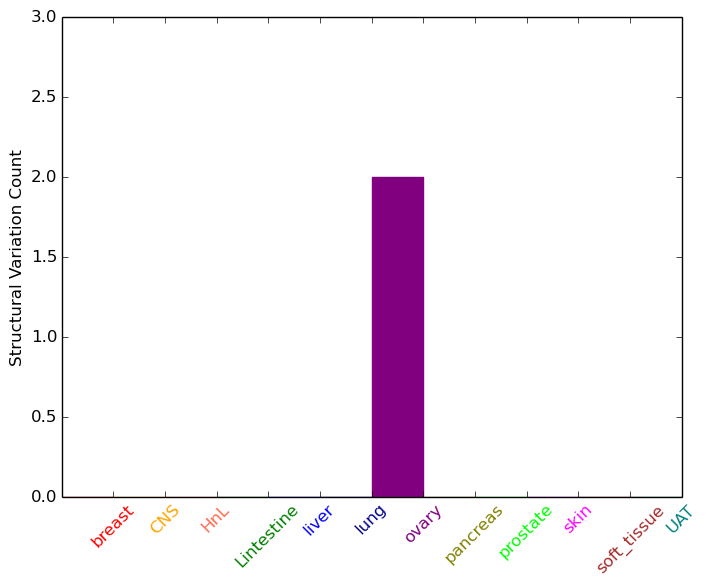
| - For Inter-chromosomal Variations |
| * Inter-chromosomal variantions includes 'interchromosomal amplicon to amplicon', 'interchromosomal amplicon to non-amplified dna', 'interchromosomal insertion', 'Interchromosomal unknown type'. |
 |
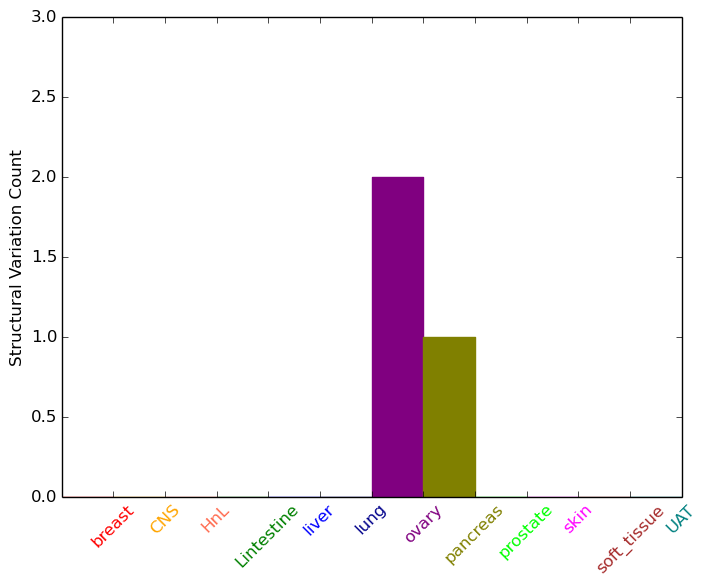
| - For Intra-chromosomal Variations |
| * Intra-chromosomal variantions includes 'intrachromosomal amplicon to amplicon', 'intrachromosomal amplicon to non-amplified dna', 'intrachromosomal deletion', 'intrachromosomal fold-back inversion', 'intrachromosomal inversion', 'intrachromosomal tandem duplication', 'Intrachromosomal unknown type', 'intrachromosomal with inverted orientation', 'intrachromosomal with non-inverted orientation'. |
 |
| Sample | Symbol_a | Chr_a | Start_a | End_a | Symbol_b | Chr_b | Start_b | End_b |
| ovary | SDC2 | chr8 | 97551434 | 97551454 | chr15 | 90298092 | 90298112 | |
| ovary | SDC2 | chr8 | 97622863 | 97622883 | chr8 | 97625244 | 97625264 | |
| pancreas | SDC2 | chr8 | 97508147 | 97508167 | SDC2 | chr8 | 97508510 | 97508530 |
| cf) Tissue number; Tissue name (1;Breast, 2;Central_nervous_system, 3;Haematopoietic_and_lymphoid_tissue, 4;Large_intestine, 5;Liver, 6;Lung, 7;Ovary, 8;Pancreas, 9;Prostate, 10;Skin, 11;Soft_tissue, 12;Upper_aerodigestive_tract) |
| * From mRNA Sanger sequences, Chitars2.0 arranged chimeric transcripts. This table shows SDC2 related fusion information. |
| ID | Head Gene | Tail Gene | Accession | Gene_a | qStart_a | qEnd_a | Chromosome_a | tStart_a | tEnd_a | Gene_a | qStart_a | qEnd_a | Chromosome_a | tStart_a | tEnd_a |
| BE762893 | SDC2 | 85 | 159 | 8 | 97614682 | 97614756 | SDC2 | 154 | 423 | 8 | 97614682 | 97621671 | |
| AA632874 | SDC2 | 1 | 168 | 8 | 97622699 | 97622867 | SDC2 | 165 | 302 | 8 | 97622639 | 97622776 | |
| AI366039 | FRZB | 1 | 85 | 2 | 183699292 | 183699376 | SDC2 | 68 | 455 | 8 | 97622338 | 97622731 | |
| Top |
| Mutation type/ Tissue ID | brca | cns | cerv | endome | haematopo | kidn | Lintest | liver | lung | ns | ovary | pancre | prost | skin | stoma | thyro | urina | |||
| Total # sample | 5 | 1 | ||||||||||||||||||
| GAIN (# sample) | 5 | 1 | ||||||||||||||||||
| LOSS (# sample) |
| cf) Tissue ID; Tissue type (1; Breast, 2; Central_nervous_system, 3; Cervix, 4; Endometrium, 5; Haematopoietic_and_lymphoid_tissue, 6; Kidney, 7; Large_intestine, 8; Liver, 9; Lung, 10; NS, 11; Ovary, 12; Pancreas, 13; Prostate, 14; Skin, 15; Stomach, 16; Thyroid, 17; Urinary_tract) |
| Top |
|
 |
| Top |
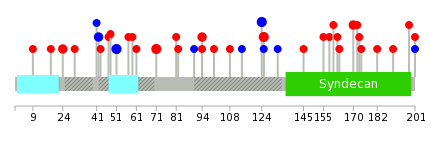
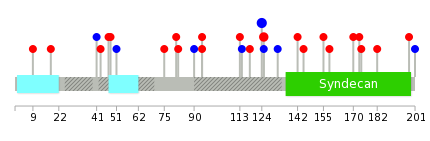
| Stat. for Non-Synonymous SNVs (# total SNVs=30) | (# total SNVs=8) |
 |  |
(# total SNVs=0) | (# total SNVs=0) |
| Top |
| * When you move the cursor on each content, you can see more deailed mutation information on the Tooltip. Those are primary_site,primary_histology,mutation(aa),pubmedID. |
| GRCh37 position | Mutation(aa) | Unique sampleID count |
| chr8:97605800-97605800 | p.Y51Y | 3 |
| chr8:97620628-97620628 | p.A124A | 3 |
| chr8:97614661-97614661 | p.S71T | 3 |
| chr8:97620629-97620629 | p.E125K | 3 |
| chr8:97614730-97614730 | p.Q94E | 2 |
| chr8:97621679-97621679 | p.R170H | 2 |
| chr8:97605717-97605717 | p.L24M | 2 |
| chr8:97605773-97605773 | p.G42G | 2 |
| chr8:97614720-97614720 | p.T90T | 1 |
| chr8:97620689-97620689 | p.V145F | 1 |
| Top |
|
 |
| Point Mutation/ Tissue ID | 1 | 2 | 3 | 4 | 5 | 6 | 7 | 8 | 9 | 10 | 11 | 12 | 13 | 14 | 15 | 16 | 17 | 18 | 19 | 20 |
| # sample | 2 | 1 | 9 | 1 | 2 | 2 | 4 | 2 | 1 | 1 | 4 | 4 | ||||||||
| # mutation | 2 | 1 | 9 | 1 | 2 | 2 | 4 | 2 | 1 | 1 | 3 | 4 | ||||||||
| nonsynonymous SNV | 2 | 1 | 6 | 1 | 2 | 1 | 4 | 2 | 1 | 2 | 1 | |||||||||
| synonymous SNV | 3 | 1 | 1 | 1 | 3 |
| cf) Tissue ID; Tissue type (1; BLCA[Bladder Urothelial Carcinoma], 2; BRCA[Breast invasive carcinoma], 3; CESC[Cervical squamous cell carcinoma and endocervical adenocarcinoma], 4; COAD[Colon adenocarcinoma], 5; GBM[Glioblastoma multiforme], 6; Glioma Low Grade, 7; HNSC[Head and Neck squamous cell carcinoma], 8; KICH[Kidney Chromophobe], 9; KIRC[Kidney renal clear cell carcinoma], 10; KIRP[Kidney renal papillary cell carcinoma], 11; LAML[Acute Myeloid Leukemia], 12; LUAD[Lung adenocarcinoma], 13; LUSC[Lung squamous cell carcinoma], 14; OV[Ovarian serous cystadenocarcinoma ], 15; PAAD[Pancreatic adenocarcinoma], 16; PRAD[Prostate adenocarcinoma], 17; SKCM[Skin Cutaneous Melanoma], 18:STAD[Stomach adenocarcinoma], 19:THCA[Thyroid carcinoma], 20:UCEC[Uterine Corpus Endometrial Carcinoma]) |
| Top |
| * We represented just top 10 SNVs. When you move the cursor on each content, you can see more deailed mutation information on the Tooltip. Those are primary_site, primary_histology, mutation(aa), pubmedID. |
| Genomic Position | Mutation(aa) | Unique sampleID count |
| chr8:97620628 | p.A124A | 3 |
| chr8:97620629 | p.E125K | 2 |
| chr8:97621715 | p.P75S | 1 |
| chr8:97605800 | p.L158I | 1 |
| chr8:97621763 | p.S81R | 1 |
| chr8:97614673 | p.R170H | 1 |
| chr8:97620631 | p.A82D | 1 |
| chr8:97621773 | p.K173R | 1 |
| chr8:97614693 | p.T90T | 1 |
| chr8:97620652 | p.K174N | 1 |
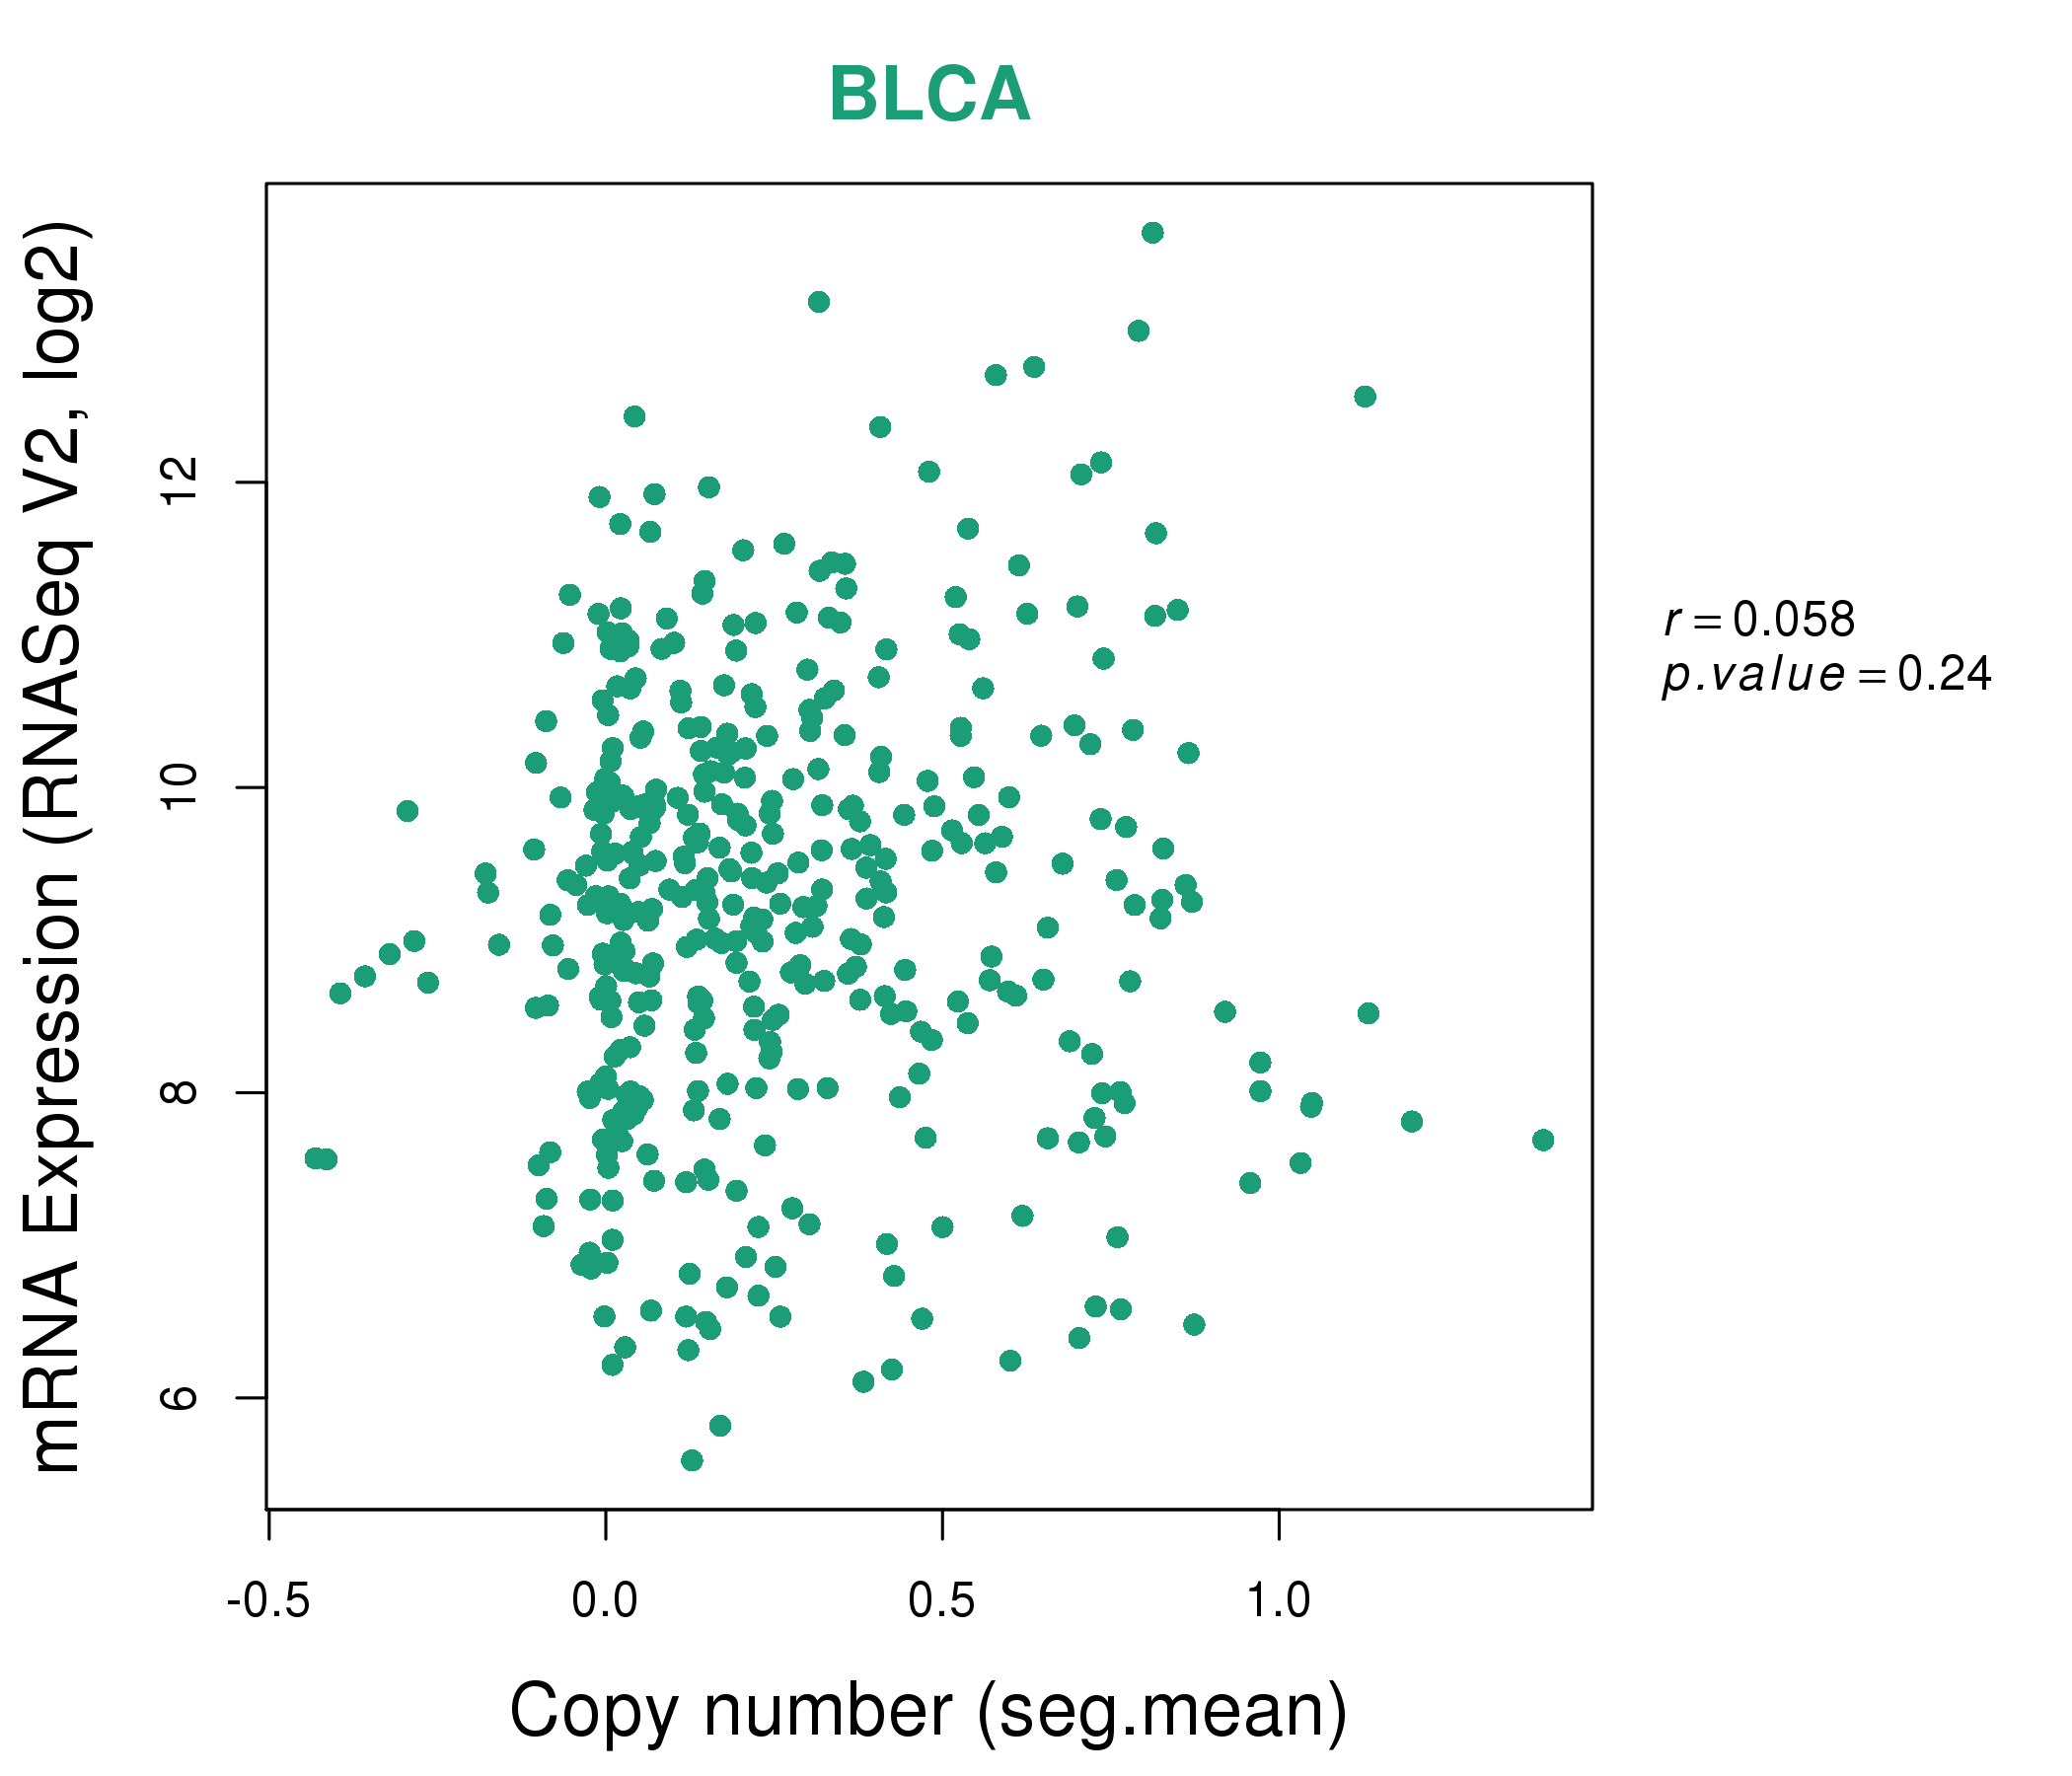
| * Copy number data were extracted from TCGA using R package TCGA-Assembler. The URLs of all public data files on TCGA DCC data server were gathered on Jan-05-2015. Function ProcessCNAData in TCGA-Assembler package was used to obtain gene-level copy number value which is calculated as the average copy number of the genomic region of a gene. |
 |
| cf) Tissue ID[Tissue type]: BLCA[Bladder Urothelial Carcinoma], BRCA[Breast invasive carcinoma], CESC[Cervical squamous cell carcinoma and endocervical adenocarcinoma], COAD[Colon adenocarcinoma], GBM[Glioblastoma multiforme], Glioma Low Grade, HNSC[Head and Neck squamous cell carcinoma], KICH[Kidney Chromophobe], KIRC[Kidney renal clear cell carcinoma], KIRP[Kidney renal papillary cell carcinoma], LAML[Acute Myeloid Leukemia], LUAD[Lung adenocarcinoma], LUSC[Lung squamous cell carcinoma], OV[Ovarian serous cystadenocarcinoma ], PAAD[Pancreatic adenocarcinoma], PRAD[Prostate adenocarcinoma], SKCM[Skin Cutaneous Melanoma], STAD[Stomach adenocarcinoma], THCA[Thyroid carcinoma], UCEC[Uterine Corpus Endometrial Carcinoma] |
| Top |
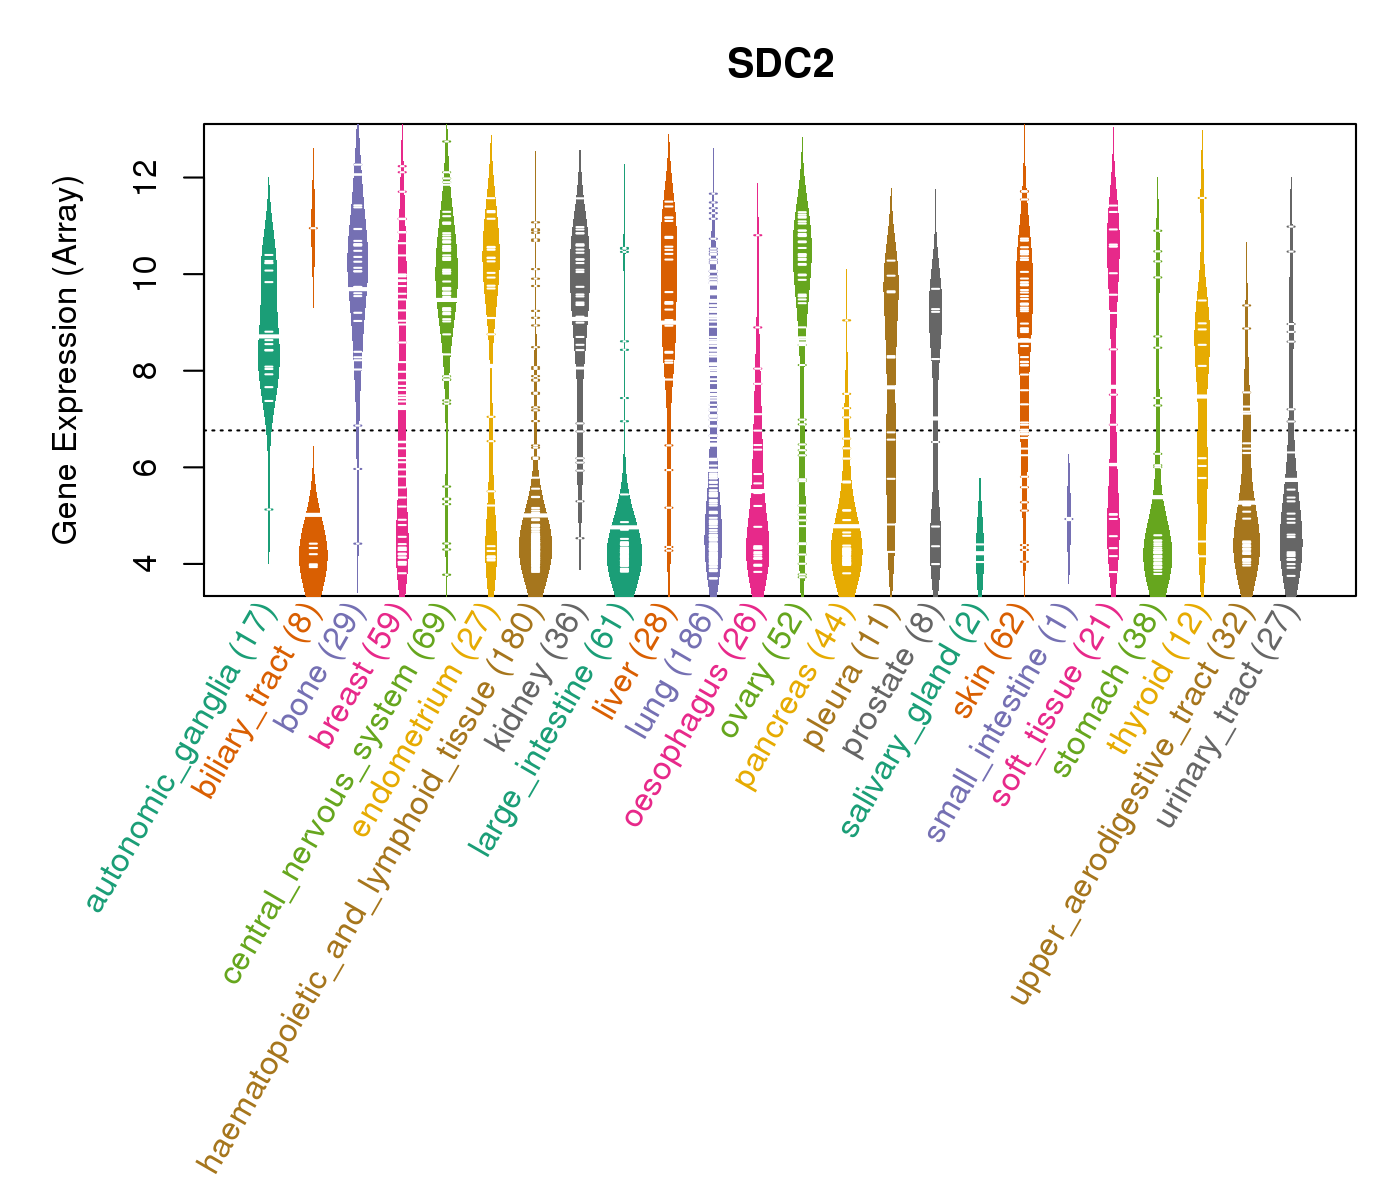
| Gene Expression for SDC2 |
| * CCLE gene expression data were extracted from CCLE_Expression_Entrez_2012-10-18.res: Gene-centric RMA-normalized mRNA expression data. |
 |
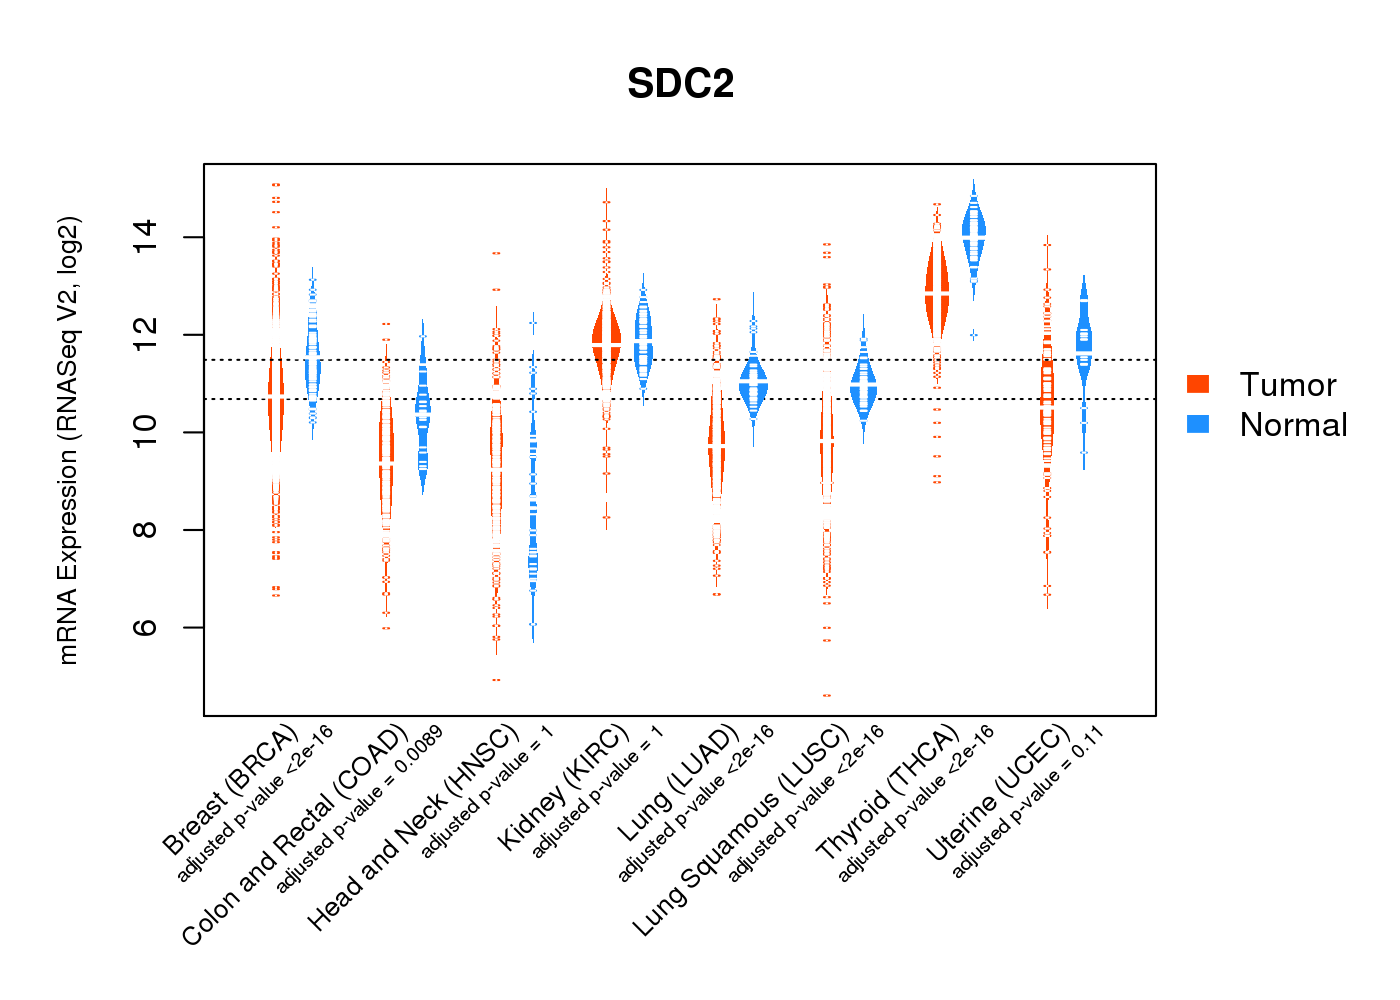
| * Normalized gene expression data of RNASeqV2 was extracted from TCGA using R package TCGA-Assembler. The URLs of all public data files on TCGA DCC data server were gathered at Jan-05-2015. Only eight cancer types have enough normal control samples for differential expression analysis. (t test, adjusted p<0.05 (using Benjamini-Hochberg FDR)) |
 |
| Top |
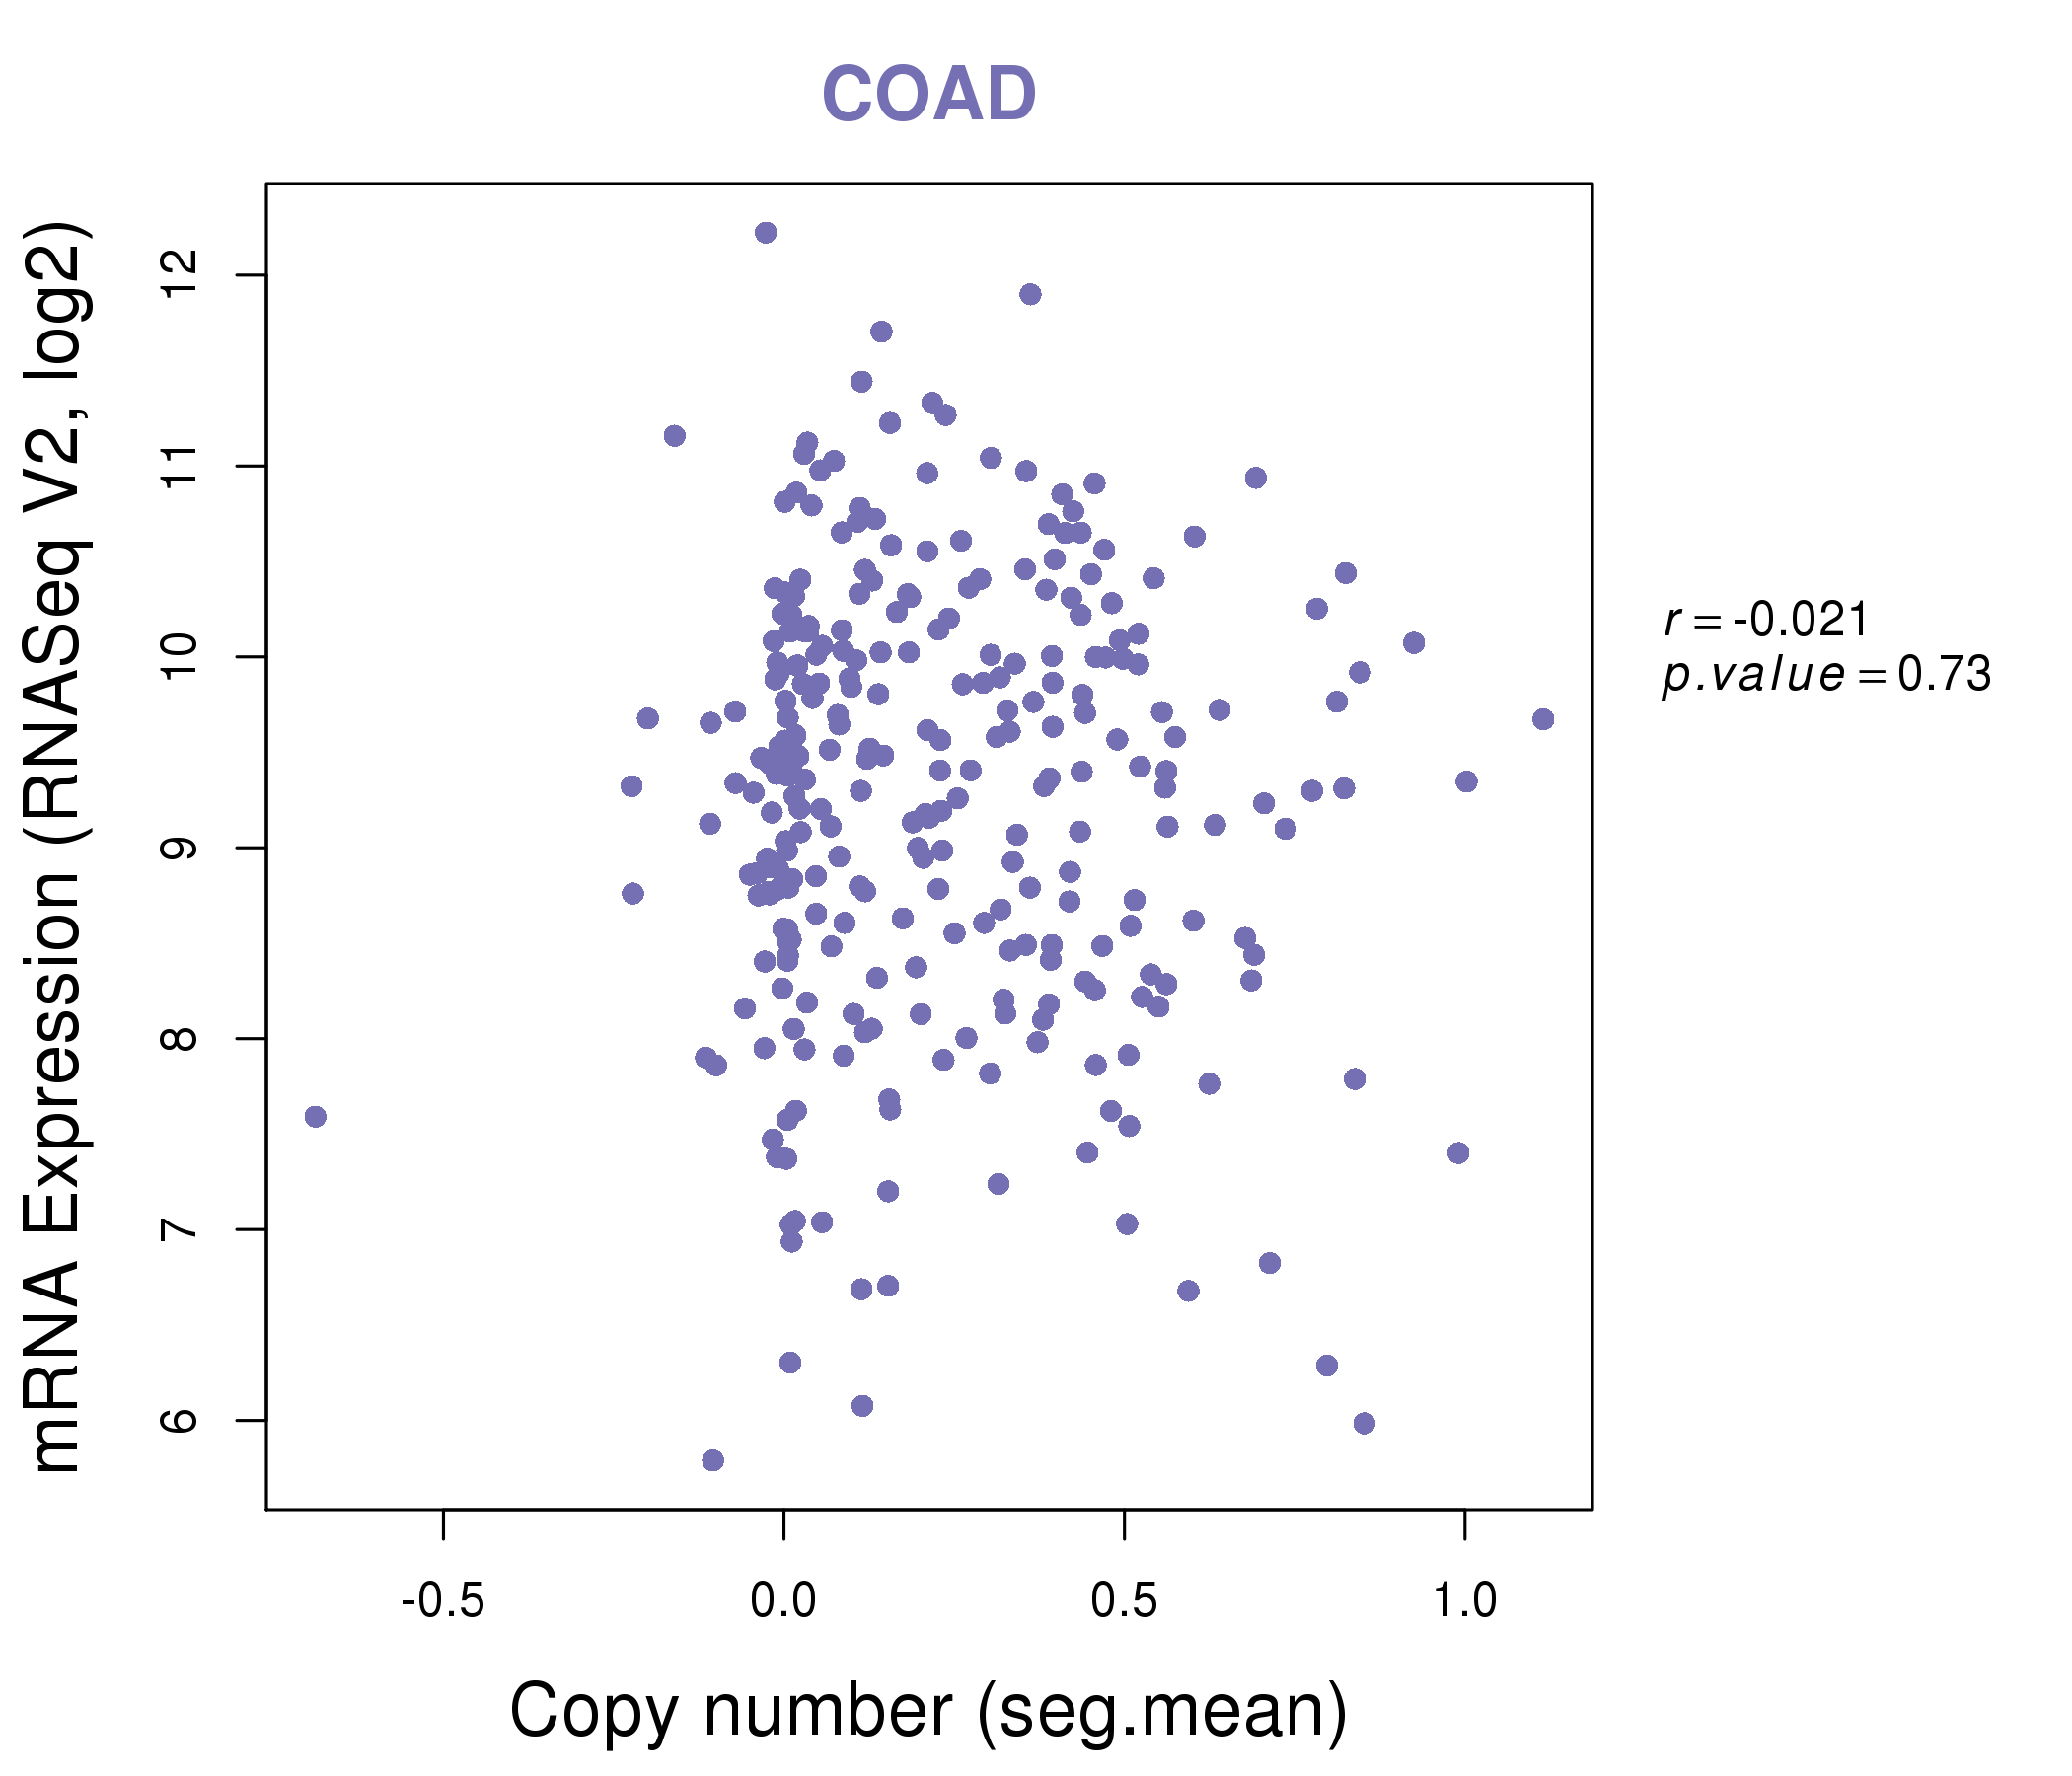
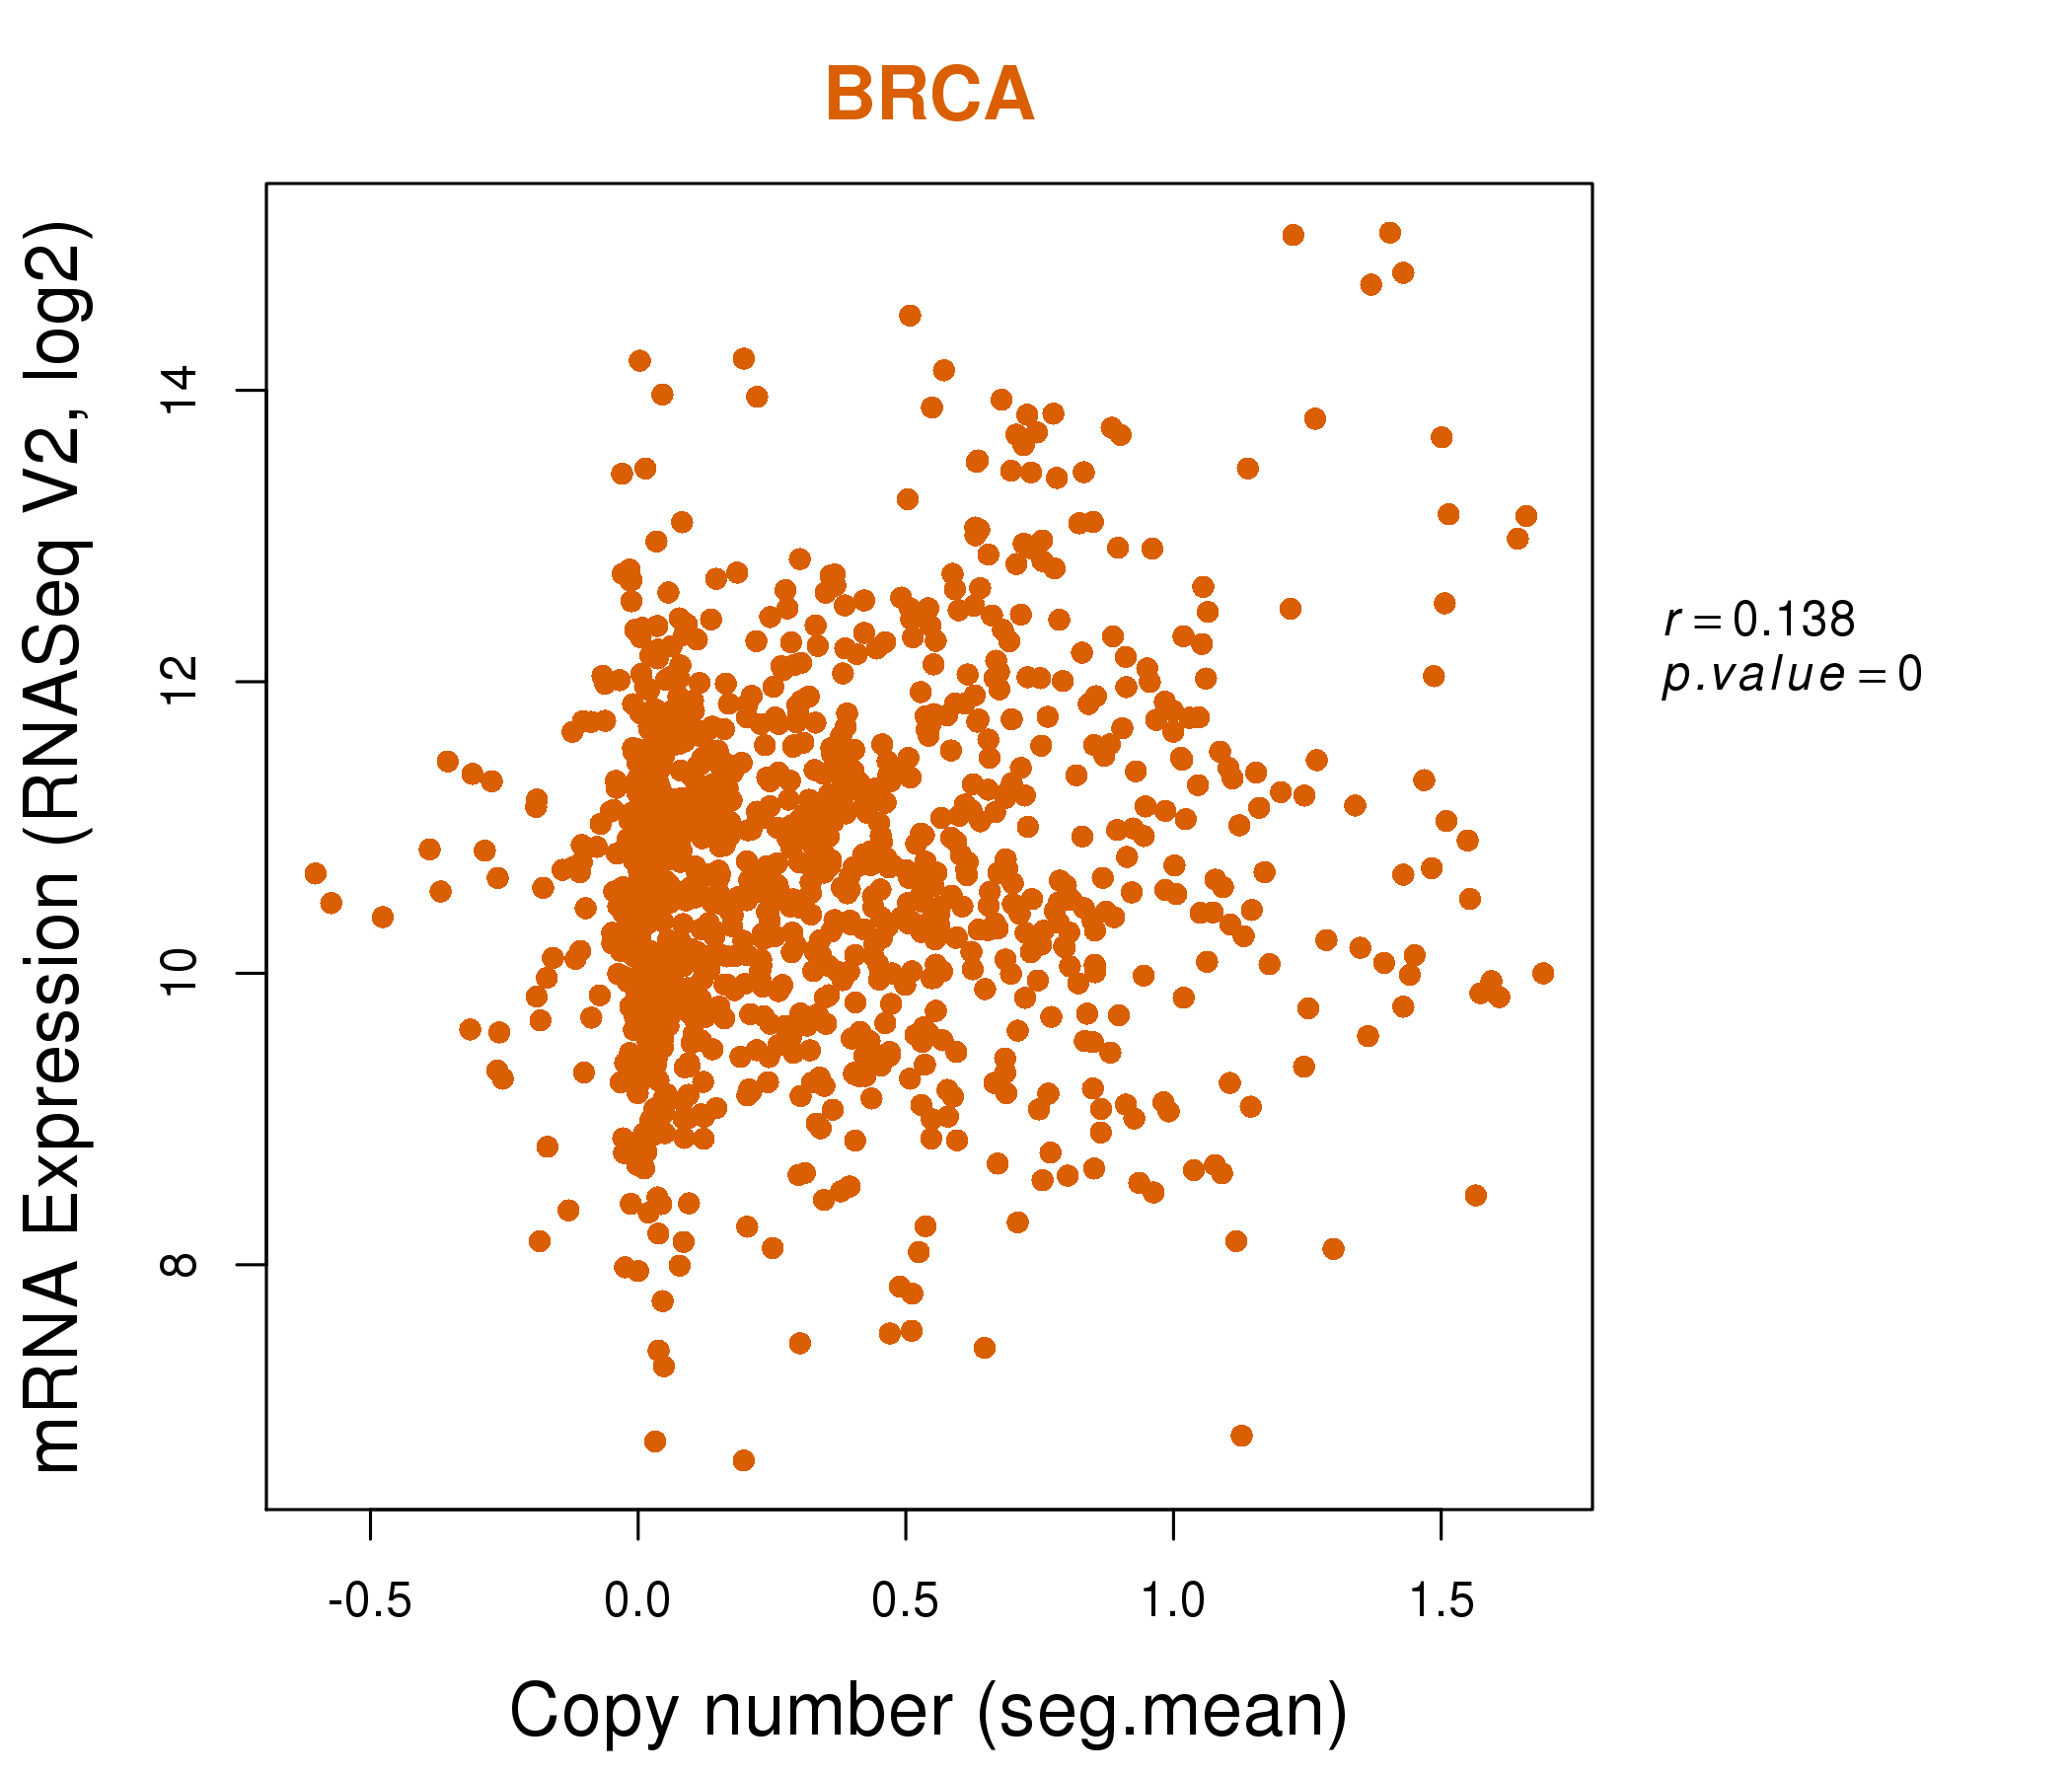
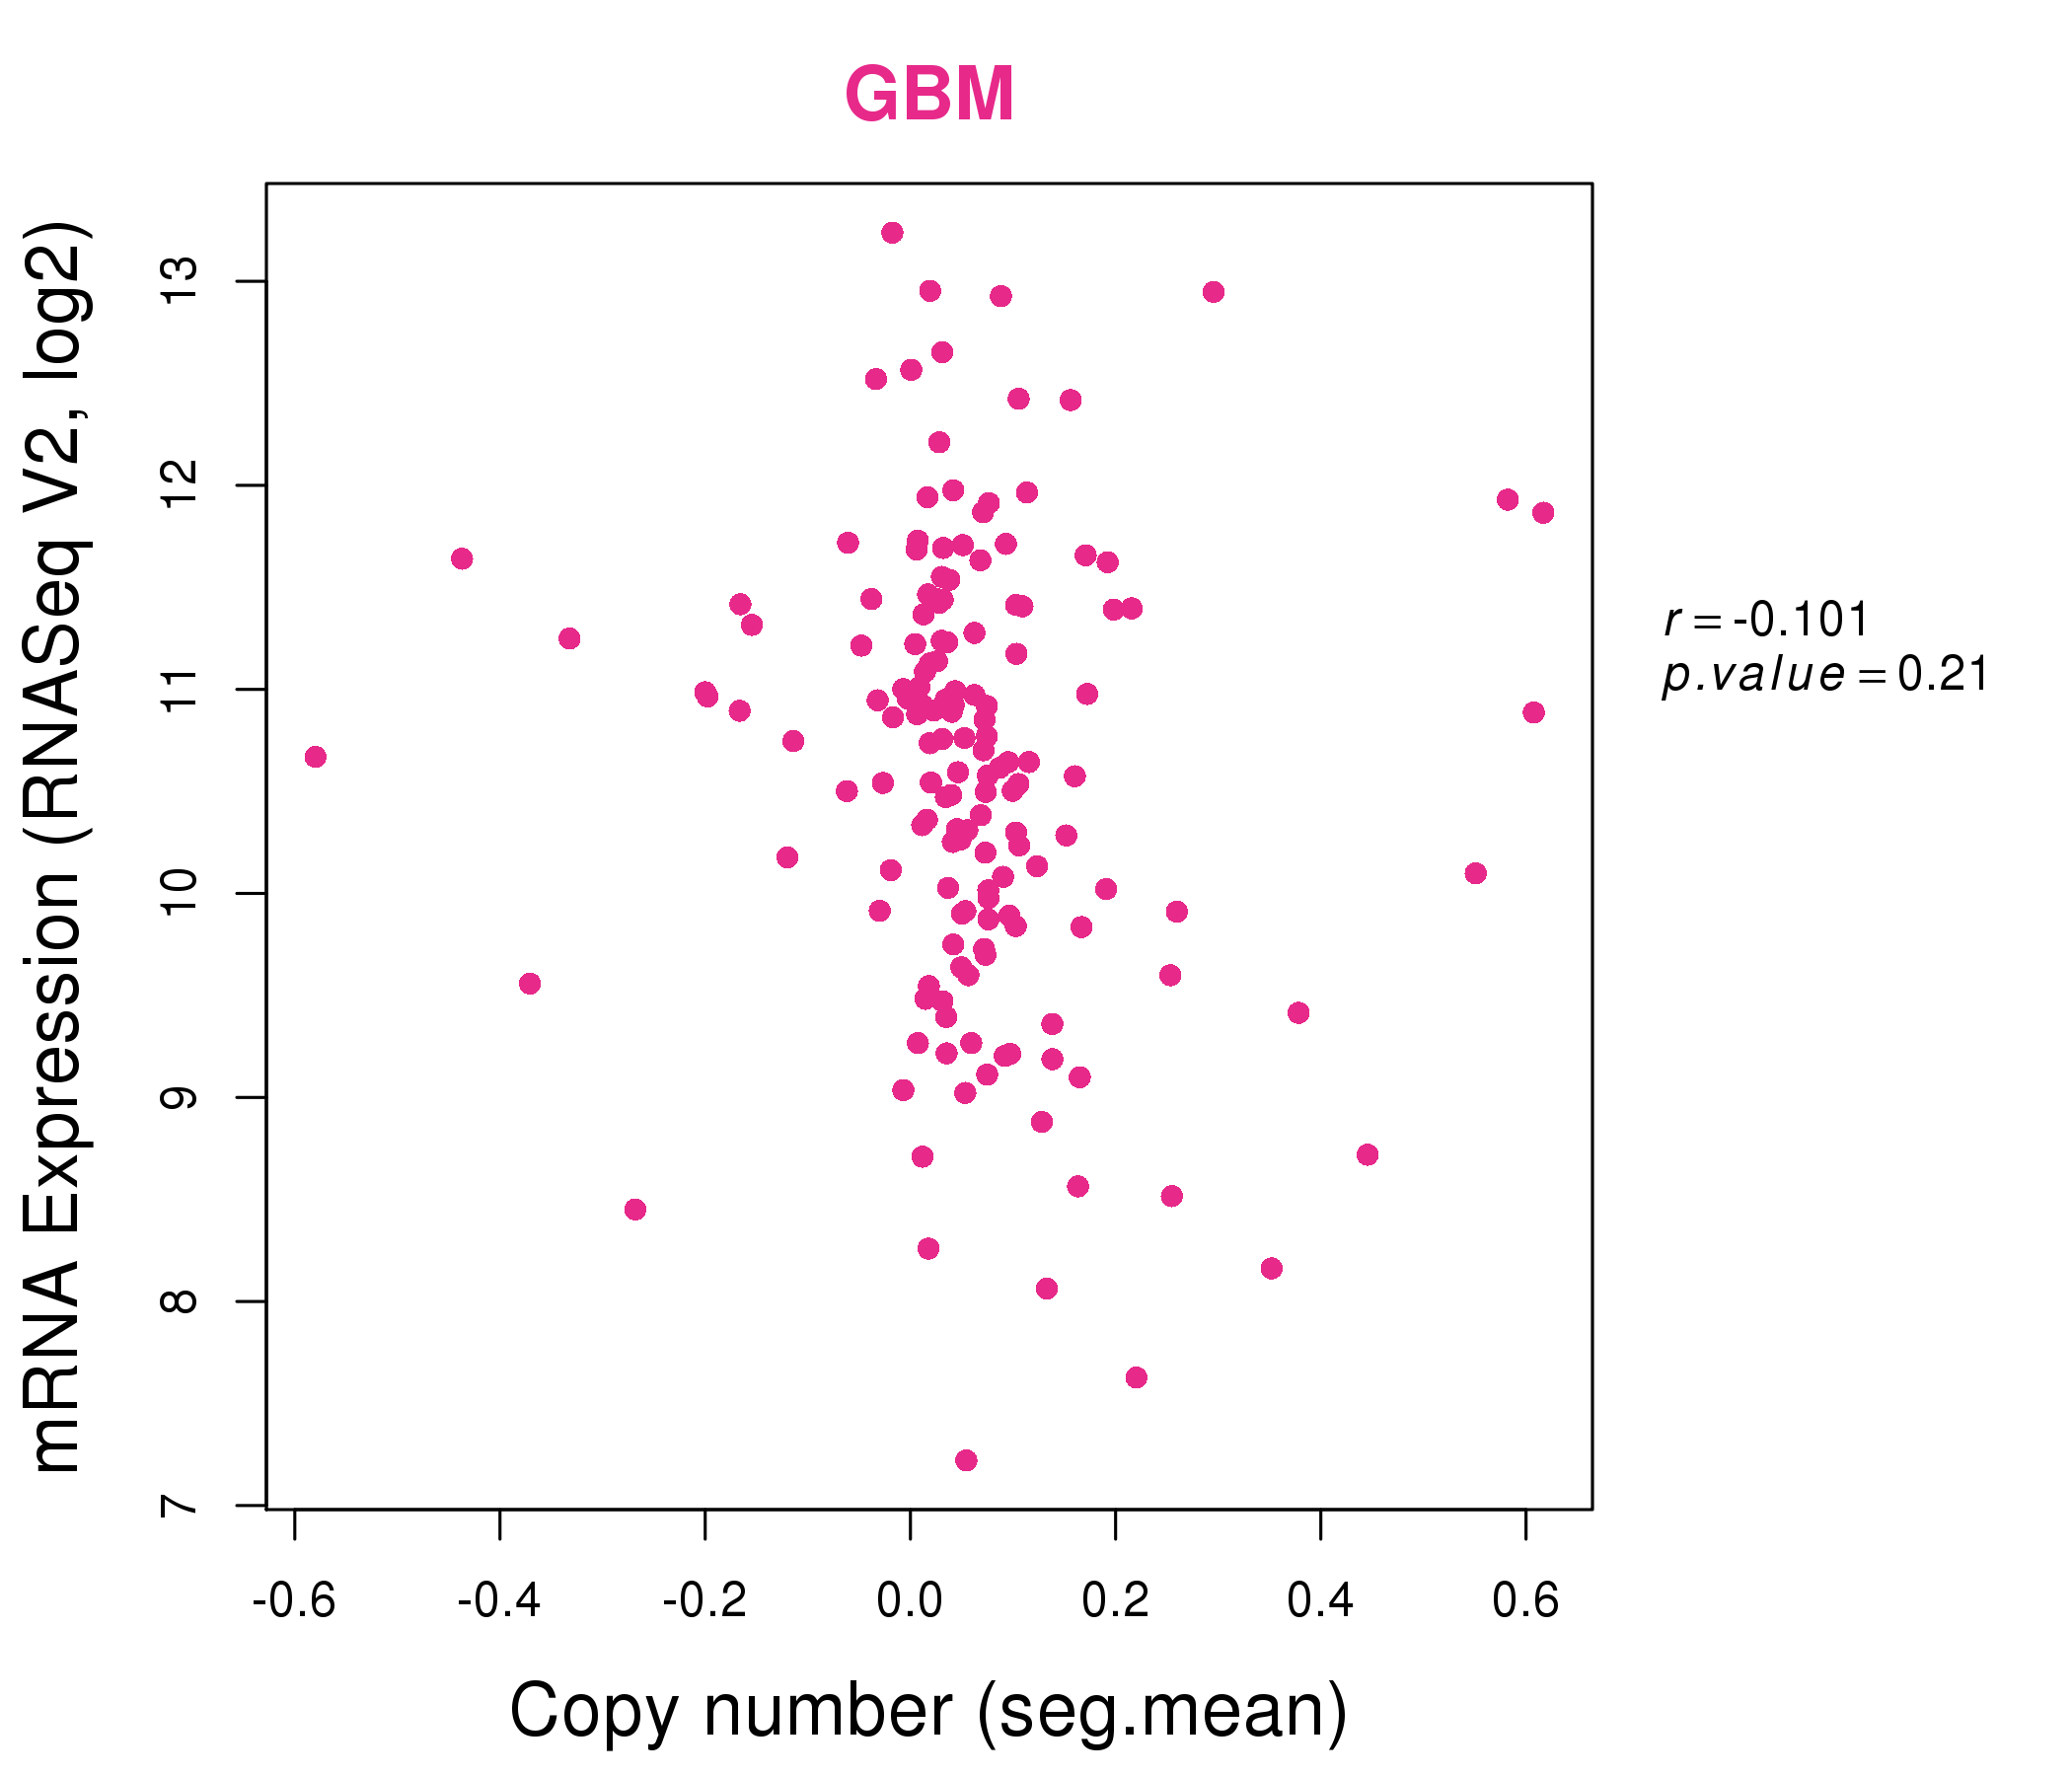
| * This plots show the correlation between CNV and gene expression. |
: Open all plots for all cancer types
 |
|
 |
|
| Top |
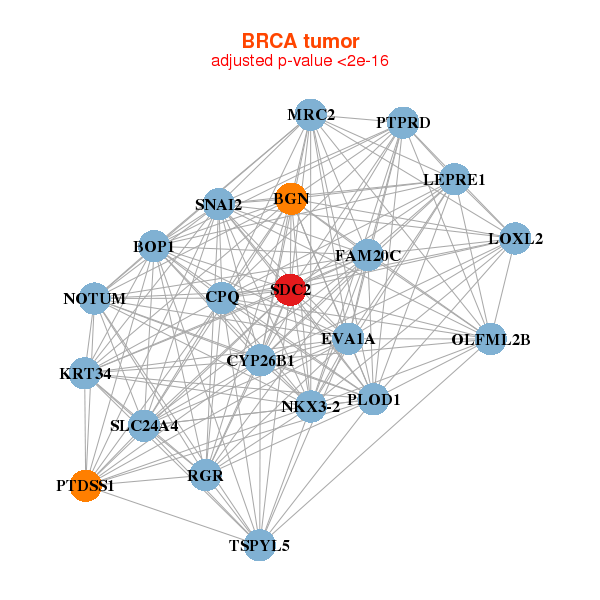
| Gene-Gene Network Information |
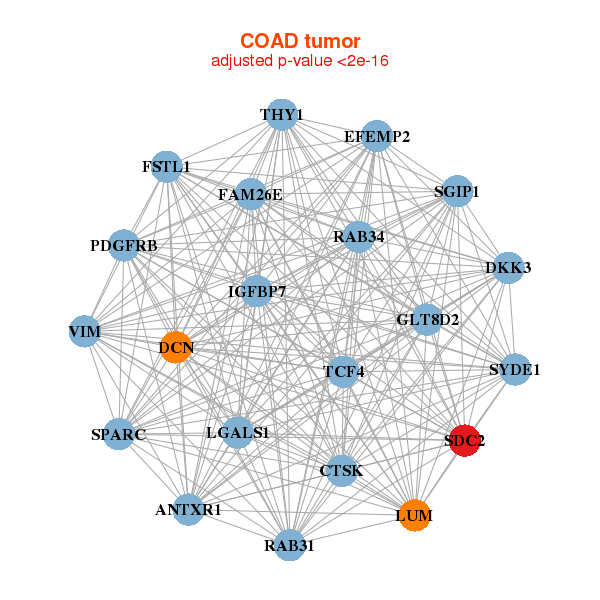
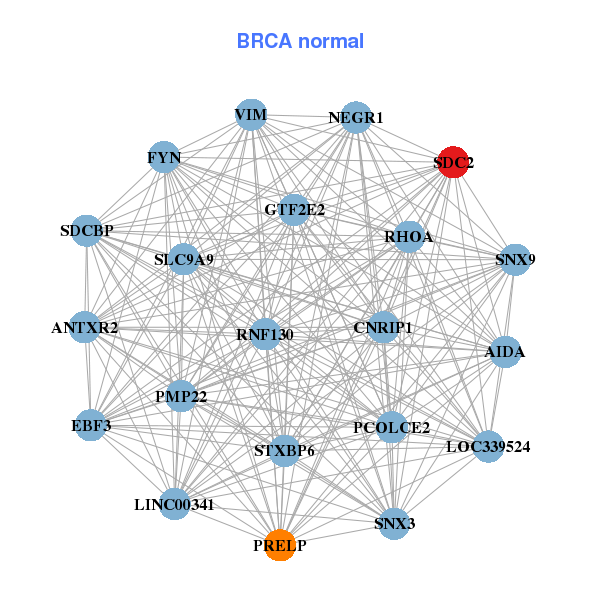
| * Co-Expression network figures were drawn using R package igraph. Only the top 20 genes with the highest correlations were shown. Red circle: input gene, orange circle: cell metabolism gene, sky circle: other gene |
: Open all plots for all cancer types
 |
| ||||
| BGN,BOP1,CYP26B1,EVA1A,FAM20C,KRT34,LEPRE1, LOXL2,MRC2,NKX3-2,NOTUM,OLFML2B,CPQ,PLOD1, PTDSS1,PTPRD,RGR,SDC2,SLC24A4,SNAI2,TSPYL5 | AIDA,ANTXR2,LINC00341,CNRIP1,EBF3,FYN,GTF2E2, LOC339524,NEGR1,PCOLCE2,PMP22,PRELP,RHOA,RNF130, SDC2,SDCBP,SLC9A9,SNX3,SNX9,STXBP6,VIM | ||||
 |
| ||||
| ANTXR1,CTSK,DCN,DKK3,EFEMP2,FAM26E,FSTL1, GLT8D2,IGFBP7,LGALS1,LUM,PDGFRB,RAB31,RAB34, SDC2,SGIP1,SPARC,SYDE1,TCF4,THY1,VIM | CAB39L,CAV2,CLIP4,FEZ1,FGF2,HDGFRP3,LOC644538, LRCH2,PABPC5,PLN,PTBP2,RERG,RNF180,SDC2, SGCE,SPARCL1,SPG20,STX2,TCEAL4,TRPC1,ZNF25 |
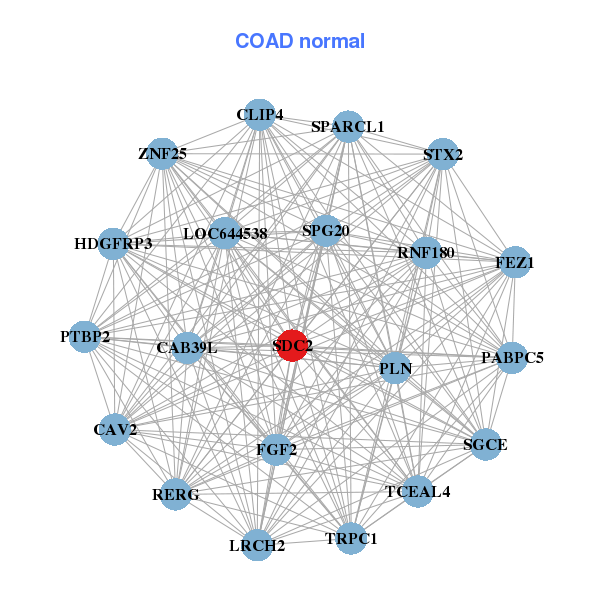
| * Co-Expression network figures were drawn using R package igraph. Only the top 20 genes with the highest correlations were shown. Red circle: input gene, orange circle: cell metabolism gene, sky circle: other gene |
: Open all plots for all cancer types
| Top |
: Open all interacting genes' information including KEGG pathway for all interacting genes from DAVID
| Top |
| Pharmacological Information for SDC2 |
| DB Category | DB Name | DB's ID and Url link |
| Organism-specific databases | PharmGKB | PA35589; -. |
| Organism-specific databases | CTD | 6383; -. |
| * Gene Centered Interaction Network. |
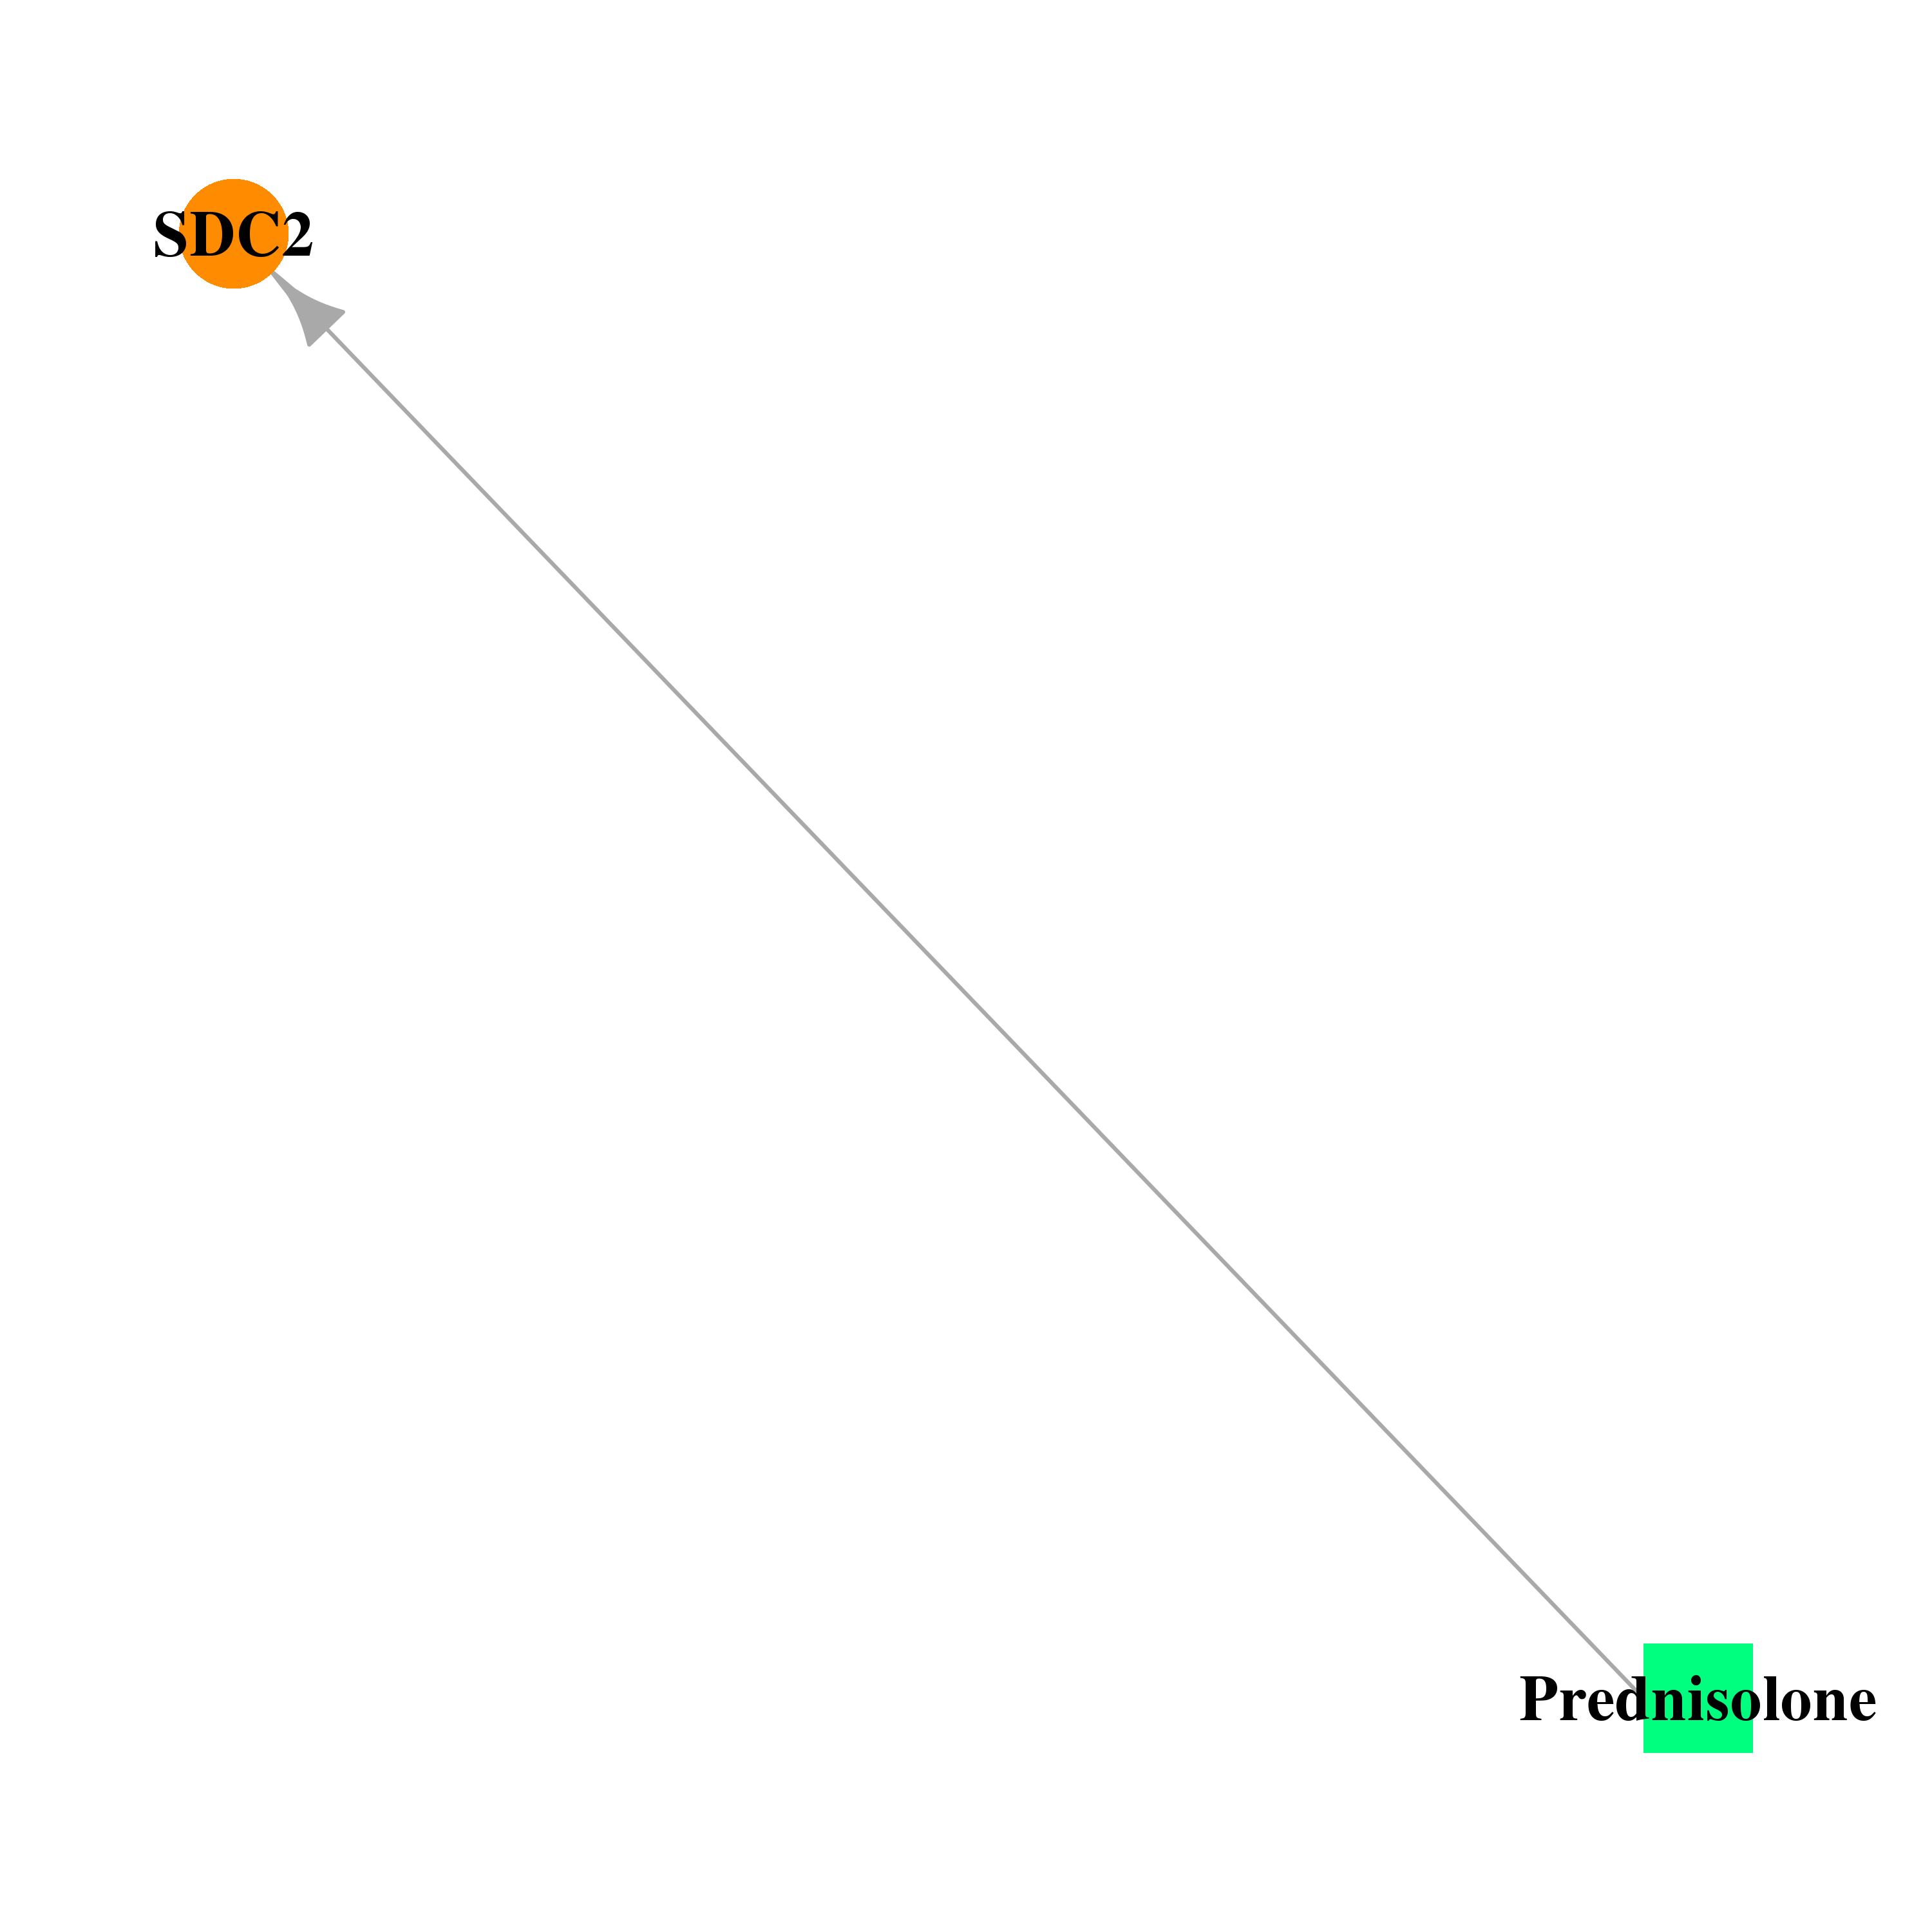 |
| * Drug Centered Interaction Network. |
| DrugBank ID | Target Name | Drug Groups | Generic Name | Drug Centered Network | Drug Structure |
| DB00860 | syndecan 2 | approved | Prednisolone | 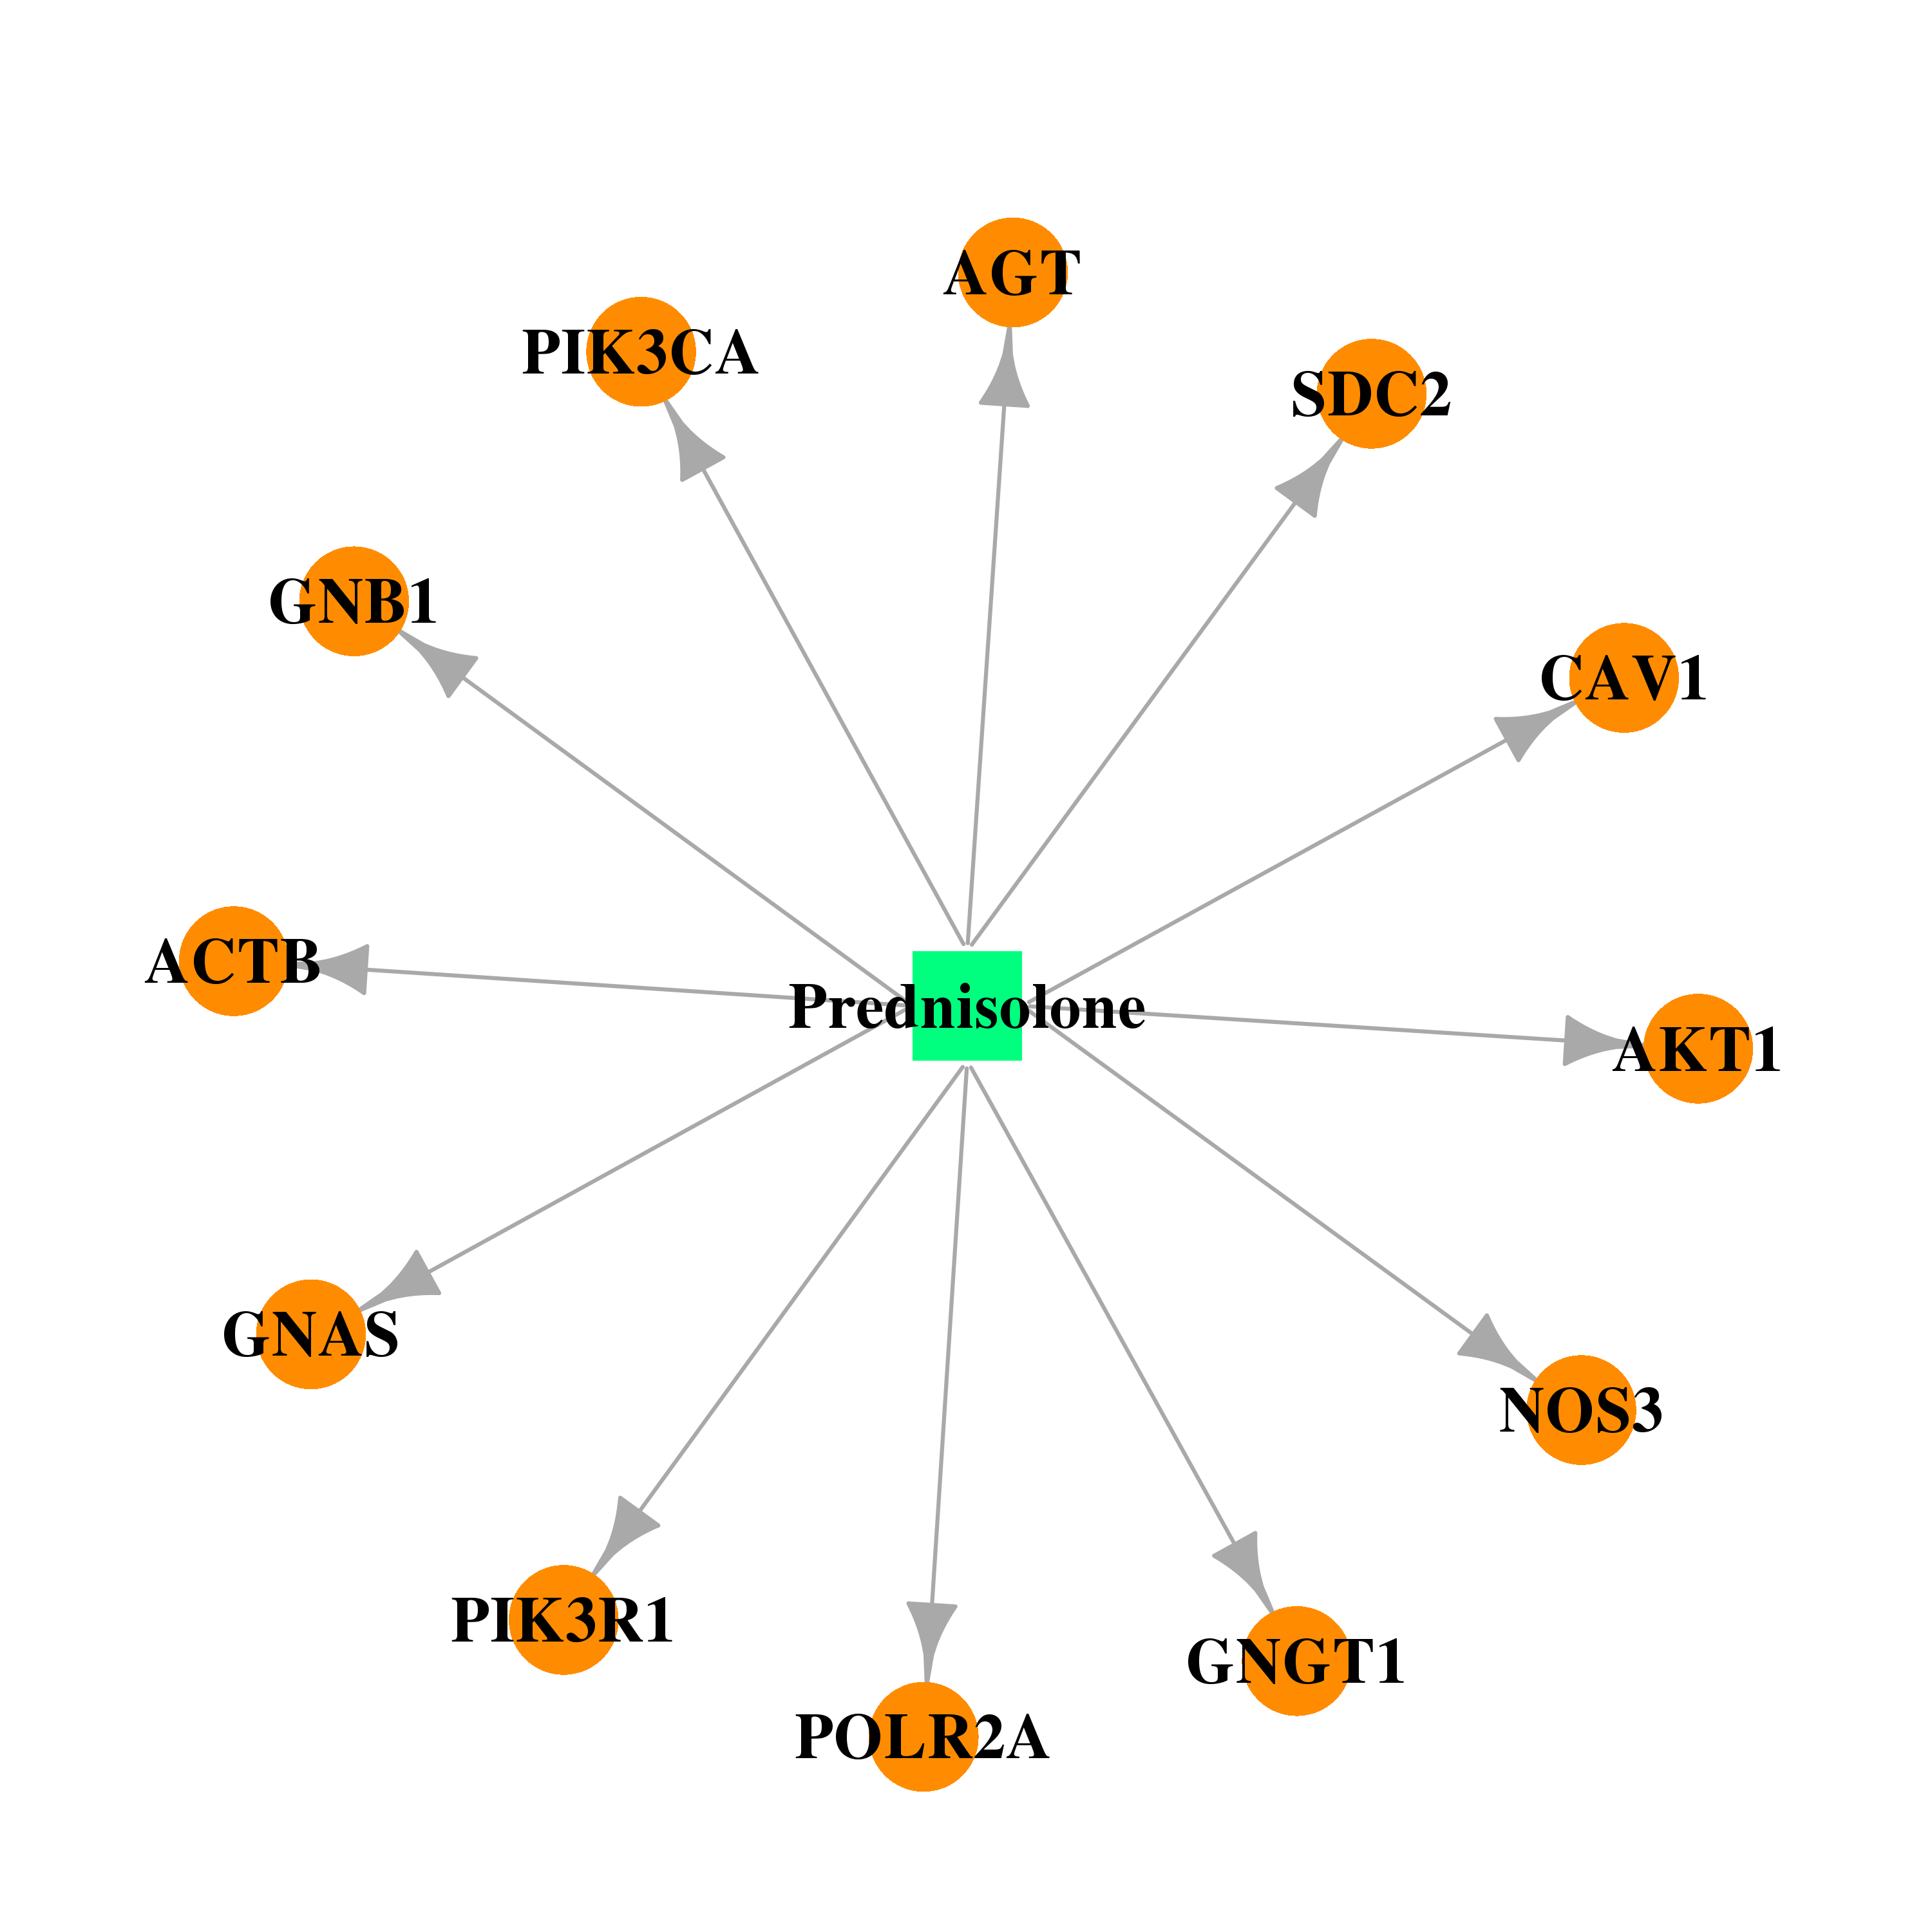 |  |
| Top |
| Cross referenced IDs for SDC2 |
| * We obtained these cross-references from Uniprot database. It covers 150 different DBs, 18 categories. http://www.uniprot.org/help/cross_references_section |
: Open all cross reference information
|
Copyright © 2016-Present - The Univsersity of Texas Health Science Center at Houston @ |