|
|||||||||||||||||||||||||||||||||||||||||||||||||||||||||||||||||||||||||||||||||||||||||||||||||||||||||||||||||||||||||||||||||||||||||||||||||||||||||||||||||||||||||||||||||||||||||||||||||||||||||||||||||||||||||||||||||||||||||||||||||||||||||||||||||||||||||||||||||||||||||||||||||||||||||||||||||||||||||||||||||||||||||||||||||||||||||||||||||||||||||||||||||||||||||||||||||||||||||||||||||||||||||||||||||||||||||||||||||||
| |
| Phenotypic Information (metabolism pathway, cancer, disease, phenome) |
| |
| |
| Gene-Gene Network Information: Co-Expression Network, Interacting Genes & KEGG |
| |
|


| Gene Summary for SHMT1 |
| Basic gene info. | Gene symbol | SHMT1 |
| Gene name | serine hydroxymethyltransferase 1 (soluble) | |
| Synonyms | CSHMT|SHMT | |
| Cytomap | UCSC genome browser: 17p11.2 | |
| Genomic location | chr17 :18231186-18266856 | |
| Type of gene | protein-coding | |
| RefGenes | NM_001281786.1, NM_004169.4,NM_148918.2, | |
| Ensembl id | ENSG00000176974 | |
| Description | cytoplasmic serine hydroxymethyltransferaseglycine hydroxymethyltransferaseserine hydroxymethyltransferase, cytosolicserine methylase | |
| Modification date | 20141222 | |
| dbXrefs | MIM : 182144 | |
| HGNC : HGNC | ||
| Ensembl : ENSG00000176974 | ||
| HPRD : 01643 | ||
| Vega : OTTHUMG00000059094 | ||
| Protein | UniProt: P34896 go to UniProt's Cross Reference DB Table | |
| Expression | CleanEX: HS_SHMT1 | |
| BioGPS: 6470 | ||
| Gene Expression Atlas: ENSG00000176974 | ||
| The Human Protein Atlas: ENSG00000176974 | ||
| Pathway | NCI Pathway Interaction Database: SHMT1 | |
| KEGG: SHMT1 | ||
| REACTOME: SHMT1 | ||
| ConsensusPathDB | ||
| Pathway Commons: SHMT1 | ||
| Metabolism | MetaCyc: SHMT1 | |
| HUMANCyc: SHMT1 | ||
| Regulation | Ensembl's Regulation: ENSG00000176974 | |
| miRBase: chr17 :18,231,186-18,266,856 | ||
| TargetScan: NM_001281786 | ||
| cisRED: ENSG00000176974 | ||
| Context | iHOP: SHMT1 | |
| cancer metabolism search in PubMed: SHMT1 | ||
| UCL Cancer Institute: SHMT1 | ||
| Assigned class in ccmGDB | A - This gene has a literature evidence and it belongs to cancer gene. | |
| References showing role of SHMT1 in cancer cell metabolism | 1. MacFarlane AJ, Perry CA, McEntee MF, Lin DM, Stover PJ (2011) Shmt1 heterozygosity impairs folate-dependent thymidylate synthesis capacity and modifies risk of Apcmin-mediated intestinal cancer risk. Cancer research 71: 2098-2107. go to article 2. Paone A, Marani M, Fiascarelli A, Rinaldo S, Giardina G, et al. (2014) SHMT1 knockdown induces apoptosis in lung cancer cells by causing uracil misincorporation. Cell death & disease 5: e1525. go to article | |
| Top |
| Phenotypic Information for SHMT1(metabolism pathway, cancer, disease, phenome) |
| Cancer | CGAP: SHMT1 |
| Familial Cancer Database: SHMT1 | |
| * This gene is included in those cancer gene databases. |
|
|
|
|
|
|
| |||||||||||||||||||||||||||||||||||||||||||||||||||||||||||||||||||||||||||||||||||||||||||||||||||||||||||||||||||||||||||||||||||||||||||||||||||||||||||||||||||||||||||||||||||||||||||||||||||||||||||||||||||||||||||||||||||||||||||||||||||||||||||||||||||||||||||||||||||||||||||||||||||||||||||||||||||||||||||||||||||||||||||||||||||||||||||||||||||||||||||||||||||||||||||||||||||||||||||||||||||||||||||||||||||||||||||||
Oncogene 1 | Significant driver gene in | ||||||||||||||||||||||||||||||||||||||||||||||||||||||||||||||||||||||||||||||||||||||||||||||||||||||||||||||||||||||||||||||||||||||||||||||||||||||||||||||||||||||||||||||||||||||||||||||||||||||||||||||||||||||||||||||||||||||||||||||||||||||||||||||||||||||||||||||||||||||||||||||||||||||||||||||||||||||||||||||||||||||||||||||||||||||||||||||||||||||||||||||||||||||||||||||||||||||||||||||||||||||||||||||||||||||||||||||||||
| cf) number; DB name 1 Oncogene; http://nar.oxfordjournals.org/content/35/suppl_1/D721.long, 2 Tumor Suppressor gene; https://bioinfo.uth.edu/TSGene/, 3 Cancer Gene Census; http://www.nature.com/nrc/journal/v4/n3/abs/nrc1299.html, 4 CancerGenes; http://nar.oxfordjournals.org/content/35/suppl_1/D721.long, 5 Network of Cancer Gene; http://ncg.kcl.ac.uk/index.php, 1Therapeutic Vulnerabilities in Cancer; http://cbio.mskcc.org/cancergenomics/statius/ |
| KEGG_GLYCINE_SERINE_AND_THREONINE_METABOLISM REACTOME_METABOLISM_OF_VITAMINS_AND_COFACTORS REACTOME_METABOLISM_OF_AMINO_ACIDS_AND_DERIVATIVES | |
| OMIM | 182144; gene. |
| Orphanet | |
| Disease | KEGG Disease: SHMT1 |
| MedGen: SHMT1 (Human Medical Genetics with Condition) | |
| ClinVar: SHMT1 | |
| Phenotype | MGI: SHMT1 (International Mouse Phenotyping Consortium) |
| PhenomicDB: SHMT1 | |
| Mutations for SHMT1 |
| * Under tables are showing count per each tissue to give us broad intuition about tissue specific mutation patterns.You can go to the detailed page for each mutation database's web site. |
| There's no structural variation information in COSMIC data for this gene. |
| * From mRNA Sanger sequences, Chitars2.0 arranged chimeric transcripts. This table shows SHMT1 related fusion information. |
| ID | Head Gene | Tail Gene | Accession | Gene_a | qStart_a | qEnd_a | Chromosome_a | tStart_a | tEnd_a | Gene_a | qStart_a | qEnd_a | Chromosome_a | tStart_a | tEnd_a |
| BF356130 | TFCP2L1 | 45 | 321 | 2 | 122041465 | 122041739 | SHMT1 | 309 | 382 | 17 | 18238384 | 18238457 | |
| AX747021 | SHMT1 | 1 | 2757 | 17 | 18233997 | 18236753 | MLLT11 | 2753 | 3088 | 1 | 151040932 | 151041267 | |
| BF356132 | TFCP2L1 | 9 | 323 | 2 | 122041420 | 122041739 | SHMT1 | 311 | 384 | 17 | 18238384 | 18238457 | |
| AK091498 | SHMT1 | 1 | 2757 | 17 | 18233997 | 18236753 | MLLT11 | 2753 | 3088 | 1 | 151040932 | 151041267 | |
| Top |
| Mutation type/ Tissue ID | brca | cns | cerv | endome | haematopo | kidn | Lintest | liver | lung | ns | ovary | pancre | prost | skin | stoma | thyro | urina | |||
| Total # sample | 2 | |||||||||||||||||||
| GAIN (# sample) | 2 | |||||||||||||||||||
| LOSS (# sample) |
| cf) Tissue ID; Tissue type (1; Breast, 2; Central_nervous_system, 3; Cervix, 4; Endometrium, 5; Haematopoietic_and_lymphoid_tissue, 6; Kidney, 7; Large_intestine, 8; Liver, 9; Lung, 10; NS, 11; Ovary, 12; Pancreas, 13; Prostate, 14; Skin, 15; Stomach, 16; Thyroid, 17; Urinary_tract) |
| Top |
|
 |
| Top |
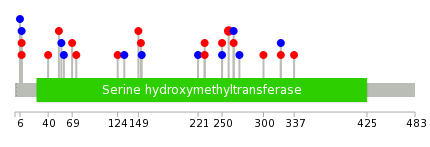
| Stat. for Non-Synonymous SNVs (# total SNVs=27) | (# total SNVs=9) |
 |  |
(# total SNVs=1) | (# total SNVs=0) |
 |
| Top |
| * When you move the cursor on each content, you can see more deailed mutation information on the Tooltip. Those are primary_site,primary_histology,mutation(aa),pubmedID. |
| GRCh37 position | Mutation(aa) | Unique sampleID count |
| chr17:18250892-18250892 | p.G146V | 2 |
| chr17:18250897-18250897 | p.P144P | 2 |
| chr17:18259194-18259194 | p.? | 2 |
| chr17:18243507-18243507 | p.G222R | 2 |
| chr17:18232096-18232096 | p.L474F | 2 |
| chr17:18232688-18232688 | p.L396V | 2 |
| chr17:18243556-18243556 | p.Y205* | 1 |
| chr17:18232119-18232119 | p.E466G | 1 |
| chr17:18251741-18251741 | p.T86A | 1 |
| chr17:18233878-18233878 | p.T388S | 1 |
| Top |
|
 |
| Point Mutation/ Tissue ID | 1 | 2 | 3 | 4 | 5 | 6 | 7 | 8 | 9 | 10 | 11 | 12 | 13 | 14 | 15 | 16 | 17 | 18 | 19 | 20 |
| # sample | 1 | 1 | 1 | 4 | 2 | 1 | 3 | 2 | 2 | 2 | 3 | 1 | 5 | |||||||
| # mutation | 1 | 1 | 1 | 4 | 2 | 1 | 3 | 2 | 2 | 2 | 3 | 1 | 5 | |||||||
| nonsynonymous SNV | 1 | 1 | 2 | 1 | 1 | 2 | 2 | 1 | 2 | 4 | ||||||||||
| synonymous SNV | 1 | 2 | 1 | 1 | 2 | 1 | 1 | 1 | 1 |
| cf) Tissue ID; Tissue type (1; BLCA[Bladder Urothelial Carcinoma], 2; BRCA[Breast invasive carcinoma], 3; CESC[Cervical squamous cell carcinoma and endocervical adenocarcinoma], 4; COAD[Colon adenocarcinoma], 5; GBM[Glioblastoma multiforme], 6; Glioma Low Grade, 7; HNSC[Head and Neck squamous cell carcinoma], 8; KICH[Kidney Chromophobe], 9; KIRC[Kidney renal clear cell carcinoma], 10; KIRP[Kidney renal papillary cell carcinoma], 11; LAML[Acute Myeloid Leukemia], 12; LUAD[Lung adenocarcinoma], 13; LUSC[Lung squamous cell carcinoma], 14; OV[Ovarian serous cystadenocarcinoma ], 15; PAAD[Pancreatic adenocarcinoma], 16; PRAD[Prostate adenocarcinoma], 17; SKCM[Skin Cutaneous Melanoma], 18:STAD[Stomach adenocarcinoma], 19:THCA[Thyroid carcinoma], 20:UCEC[Uterine Corpus Endometrial Carcinoma]) |
| Top |
| * We represented just top 10 SNVs. When you move the cursor on each content, you can see more deailed mutation information on the Tooltip. Those are primary_site, primary_histology, mutation(aa), pubmedID. |
| Genomic Position | Mutation(aa) | Unique sampleID count |
| chr17:18232688 | p.G8E,SHMT1 | 2 |
| chr17:18250892 | p.L258V,SHMT1 | 2 |
| chr17:18257053 | p.D300N,SHMT1 | 1 |
| chr17:18232204 | p.G8G,SHMT1 | 1 |
| chr17:18238935 | p.T271T,SHMT1 | 1 |
| chr17:18257060 | p.R264R,SHMT1 | 1 |
| chr17:18232647 | p.P6P,SHMT1 | 1 |
| chr17:18238944 | p.R264W,SHMT1 | 1 |
| chr17:18257108 | p.V132V,SHMT1 | 1 |
| chr17:18232668 | p.N124I,SHMT1 | 1 |
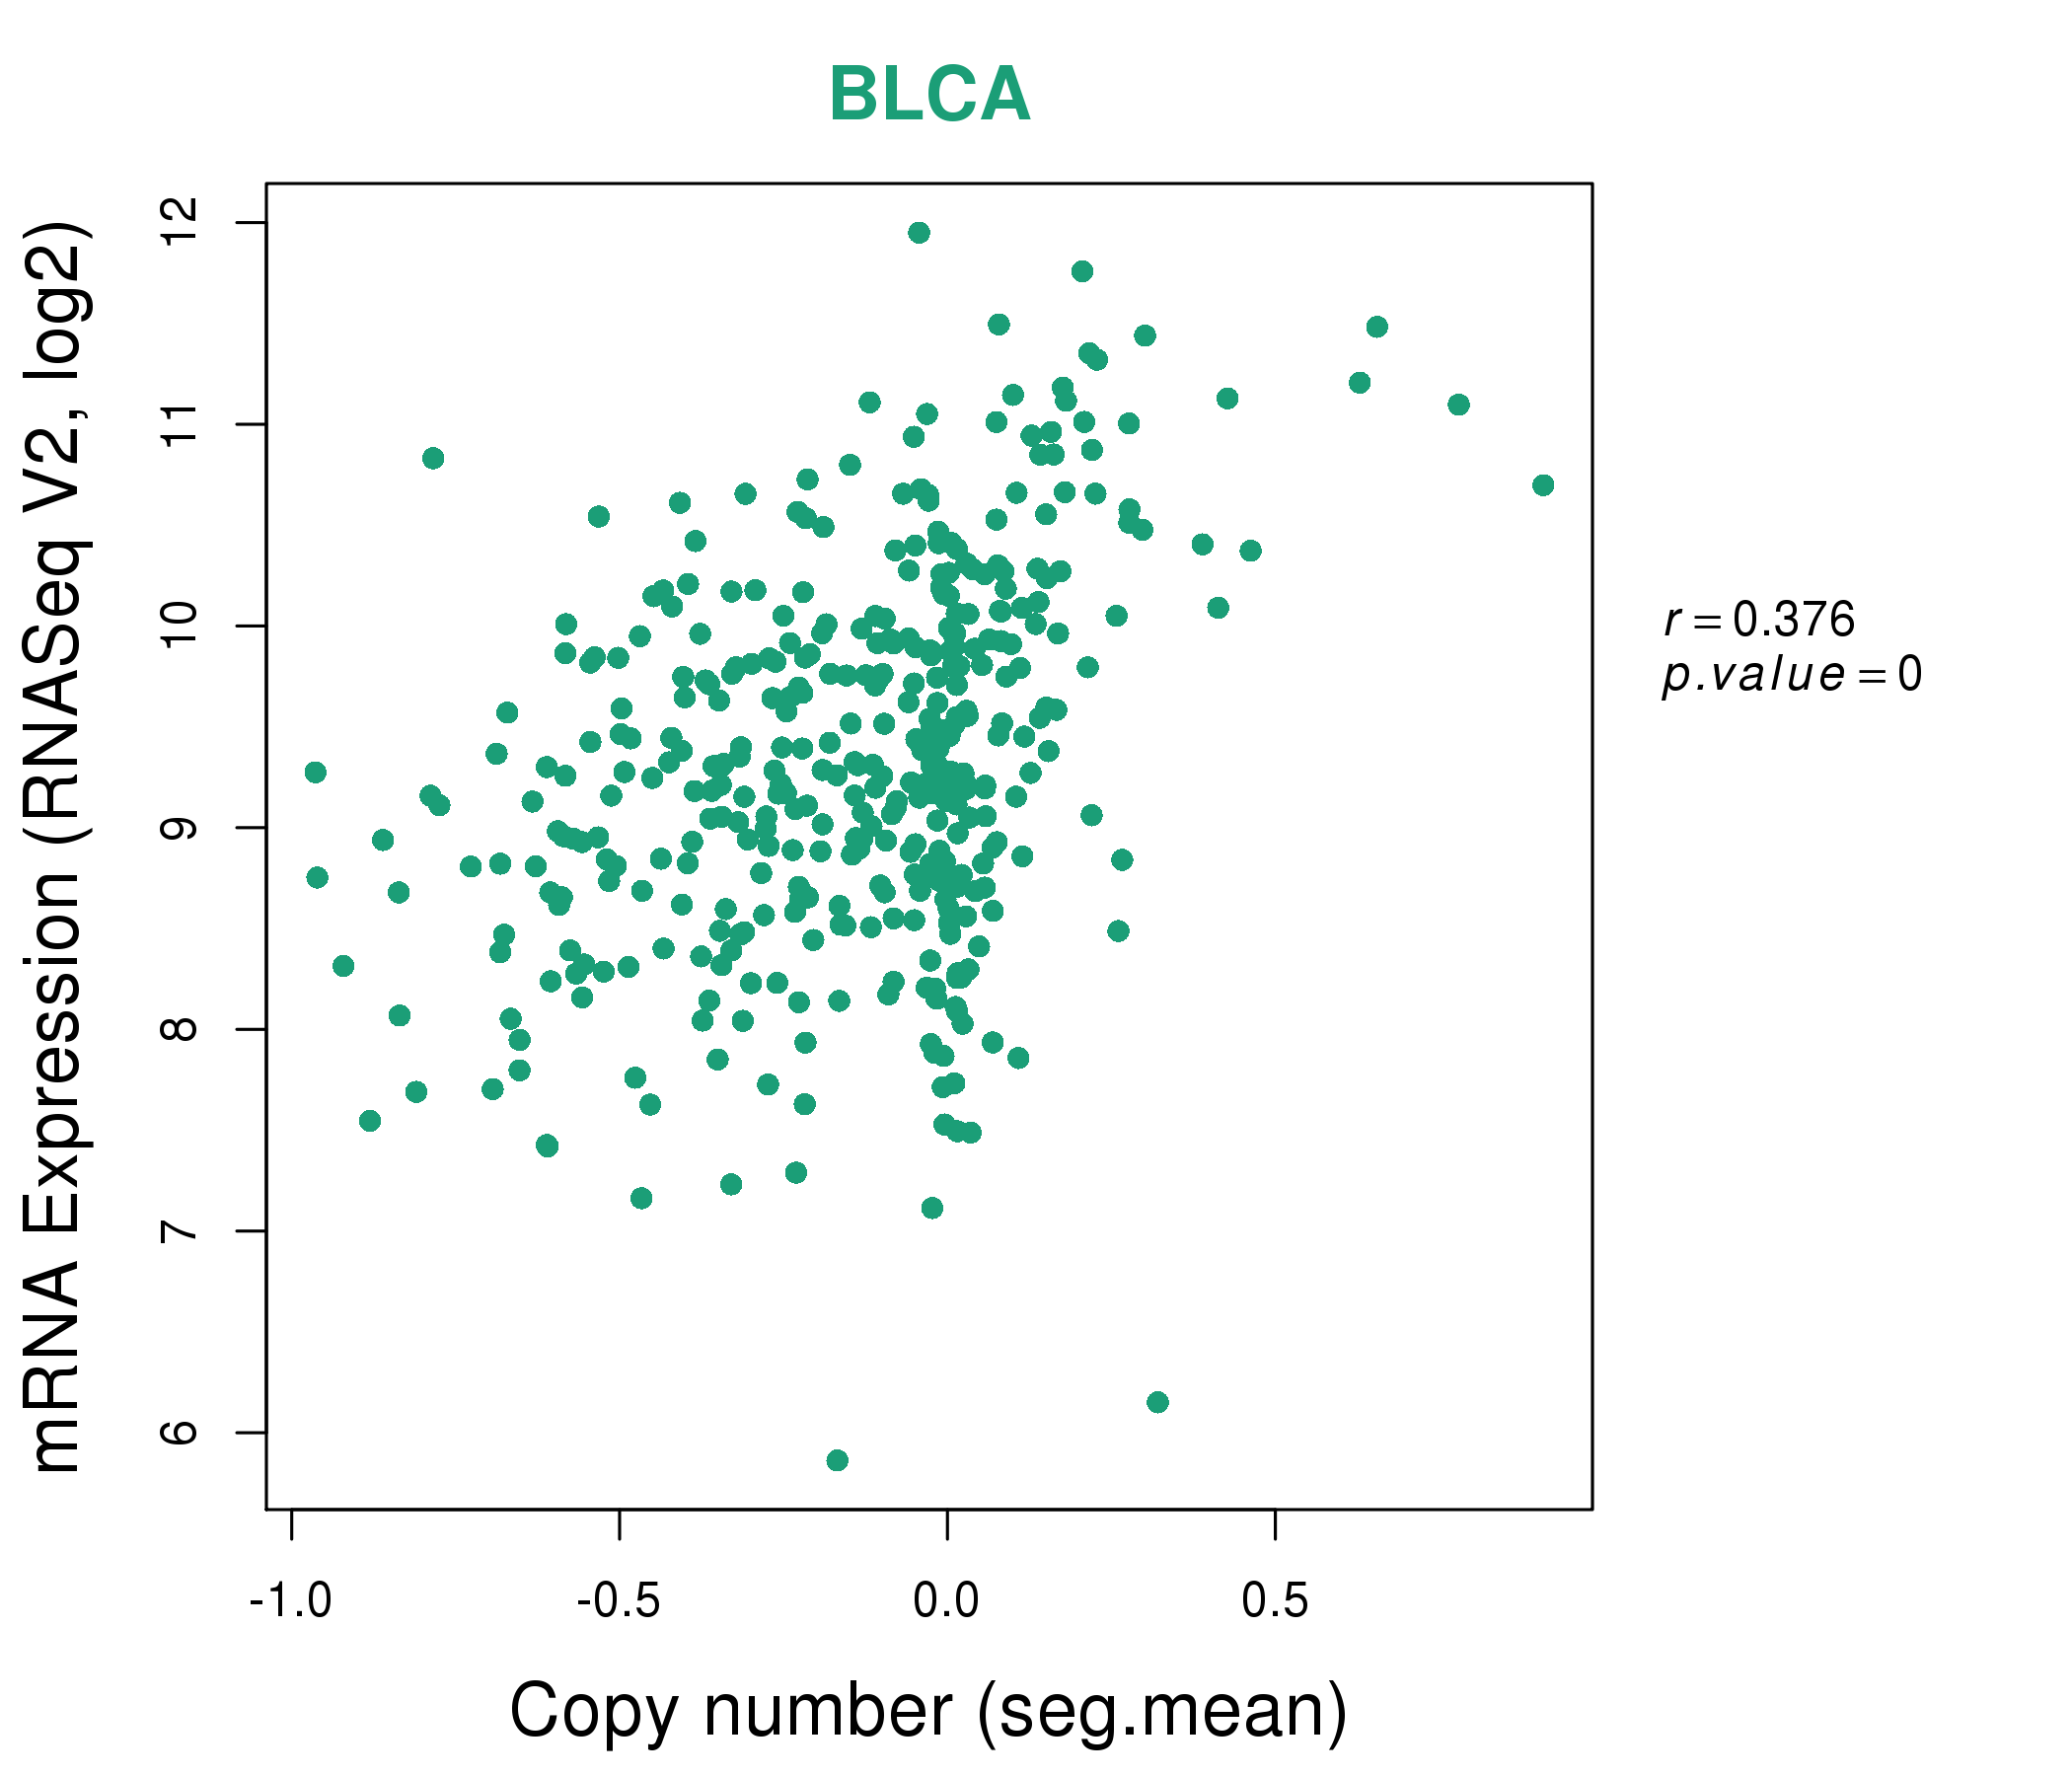
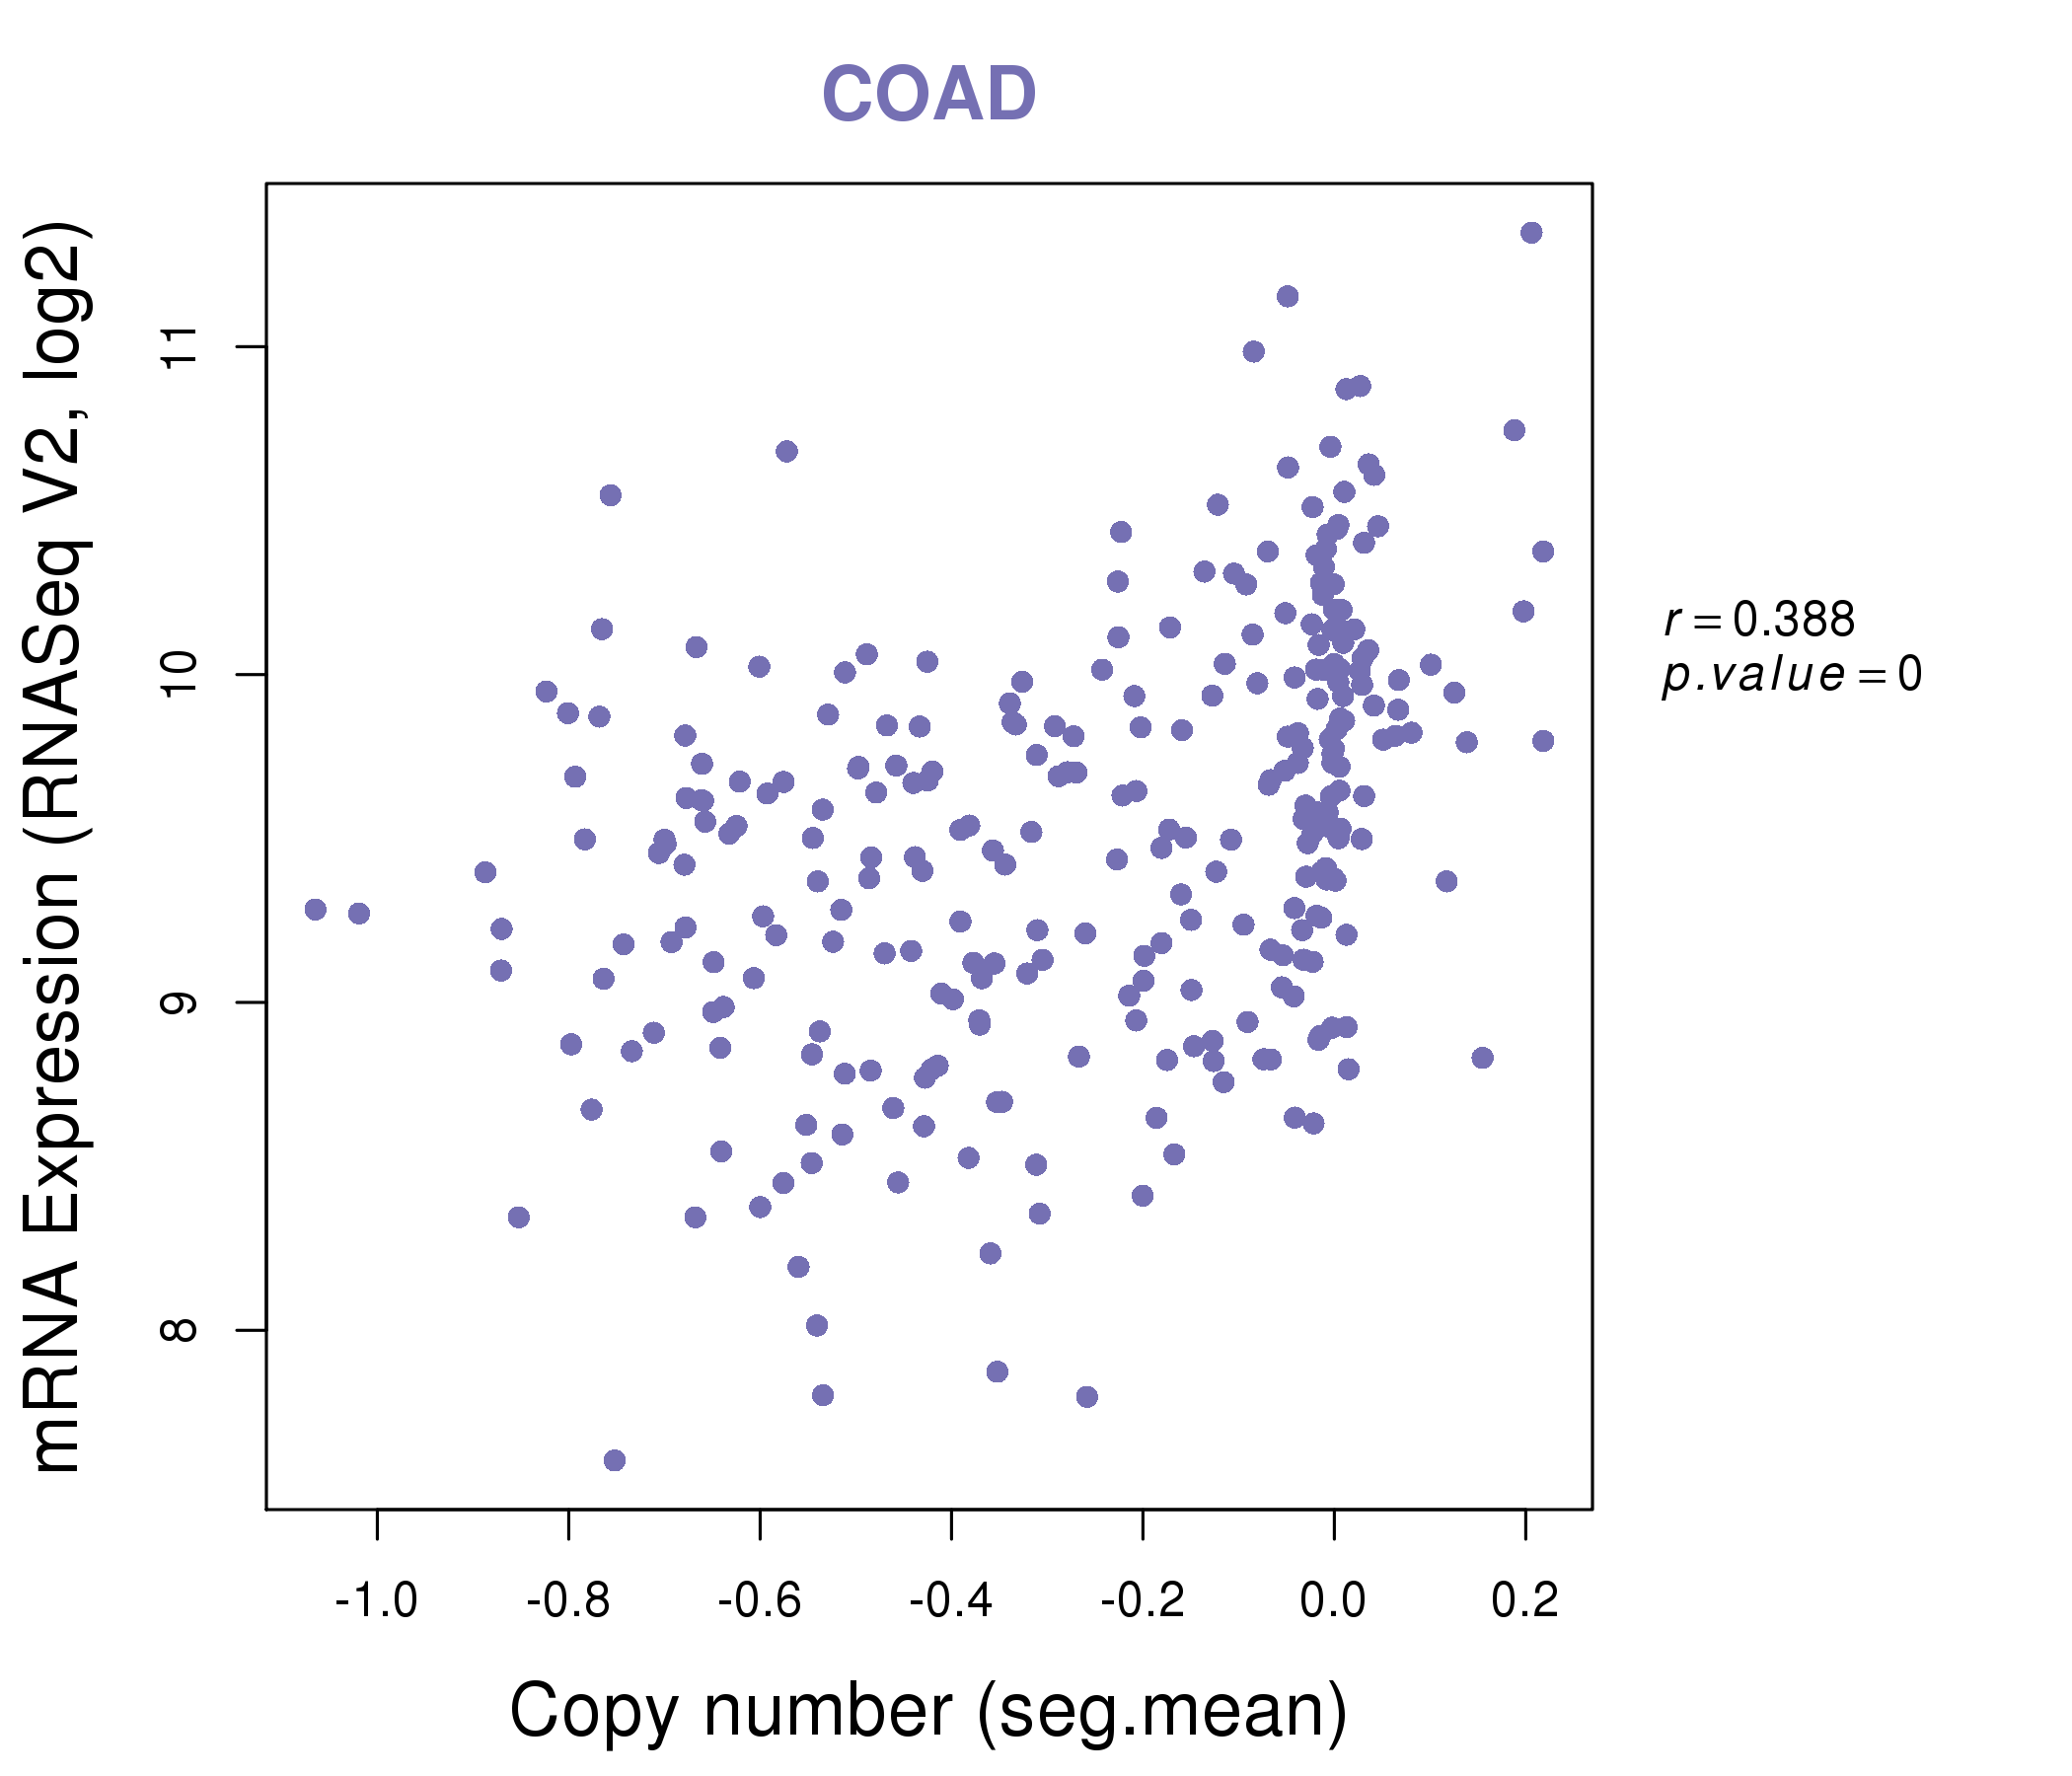
| * Copy number data were extracted from TCGA using R package TCGA-Assembler. The URLs of all public data files on TCGA DCC data server were gathered on Jan-05-2015. Function ProcessCNAData in TCGA-Assembler package was used to obtain gene-level copy number value which is calculated as the average copy number of the genomic region of a gene. |
 |
| cf) Tissue ID[Tissue type]: BLCA[Bladder Urothelial Carcinoma], BRCA[Breast invasive carcinoma], CESC[Cervical squamous cell carcinoma and endocervical adenocarcinoma], COAD[Colon adenocarcinoma], GBM[Glioblastoma multiforme], Glioma Low Grade, HNSC[Head and Neck squamous cell carcinoma], KICH[Kidney Chromophobe], KIRC[Kidney renal clear cell carcinoma], KIRP[Kidney renal papillary cell carcinoma], LAML[Acute Myeloid Leukemia], LUAD[Lung adenocarcinoma], LUSC[Lung squamous cell carcinoma], OV[Ovarian serous cystadenocarcinoma ], PAAD[Pancreatic adenocarcinoma], PRAD[Prostate adenocarcinoma], SKCM[Skin Cutaneous Melanoma], STAD[Stomach adenocarcinoma], THCA[Thyroid carcinoma], UCEC[Uterine Corpus Endometrial Carcinoma] |
| Top |
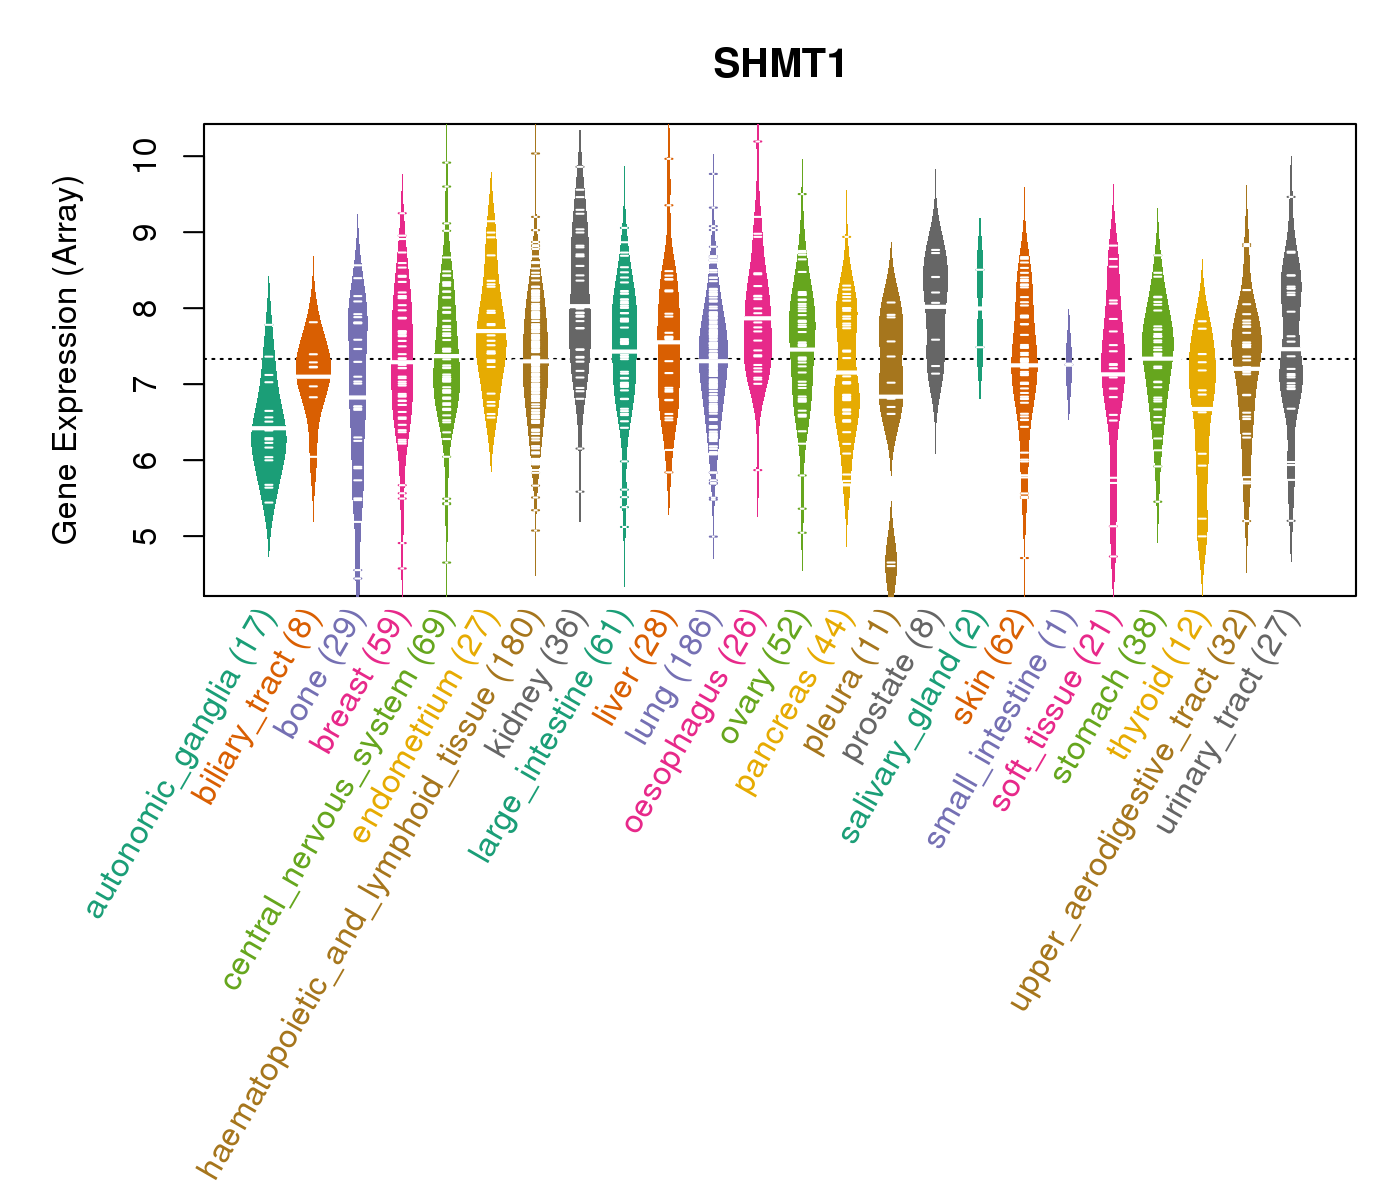
| Gene Expression for SHMT1 |
| * CCLE gene expression data were extracted from CCLE_Expression_Entrez_2012-10-18.res: Gene-centric RMA-normalized mRNA expression data. |
 |
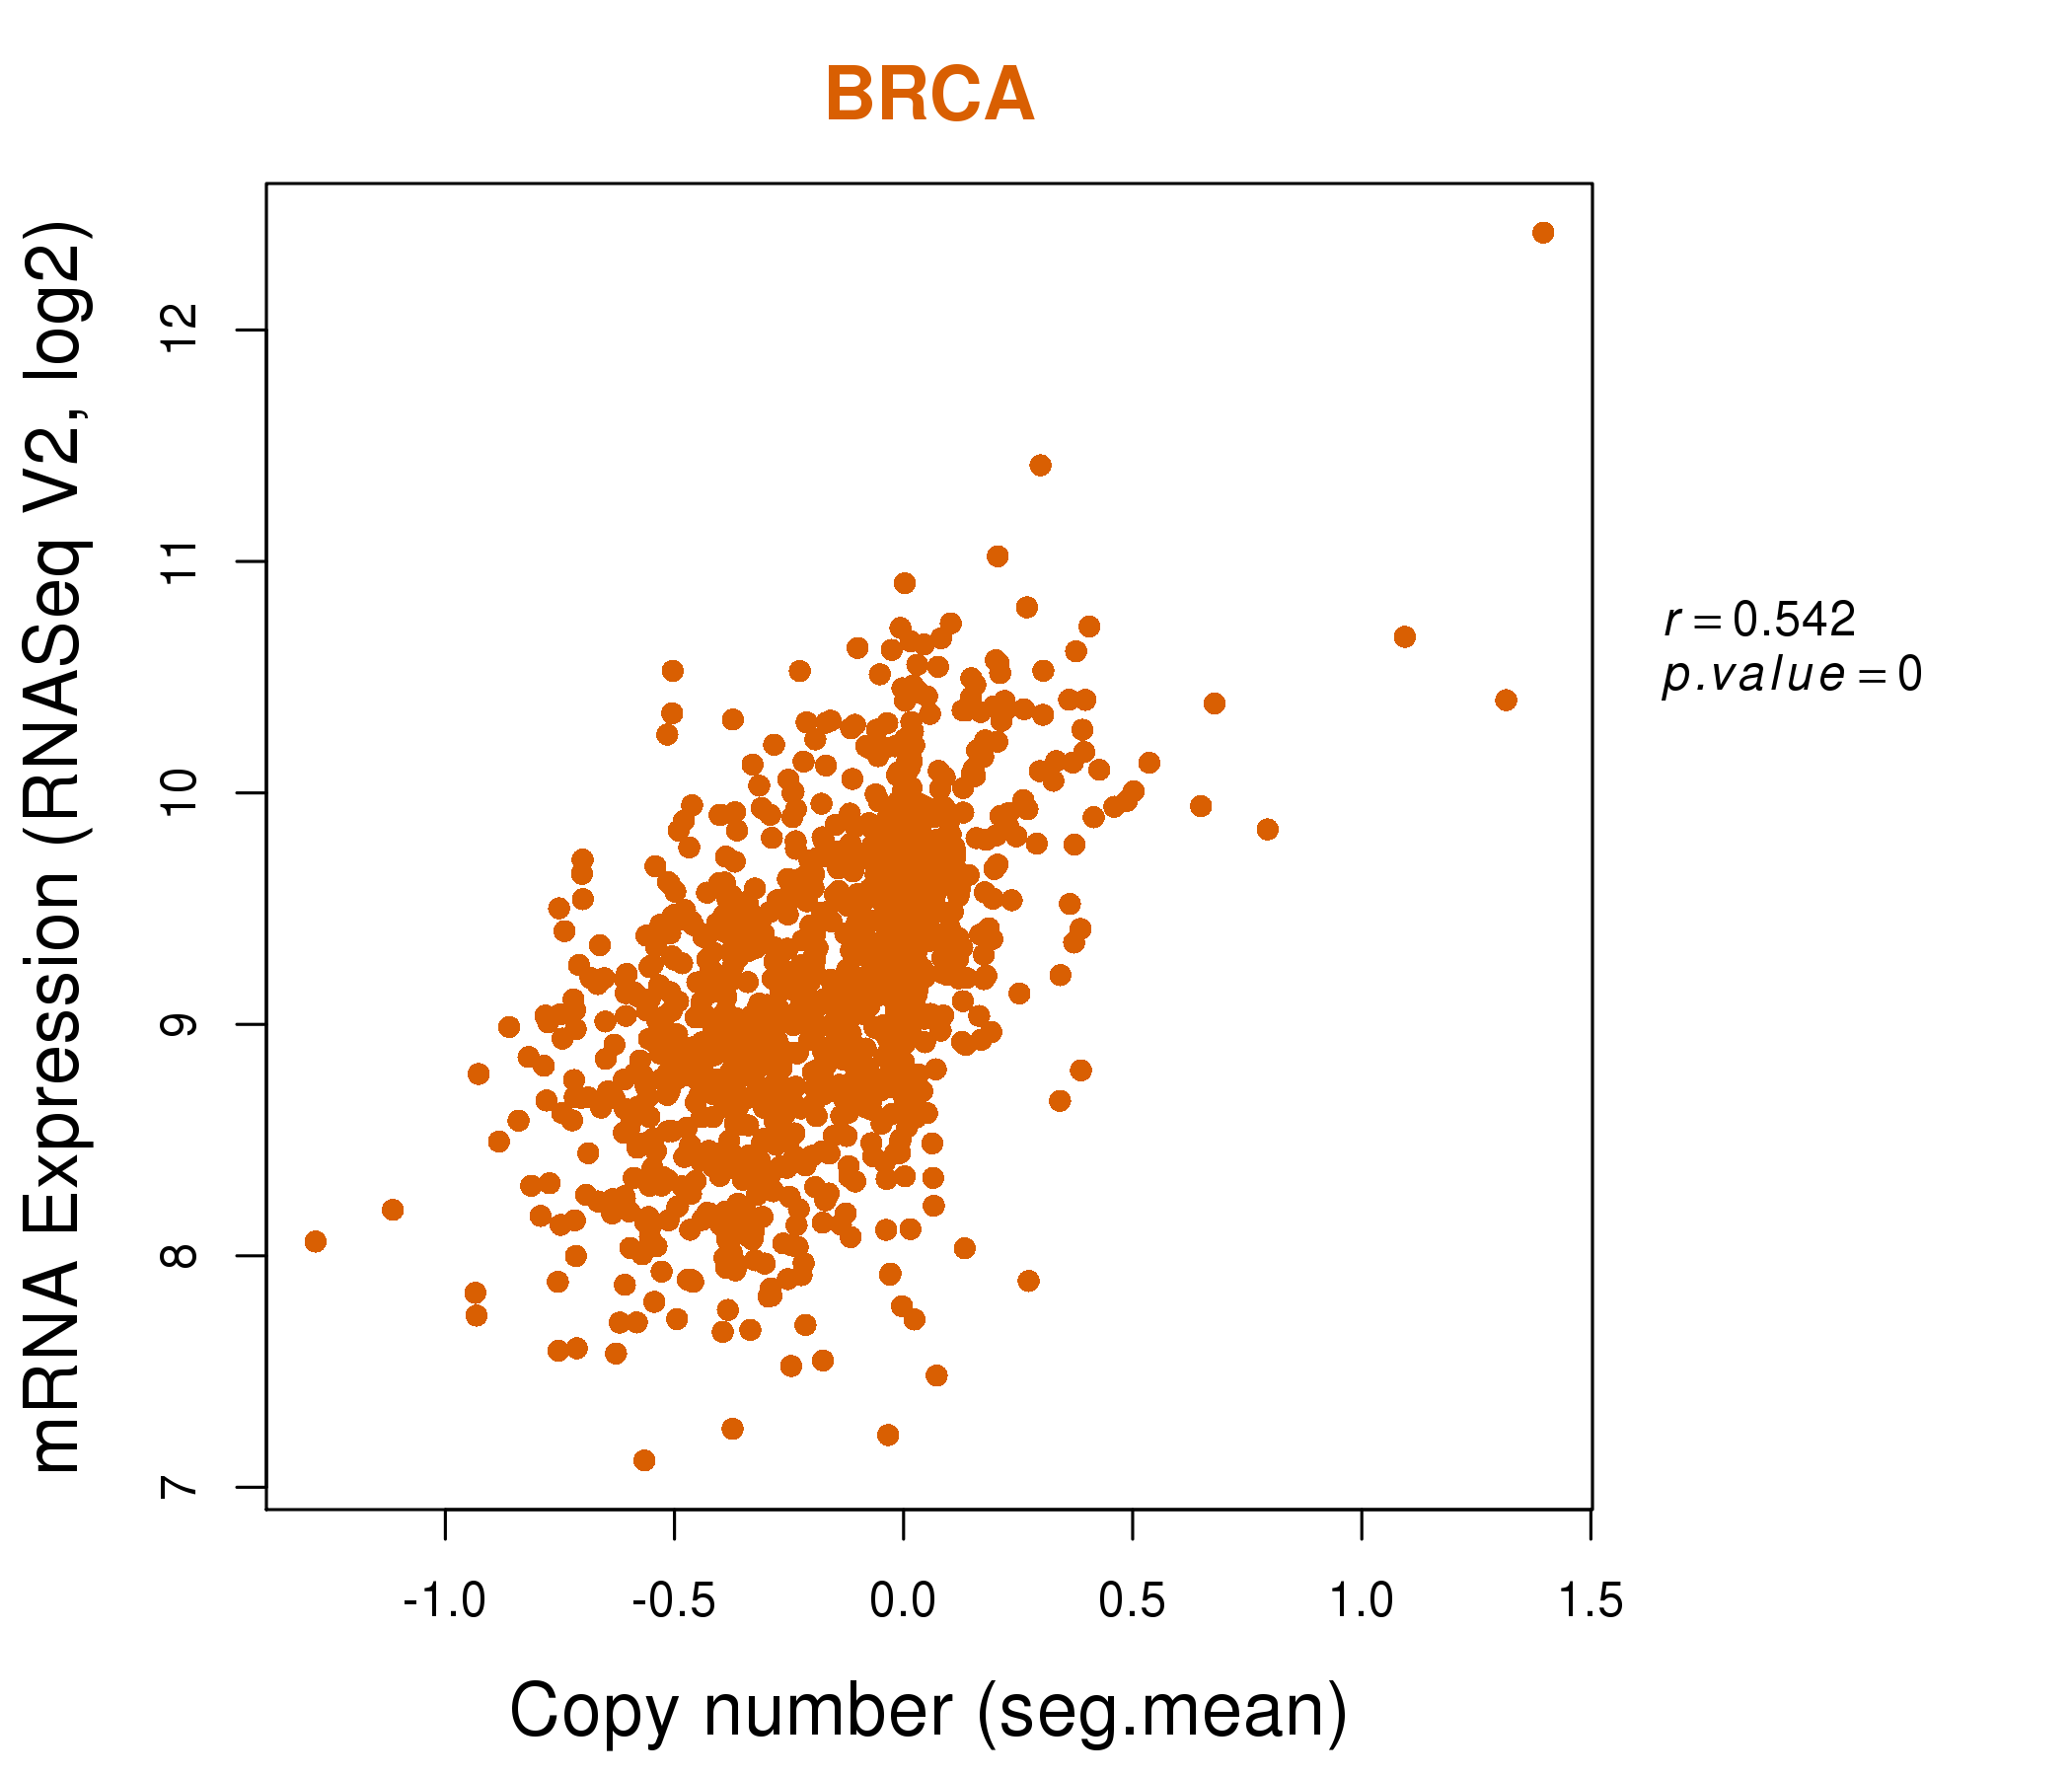
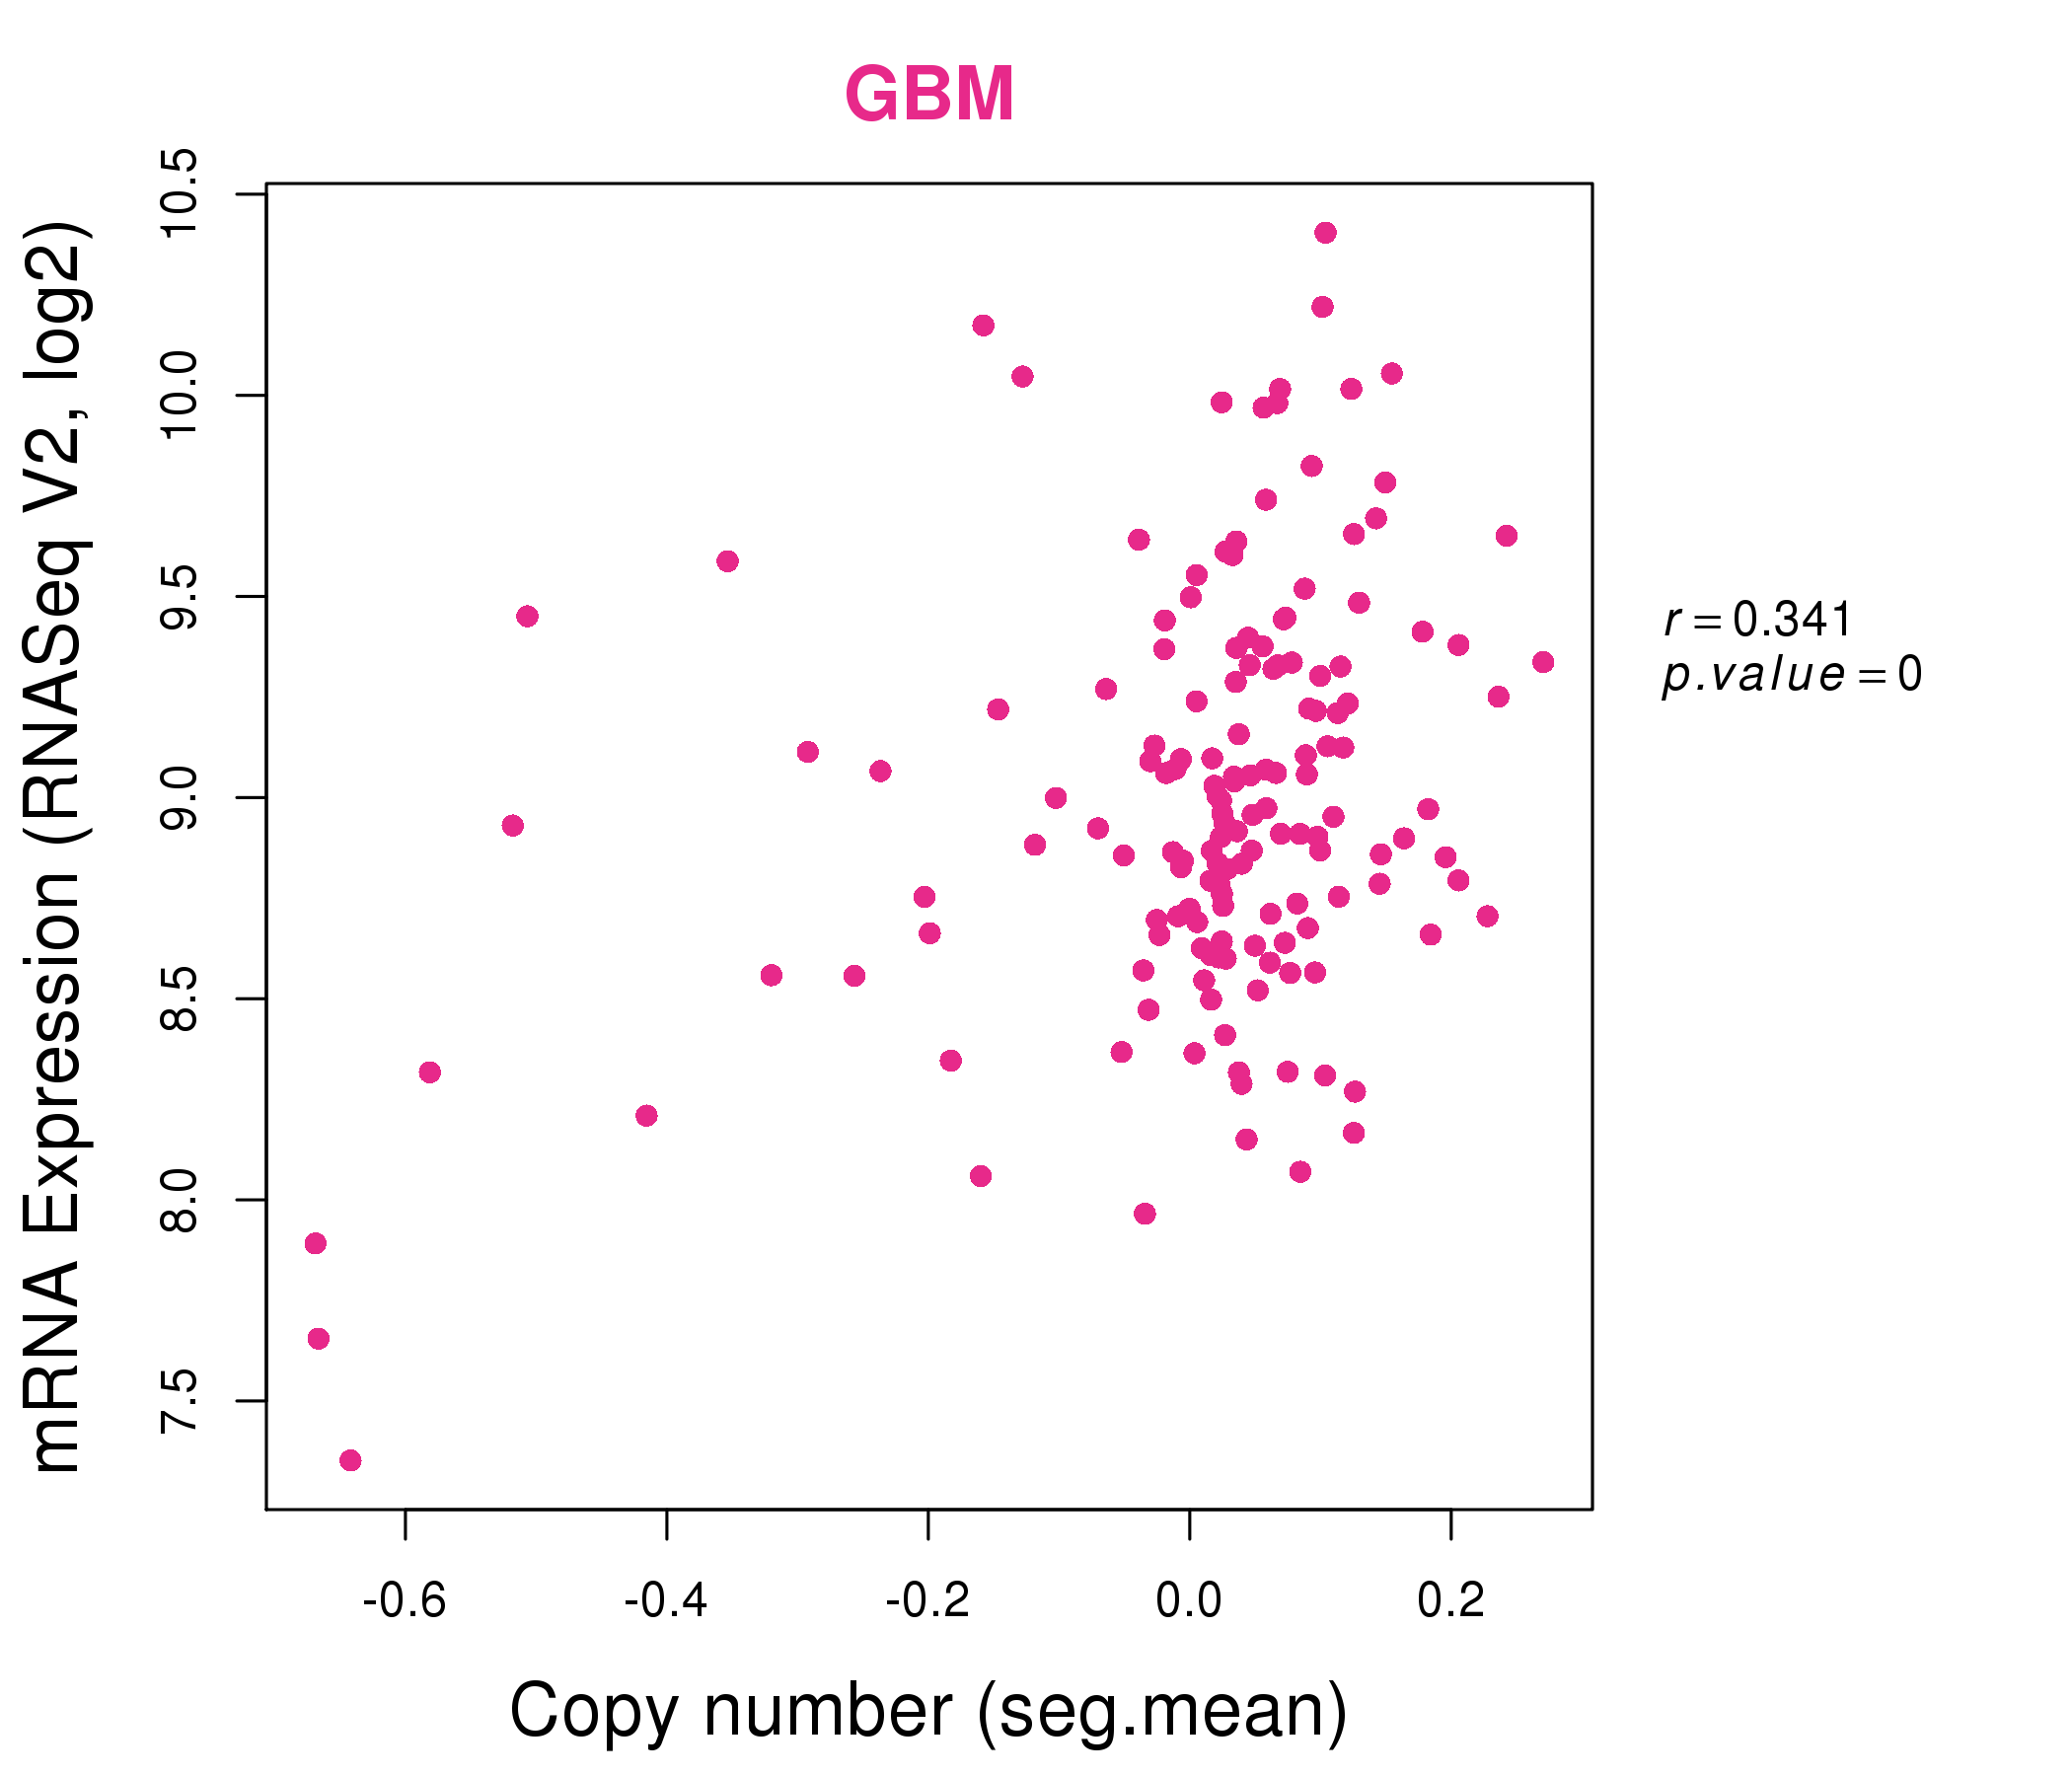
| * Normalized gene expression data of RNASeqV2 was extracted from TCGA using R package TCGA-Assembler. The URLs of all public data files on TCGA DCC data server were gathered at Jan-05-2015. Only eight cancer types have enough normal control samples for differential expression analysis. (t test, adjusted p<0.05 (using Benjamini-Hochberg FDR)) |
 |
| Top |
| * This plots show the correlation between CNV and gene expression. |
: Open all plots for all cancer types
 |
|
 |
|
| Top |
| Gene-Gene Network Information |
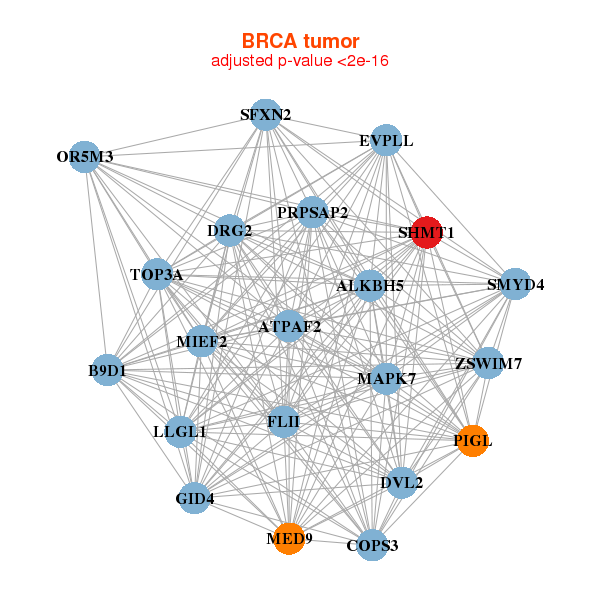
| * Co-Expression network figures were drawn using R package igraph. Only the top 20 genes with the highest correlations were shown. Red circle: input gene, orange circle: cell metabolism gene, sky circle: other gene |
: Open all plots for all cancer types
 |
| ||||
| ALKBH5,ATPAF2,B9D1,GID4,COPS3,DRG2,DVL2, EVPLL,FLII,LLGL1,MAPK7,MED9,OR5M3,PIGL, PRPSAP2,SFXN2,SHMT1,MIEF2,SMYD4,TOP3A,ZSWIM7 | ACACB,ALDH1L1,ASS1,C17orf53,C20orf27,CIDEA,CKB, CYB5A,ECHDC3,GLUL,HADH,HRSP12,MLXIPL,MOCS1, ORMDL3,PC,SHMT1,SLC25A1,STAT5A,TM7SF2,TMEM120A | ||||
 |
| ||||
| ATPAF2,AURKB,C1QBP,COPS3,COX10,ECHS1,EIF4A1, EIF5A,EIF5AL1,ELAC2,FAM64A,GLOD4,MPDU1,PFN1, RNMTL1,SCO1,SHMT1,SLC25A11,TTC19,WRAP53,YWHAE | AKR1A1,DNPH1,C9orf41,CA9,CDCA3,DDC,DHRS4L2, EPHA1,ESPL1,FAH,FANCC,GCHFR,LCLAT1,MOCOS, NPY6R,OTC,PCYT2,PNPO,SHMT1,SLC25A15,SLC2A9 |
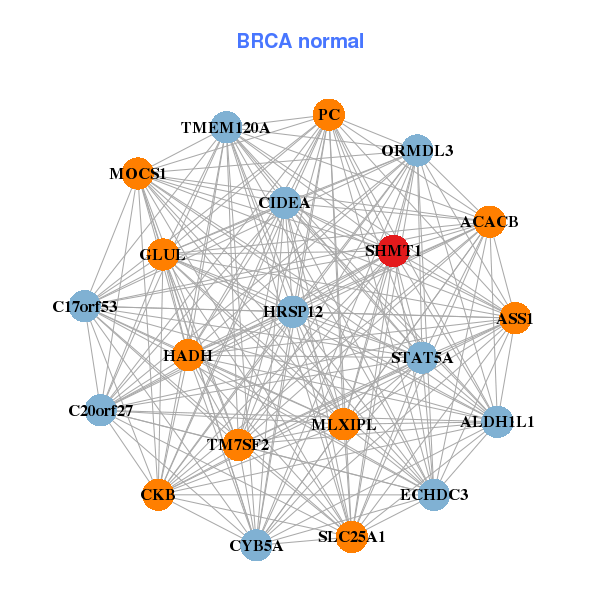

| * Co-Expression network figures were drawn using R package igraph. Only the top 20 genes with the highest correlations were shown. Red circle: input gene, orange circle: cell metabolism gene, sky circle: other gene |
: Open all plots for all cancer types
| Top |
: Open all interacting genes' information including KEGG pathway for all interacting genes from DAVID
| Top |
| Pharmacological Information for SHMT1 |
| DB Category | DB Name | DB's ID and Url link |
| Chemistry | BindingDB | P34896; -. |
| Chemistry | ChEMBL | CHEMBL1772927; -. |
| Organism-specific databases | PharmGKB | PA35753; -. |
| Organism-specific databases | CTD | 6470; -. |
| * Gene Centered Interaction Network. |
 |
| * Drug Centered Interaction Network. |
| DrugBank ID | Target Name | Drug Groups | Generic Name | Drug Centered Network | Drug Structure |
| DB00114 | serine hydroxymethyltransferase 1 (soluble) | nutraceutical | Pyridoxal Phosphate |  |  |
| DB00116 | serine hydroxymethyltransferase 1 (soluble) | approved; nutraceutical | Tetrahydrofolic acid | 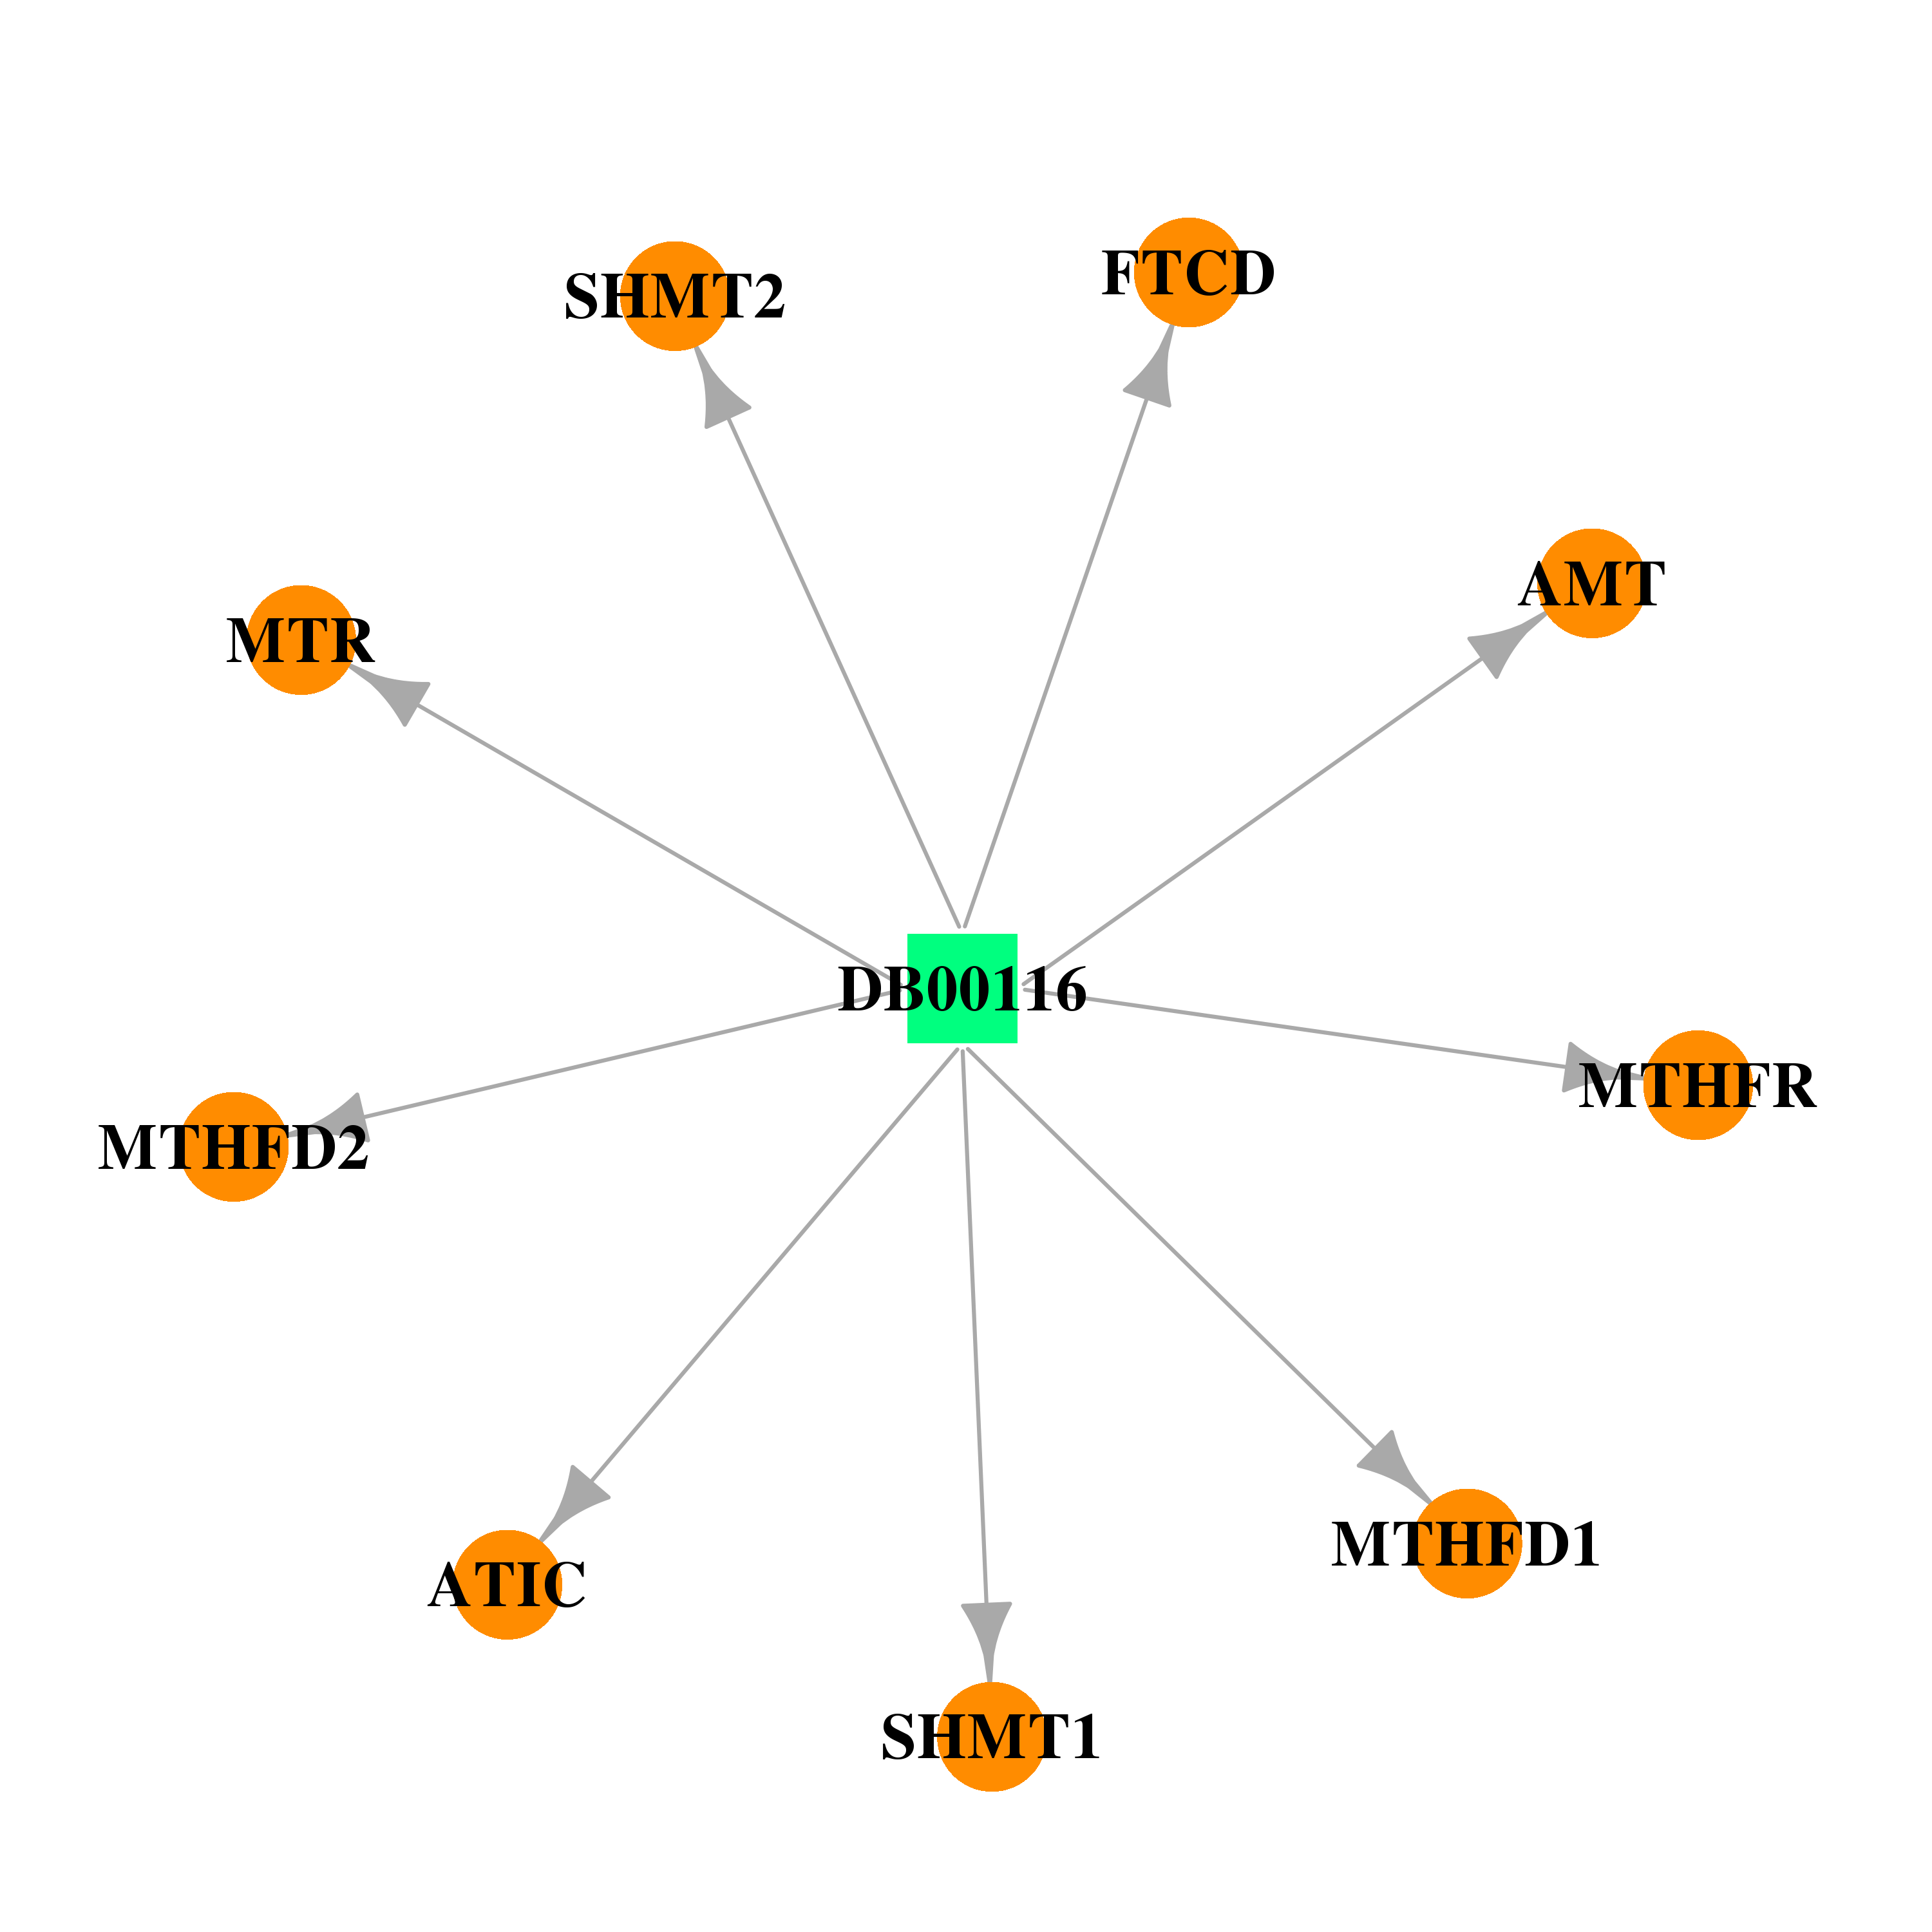 | 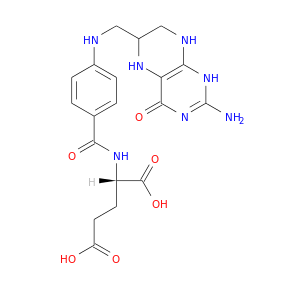 |
| DB00145 | serine hydroxymethyltransferase 1 (soluble) | approved; nutraceutical | Glycine |  |  |
| DB01055 | serine hydroxymethyltransferase 1 (soluble) | approved | Mimosine | 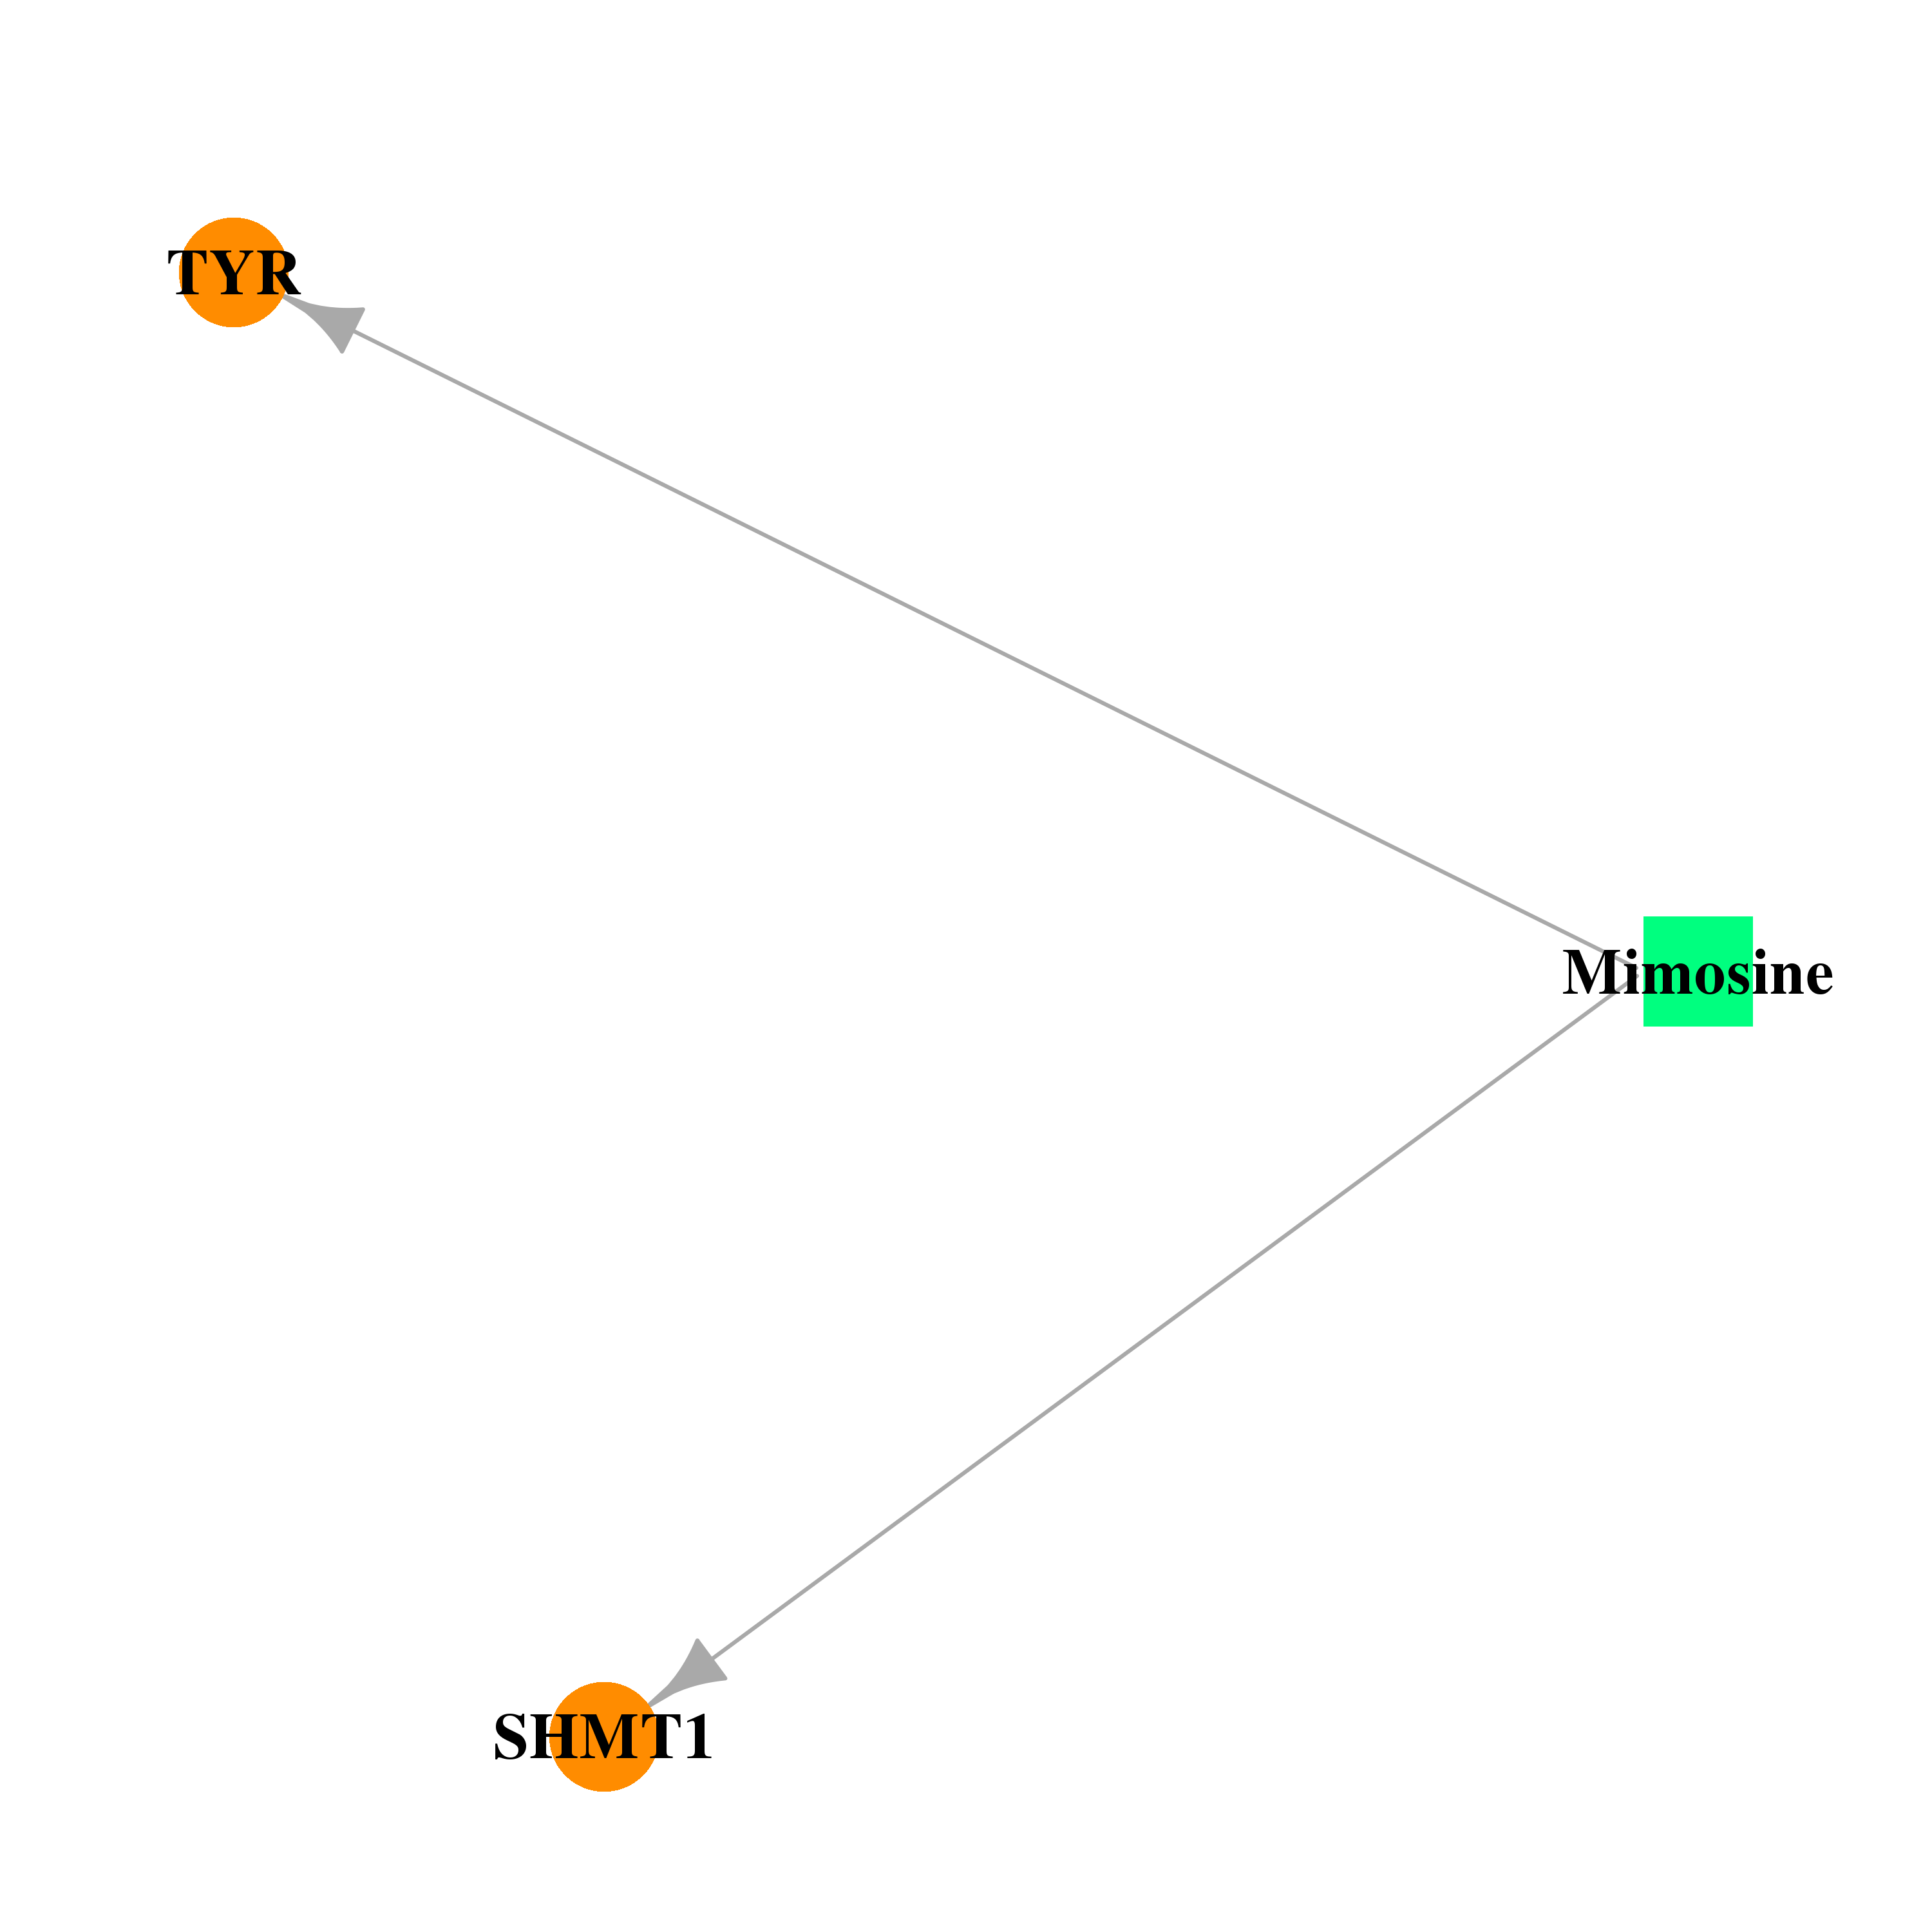 | 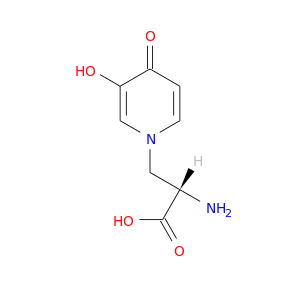 |
| DB02067 | serine hydroxymethyltransferase 1 (soluble) | experimental | Triglu-5-Formyl-Tetrahydrofolate |  | 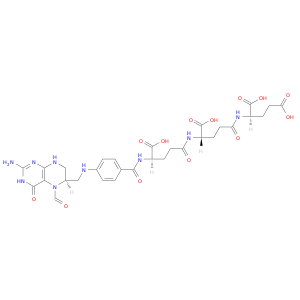 |
| DB02800 | serine hydroxymethyltransferase 1 (soluble) | experimental | 5-Hydroxymethylene-6-Hydrofolic Acid |  | 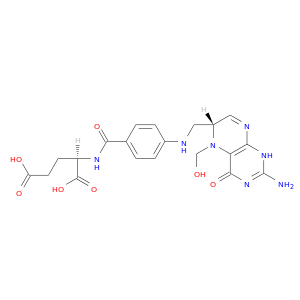 |
| DB02824 | serine hydroxymethyltransferase 1 (soluble) | experimental | N-Pyridoxyl-Glycine-5-Monophosphate | 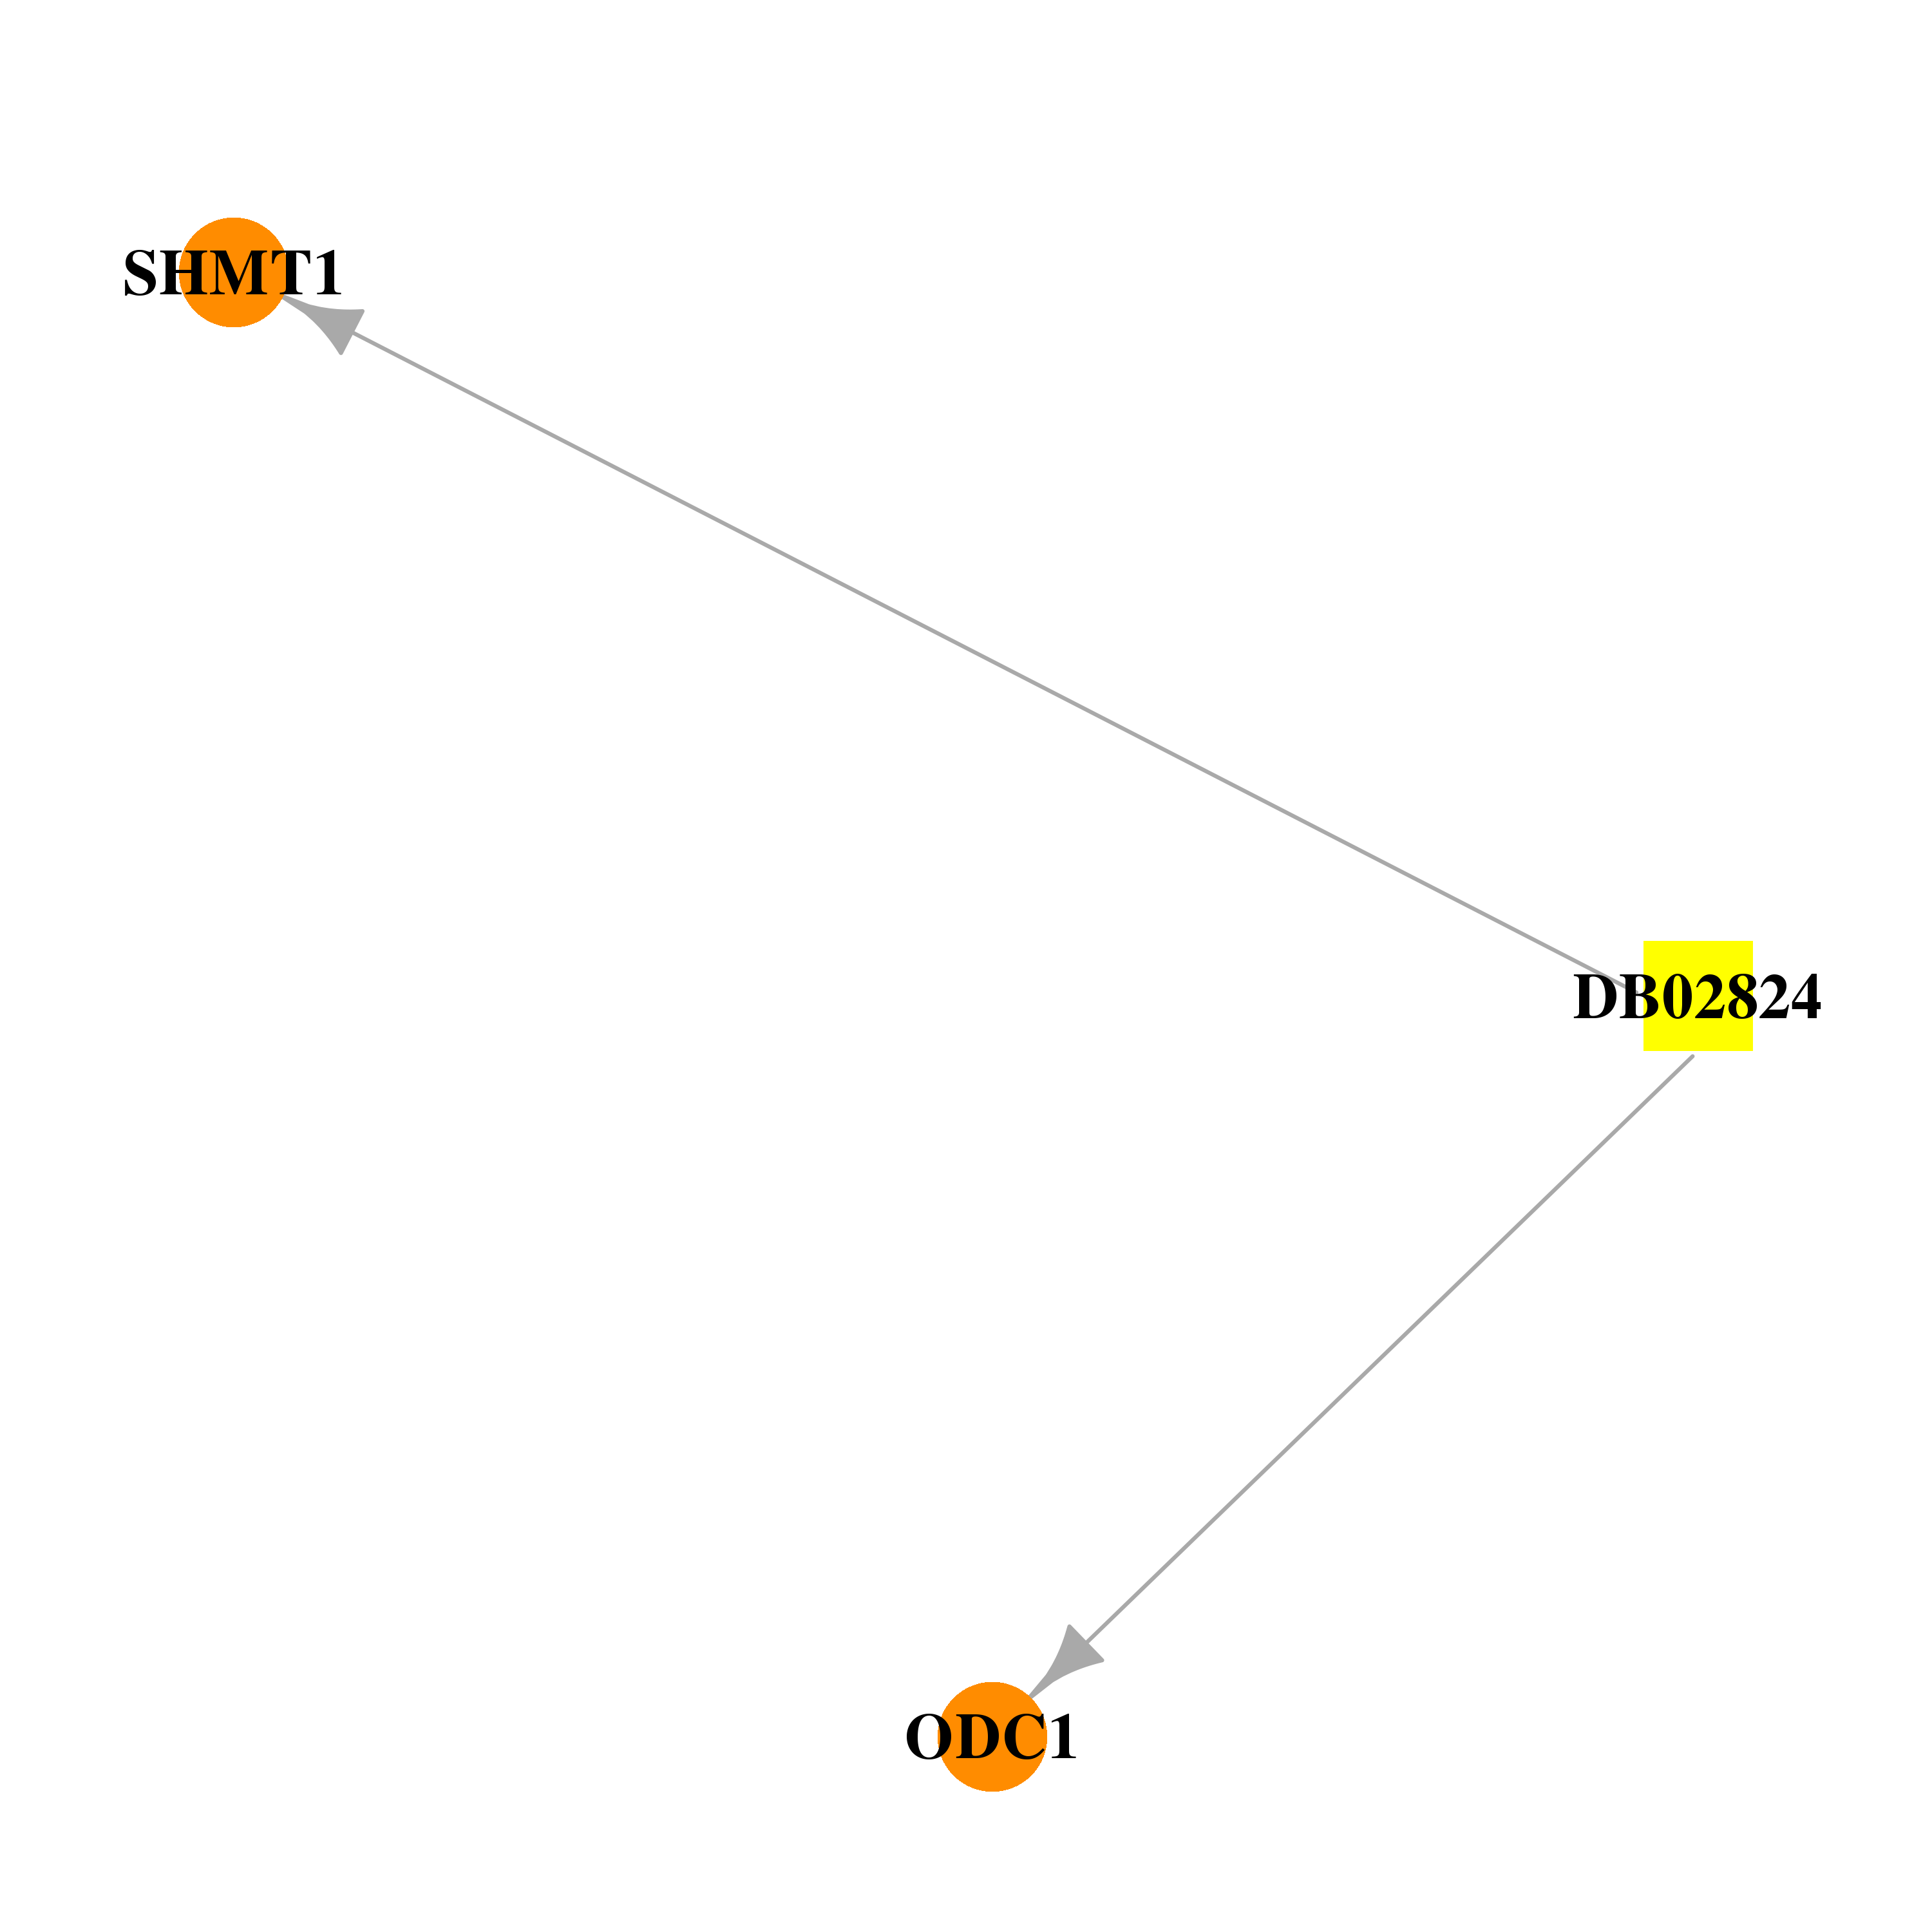 | 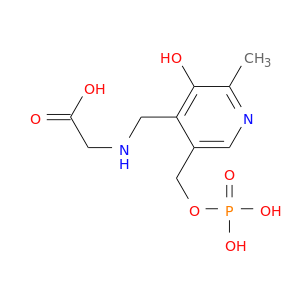 |
| DB00515 | serine hydroxymethyltransferase 1 (soluble) | approved | Cisplatin |  |  |
| DB00531 | serine hydroxymethyltransferase 1 (soluble) | approved; investigational | Cyclophosphamide | 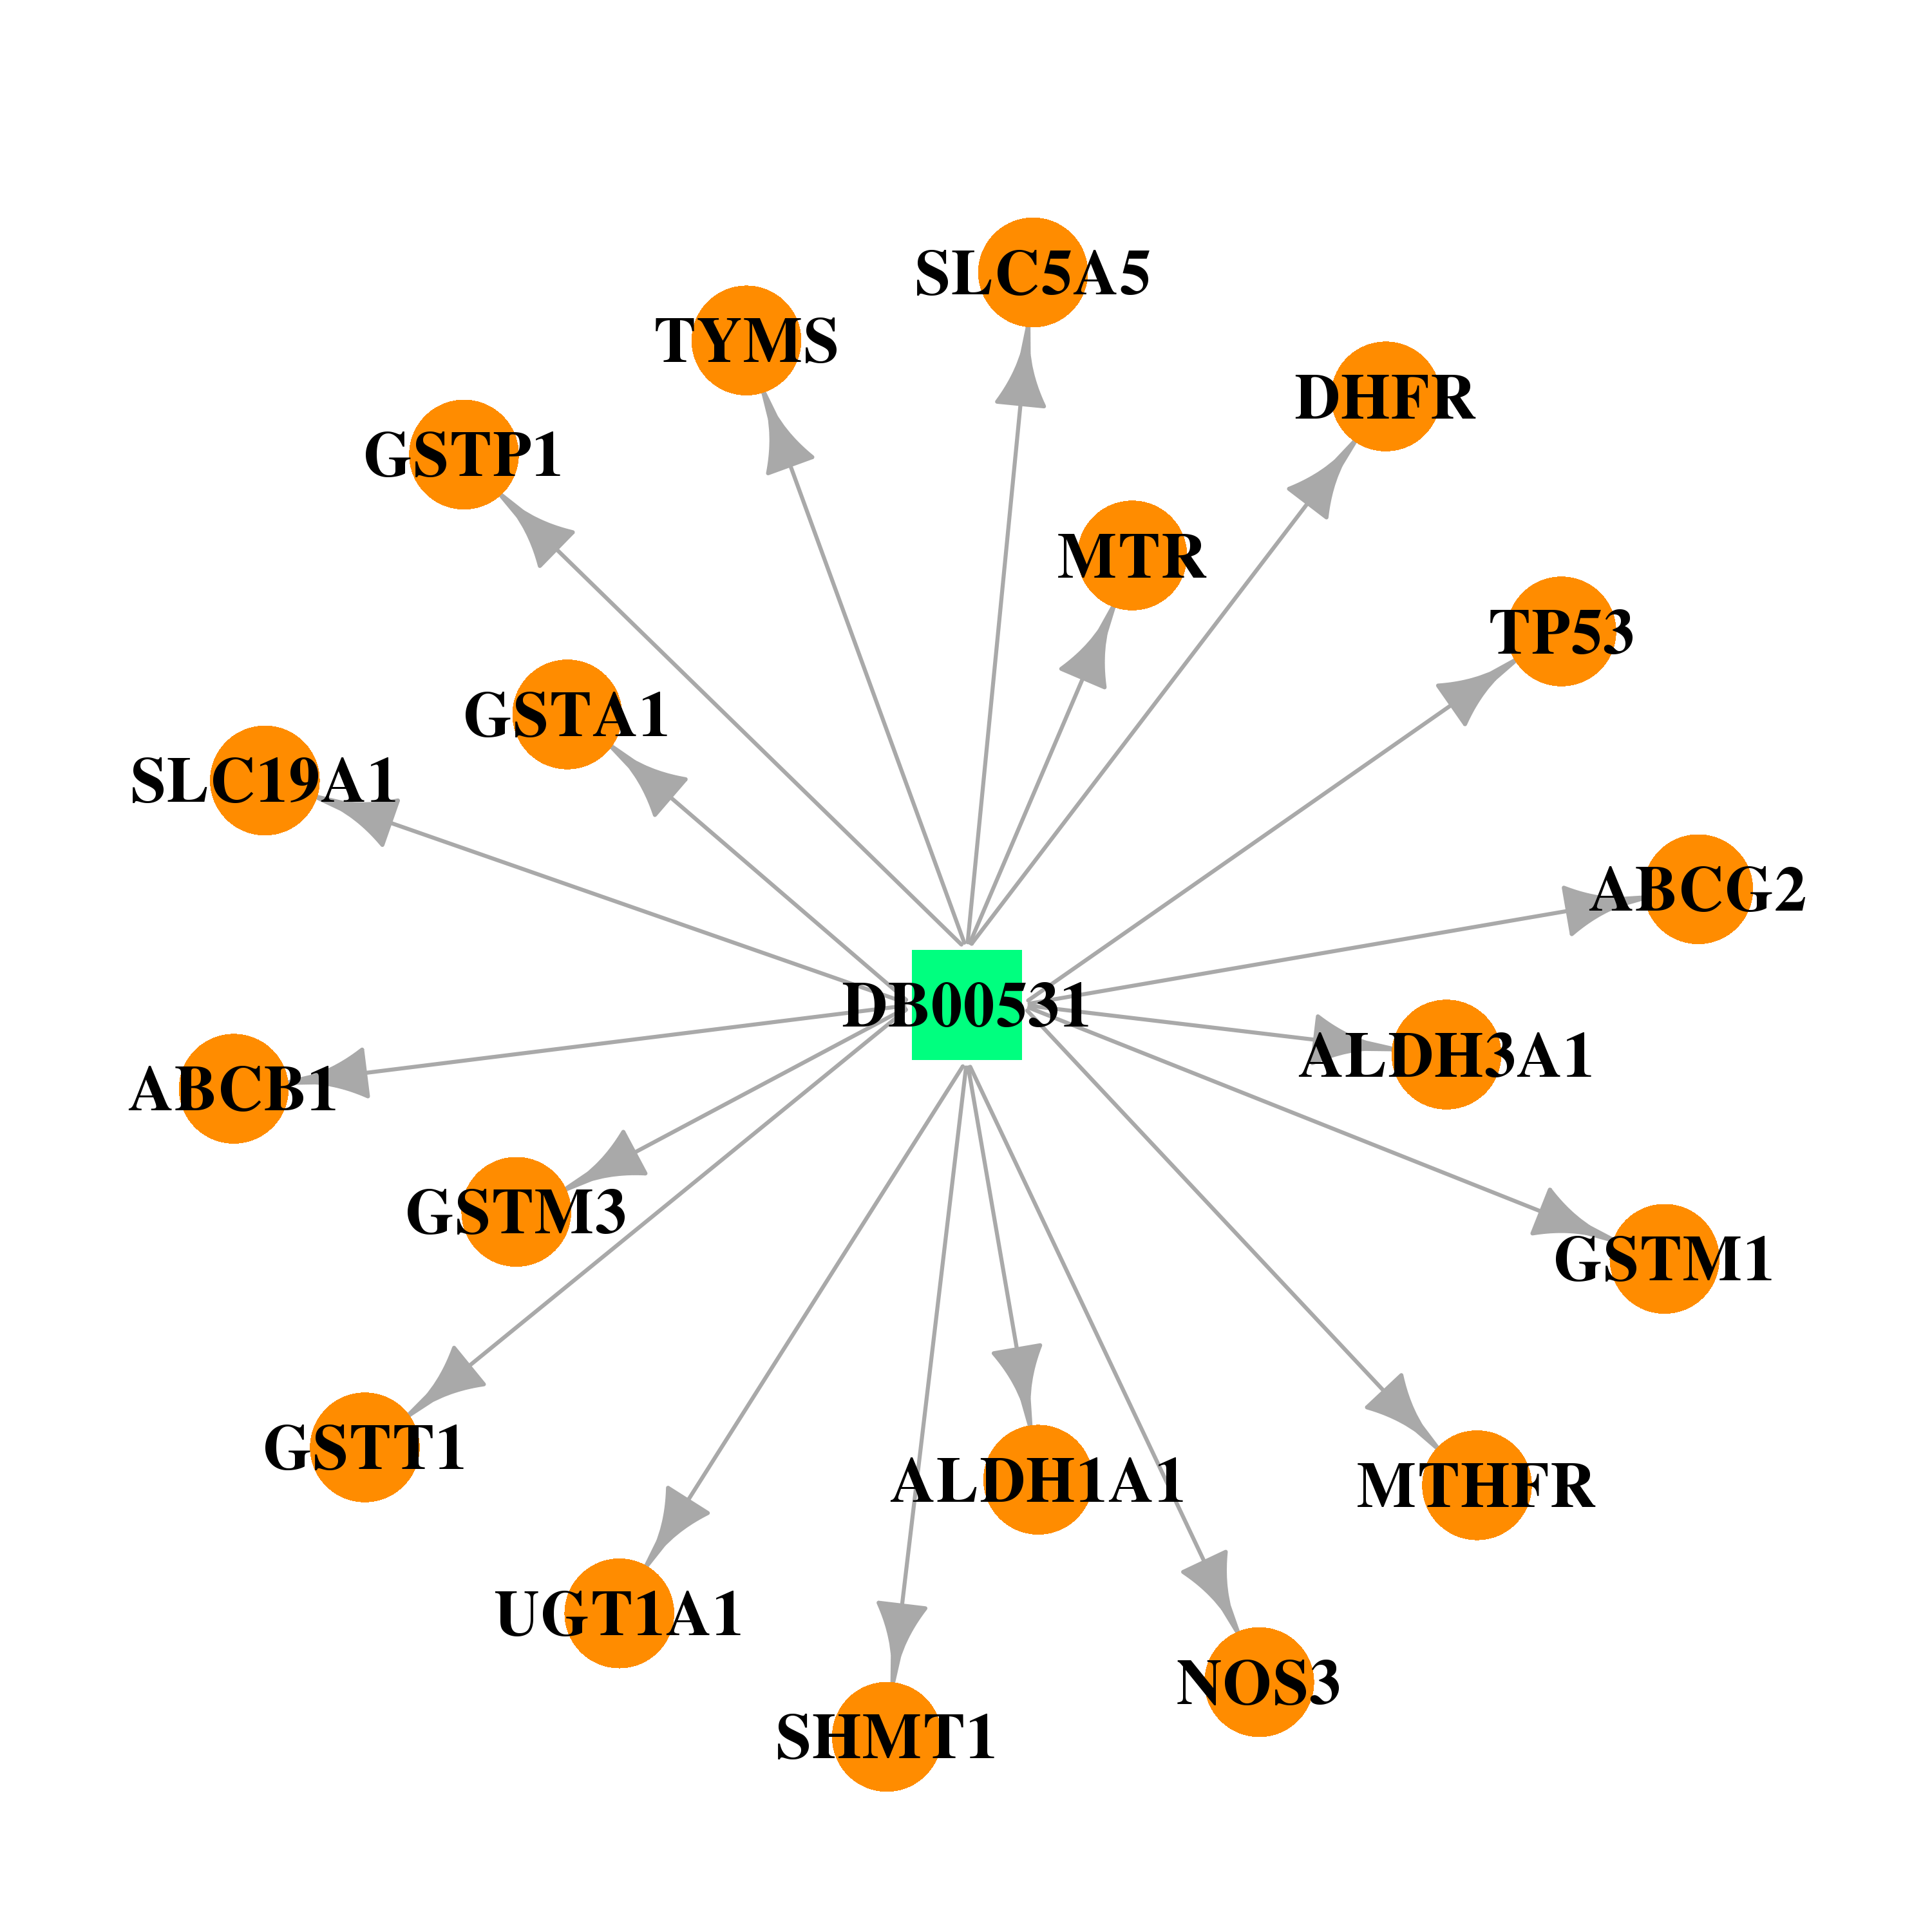 | 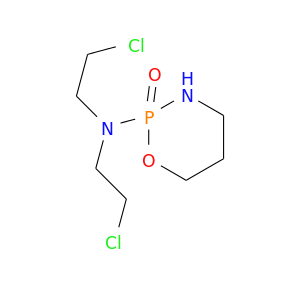 |
| DB00970 | serine hydroxymethyltransferase 1 (soluble) | approved | Dactinomycin | 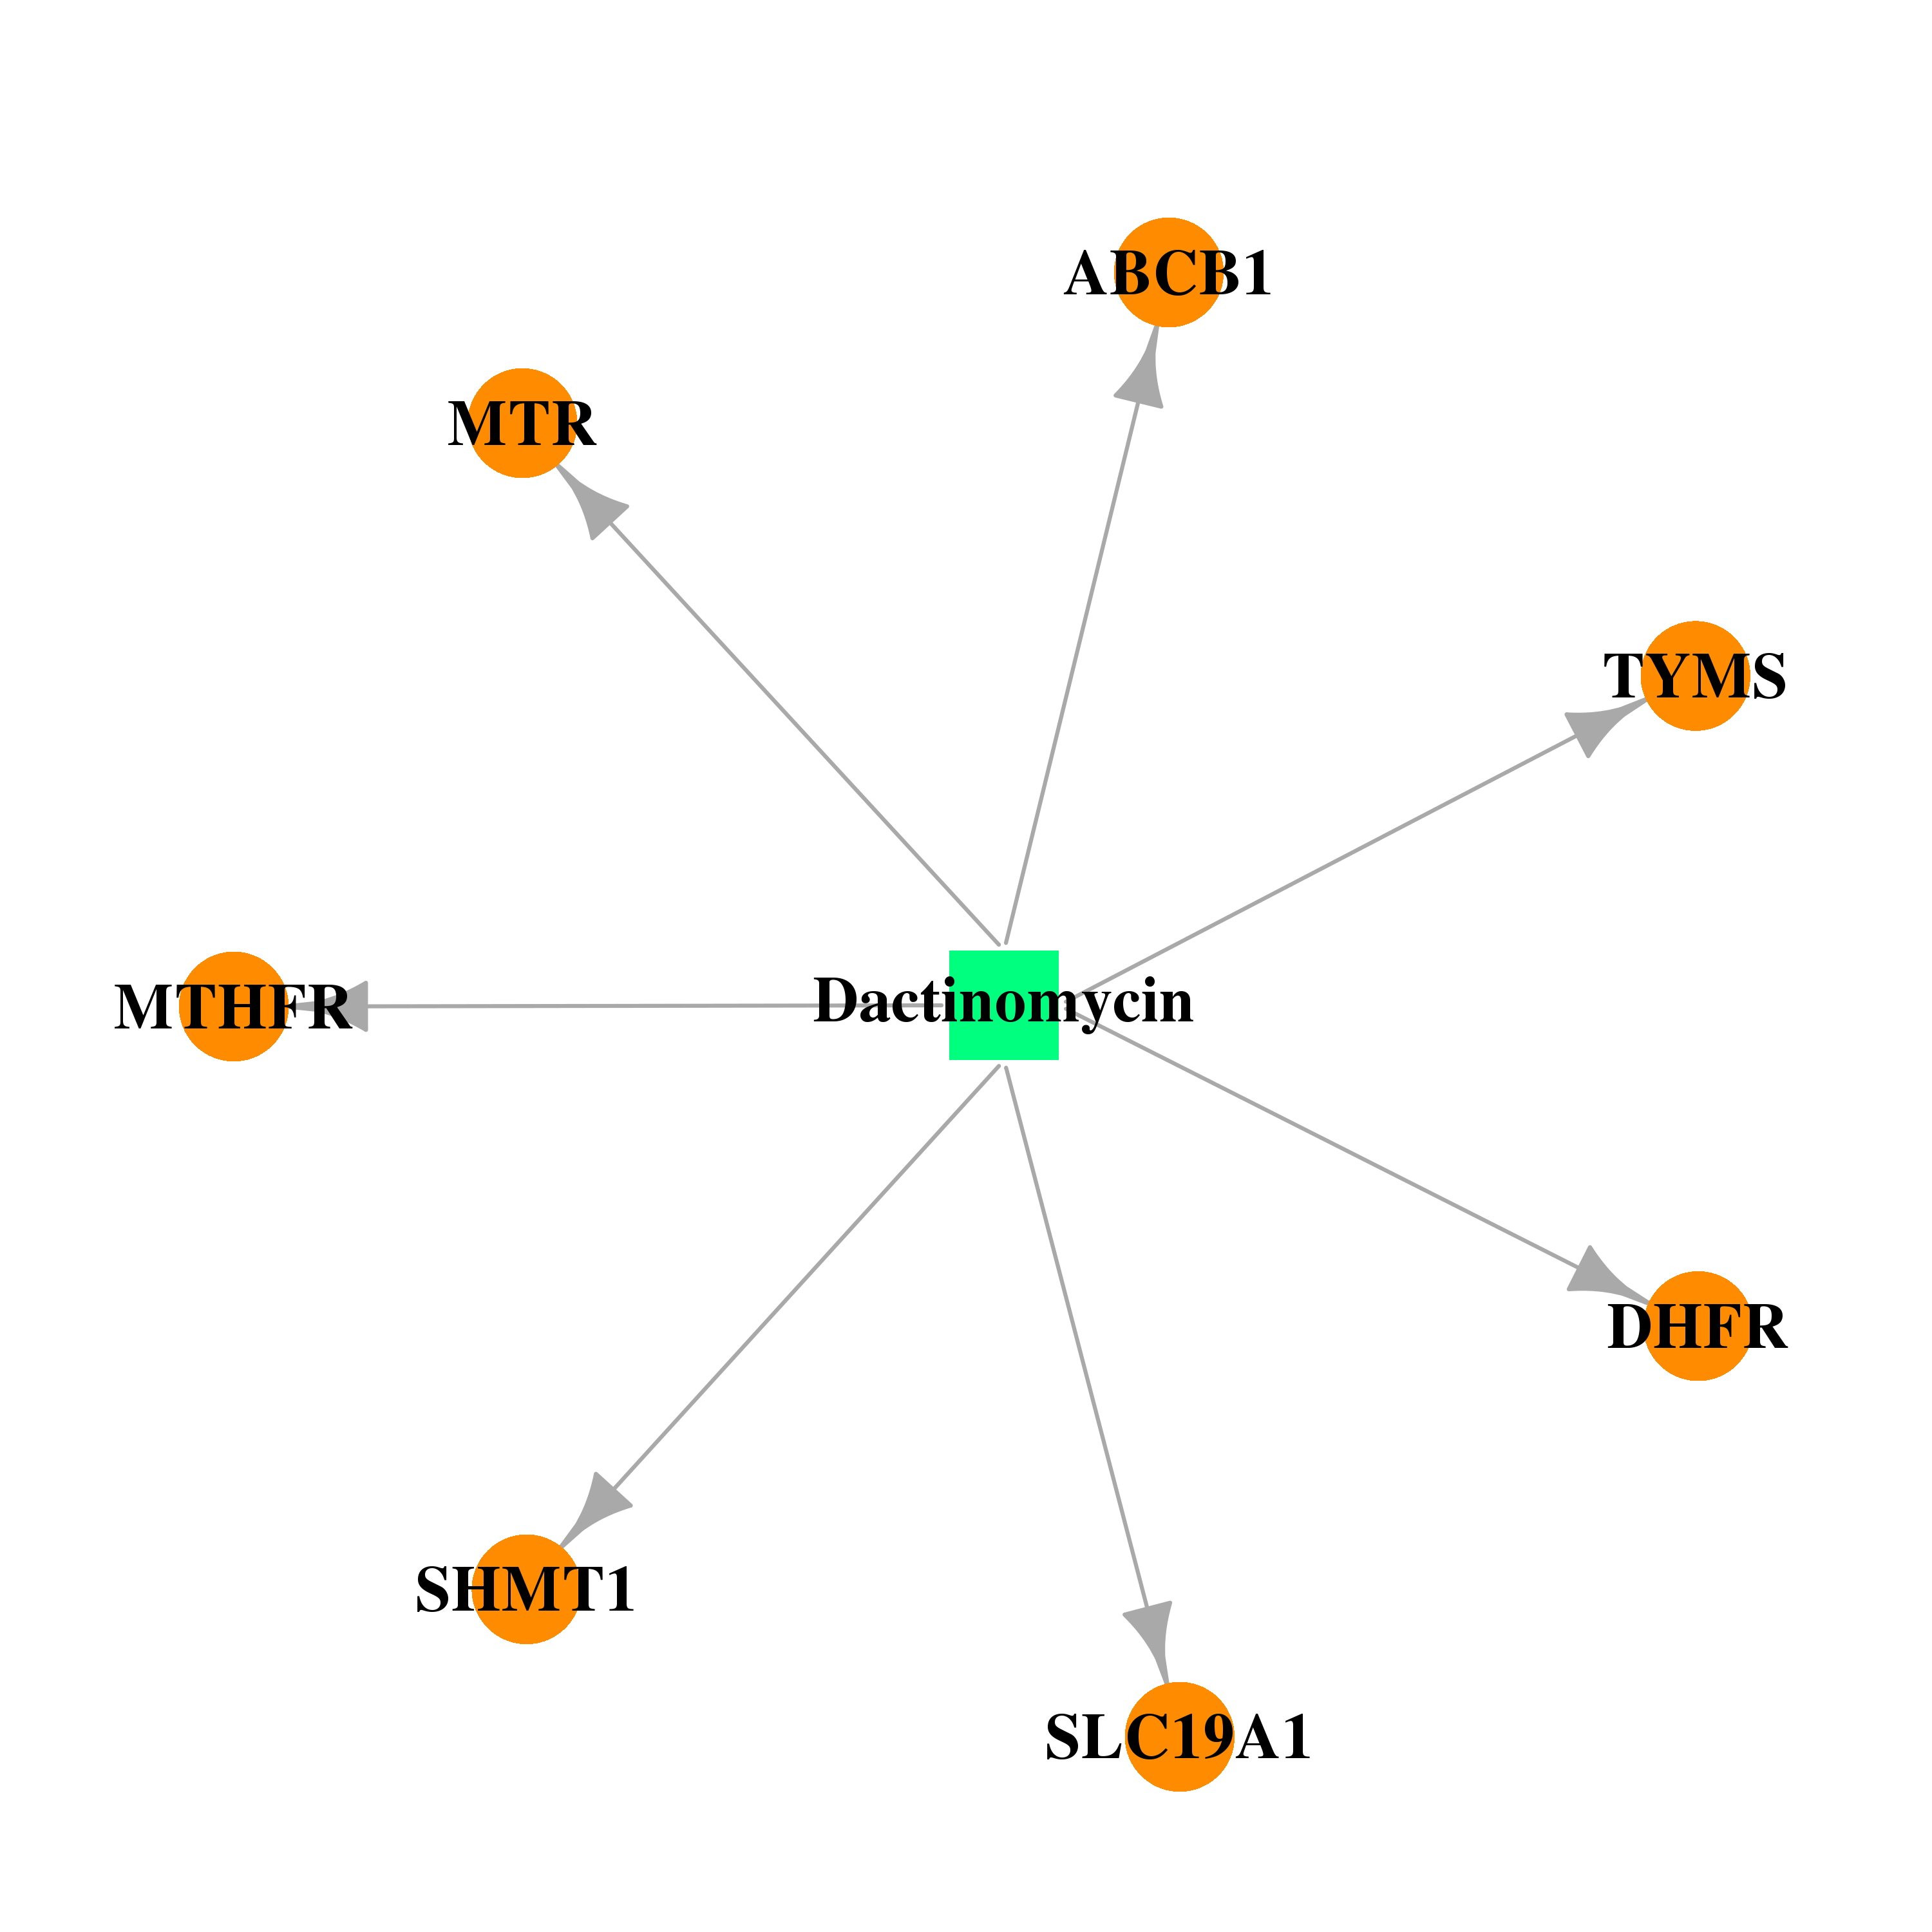 | 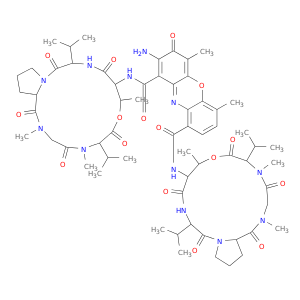 |
| DB00997 | serine hydroxymethyltransferase 1 (soluble) | approved; investigational | Doxorubicin | 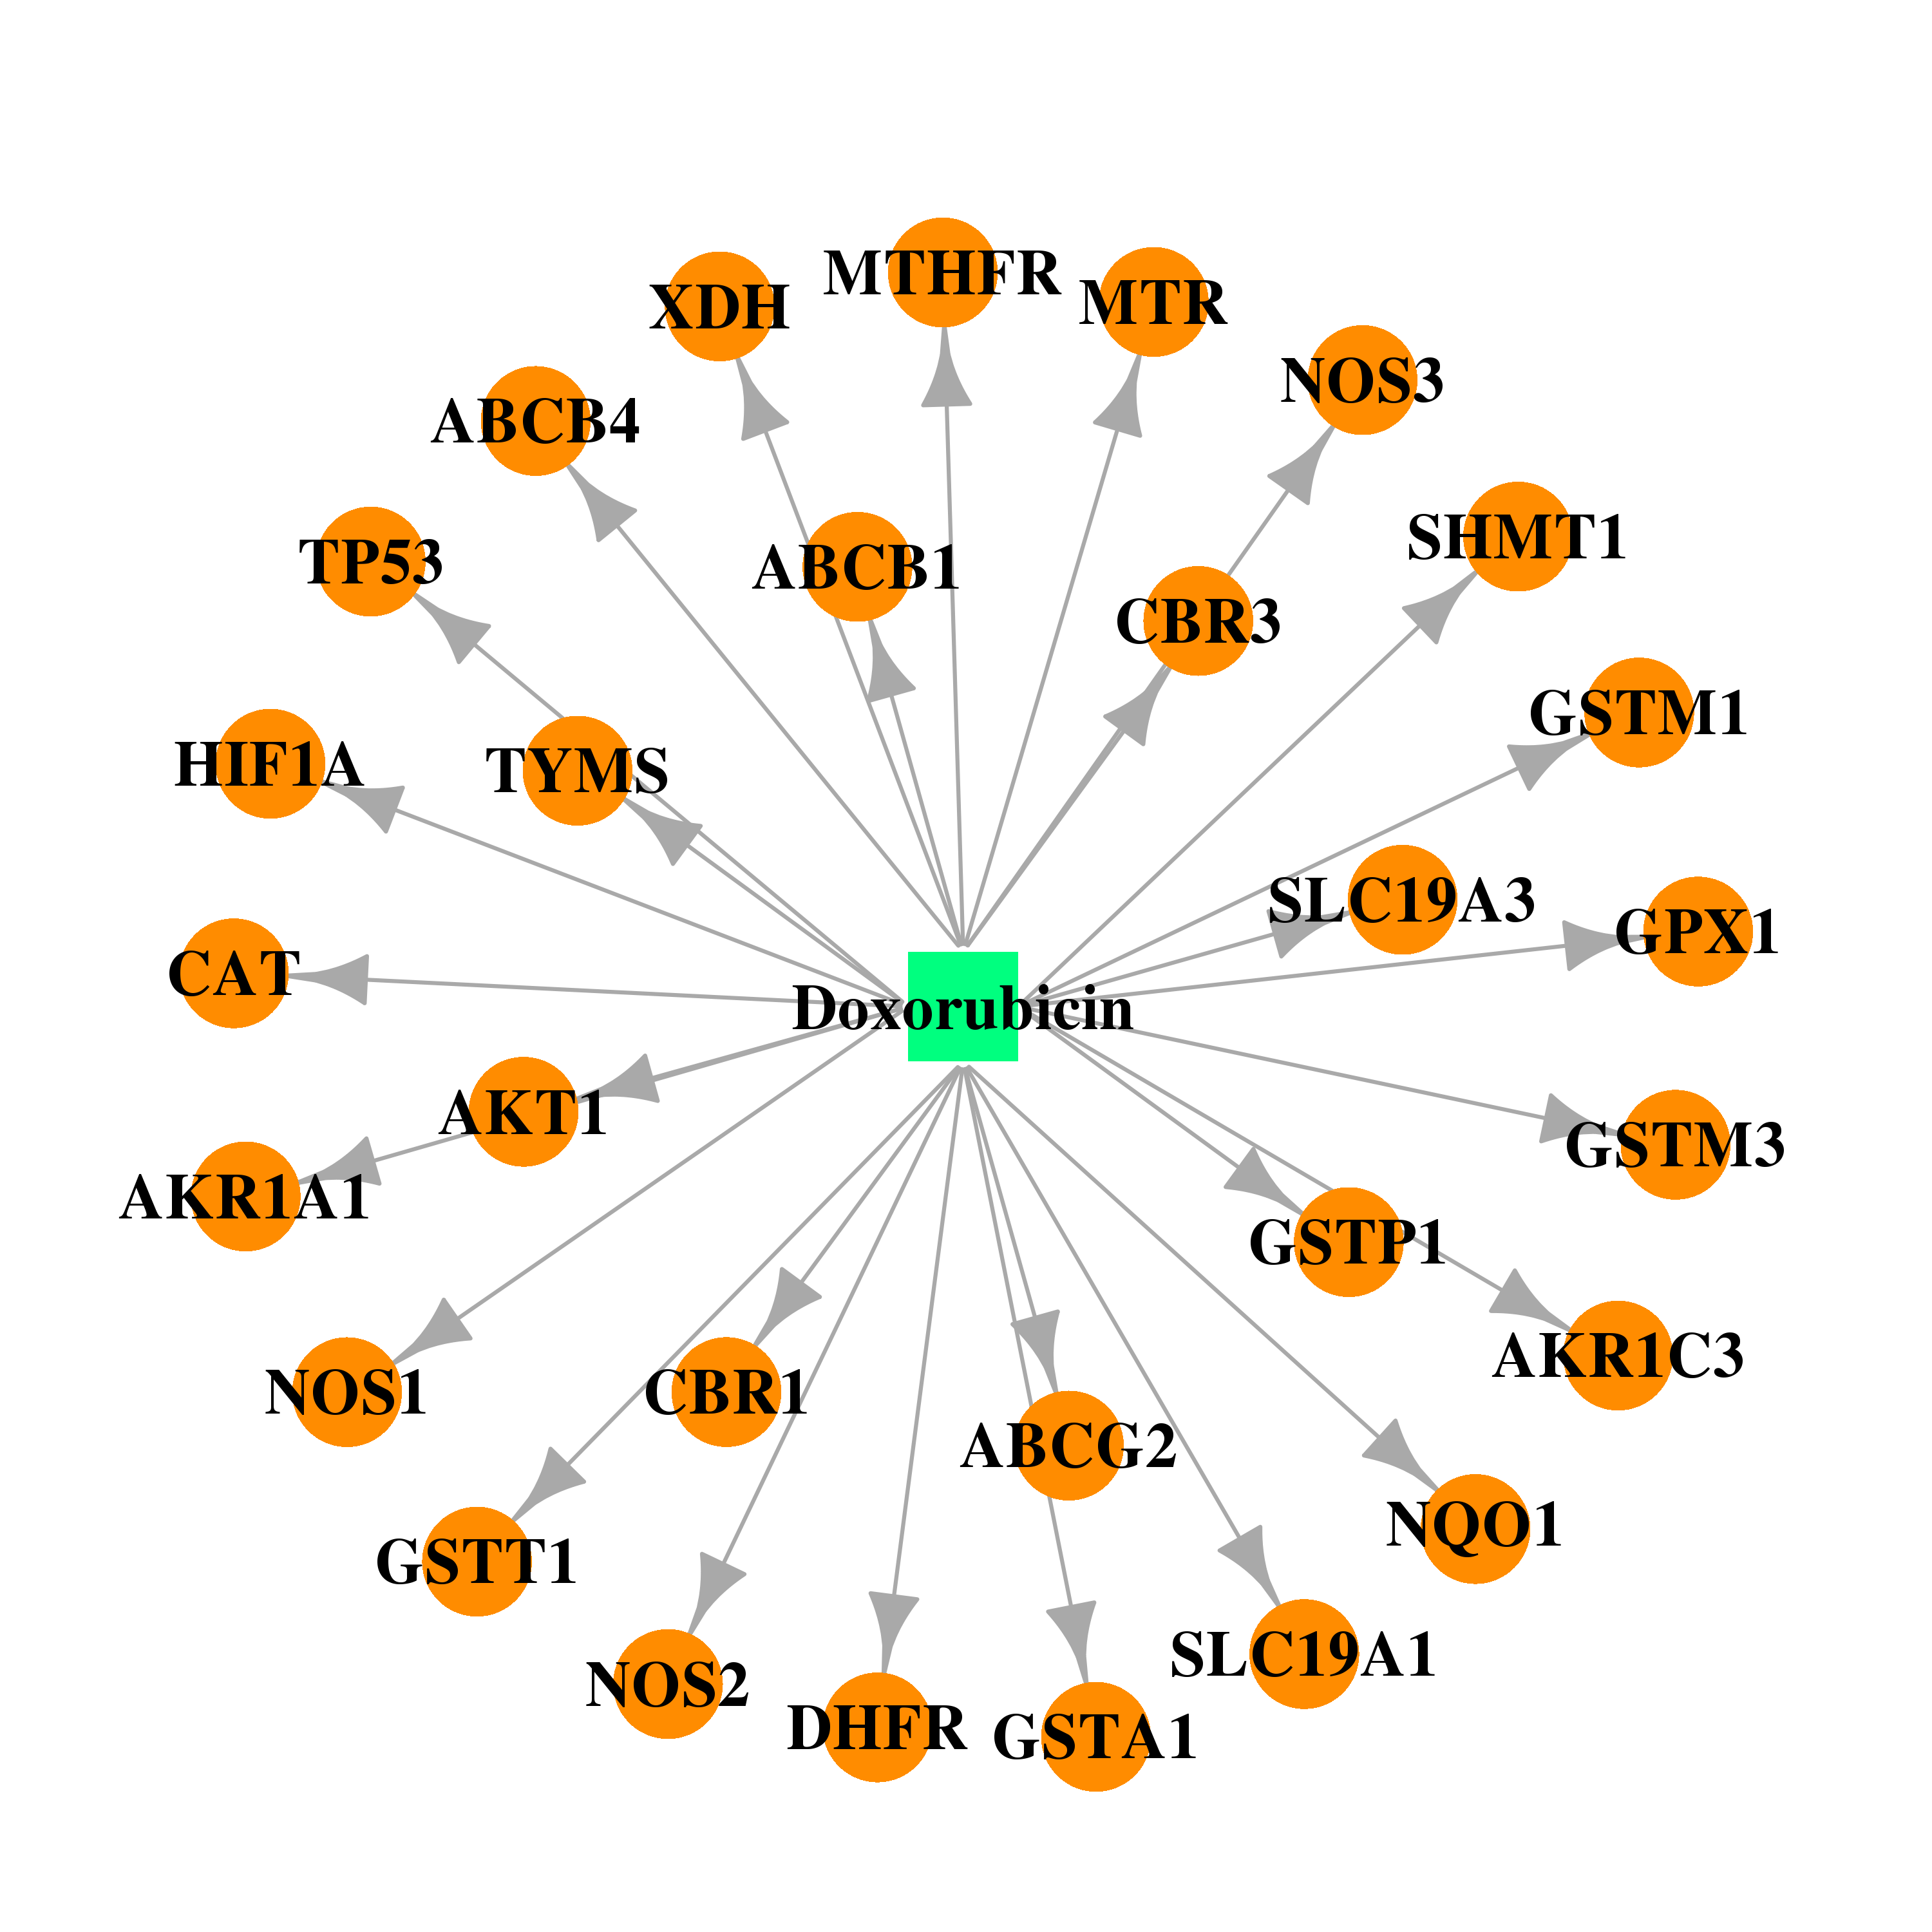 | 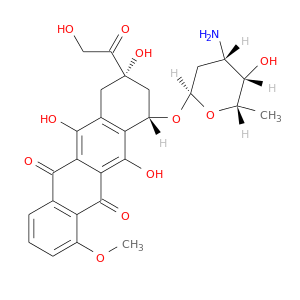 |
| DB00541 | serine hydroxymethyltransferase 1 (soluble) | approved; investigational | Vincristine | 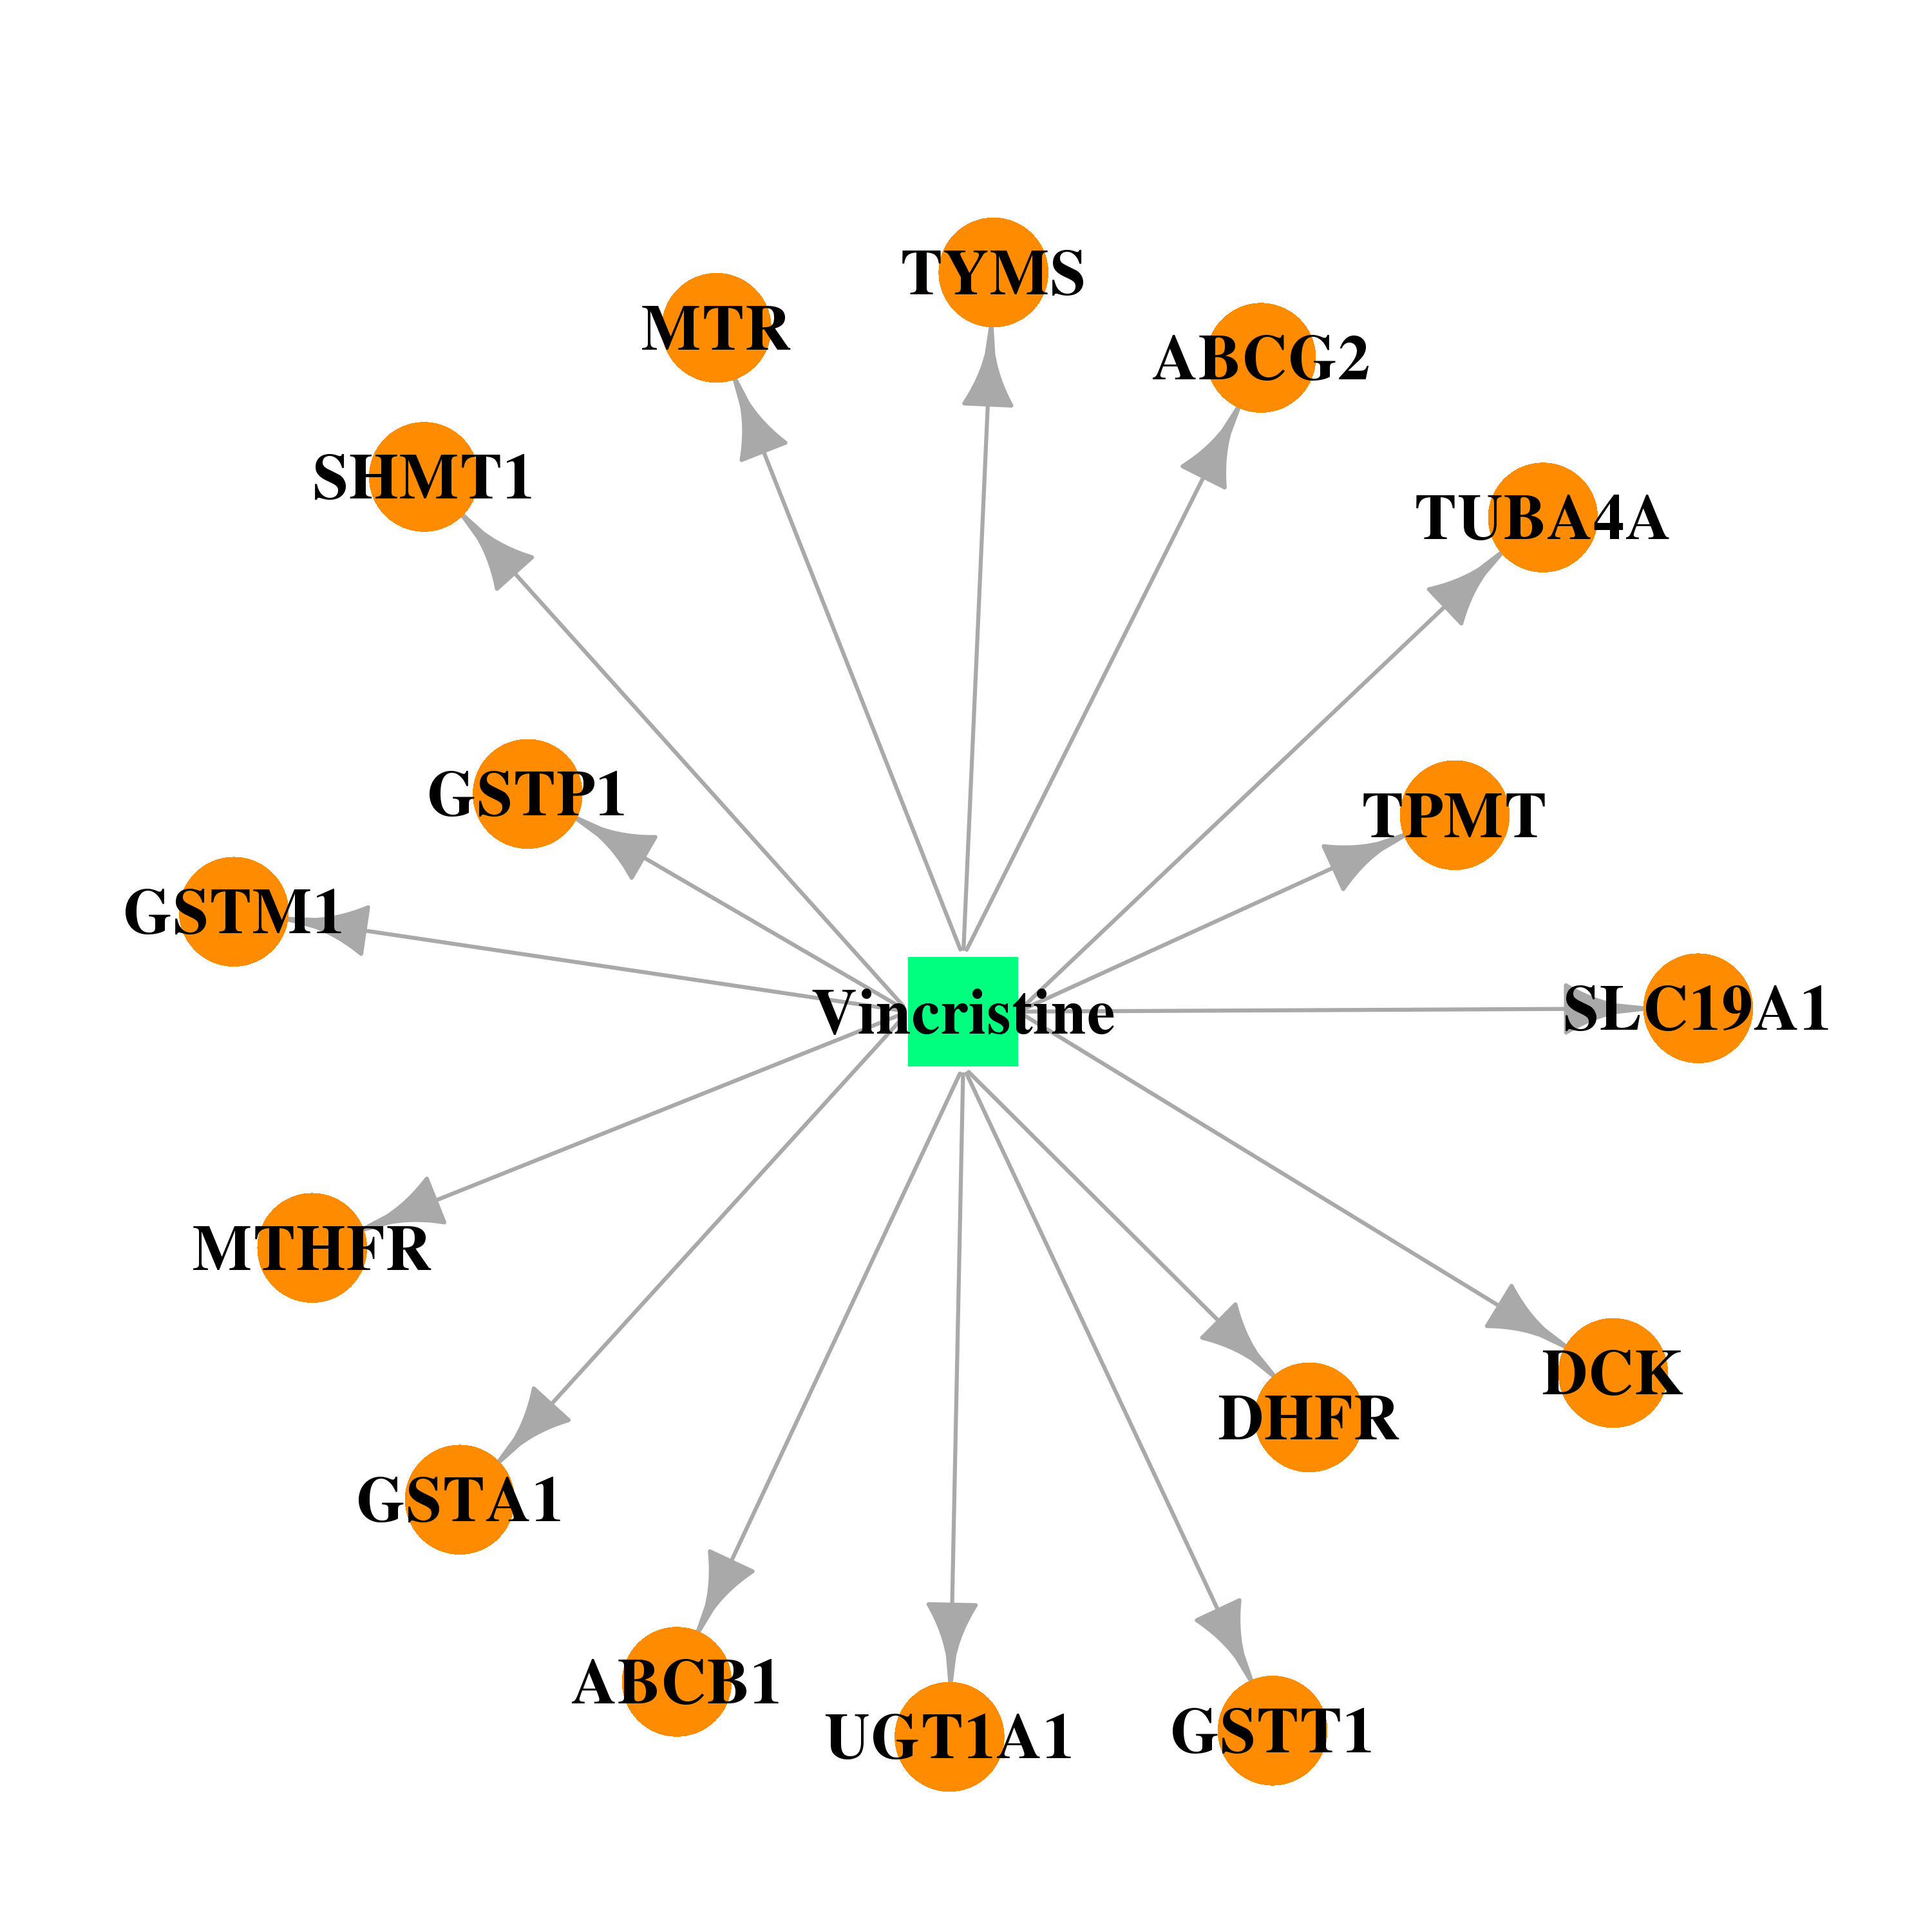 | 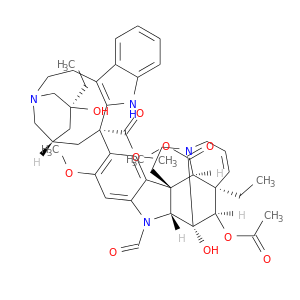 |
| DB00133 | serine hydroxymethyltransferase 1 (soluble) | approved; nutraceutical | L-Serine | 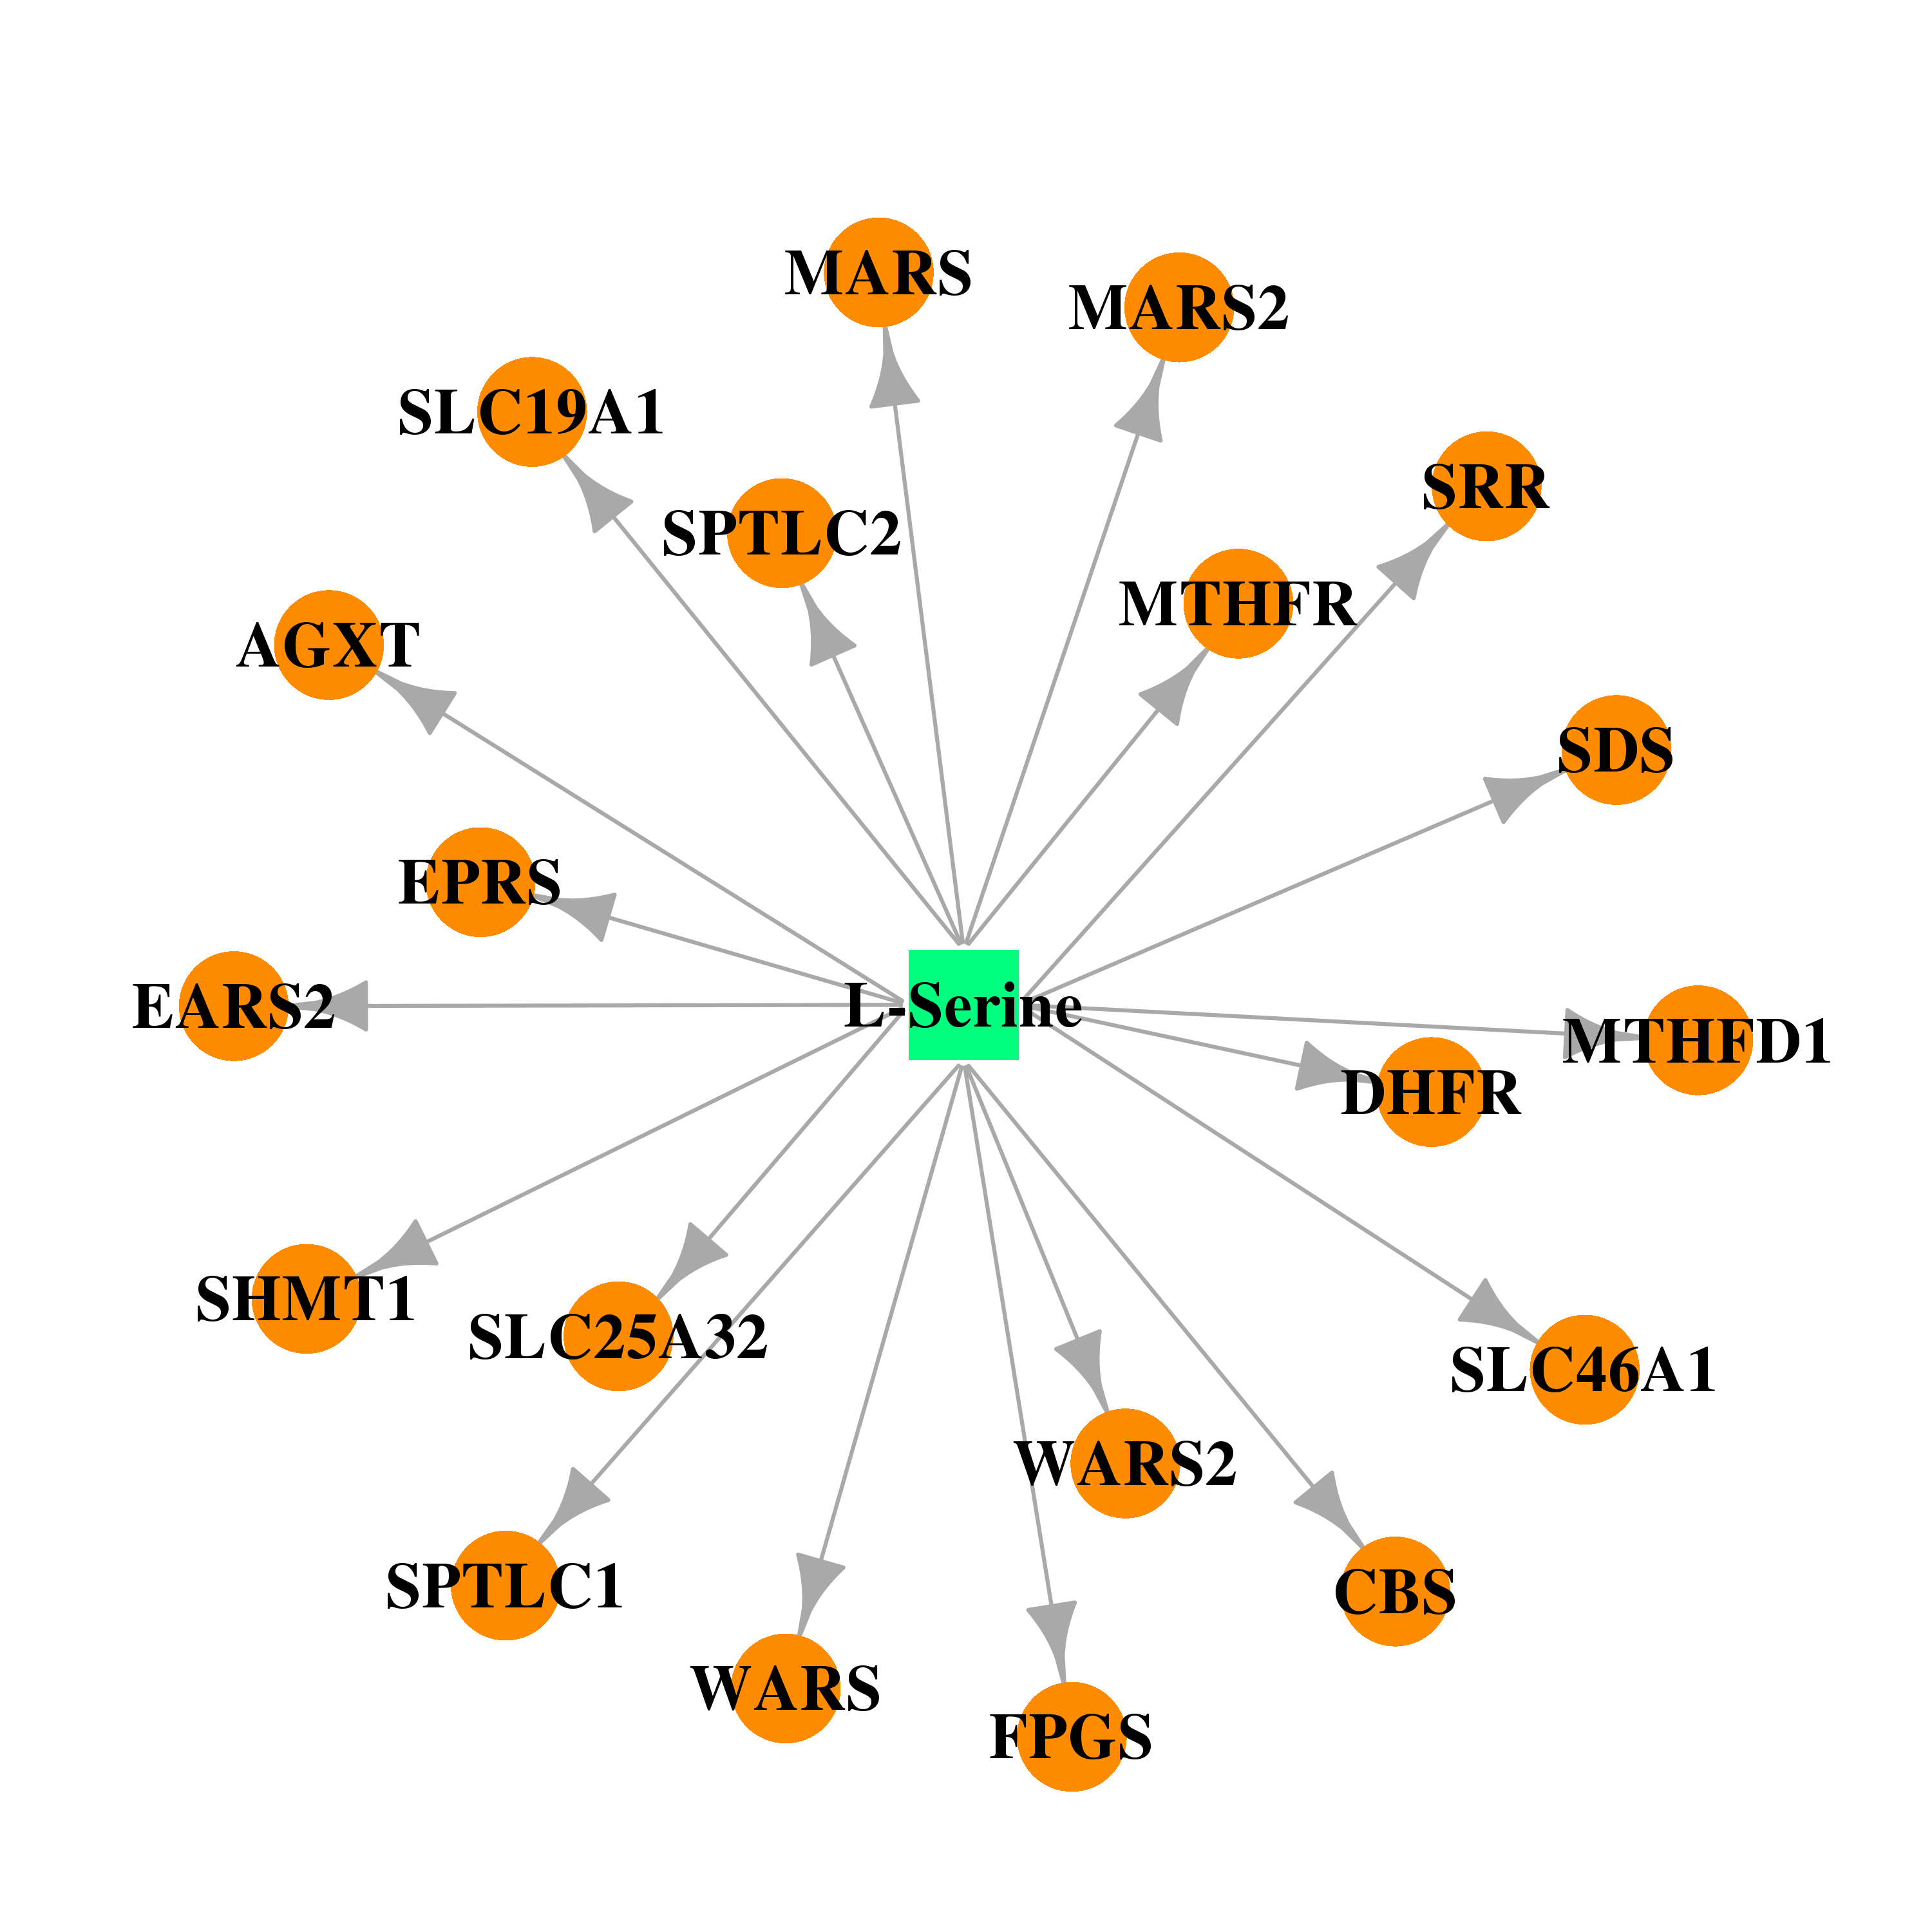 | 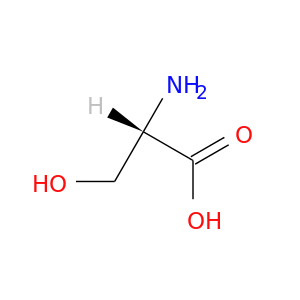 |
| DB00563 | serine hydroxymethyltransferase 1 (soluble) | approved | Methotrexate |  |  |
| DB00115 | serine hydroxymethyltransferase 1 (soluble) | approved; nutraceutical | Cyanocobalamin |  |  |
| DB00158 | serine hydroxymethyltransferase 1 (soluble) | approved; nutraceutical | Folic Acid | 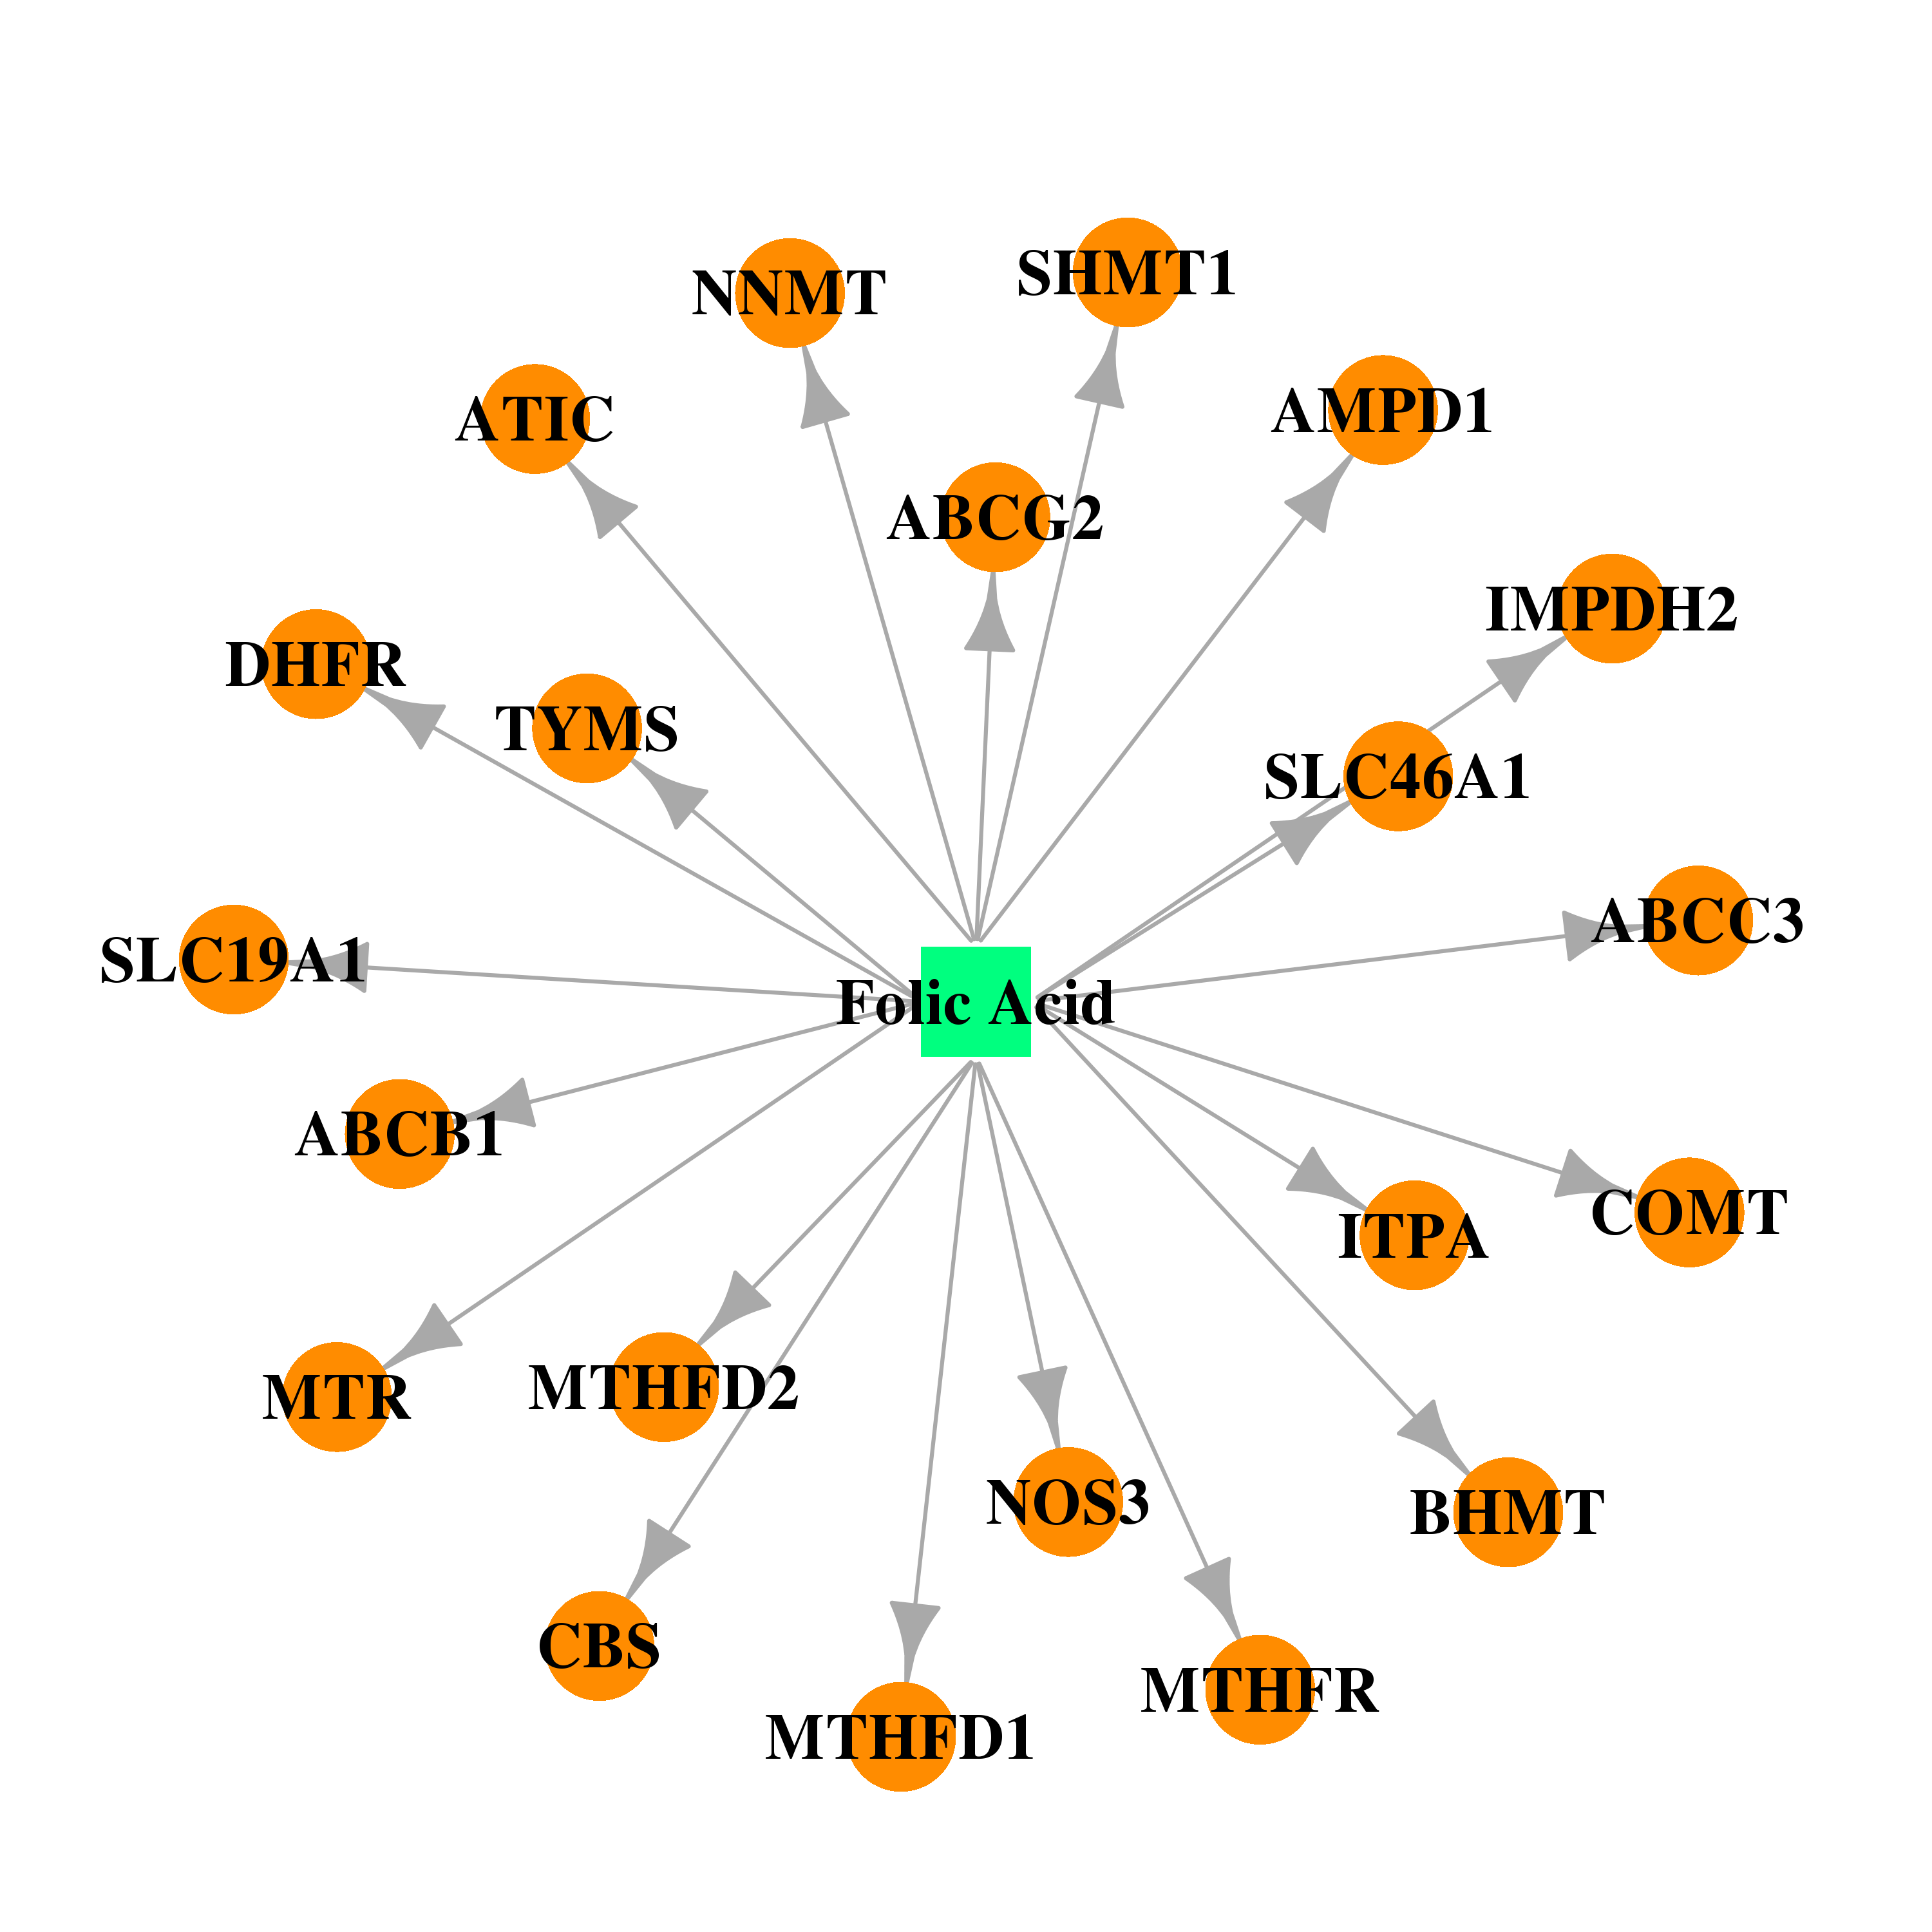 |  |
| Top |
| Cross referenced IDs for SHMT1 |
| * We obtained these cross-references from Uniprot database. It covers 150 different DBs, 18 categories. http://www.uniprot.org/help/cross_references_section |
: Open all cross reference information
|
Copyright © 2016-Present - The Univsersity of Texas Health Science Center at Houston @ |