|
||||||||||||||||||||
| |
| Phenotypic Information (metabolism pathway, cancer, disease, phenome) |
| |
| |
| Gene-Gene Network Information: Co-Expression Network, Interacting Genes & KEGG |
| |
|


| Gene Summary for SMN1 |
| Basic gene info. | Gene symbol | SMN1 |
| Gene name | survival of motor neuron 1, telomeric | |
| Synonyms | BCD541|GEMIN1|SMA|SMA1|SMA2|SMA3|SMA4|SMA@|SMN|SMNT|T-BCD541|TDRD16A | |
| Cytomap | UCSC genome browser: 5q13.2 | |
| Genomic location | chr5 :70220767-70248838 | |
| Type of gene | protein-coding | |
| RefGenes | NM_000344.3, NM_001297715.1,NM_022874.2, | |
| Ensembl id | ENSG00000172062 | |
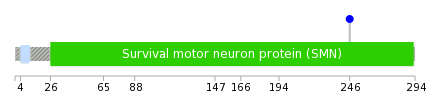
| Description | component of gems 1gemin-1survival motor neuron 1 proteinsurvival motor neuron proteintudor domain containing 16A | |
| Modification date | 20141219 | |
| dbXrefs | MIM : 600354 | |
| HGNC : HGNC | ||
| Ensembl : ENSG00000172062 | ||
| HPRD : 02646 | ||
| Vega : OTTHUMG00000099361 | ||
| Protein | UniProt: Q16637 go to UniProt's Cross Reference DB Table | |
| Expression | CleanEX: HS_SMN1 | |
| BioGPS: 6606 | ||
| Gene Expression Atlas: ENSG00000172062 | ||
| The Human Protein Atlas: ENSG00000172062 | ||
| Pathway | NCI Pathway Interaction Database: SMN1 | |
| KEGG: SMN1 | ||
| REACTOME: SMN1 | ||
| ConsensusPathDB | ||
| Pathway Commons: SMN1 | ||
| Metabolism | MetaCyc: SMN1 | |
| HUMANCyc: SMN1 | ||
| Regulation | Ensembl's Regulation: ENSG00000172062 | |
| miRBase: chr5 :70,220,767-70,248,838 | ||
| TargetScan: NM_000344 | ||
| cisRED: ENSG00000172062 | ||
| Context | iHOP: SMN1 | |
| cancer metabolism search in PubMed: SMN1 | ||
| UCL Cancer Institute: SMN1 | ||
| Assigned class in ccmGDB | B - This gene belongs to cancer gene. | |
| Top |
| Phenotypic Information for SMN1(metabolism pathway, cancer, disease, phenome) |
| Cancer | CGAP: SMN1 |
| Familial Cancer Database: SMN1 | |
| * This gene is included in those cancer gene databases. |
|
|
|
|
|
| . | ||||||||||||||
Oncogene 1 | Significant driver gene in | |||||||||||||||||||
| cf) number; DB name 1 Oncogene; http://nar.oxfordjournals.org/content/35/suppl_1/D721.long, 2 Tumor Suppressor gene; https://bioinfo.uth.edu/TSGene/, 3 Cancer Gene Census; http://www.nature.com/nrc/journal/v4/n3/abs/nrc1299.html, 4 CancerGenes; http://nar.oxfordjournals.org/content/35/suppl_1/D721.long, 5 Network of Cancer Gene; http://ncg.kcl.ac.uk/index.php, 1Therapeutic Vulnerabilities in Cancer; http://cbio.mskcc.org/cancergenomics/statius/ |
| REACTOME_METABOLISM_OF_NON_CODING_RNA REACTOME_METABOLISM_OF_RNA | |
| OMIM | 253300; phenotype. 253400; phenotype. 253550; phenotype. 271150; phenotype. 600354; gene. 601627; gene. |
| Orphanet | 83330; Proximal spinal muscular atrophy type 1. 83418; Proximal spinal muscular atrophy type 2. 83419; Proximal spinal muscular atrophy type 3. 83420; Proximal spinal muscular atrophy type 4. |
| Disease | KEGG Disease: SMN1 |
| MedGen: SMN1 (Human Medical Genetics with Condition) | |
| ClinVar: SMN1 | |
| Phenotype | MGI: SMN1 (International Mouse Phenotyping Consortium) |
| PhenomicDB: SMN1 | |
| Mutations for SMN1 |
| * Under tables are showing count per each tissue to give us broad intuition about tissue specific mutation patterns.You can go to the detailed page for each mutation database's web site. |
| - Statistics for Tissue and Mutation type | Top |
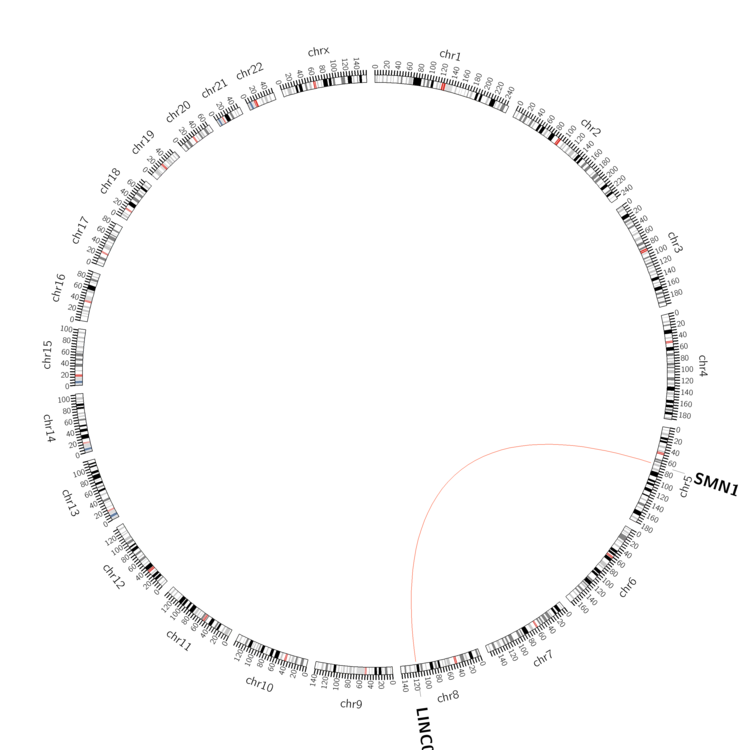 |
| - For Inter-chromosomal Variations |
| * Inter-chromosomal variantions includes 'interchromosomal amplicon to amplicon', 'interchromosomal amplicon to non-amplified dna', 'interchromosomal insertion', 'Interchromosomal unknown type'. |
 |
| - For Intra-chromosomal Variations |
| There's no intra-chromosomal structural variation. |
| Sample | Symbol_a | Chr_a | Start_a | End_a | Symbol_b | Chr_b | Start_b | End_b |
| pancreas | SMN1 | chr5 | 70241400 | 70241420 | LINC00536 | chr8 | 117234746 | 117234766 |
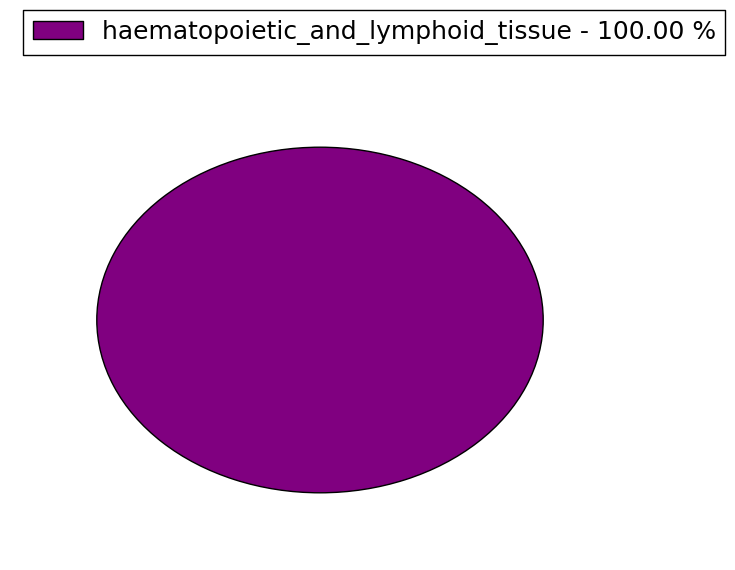
| cf) Tissue number; Tissue name (1;Breast, 2;Central_nervous_system, 3;Haematopoietic_and_lymphoid_tissue, 4;Large_intestine, 5;Liver, 6;Lung, 7;Ovary, 8;Pancreas, 9;Prostate, 10;Skin, 11;Soft_tissue, 12;Upper_aerodigestive_tract) |
| * From mRNA Sanger sequences, Chitars2.0 arranged chimeric transcripts. This table shows SMN1 related fusion information. |
| ID | Head Gene | Tail Gene | Accession | Gene_a | qStart_a | qEnd_a | Chromosome_a | tStart_a | tEnd_a | Gene_a | qStart_a | qEnd_a | Chromosome_a | tStart_a | tEnd_a |
| Top |
| There's no copy number variation information in COSMIC data for this gene. |
| Top |
|
 |
| Top |
| Stat. for Non-Synonymous SNVs (# total SNVs=0) | (# total SNVs=1) |
 | |
(# total SNVs=0) | (# total SNVs=0) |
| Top |
| * When you move the cursor on each content, you can see more deailed mutation information on the Tooltip. Those are primary_site,primary_histology,mutation(aa),pubmedID. |
| GRCh37 position | Mutation(aa) | Unique sampleID count |
| chr5:70241907-70241907 | p.P246P | 1 |
| Top |
|
 |
| Point Mutation/ Tissue ID | 1 | 2 | 3 | 4 | 5 | 6 | 7 | 8 | 9 | 10 | 11 | 12 | 13 | 14 | 15 | 16 | 17 | 18 | 19 | 20 |
| # sample | ||||||||||||||||||||
| # mutation | ||||||||||||||||||||
| nonsynonymous SNV | ||||||||||||||||||||
| synonymous SNV |
| cf) Tissue ID; Tissue type (1; BLCA[Bladder Urothelial Carcinoma], 2; BRCA[Breast invasive carcinoma], 3; CESC[Cervical squamous cell carcinoma and endocervical adenocarcinoma], 4; COAD[Colon adenocarcinoma], 5; GBM[Glioblastoma multiforme], 6; Glioma Low Grade, 7; HNSC[Head and Neck squamous cell carcinoma], 8; KICH[Kidney Chromophobe], 9; KIRC[Kidney renal clear cell carcinoma], 10; KIRP[Kidney renal papillary cell carcinoma], 11; LAML[Acute Myeloid Leukemia], 12; LUAD[Lung adenocarcinoma], 13; LUSC[Lung squamous cell carcinoma], 14; OV[Ovarian serous cystadenocarcinoma ], 15; PAAD[Pancreatic adenocarcinoma], 16; PRAD[Prostate adenocarcinoma], 17; SKCM[Skin Cutaneous Melanoma], 18:STAD[Stomach adenocarcinoma], 19:THCA[Thyroid carcinoma], 20:UCEC[Uterine Corpus Endometrial Carcinoma]) |
| Top |
| * We represented just top 10 SNVs. When you move the cursor on each content, you can see more deailed mutation information on the Tooltip. Those are primary_site, primary_histology, mutation(aa), pubmedID. |
| Genomic Position | Mutation(aa) | Unique sampleID count |
| * Copy number data were extracted from TCGA using R package TCGA-Assembler. The URLs of all public data files on TCGA DCC data server were gathered on Jan-05-2015. Function ProcessCNAData in TCGA-Assembler package was used to obtain gene-level copy number value which is calculated as the average copy number of the genomic region of a gene. |
 |
| cf) Tissue ID[Tissue type]: BLCA[Bladder Urothelial Carcinoma], BRCA[Breast invasive carcinoma], CESC[Cervical squamous cell carcinoma and endocervical adenocarcinoma], COAD[Colon adenocarcinoma], GBM[Glioblastoma multiforme], Glioma Low Grade, HNSC[Head and Neck squamous cell carcinoma], KICH[Kidney Chromophobe], KIRC[Kidney renal clear cell carcinoma], KIRP[Kidney renal papillary cell carcinoma], LAML[Acute Myeloid Leukemia], LUAD[Lung adenocarcinoma], LUSC[Lung squamous cell carcinoma], OV[Ovarian serous cystadenocarcinoma ], PAAD[Pancreatic adenocarcinoma], PRAD[Prostate adenocarcinoma], SKCM[Skin Cutaneous Melanoma], STAD[Stomach adenocarcinoma], THCA[Thyroid carcinoma], UCEC[Uterine Corpus Endometrial Carcinoma] |
| Top |
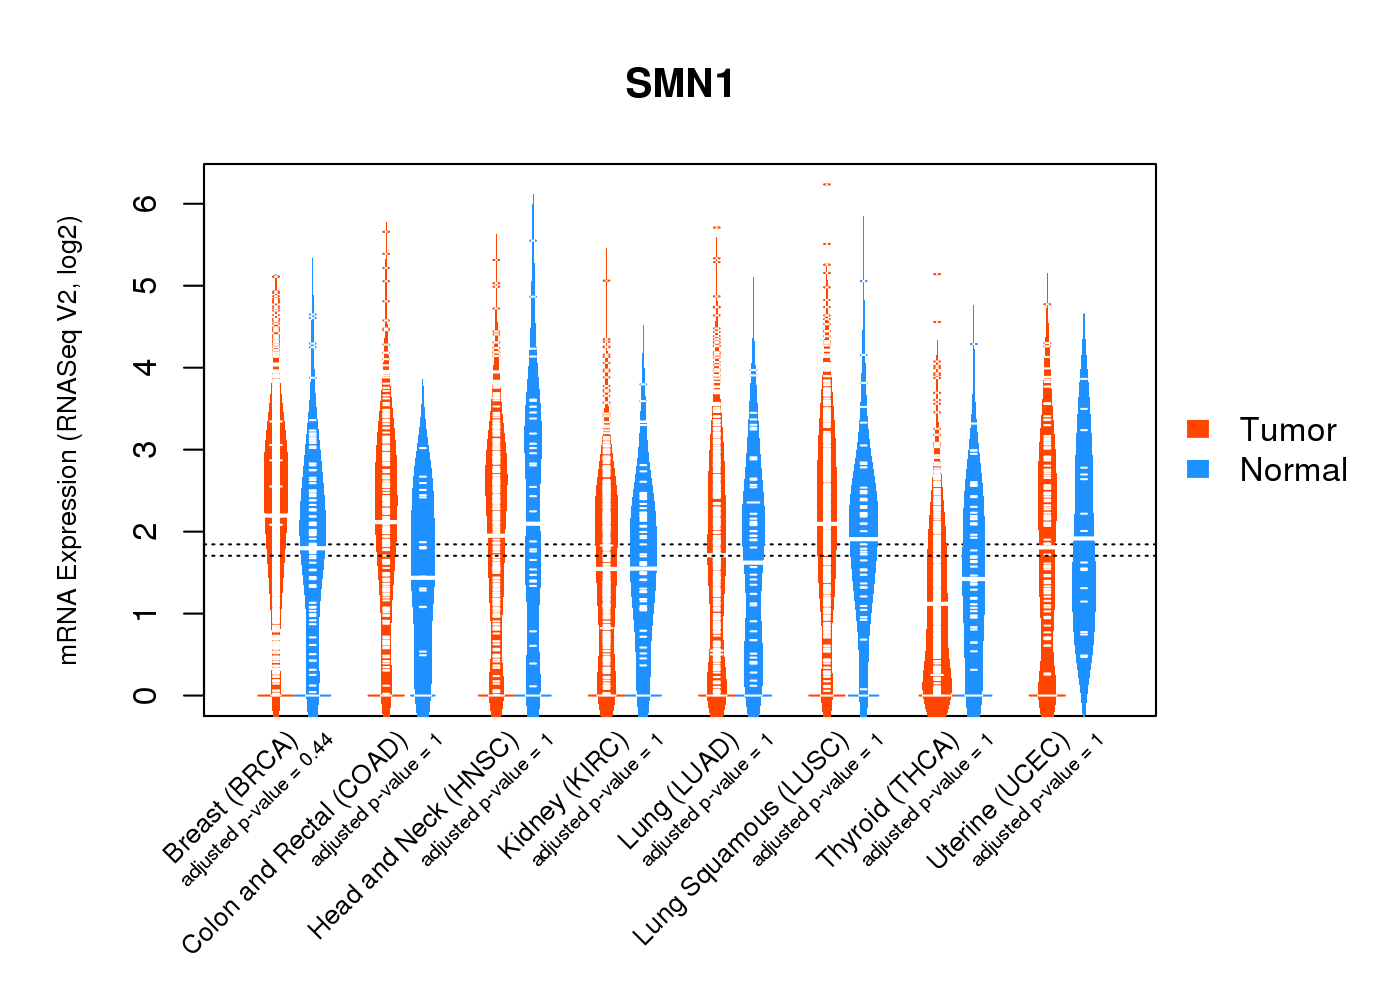
| Gene Expression for SMN1 |
| * CCLE gene expression data were extracted from CCLE_Expression_Entrez_2012-10-18.res: Gene-centric RMA-normalized mRNA expression data. |
 |
| * Normalized gene expression data of RNASeqV2 was extracted from TCGA using R package TCGA-Assembler. The URLs of all public data files on TCGA DCC data server were gathered at Jan-05-2015. Only eight cancer types have enough normal control samples for differential expression analysis. (t test, adjusted p<0.05 (using Benjamini-Hochberg FDR)) |
 |
| Top |
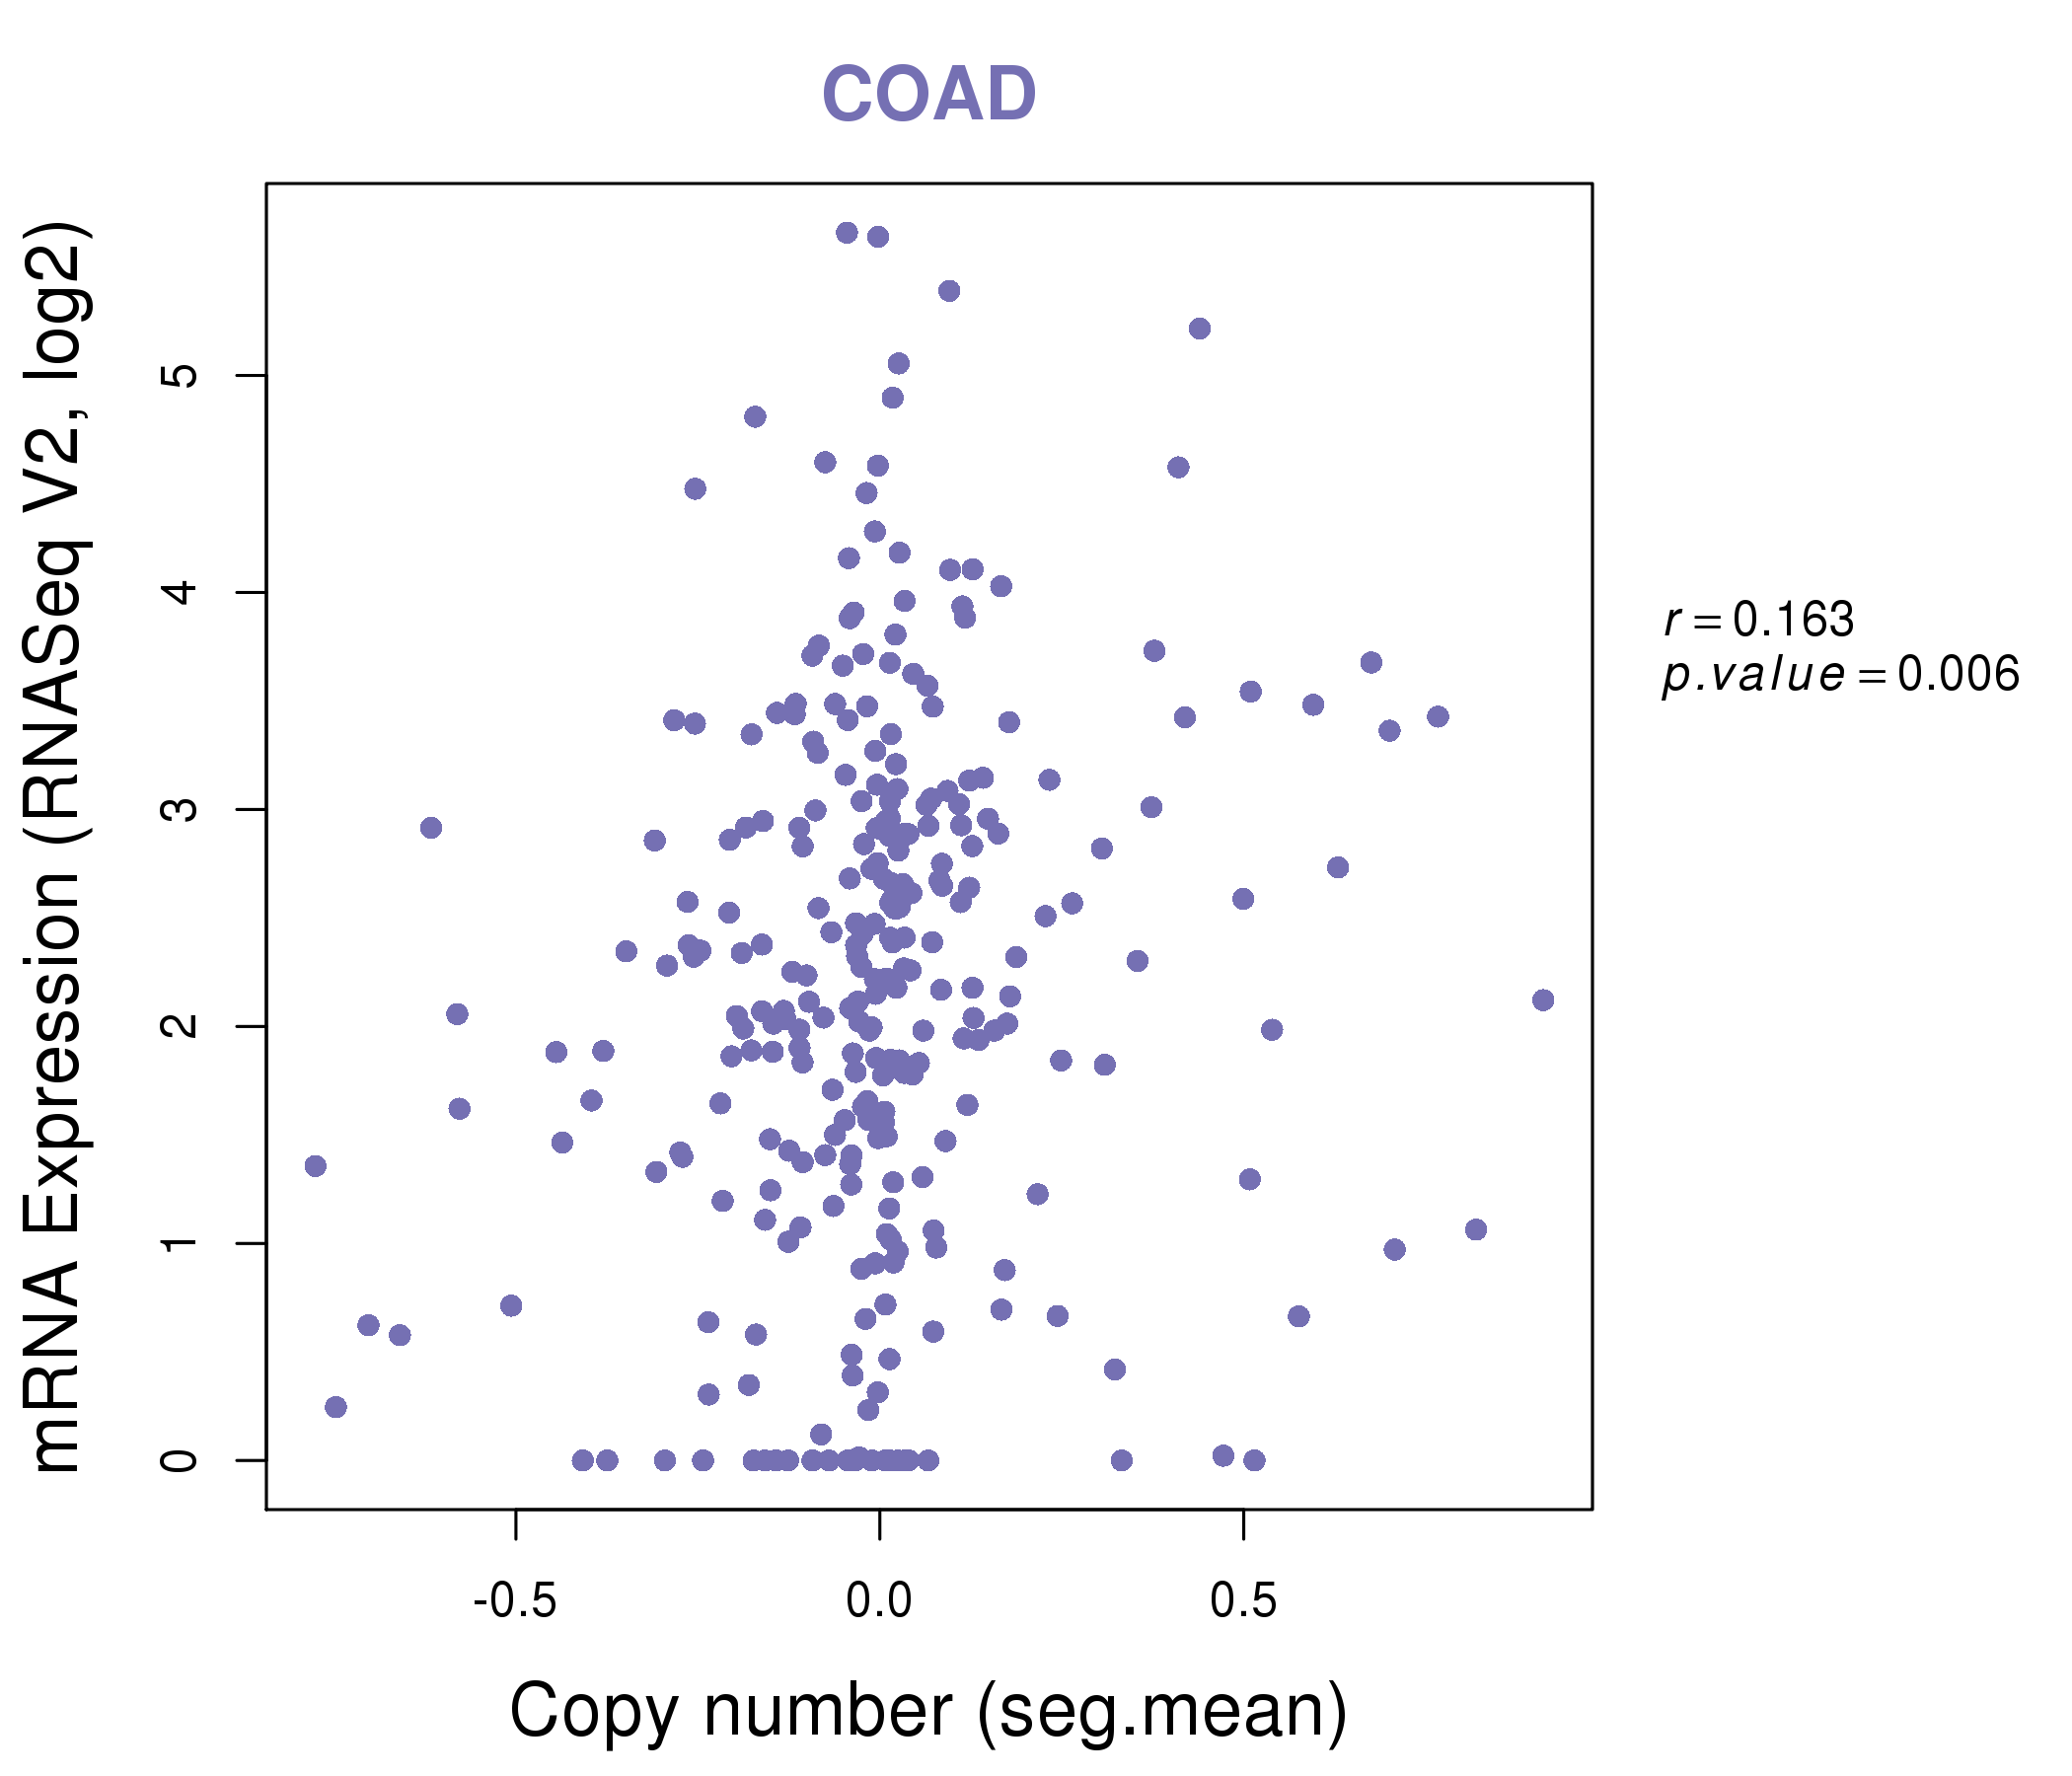
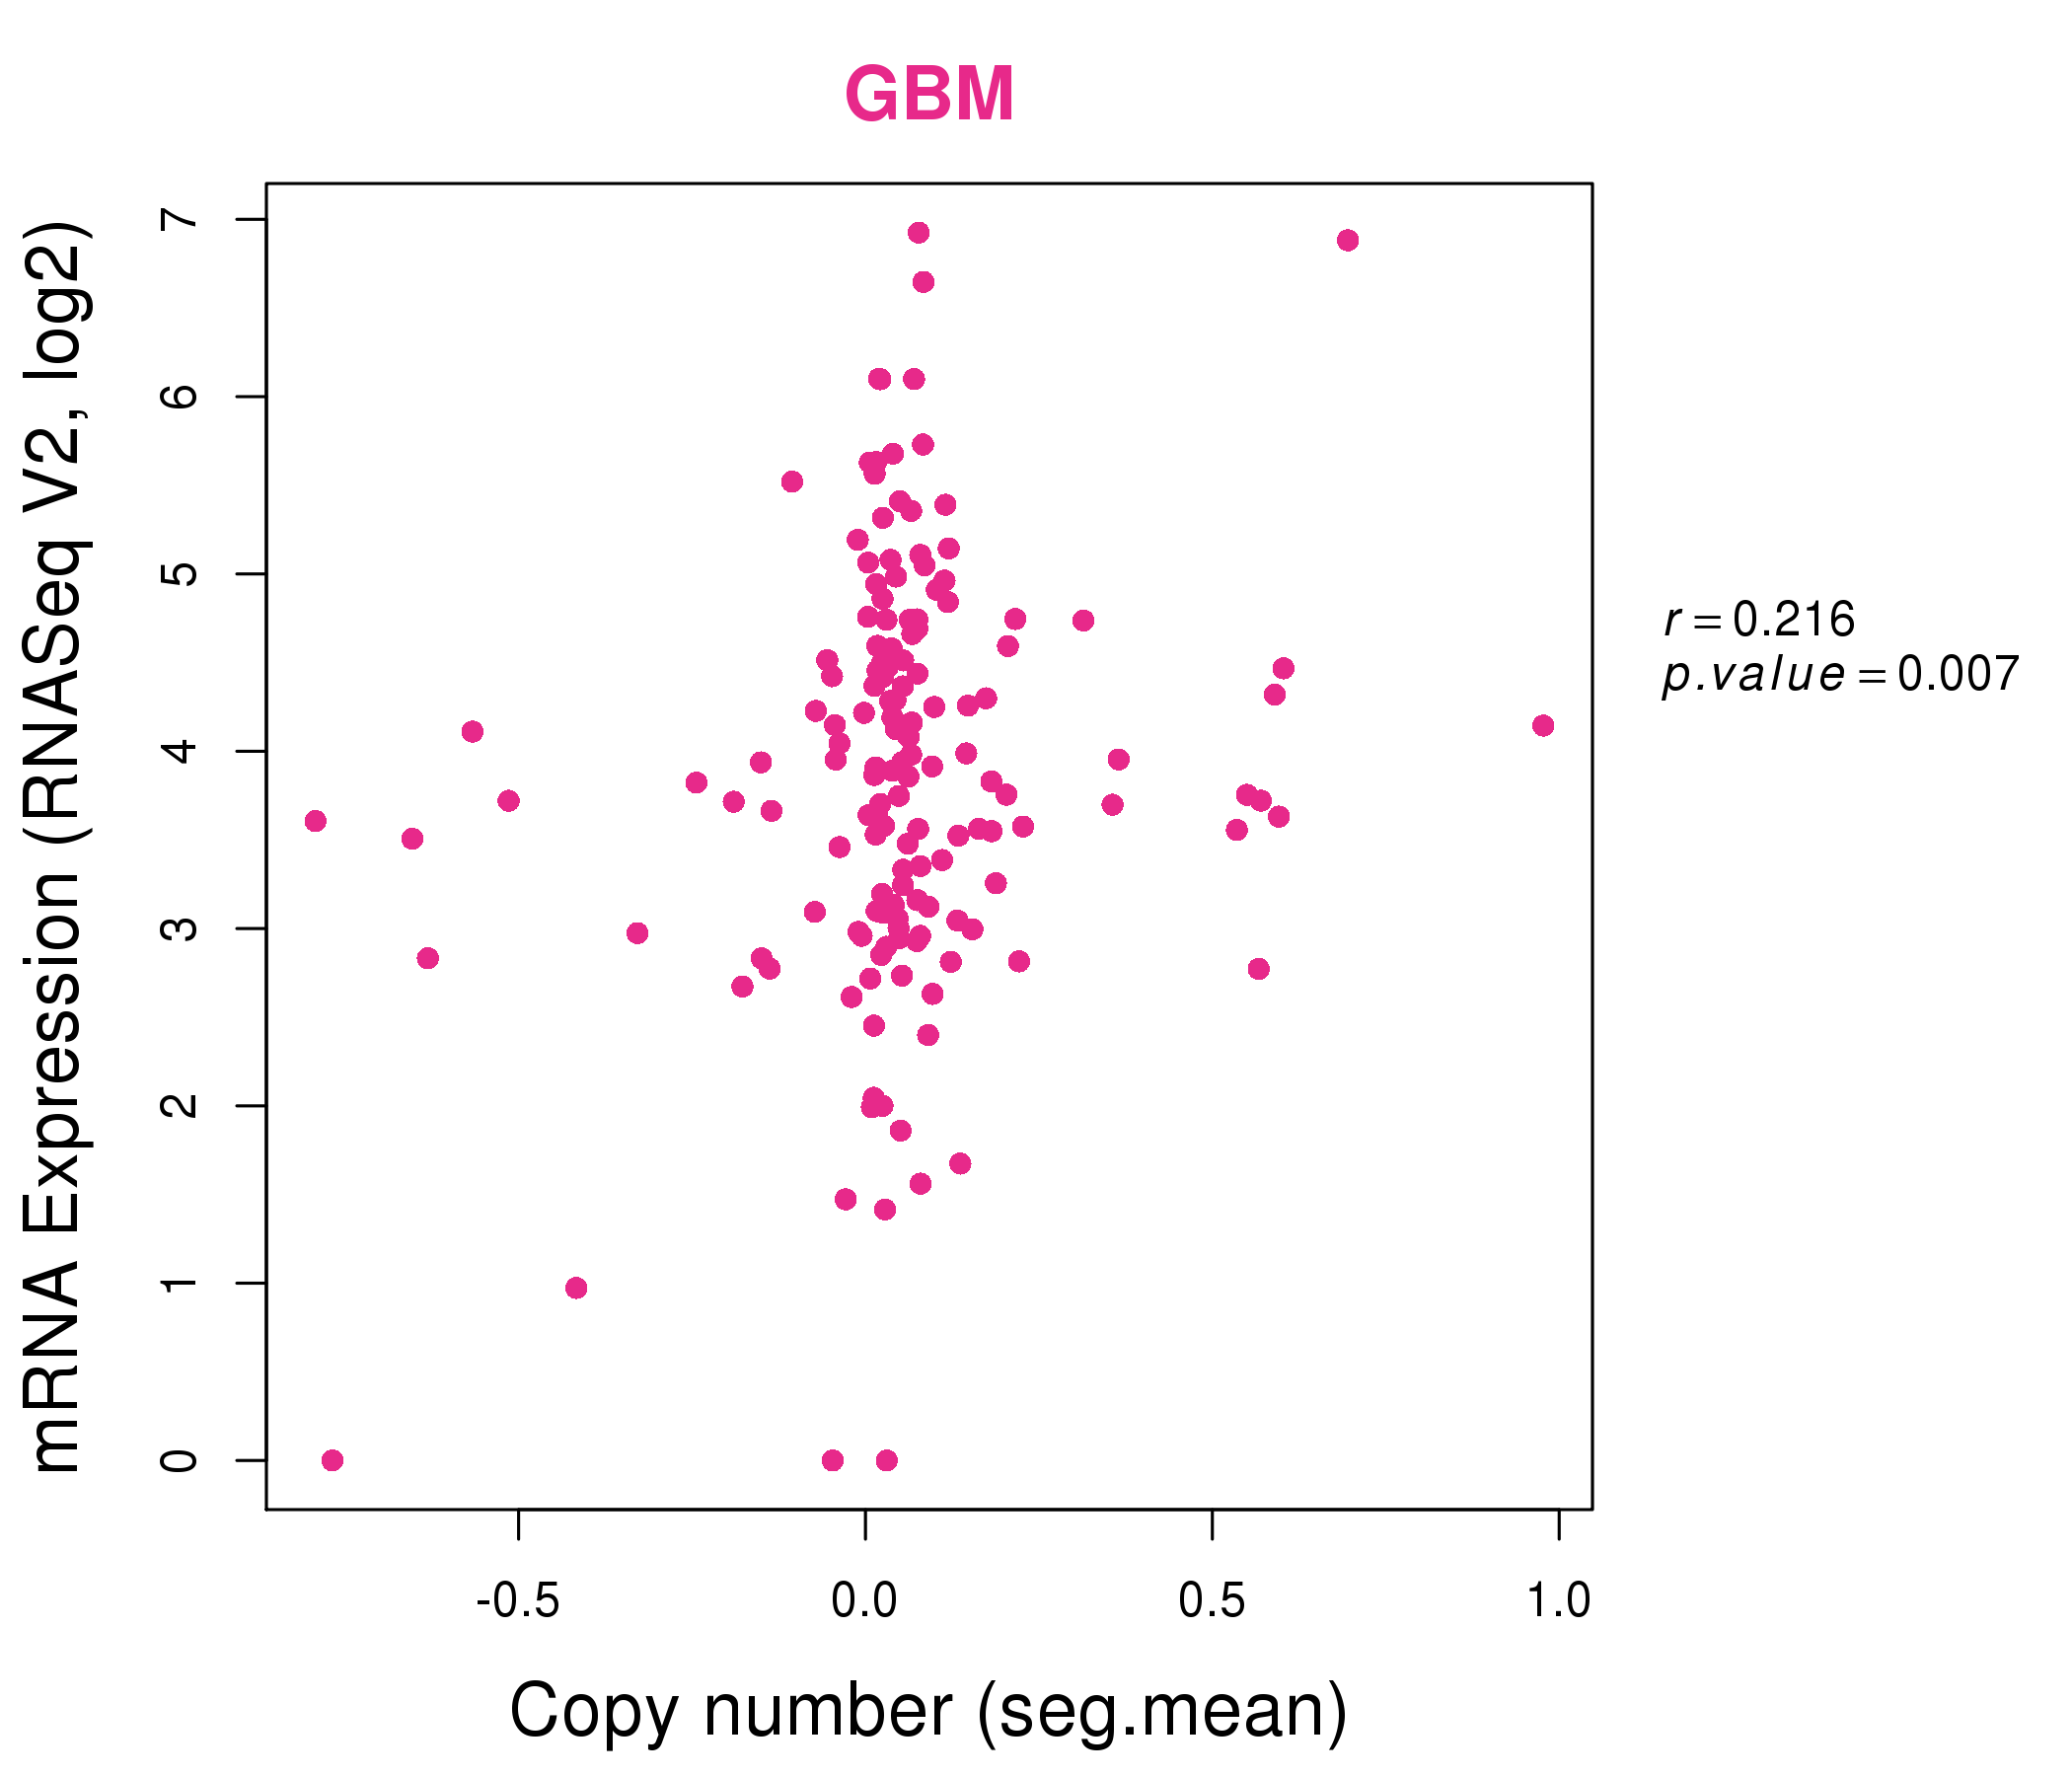
| * This plots show the correlation between CNV and gene expression. |
: Open all plots for all cancer types
 |
|
 |
|

| Top |
| Gene-Gene Network Information |
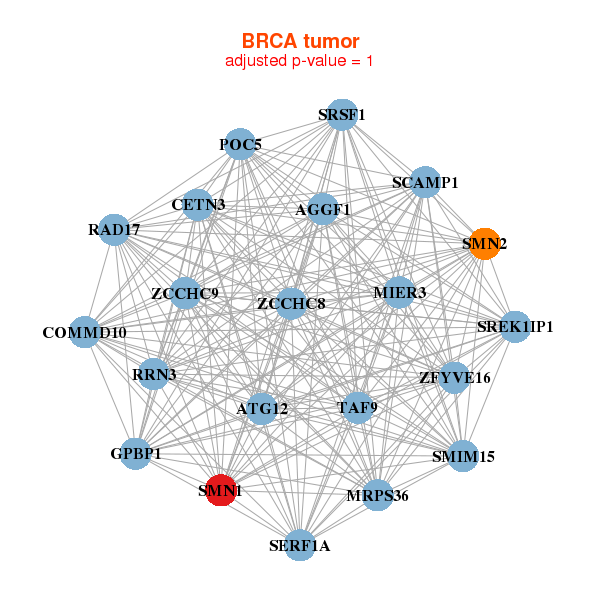
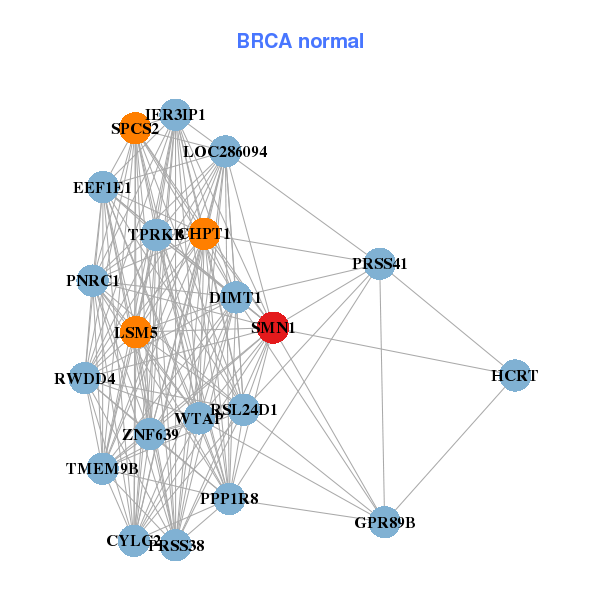
| * Co-Expression network figures were drawn using R package igraph. Only the top 20 genes with the highest correlations were shown. Red circle: input gene, orange circle: cell metabolism gene, sky circle: other gene |
: Open all plots for all cancer types
 |
|
| AGGF1,ATG12,SMIM15,CETN3,COMMD10,GPBP1,MIER3, MRPS36,POC5,RAD17,RRN3,SCAMP1,SERF1A,SREK1IP1, SRSF1,SMN1,SMN2,TAF9,ZCCHC8,ZCCHC9,ZFYVE16 | CHPT1,CYLC2,DIMT1,EEF1E1,GPR89B,HCRT,IER3IP1, LOC286094,LSM5,PNRC1,PPP1R8,PRSS38,PRSS41,RSL24D1, RWDD4,SMN1,SPCS2,TMEM9B,TPRKB,WTAP,ZNF639 |
 |
|
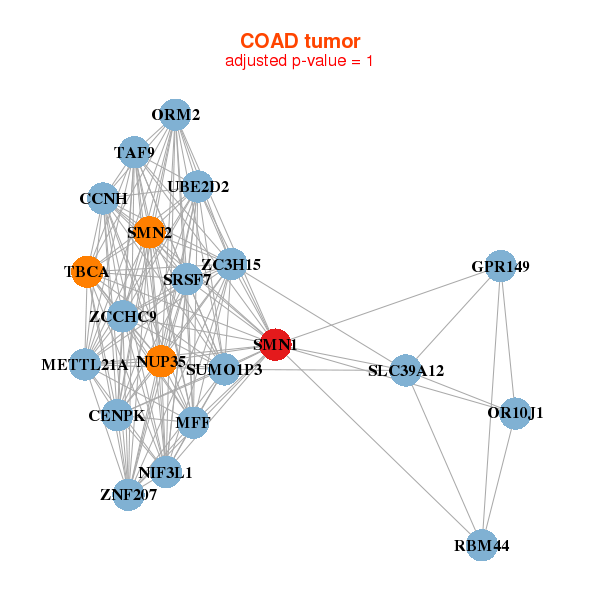
| CCNH,CENPK,METTL21A,GPR149,MFF,NIF3L1,NUP35, OR10J1,ORM2,RBM44,SRSF7,SLC39A12,SMN1,SMN2, SUMO1P3,TAF9,TBCA,UBE2D2,ZC3H15,ZCCHC9,ZNF207 | C17orf97,TMEM246,CABP2,CGB8,CIB3,DEFB119,ENDOG, HGC6.3,HIGD2A,ID3,LOC284379,OR10G9,OR52L1,PDHA2, SCARNA21,SCGB1D1,SERF1A,SMN1,SNORA77,TBR1,VENTXP7 |
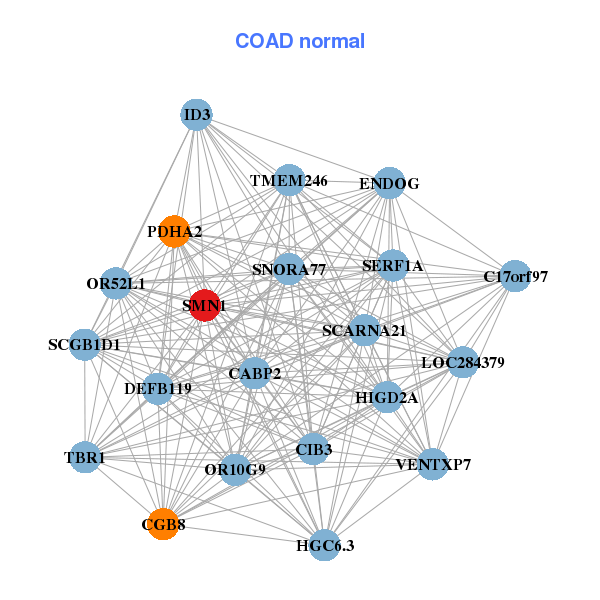
| * Co-Expression network figures were drawn using R package igraph. Only the top 20 genes with the highest correlations were shown. Red circle: input gene, orange circle: cell metabolism gene, sky circle: other gene |
: Open all plots for all cancer types
| Top |
: Open all interacting genes' information including KEGG pathway for all interacting genes from DAVID
| Top |
| Pharmacological Information for SMN1 |
| There's no related Drug. |
| Top |
| Cross referenced IDs for SMN1 |
| * We obtained these cross-references from Uniprot database. It covers 150 different DBs, 18 categories. http://www.uniprot.org/help/cross_references_section |
: Open all cross reference information
|
Copyright © 2016-Present - The Univsersity of Texas Health Science Center at Houston @ |