|
|||||||||||||||||||||||||||||||||||||||||||||||||||||||||||||||||||||||||||||||||||||||||||||||||||||||||||||||||||||||||||||||||||||||||||||||||||||||||||||||||||||||||||||||||||||||||||||||||||||||||||||||||||||||||||||||||||||||||||||||||||||||||||||||||||||||||||||||||||||||||||||||||||||||||||||||||
| |
| Phenotypic Information (metabolism pathway, cancer, disease, phenome) |
| |
| |
| Gene-Gene Network Information: Co-Expression Network, Interacting Genes & KEGG |
| |
|


| Gene Summary for SNRPE |
| Basic gene info. | Gene symbol | SNRPE |
| Gene name | small nuclear ribonucleoprotein polypeptide E | |
| Synonyms | B-raf|HYPT11|SME|Sm-E | |
| Cytomap | UCSC genome browser: 1q32 | |
| Genomic location | chr1 :203830739-203840280 | |
| Type of gene | protein-coding | |
| RefGenes | NM_003094.2, | |
| Ensembl id | ENSG00000182004 | |
| Description | sm protein Esmall nuclear ribonucleoprotein EsnRNP-E | |
| Modification date | 20141207 | |
| dbXrefs | MIM : 128260 | |
| HGNC : HGNC | ||
| HPRD : 00548 | ||
| Protein | UniProt: P62304 go to UniProt's Cross Reference DB Table | |
| Expression | CleanEX: HS_SNRPE | |
| BioGPS: 6635 | ||
| Gene Expression Atlas: ENSG00000182004 | ||
| The Human Protein Atlas: ENSG00000182004 | ||
| Pathway | NCI Pathway Interaction Database: SNRPE | |
| KEGG: SNRPE | ||
| REACTOME: SNRPE | ||
| ConsensusPathDB | ||
| Pathway Commons: SNRPE | ||
| Metabolism | MetaCyc: SNRPE | |
| HUMANCyc: SNRPE | ||
| Regulation | Ensembl's Regulation: ENSG00000182004 | |
| miRBase: chr1 :203,830,739-203,840,280 | ||
| TargetScan: NM_003094 | ||
| cisRED: ENSG00000182004 | ||
| Context | iHOP: SNRPE | |
| cancer metabolism search in PubMed: SNRPE | ||
| UCL Cancer Institute: SNRPE | ||
| Assigned class in ccmGDB | A - This gene has a literature evidence and it belongs to cancer gene. | |
| References showing role of SNRPE in cancer cell metabolism | 1. Valles I, Pajares MJ, Segura V, Guruceaga E, Gomez-Roman J, et al. (2012) Identification of novel deregulated RNA metabolism-related genes in non-small cell lung cancer. PloS one 7: e42086. go to article | |
| Top |
| Phenotypic Information for SNRPE(metabolism pathway, cancer, disease, phenome) |
| Cancer | CGAP: SNRPE |
| Familial Cancer Database: SNRPE | |
| * This gene is included in those cancer gene databases. |
|
|
|
|
|
| . | |||||||||||||||||||||||||||||||||||||||||||||||||||||||||||||||||||||||||||||||||||||||||||||||||||||||||||||||||||||||||||||||||||||||||||||||||||||||||||||||||||||||||||||||||||||||||||||||||||||||||||||||||||||||||||||||||||||||||||||||||||||||||||||||||||||||||||||||||||||||||||||||||||||||||||
Oncogene 1 | Significant driver gene in | ||||||||||||||||||||||||||||||||||||||||||||||||||||||||||||||||||||||||||||||||||||||||||||||||||||||||||||||||||||||||||||||||||||||||||||||||||||||||||||||||||||||||||||||||||||||||||||||||||||||||||||||||||||||||||||||||||||||||||||||||||||||||||||||||||||||||||||||||||||||||||||||||||||||||||||||||
| cf) number; DB name 1 Oncogene; http://nar.oxfordjournals.org/content/35/suppl_1/D721.long, 2 Tumor Suppressor gene; https://bioinfo.uth.edu/TSGene/, 3 Cancer Gene Census; http://www.nature.com/nrc/journal/v4/n3/abs/nrc1299.html, 4 CancerGenes; http://nar.oxfordjournals.org/content/35/suppl_1/D721.long, 5 Network of Cancer Gene; http://ncg.kcl.ac.uk/index.php, 1Therapeutic Vulnerabilities in Cancer; http://cbio.mskcc.org/cancergenomics/statius/ |
| REACTOME_METABOLISM_OF_NON_CODING_RNA REACTOME_METABOLISM_OF_RNA | |
| OMIM | 128260; gene. 615059; phenotype. |
| Orphanet | 55654; Hypotrichosis simplex. |
| Disease | KEGG Disease: SNRPE |
| MedGen: SNRPE (Human Medical Genetics with Condition) | |
| ClinVar: SNRPE | |
| Phenotype | MGI: SNRPE (International Mouse Phenotyping Consortium) |
| PhenomicDB: SNRPE | |
| Mutations for SNRPE |
| * Under tables are showing count per each tissue to give us broad intuition about tissue specific mutation patterns.You can go to the detailed page for each mutation database's web site. |
| There's no structural variation information in COSMIC data for this gene. |
| * From mRNA Sanger sequences, Chitars2.0 arranged chimeric transcripts. This table shows SNRPE related fusion information. |
| ID | Head Gene | Tail Gene | Accession | Gene_a | qStart_a | qEnd_a | Chromosome_a | tStart_a | tEnd_a | Gene_a | qStart_a | qEnd_a | Chromosome_a | tStart_a | tEnd_a |
| S60260 | SNRPE | 1 | 174 | 1 | 203830758 | 203832853 | PRTFDC1 | 175 | 240 | 10 | 25160927 | 25160992 | |
| DA778780 | SNRPE | 1 | 213 | 1 | 203830975 | 203831187 | SETBP1 | 209 | 574 | 18 | 42532622 | 42532987 | |
| Top |
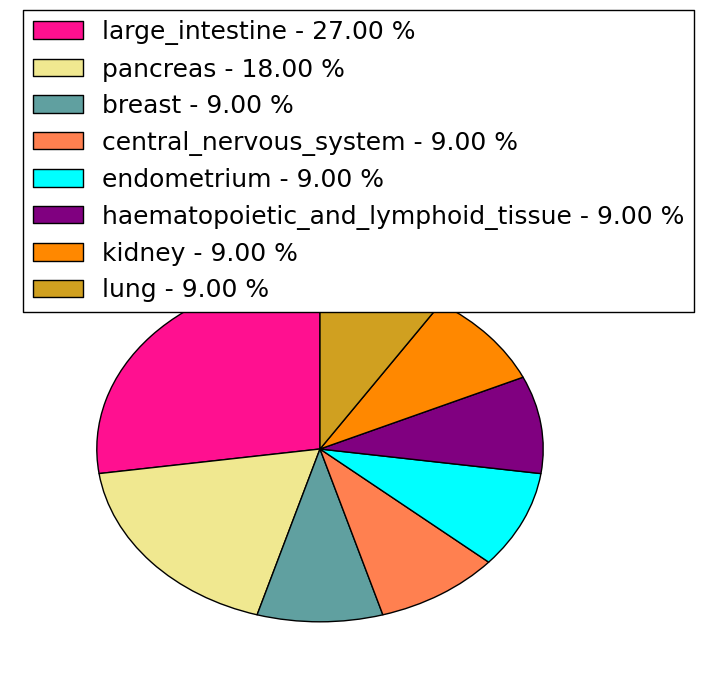
| Mutation type/ Tissue ID | brca | cns | cerv | endome | haematopo | kidn | Lintest | liver | lung | ns | ovary | pancre | prost | skin | stoma | thyro | urina | |||
| Total # sample | 1 | |||||||||||||||||||
| GAIN (# sample) | 1 | |||||||||||||||||||
| LOSS (# sample) |
| cf) Tissue ID; Tissue type (1; Breast, 2; Central_nervous_system, 3; Cervix, 4; Endometrium, 5; Haematopoietic_and_lymphoid_tissue, 6; Kidney, 7; Large_intestine, 8; Liver, 9; Lung, 10; NS, 11; Ovary, 12; Pancreas, 13; Prostate, 14; Skin, 15; Stomach, 16; Thyroid, 17; Urinary_tract) |
| Top |
|
 |
| Top |
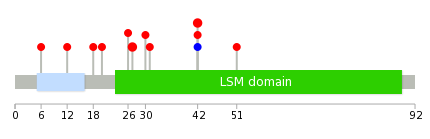
| Stat. for Non-Synonymous SNVs (# total SNVs=11) | (# total SNVs=1) |
 | 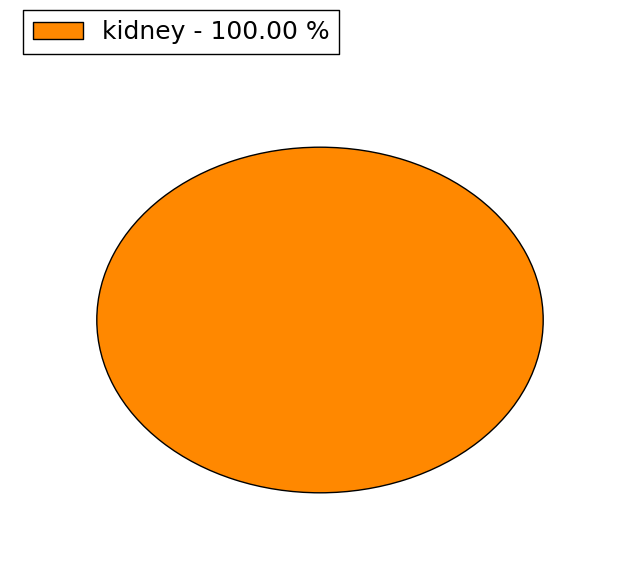 |
(# total SNVs=0) | (# total SNVs=0) |
| Top |
| * When you move the cursor on each content, you can see more deailed mutation information on the Tooltip. Those are primary_site,primary_histology,mutation(aa),pubmedID. |
| GRCh37 position | Mutation(aa) | Unique sampleID count |
| chr1:203831348-203831348 | p.N27H | 2 |
| chr1:203832833-203832833 | p.R42W | 2 |
| chr1:203832798-203832798 | p.R30Q | 1 |
| chr1:203832801-203832801 | p.I31T | 1 |
| chr1:203832834-203832834 | p.R42Q | 1 |
| chr1:203830805-203830805 | p.Q6H | 1 |
| chr1:203832835-203832835 | p.R42R | 1 |
| chr1:203830818-203830818 | p.Q11* | 1 |
| chr1:203834176-203834176 | p.D51V | 1 |
| chr1:203830822-203830822 | p.K12T | 1 |
| Top |
|
 |
| Point Mutation/ Tissue ID | 1 | 2 | 3 | 4 | 5 | 6 | 7 | 8 | 9 | 10 | 11 | 12 | 13 | 14 | 15 | 16 | 17 | 18 | 19 | 20 |
| # sample | 3 | 1 | 1 | 1 | 1 | |||||||||||||||
| # mutation | 2 | 1 | 1 | 1 | 1 | |||||||||||||||
| nonsynonymous SNV | 2 | 1 | 1 | 1 | 1 | |||||||||||||||
| synonymous SNV |
| cf) Tissue ID; Tissue type (1; BLCA[Bladder Urothelial Carcinoma], 2; BRCA[Breast invasive carcinoma], 3; CESC[Cervical squamous cell carcinoma and endocervical adenocarcinoma], 4; COAD[Colon adenocarcinoma], 5; GBM[Glioblastoma multiforme], 6; Glioma Low Grade, 7; HNSC[Head and Neck squamous cell carcinoma], 8; KICH[Kidney Chromophobe], 9; KIRC[Kidney renal clear cell carcinoma], 10; KIRP[Kidney renal papillary cell carcinoma], 11; LAML[Acute Myeloid Leukemia], 12; LUAD[Lung adenocarcinoma], 13; LUSC[Lung squamous cell carcinoma], 14; OV[Ovarian serous cystadenocarcinoma ], 15; PAAD[Pancreatic adenocarcinoma], 16; PRAD[Prostate adenocarcinoma], 17; SKCM[Skin Cutaneous Melanoma], 18:STAD[Stomach adenocarcinoma], 19:THCA[Thyroid carcinoma], 20:UCEC[Uterine Corpus Endometrial Carcinoma]) |
| Top |
| * We represented just top 10 SNVs. When you move the cursor on each content, you can see more deailed mutation information on the Tooltip. Those are primary_site, primary_histology, mutation(aa), pubmedID. |
| Genomic Position | Mutation(aa) | Unique sampleID count |
| chr1:203832833 | p.R42W | 2 |
| chr1:203832798 | p.I31T | 1 |
| chr1:203832801 | p.Q6H | 1 |
| chr1:203830805 | p.K12T | 1 |
| chr1:203830822 | p.Q26H | 1 |
| chr1:203831347 | p.N27H | 1 |
| chr1:203831348 | p.R30Q | 1 |
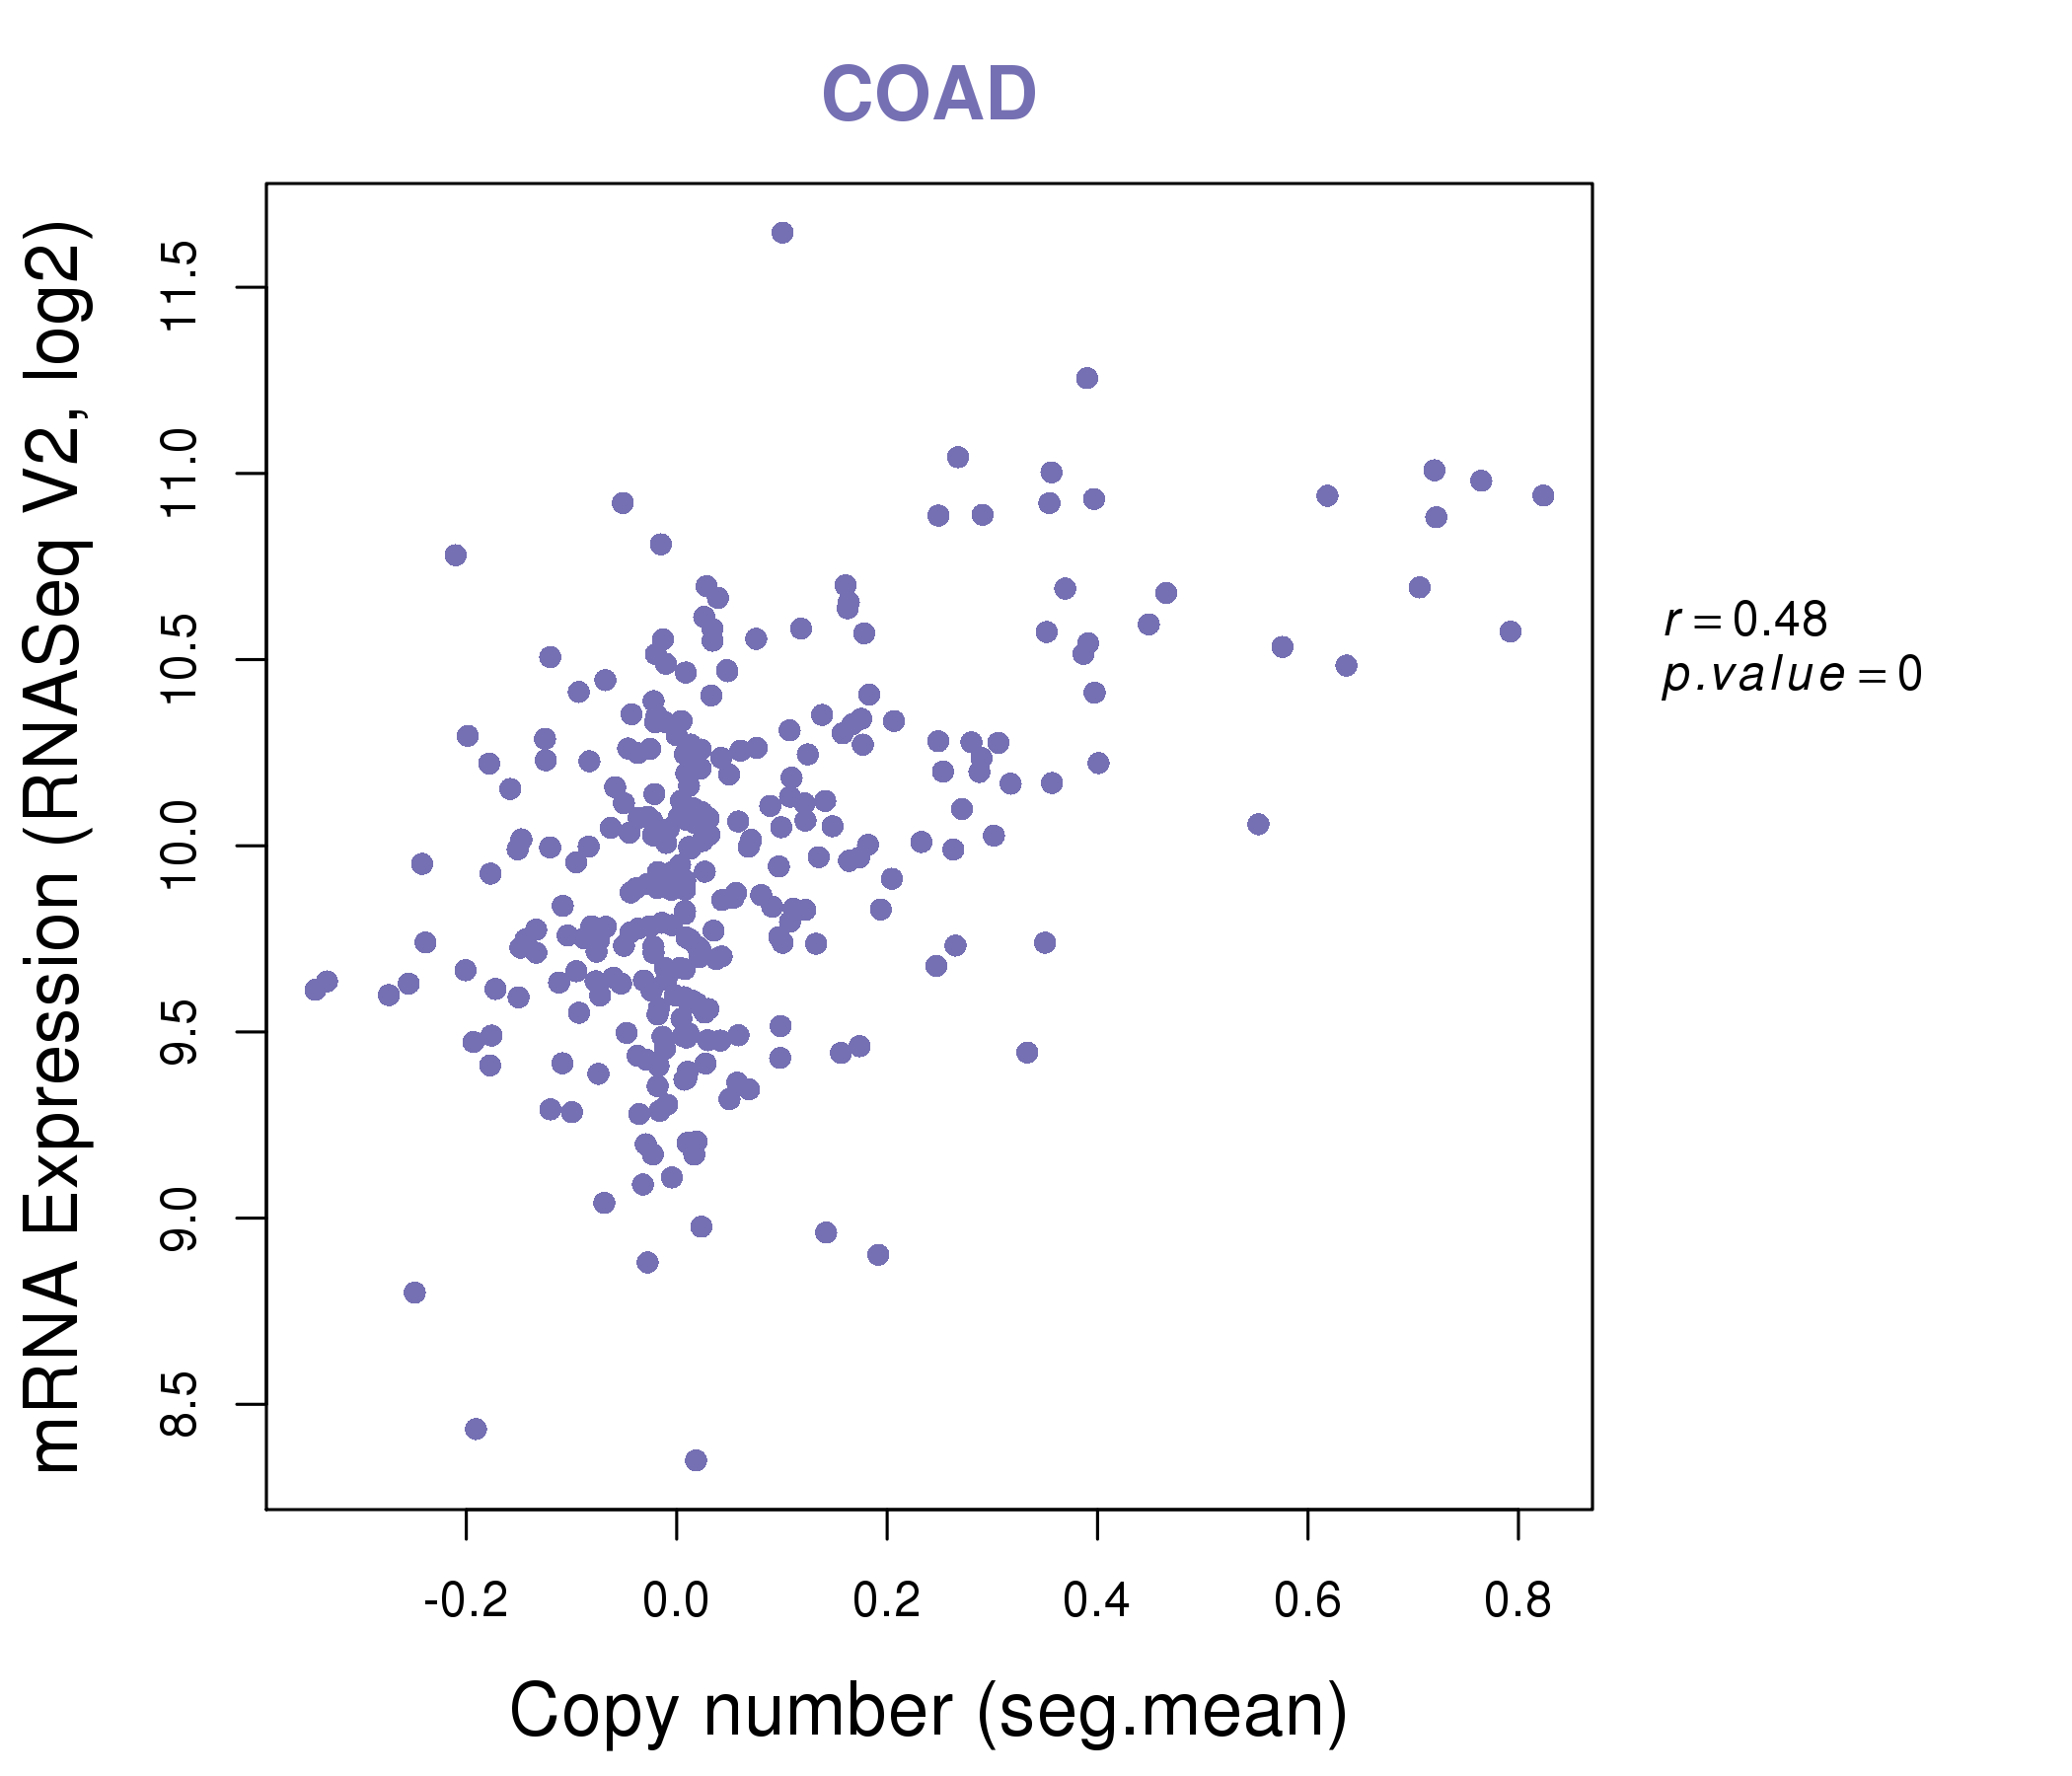
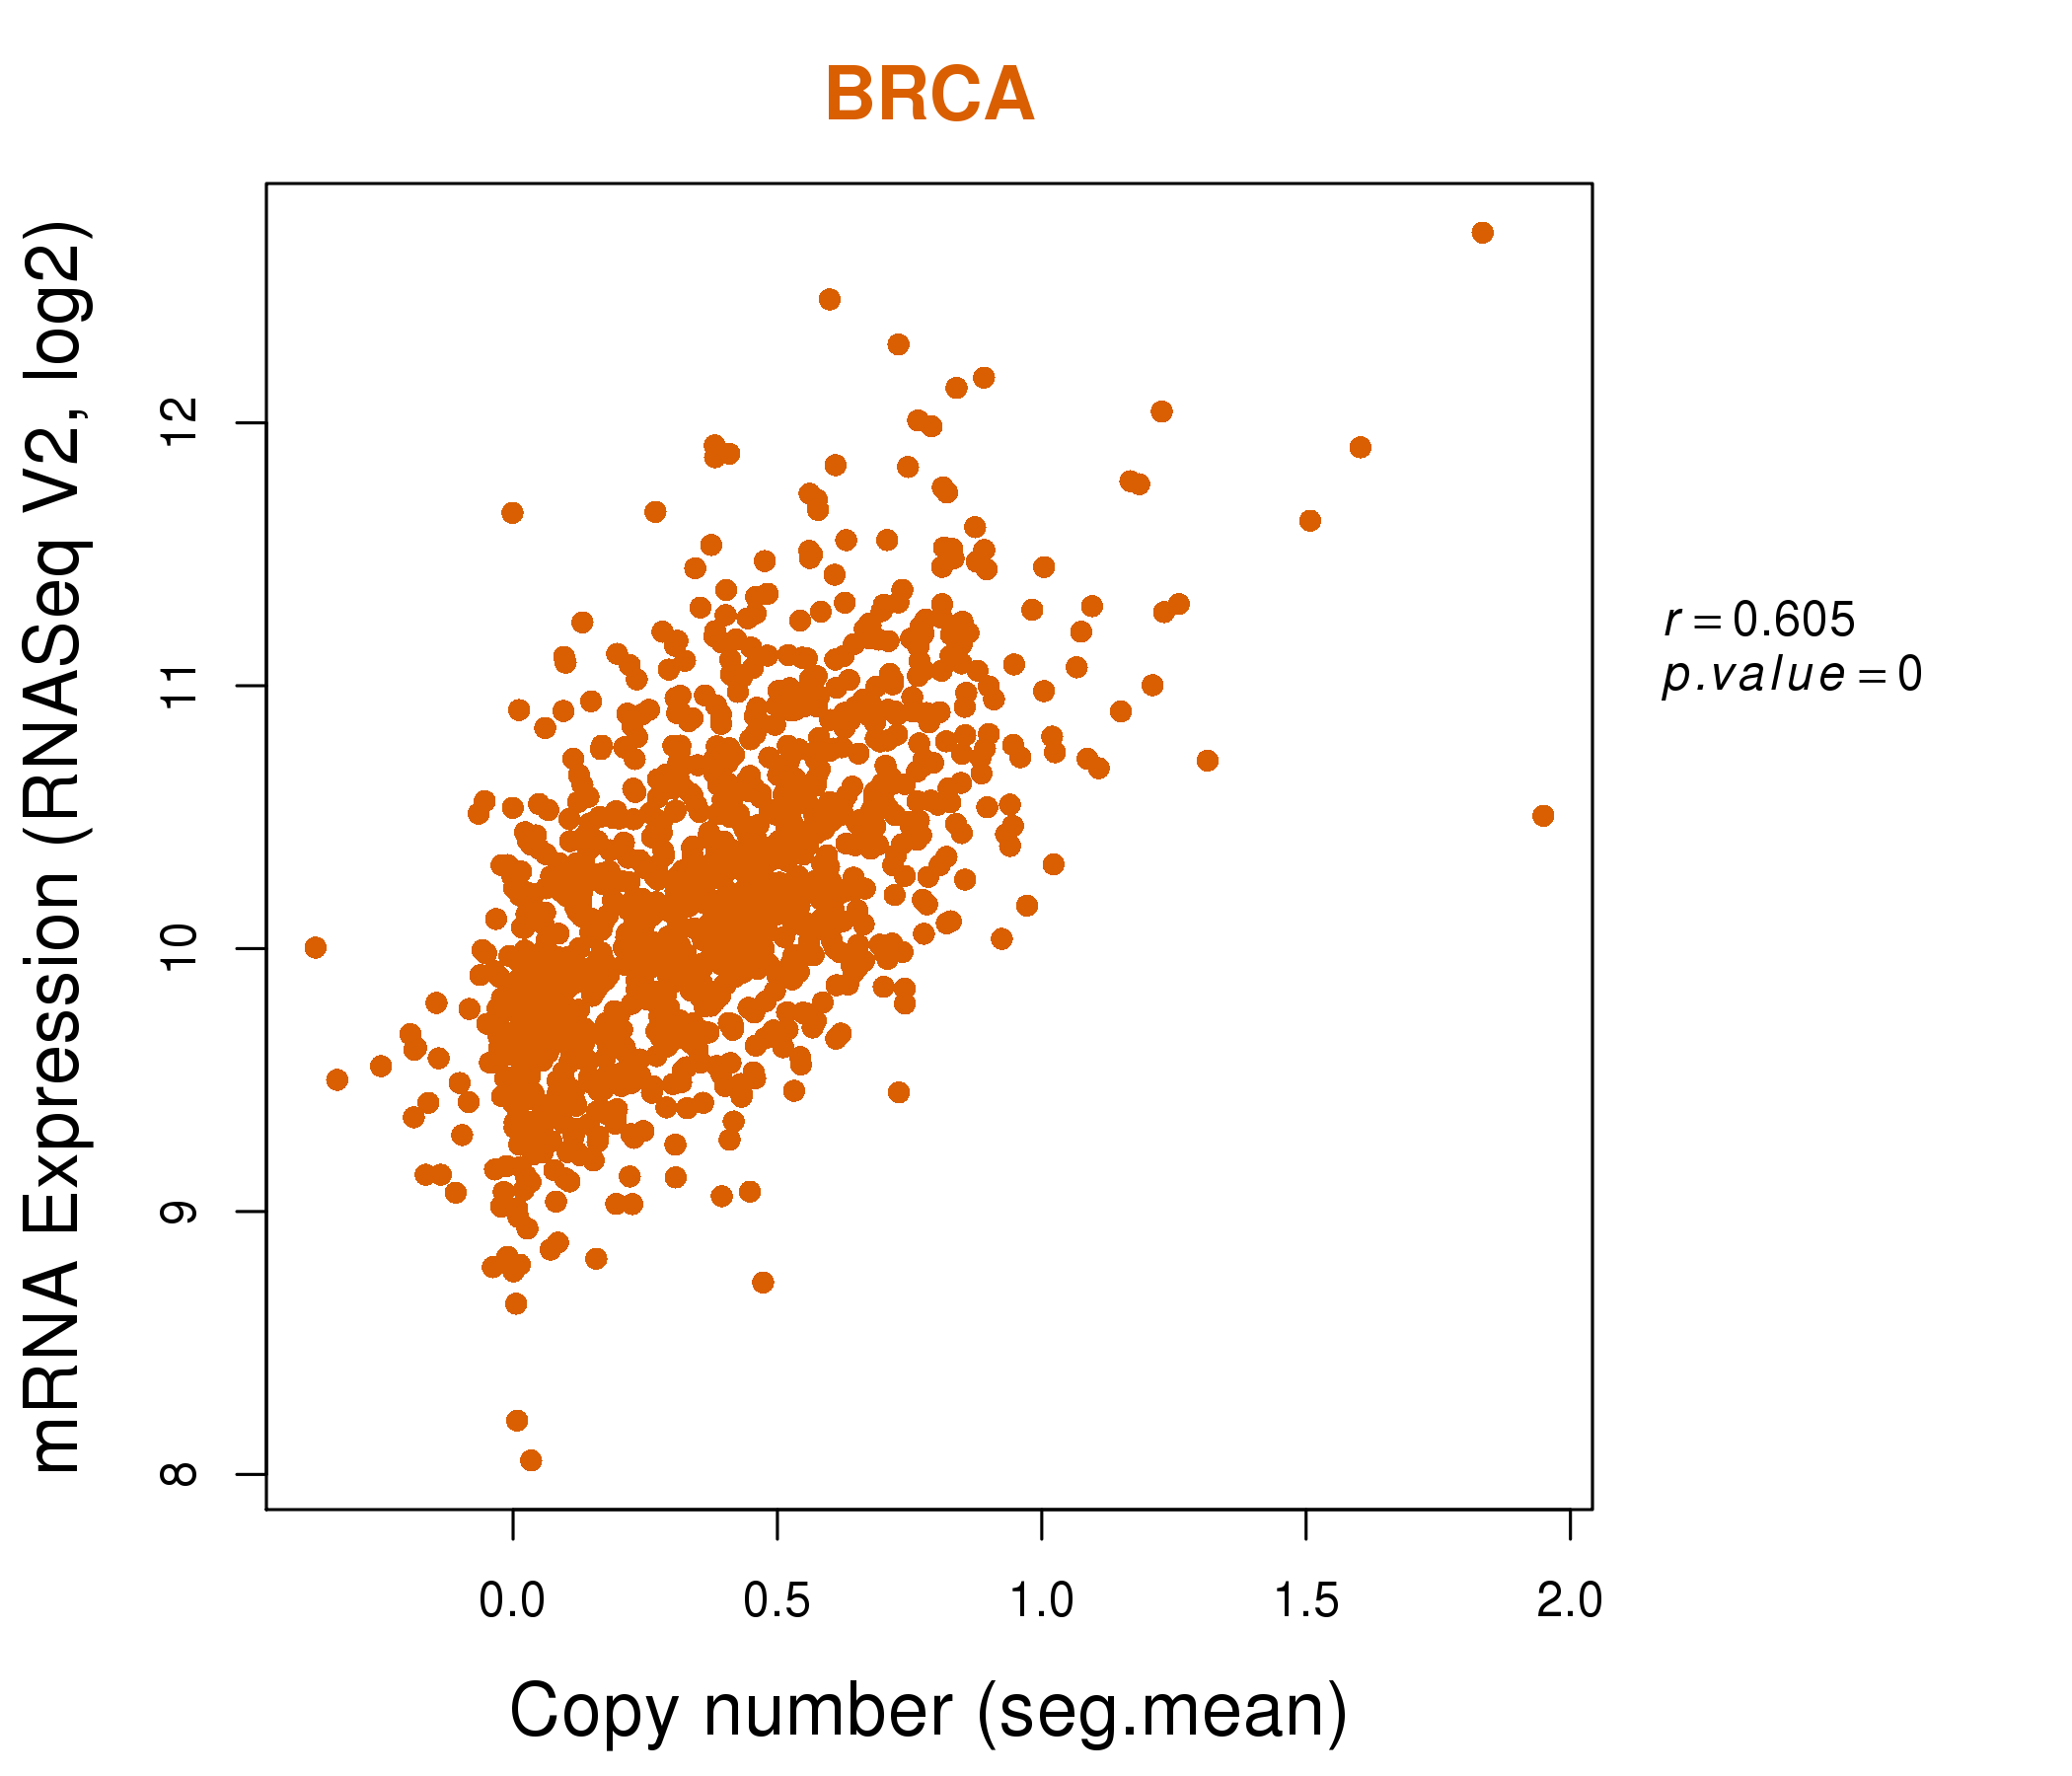
| * Copy number data were extracted from TCGA using R package TCGA-Assembler. The URLs of all public data files on TCGA DCC data server were gathered on Jan-05-2015. Function ProcessCNAData in TCGA-Assembler package was used to obtain gene-level copy number value which is calculated as the average copy number of the genomic region of a gene. |
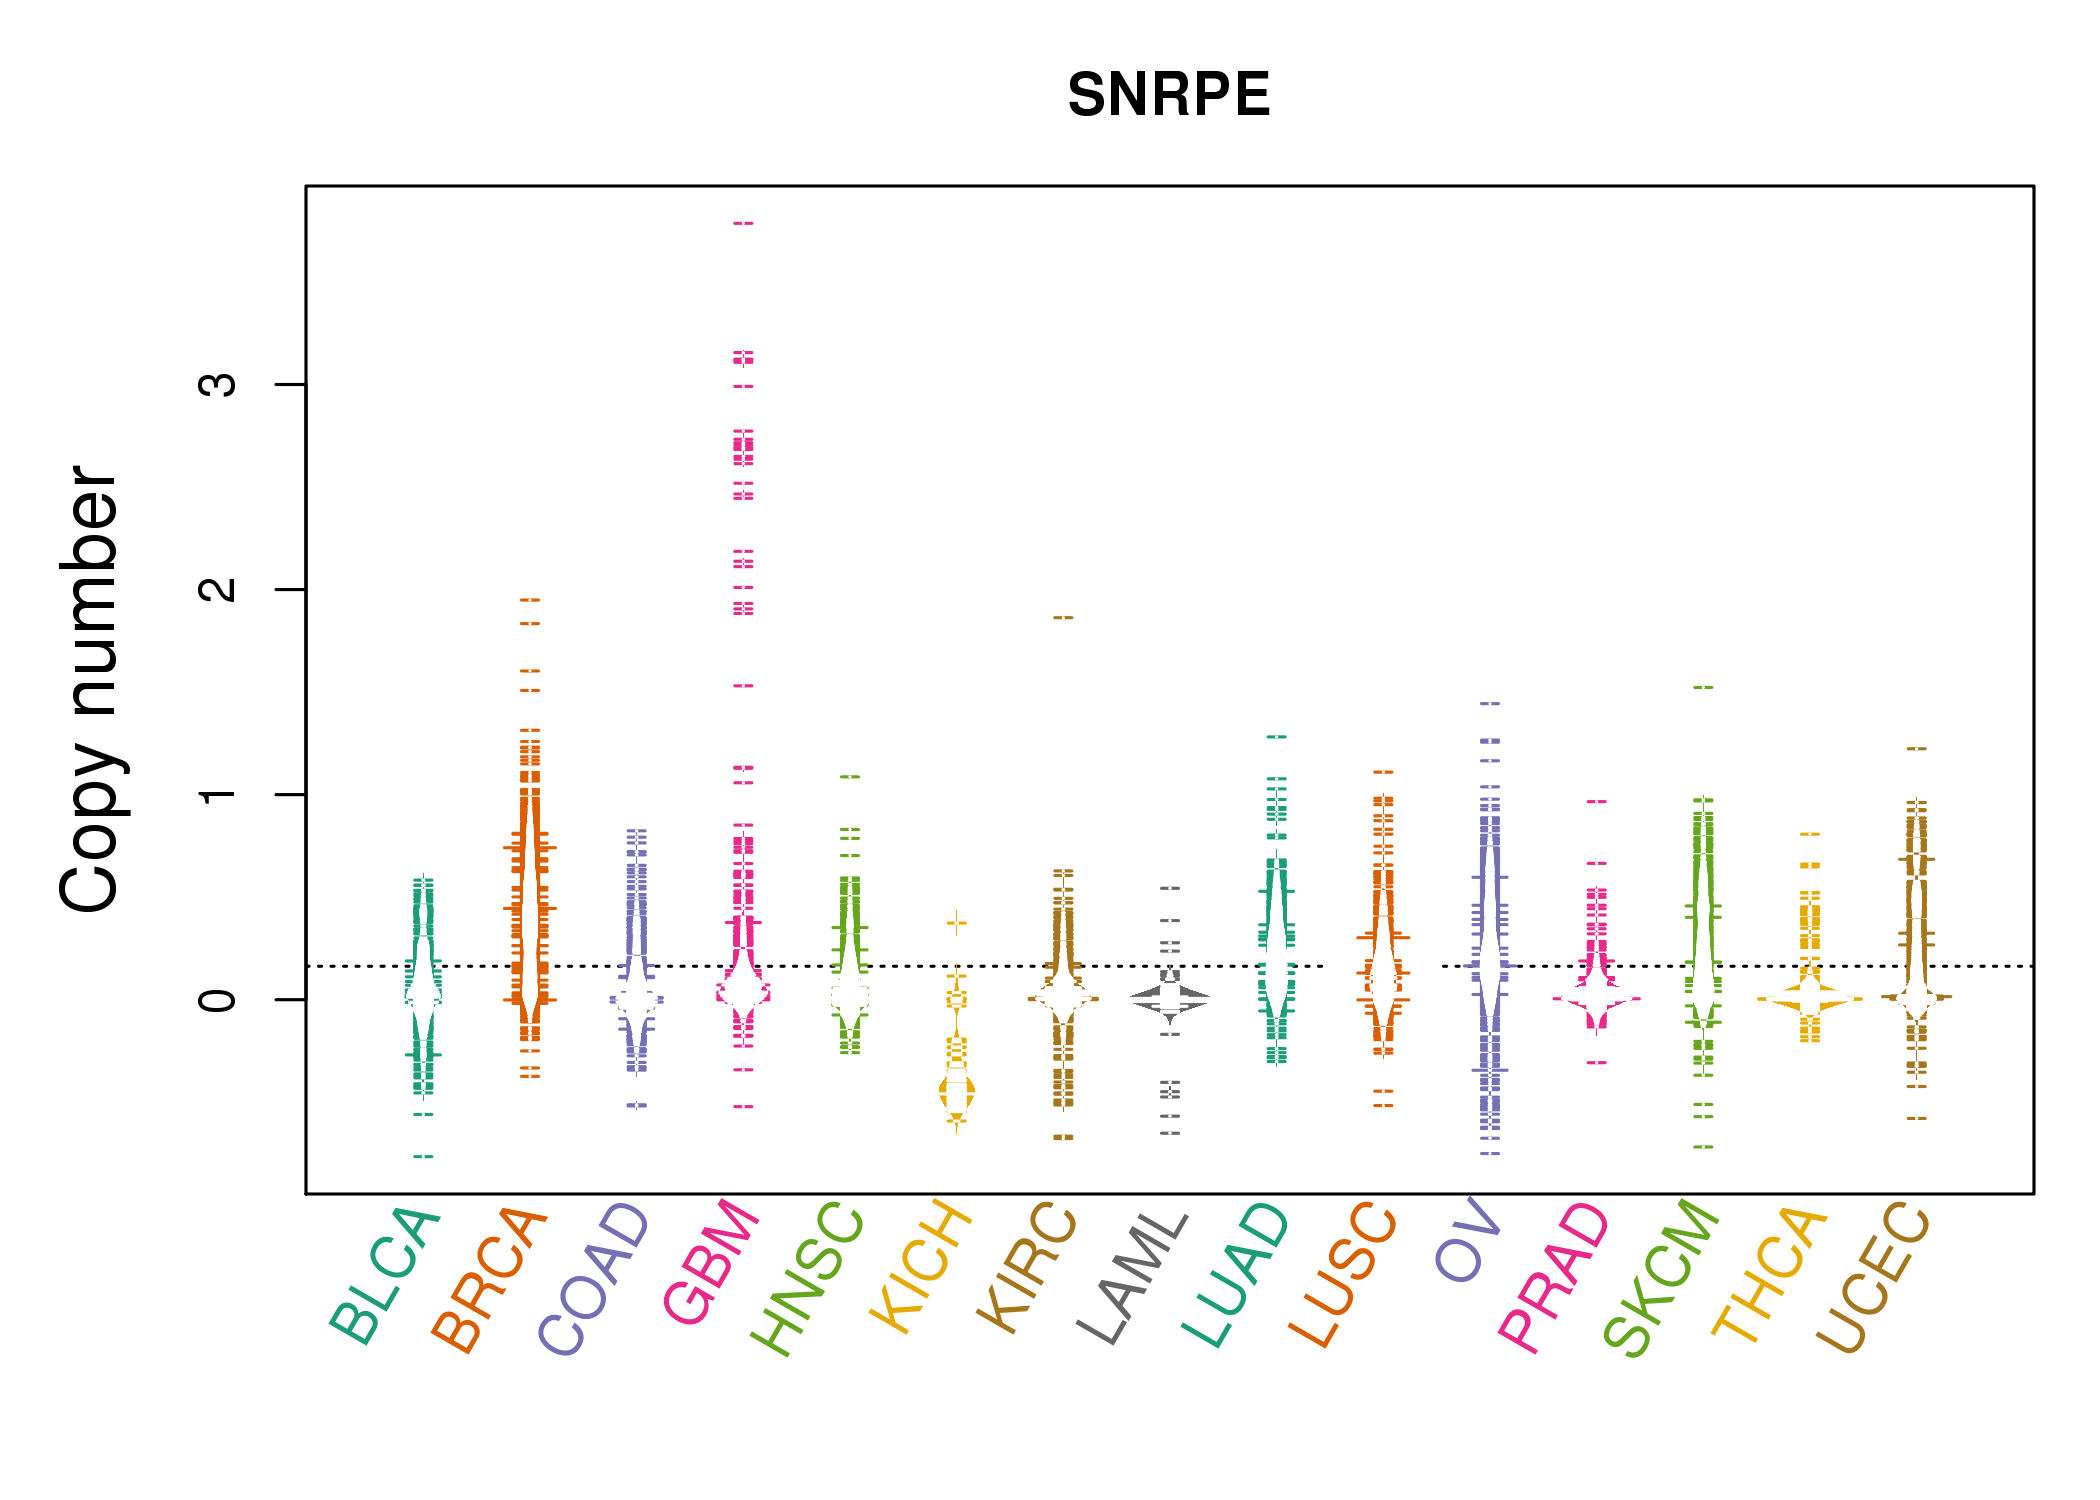 |
| cf) Tissue ID[Tissue type]: BLCA[Bladder Urothelial Carcinoma], BRCA[Breast invasive carcinoma], CESC[Cervical squamous cell carcinoma and endocervical adenocarcinoma], COAD[Colon adenocarcinoma], GBM[Glioblastoma multiforme], Glioma Low Grade, HNSC[Head and Neck squamous cell carcinoma], KICH[Kidney Chromophobe], KIRC[Kidney renal clear cell carcinoma], KIRP[Kidney renal papillary cell carcinoma], LAML[Acute Myeloid Leukemia], LUAD[Lung adenocarcinoma], LUSC[Lung squamous cell carcinoma], OV[Ovarian serous cystadenocarcinoma ], PAAD[Pancreatic adenocarcinoma], PRAD[Prostate adenocarcinoma], SKCM[Skin Cutaneous Melanoma], STAD[Stomach adenocarcinoma], THCA[Thyroid carcinoma], UCEC[Uterine Corpus Endometrial Carcinoma] |
| Top |
| Gene Expression for SNRPE |
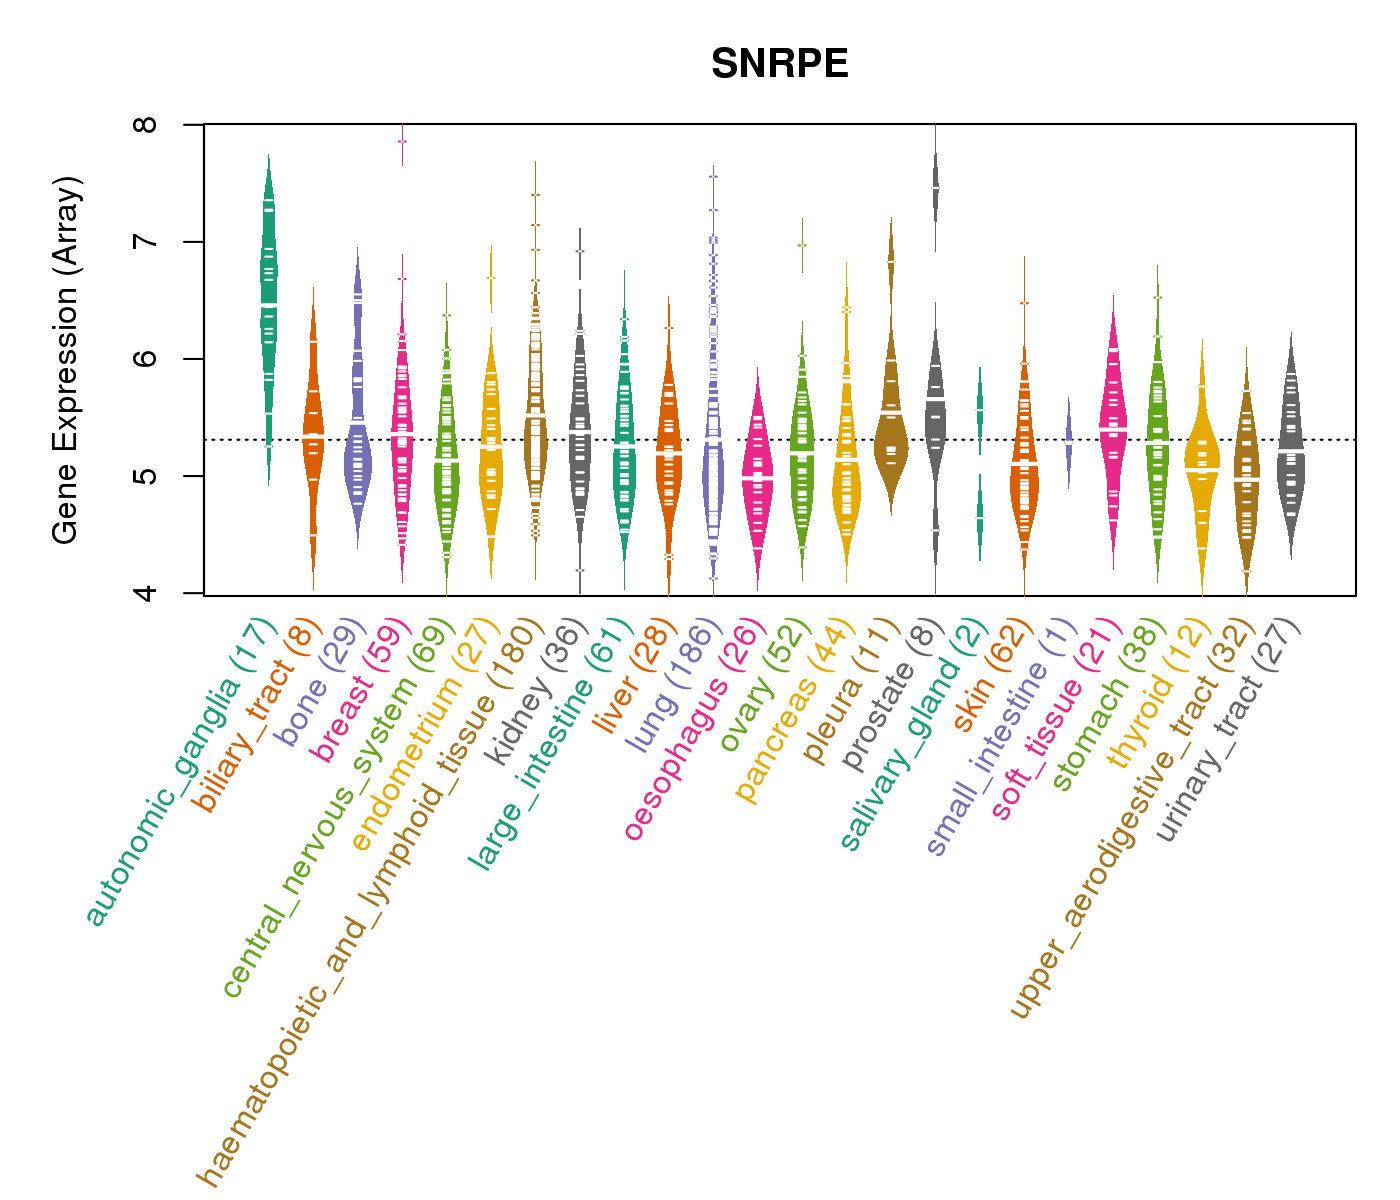
| * CCLE gene expression data were extracted from CCLE_Expression_Entrez_2012-10-18.res: Gene-centric RMA-normalized mRNA expression data. |
 |
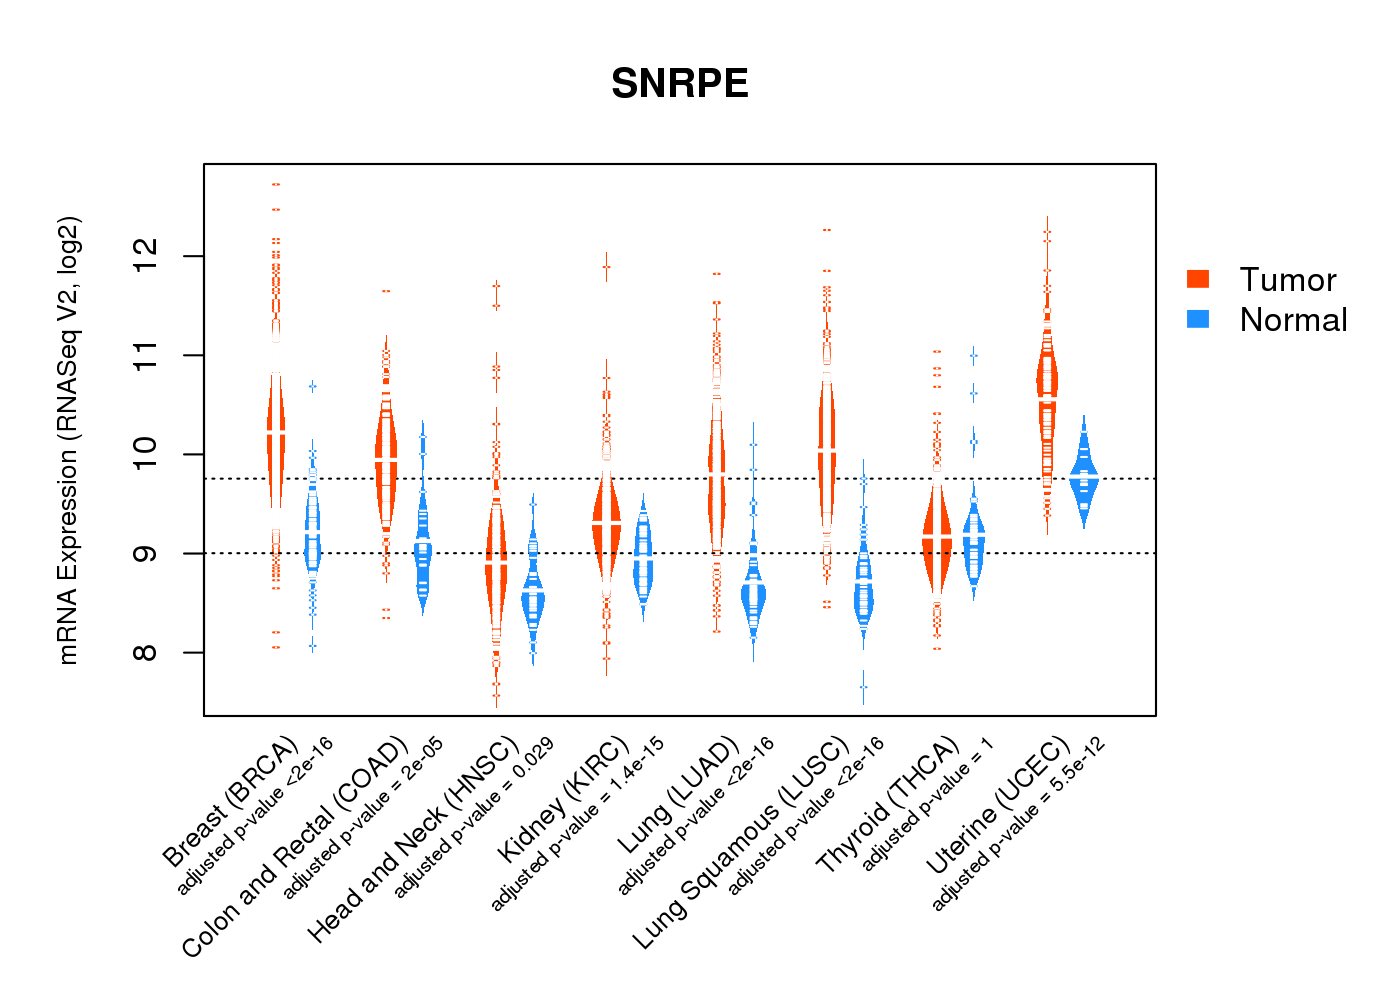
| * Normalized gene expression data of RNASeqV2 was extracted from TCGA using R package TCGA-Assembler. The URLs of all public data files on TCGA DCC data server were gathered at Jan-05-2015. Only eight cancer types have enough normal control samples for differential expression analysis. (t test, adjusted p<0.05 (using Benjamini-Hochberg FDR)) |
 |
| Top |
| * This plots show the correlation between CNV and gene expression. |
: Open all plots for all cancer types
 |
|
 |
|

| Top |
| Gene-Gene Network Information |
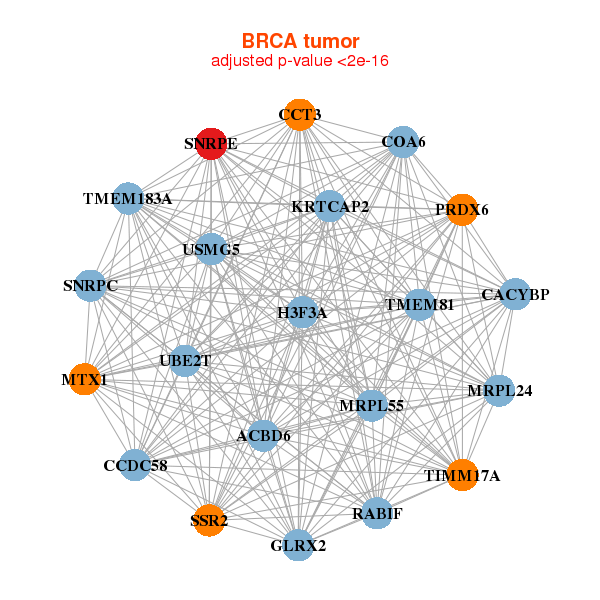
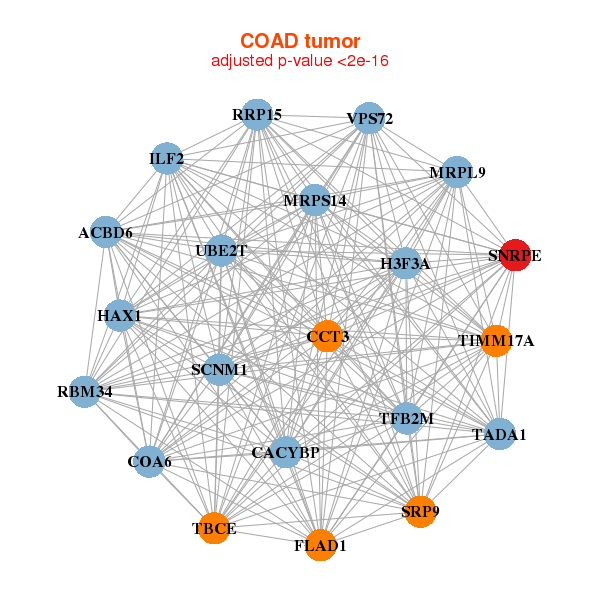
| * Co-Expression network figures were drawn using R package igraph. Only the top 20 genes with the highest correlations were shown. Red circle: input gene, orange circle: cell metabolism gene, sky circle: other gene |
: Open all plots for all cancer types
 |
|
| ACBD6,COA6,CACYBP,CCDC58,CCT3,GLRX2,H3F3A, KRTCAP2,MRPL24,MRPL55,MTX1,PRDX6,RABIF,SNRPC, SNRPE,SSR2,TIMM17A,TMEM183A,TMEM81,UBE2T,USMG5 | TMEM258,METTL23,CBX3,CISD2,COX16,EBPL,ERH, FAM103A1,GNRHR2,H3F3A,HPRT1,LSM5,NIFK,OSTC, C7orf73,PPA2,RPL22L1,RPL39,RSL24D1,SNRPE,TPRKB |
 |
|
| ACBD6,COA6,CACYBP,CCT3,FLAD1,H3F3A,HAX1, ILF2,MRPL9,MRPS14,RBM34,RRP15,SCNM1,SNRPE, SRP9,TADA1,TBCE,TFB2M,TIMM17A,UBE2T,VPS72 | COPS3,EEF1E1,ENOPH1,ERH,HAUS1,MAGOHB,NDUFAF2, PARK7,PDCD5,PPIL1,PSMD14,RAN,SARNP,SNRNP40, SNRPB2,SNRPE,SSBP1,TCEB1,TOMM5,TOMM6,VBP1 |
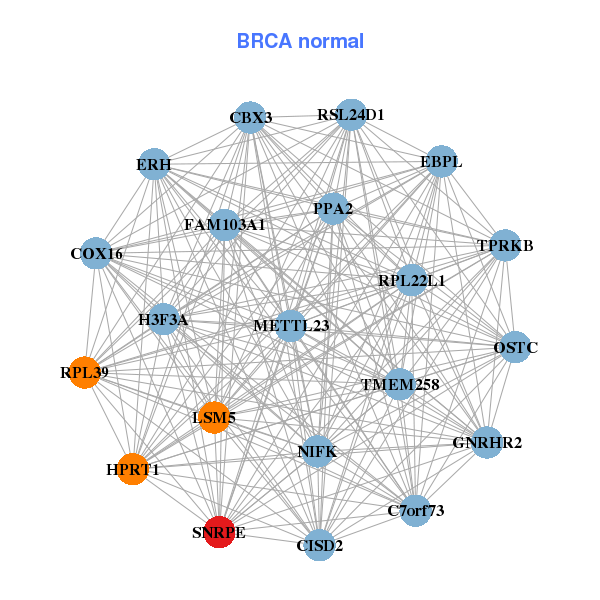
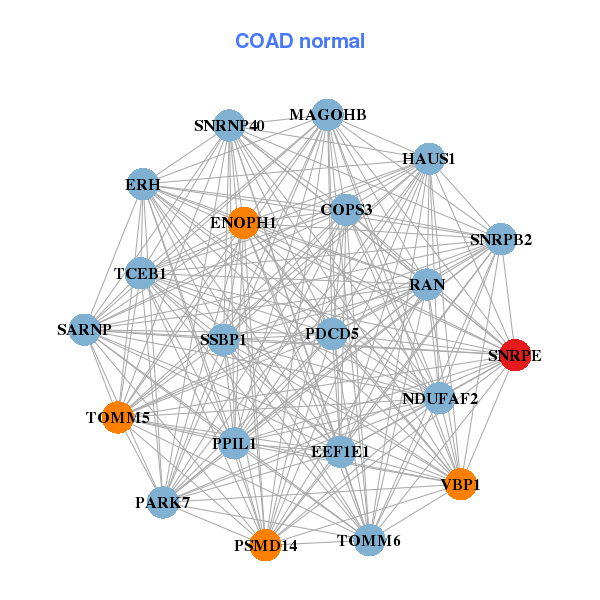
| * Co-Expression network figures were drawn using R package igraph. Only the top 20 genes with the highest correlations were shown. Red circle: input gene, orange circle: cell metabolism gene, sky circle: other gene |
: Open all plots for all cancer types
| Top |
: Open all interacting genes' information including KEGG pathway for all interacting genes from DAVID
| Top |
| Pharmacological Information for SNRPE |
| There's no related Drug. |
| Top |
| Cross referenced IDs for SNRPE |
| * We obtained these cross-references from Uniprot database. It covers 150 different DBs, 18 categories. http://www.uniprot.org/help/cross_references_section |
: Open all cross reference information
|
Copyright © 2016-Present - The Univsersity of Texas Health Science Center at Houston @ |