|
|||||||||||||||||||||||||||||||||||||||||||||||||||||||||||||||||||||||||||||||||||||||||||||||||||||||||||||||||||||||||||||||||||||||||||||||||||||||||||||||||||||||||||||||||||||||||||||||||||||||||||||||||||||||||||||||||||||||||||||||||||||||||||||||||||||||||||||||||||||||||||||||||||||||||||||||||||||||||||||||||||||||||||||||||||||||||||||||||||||||||||||||||||||||||||||||||||||||||||||||
| |
| Phenotypic Information (metabolism pathway, cancer, disease, phenome) |
| |
| |
| Gene-Gene Network Information: Co-Expression Network, Interacting Genes & KEGG |
| |
|


| Gene Summary for SREBF1 |
| Basic gene info. | Gene symbol | SREBF1 |
| Gene name | sterol regulatory element binding transcription factor 1 | |
| Synonyms | SREBP-1c|SREBP1|bHLHd1 | |
| Cytomap | UCSC genome browser: 17p11.2 | |
| Genomic location | chr17 :17714662-17740325 | |
| Type of gene | protein-coding | |
| RefGenes | NM_001005291.2, NM_004176.4, | |
| Ensembl id | ENSG00000072310 | |
| Description | SREBP-1class D basic helix-loop-helix protein 1sterol regulatory element-binding protein 1 | |
| Modification date | 20141222 | |
| dbXrefs | MIM : 184756 | |
| HGNC : HGNC | ||
| Ensembl : ENSG00000072310 | ||
| HPRD : 01701 | ||
| Vega : OTTHUMG00000059313 | ||
| Protein | UniProt: P36956 go to UniProt's Cross Reference DB Table | |
| Expression | CleanEX: HS_SREBF1 | |
| BioGPS: 6720 | ||
| Gene Expression Atlas: ENSG00000072310 | ||
| The Human Protein Atlas: ENSG00000072310 | ||
| Pathway | NCI Pathway Interaction Database: SREBF1 | |
| KEGG: SREBF1 | ||
| REACTOME: SREBF1 | ||
| ConsensusPathDB | ||
| Pathway Commons: SREBF1 | ||
| Metabolism | MetaCyc: SREBF1 | |
| HUMANCyc: SREBF1 | ||
| Regulation | Ensembl's Regulation: ENSG00000072310 | |
| miRBase: chr17 :17,714,662-17,740,325 | ||
| TargetScan: NM_001005291 | ||
| cisRED: ENSG00000072310 | ||
| Context | iHOP: SREBF1 | |
| cancer metabolism search in PubMed: SREBF1 | ||
| UCL Cancer Institute: SREBF1 | ||
| Assigned class in ccmGDB | A - This gene has a literature evidence and it belongs to cancer gene. | |
| References showing role of SREBF1 in cancer cell metabolism | 1. Luckert C, Hessel S, Lenze D, Lampen A (2015) Disturbance of gene expression in primary human hepatocytes by hepatotoxic pyrrolizidine alkaloids: A whole genome transcriptome analysis. Toxicology in Vitro 29: 1669-1682. go to article | |
| Top |
| Phenotypic Information for SREBF1(metabolism pathway, cancer, disease, phenome) |
| Cancer | CGAP: SREBF1 |
| Familial Cancer Database: SREBF1 | |
| * This gene is included in those cancer gene databases. |
|
|
|
|
|
| . | |||||||||||||||||||||||||||||||||||||||||||||||||||||||||||||||||||||||||||||||||||||||||||||||||||||||||||||||||||||||||||||||||||||||||||||||||||||||||||||||||||||||||||||||||||||||||||||||||||||||||||||||||||||||||||||||||||||||||||||||||||||||||||||||||||||||||||||||||||||||||||||||||||||||||||||||||||||||||||||||||||||||||||||||||||||||||||||||||||||||||||||||||||||||||||||||||||||||||
Oncogene 1 | Significant driver gene in | ||||||||||||||||||||||||||||||||||||||||||||||||||||||||||||||||||||||||||||||||||||||||||||||||||||||||||||||||||||||||||||||||||||||||||||||||||||||||||||||||||||||||||||||||||||||||||||||||||||||||||||||||||||||||||||||||||||||||||||||||||||||||||||||||||||||||||||||||||||||||||||||||||||||||||||||||||||||||||||||||||||||||||||||||||||||||||||||||||||||||||||||||||||||||||||||||||||||||||||||
| cf) number; DB name 1 Oncogene; http://nar.oxfordjournals.org/content/35/suppl_1/D721.long, 2 Tumor Suppressor gene; https://bioinfo.uth.edu/TSGene/, 3 Cancer Gene Census; http://www.nature.com/nrc/journal/v4/n3/abs/nrc1299.html, 4 CancerGenes; http://nar.oxfordjournals.org/content/35/suppl_1/D721.long, 5 Network of Cancer Gene; http://ncg.kcl.ac.uk/index.php, 1Therapeutic Vulnerabilities in Cancer; http://cbio.mskcc.org/cancergenomics/statius/ |
| REACTOME_METABOLISM_OF_LIPIDS_AND_LIPOPROTEINS | |
| OMIM | 184756; gene. 184756; gene. |
| Orphanet | |
| Disease | KEGG Disease: SREBF1 |
| MedGen: SREBF1 (Human Medical Genetics with Condition) | |
| ClinVar: SREBF1 | |
| Phenotype | MGI: SREBF1 (International Mouse Phenotyping Consortium) |
| PhenomicDB: SREBF1 | |
| Mutations for SREBF1 |
| * Under tables are showing count per each tissue to give us broad intuition about tissue specific mutation patterns.You can go to the detailed page for each mutation database's web site. |
| - Statistics for Tissue and Mutation type | Top |
 |
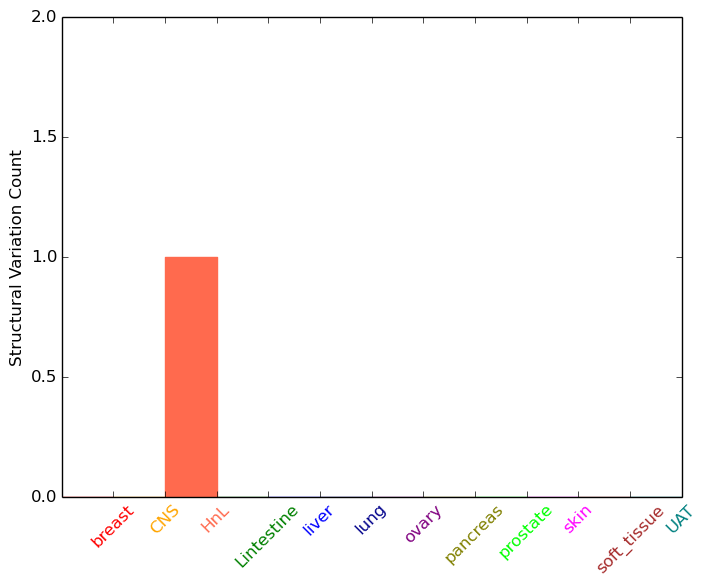
| - For Inter-chromosomal Variations |
| * Inter-chromosomal variantions includes 'interchromosomal amplicon to amplicon', 'interchromosomal amplicon to non-amplified dna', 'interchromosomal insertion', 'Interchromosomal unknown type'. |
 |
| - For Intra-chromosomal Variations |
| There's no intra-chromosomal structural variation. |
| Sample | Symbol_a | Chr_a | Start_a | End_a | Symbol_b | Chr_b | Start_b | End_b |
| haematopoietic_and_lymphoid_tissue | SREBF1 | chr17 | 17734394 | 17734394 | chr5 | 177610246 | 177610246 |
| cf) Tissue number; Tissue name (1;Breast, 2;Central_nervous_system, 3;Haematopoietic_and_lymphoid_tissue, 4;Large_intestine, 5;Liver, 6;Lung, 7;Ovary, 8;Pancreas, 9;Prostate, 10;Skin, 11;Soft_tissue, 12;Upper_aerodigestive_tract) |
| * From mRNA Sanger sequences, Chitars2.0 arranged chimeric transcripts. This table shows SREBF1 related fusion information. |
| ID | Head Gene | Tail Gene | Accession | Gene_a | qStart_a | qEnd_a | Chromosome_a | tStart_a | tEnd_a | Gene_a | qStart_a | qEnd_a | Chromosome_a | tStart_a | tEnd_a |
| BG009780 | SREBF1 | 14 | 135 | 17 | 17722426 | 17722547 | C12orf10 | 135 | 258 | 12 | 53696817 | 53696940 | |
| BM975798 | RAI1 | 12 | 360 | 17 | 17714663 | 17721040 | SREBF1 | 360 | 468 | 17 | 17720412 | 17720639 | |
| DA092279 | UBE2E3 | 1 | 385 | 2 | 181881546 | 181881928 | SREBF1 | 381 | 499 | 17 | 17722911 | 17723029 | |
| Top |
| Mutation type/ Tissue ID | brca | cns | cerv | endome | haematopo | kidn | Lintest | liver | lung | ns | ovary | pancre | prost | skin | stoma | thyro | urina | |||
| Total # sample | 1 | 1 | ||||||||||||||||||
| GAIN (# sample) | 1 | 1 | ||||||||||||||||||
| LOSS (# sample) |
| cf) Tissue ID; Tissue type (1; Breast, 2; Central_nervous_system, 3; Cervix, 4; Endometrium, 5; Haematopoietic_and_lymphoid_tissue, 6; Kidney, 7; Large_intestine, 8; Liver, 9; Lung, 10; NS, 11; Ovary, 12; Pancreas, 13; Prostate, 14; Skin, 15; Stomach, 16; Thyroid, 17; Urinary_tract) |
| Top |
|
 |
| Top |
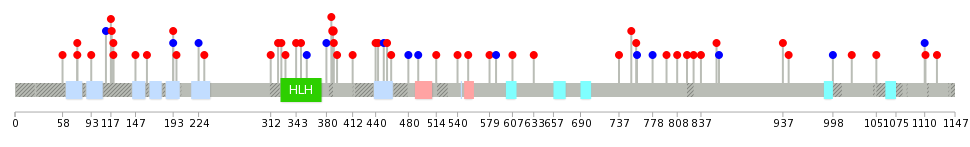
| Stat. for Non-Synonymous SNVs (# total SNVs=55) | (# total SNVs=16) |
 |  |
(# total SNVs=1) | (# total SNVs=0) |
 |
| Top |
| * When you move the cursor on each content, you can see more deailed mutation information on the Tooltip. Those are primary_site,primary_histology,mutation(aa),pubmedID. |
| GRCh37 position | Mutation(aa) | Unique sampleID count |
| chr17:17723785-17723785 | p.D78Y | 3 |
| chr17:17719517-17719517 | p.? | 2 |
| chr17:17722901-17722901 | p.T251M | 2 |
| chr17:17719811-17719811 | p.A699A | 2 |
| chr17:17719818-17719818 | p.R697Q | 2 |
| chr17:17717044-17717044 | p.R1011C | 2 |
| chr17:17721595-17721595 | p.R418C | 2 |
| chr17:17726899-17726899 | p.G38G | 2 |
| chr17:17717999-17717999 | p.R919W | 2 |
| chr17:17721038-17721038 | p.P489H | 2 |
| Top |
|
 |
| Point Mutation/ Tissue ID | 1 | 2 | 3 | 4 | 5 | 6 | 7 | 8 | 9 | 10 | 11 | 12 | 13 | 14 | 15 | 16 | 17 | 18 | 19 | 20 |
| # sample | 4 | 1 | 2 | 8 | 1 | 3 | 3 | 2 | 4 | 3 | 1 | 8 | 13 | 1 | 3 | |||||
| # mutation | 4 | 1 | 3 | 9 | 1 | 3 | 3 | 2 | 4 | 3 | 1 | 8 | 14 | 1 | 3 | |||||
| nonsynonymous SNV | 4 | 1 | 2 | 8 | 1 | 2 | 1 | 2 | 3 | 3 | 1 | 5 | 9 | 1 | 3 | |||||
| synonymous SNV | 1 | 1 | 1 | 2 | 1 | 3 | 5 |
| cf) Tissue ID; Tissue type (1; BLCA[Bladder Urothelial Carcinoma], 2; BRCA[Breast invasive carcinoma], 3; CESC[Cervical squamous cell carcinoma and endocervical adenocarcinoma], 4; COAD[Colon adenocarcinoma], 5; GBM[Glioblastoma multiforme], 6; Glioma Low Grade, 7; HNSC[Head and Neck squamous cell carcinoma], 8; KICH[Kidney Chromophobe], 9; KIRC[Kidney renal clear cell carcinoma], 10; KIRP[Kidney renal papillary cell carcinoma], 11; LAML[Acute Myeloid Leukemia], 12; LUAD[Lung adenocarcinoma], 13; LUSC[Lung squamous cell carcinoma], 14; OV[Ovarian serous cystadenocarcinoma ], 15; PAAD[Pancreatic adenocarcinoma], 16; PRAD[Prostate adenocarcinoma], 17; SKCM[Skin Cutaneous Melanoma], 18:STAD[Stomach adenocarcinoma], 19:THCA[Thyroid carcinoma], 20:UCEC[Uterine Corpus Endometrial Carcinoma]) |
| Top |
| * We represented just top 10 SNVs. When you move the cursor on each content, you can see more deailed mutation information on the Tooltip. Those are primary_site, primary_histology, mutation(aa), pubmedID. |
| Genomic Position | Mutation(aa) | Unique sampleID count |
| chr17:17721595 | p.R388C,SREBF1 | 2 |
| chr17:17720635 | p.I859I,SREBF1 | 1 |
| chr17:17723594 | p.N553S,SREBF1 | 1 |
| chr17:17716991 | p.K356K,SREBF1 | 1 |
| chr17:17719280 | p.P118H,SREBF1 | 1 |
| chr17:17722891 | p.S856N,SREBF1 | 1 |
| chr17:17720700 | p.W540G,SREBF1 | 1 |
| chr17:17723649 | p.L349M,SREBF1 | 1 |
| chr17:17717630 | p.S117F,SREBF1 | 1 |
| chr17:17721600 | p.L837F,SREBF1 | 1 |
| * Copy number data were extracted from TCGA using R package TCGA-Assembler. The URLs of all public data files on TCGA DCC data server were gathered on Jan-05-2015. Function ProcessCNAData in TCGA-Assembler package was used to obtain gene-level copy number value which is calculated as the average copy number of the genomic region of a gene. |
 |
| cf) Tissue ID[Tissue type]: BLCA[Bladder Urothelial Carcinoma], BRCA[Breast invasive carcinoma], CESC[Cervical squamous cell carcinoma and endocervical adenocarcinoma], COAD[Colon adenocarcinoma], GBM[Glioblastoma multiforme], Glioma Low Grade, HNSC[Head and Neck squamous cell carcinoma], KICH[Kidney Chromophobe], KIRC[Kidney renal clear cell carcinoma], KIRP[Kidney renal papillary cell carcinoma], LAML[Acute Myeloid Leukemia], LUAD[Lung adenocarcinoma], LUSC[Lung squamous cell carcinoma], OV[Ovarian serous cystadenocarcinoma ], PAAD[Pancreatic adenocarcinoma], PRAD[Prostate adenocarcinoma], SKCM[Skin Cutaneous Melanoma], STAD[Stomach adenocarcinoma], THCA[Thyroid carcinoma], UCEC[Uterine Corpus Endometrial Carcinoma] |
| Top |
| Gene Expression for SREBF1 |
| * CCLE gene expression data were extracted from CCLE_Expression_Entrez_2012-10-18.res: Gene-centric RMA-normalized mRNA expression data. |
 |
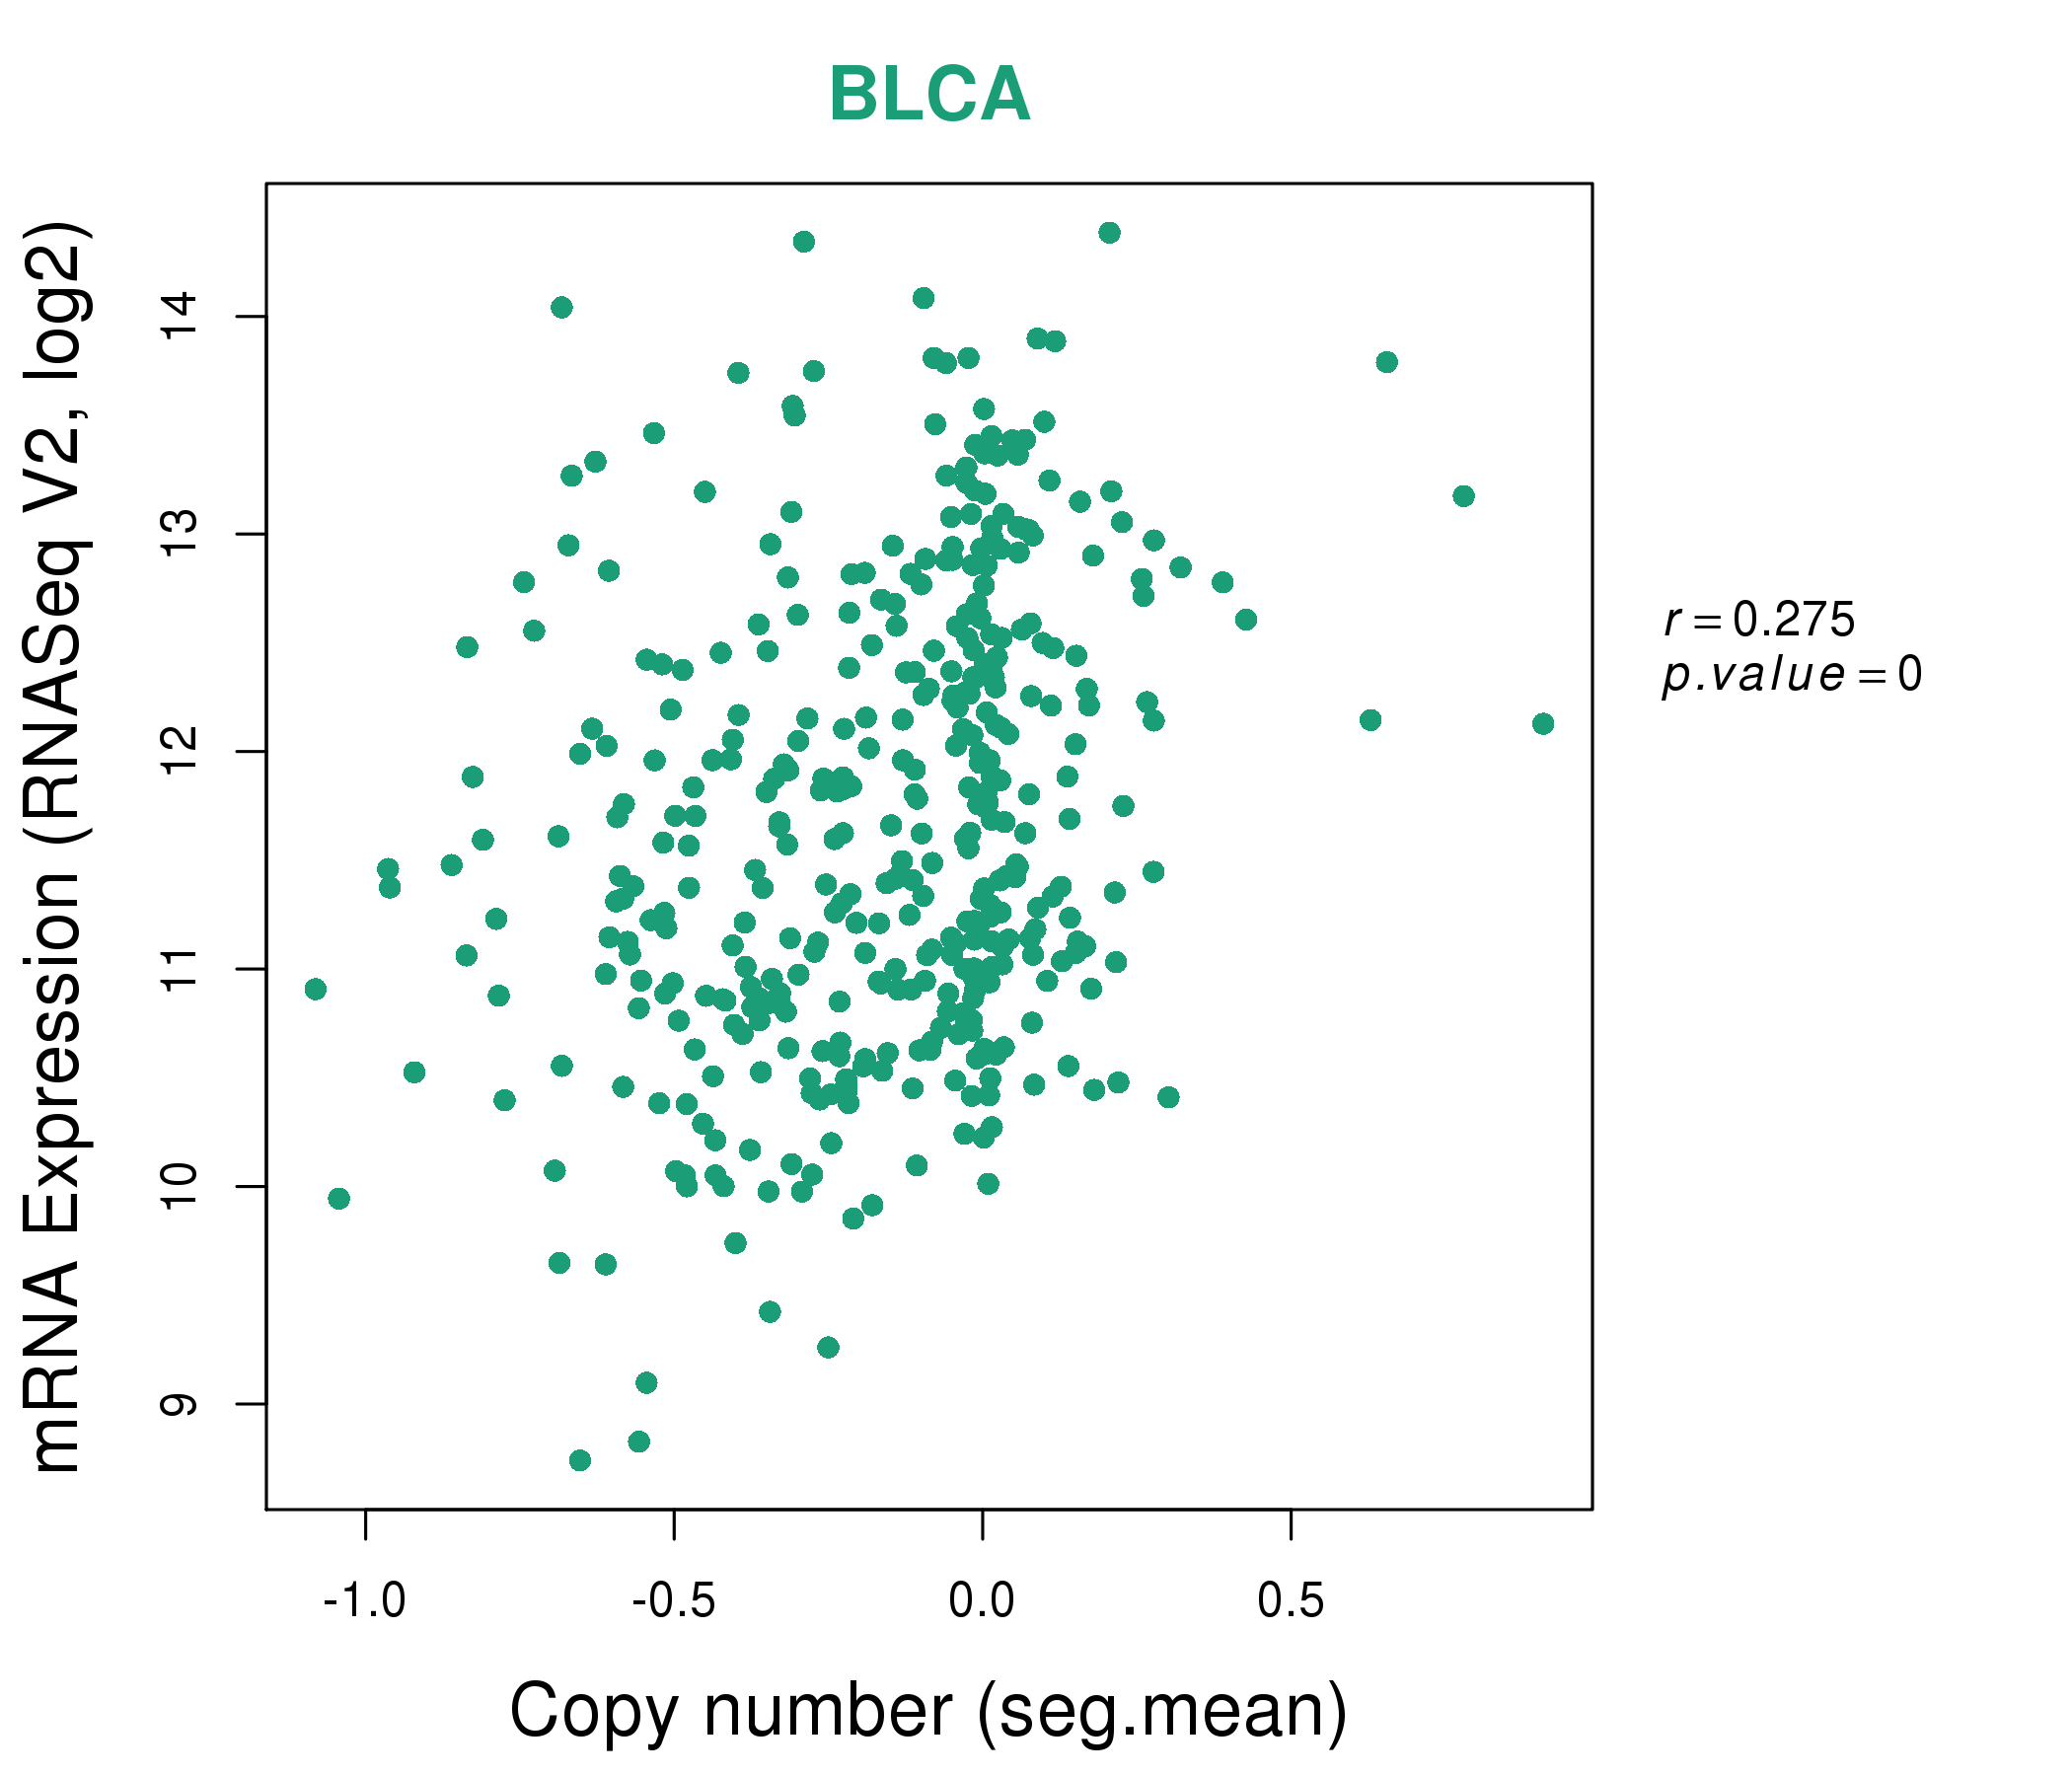
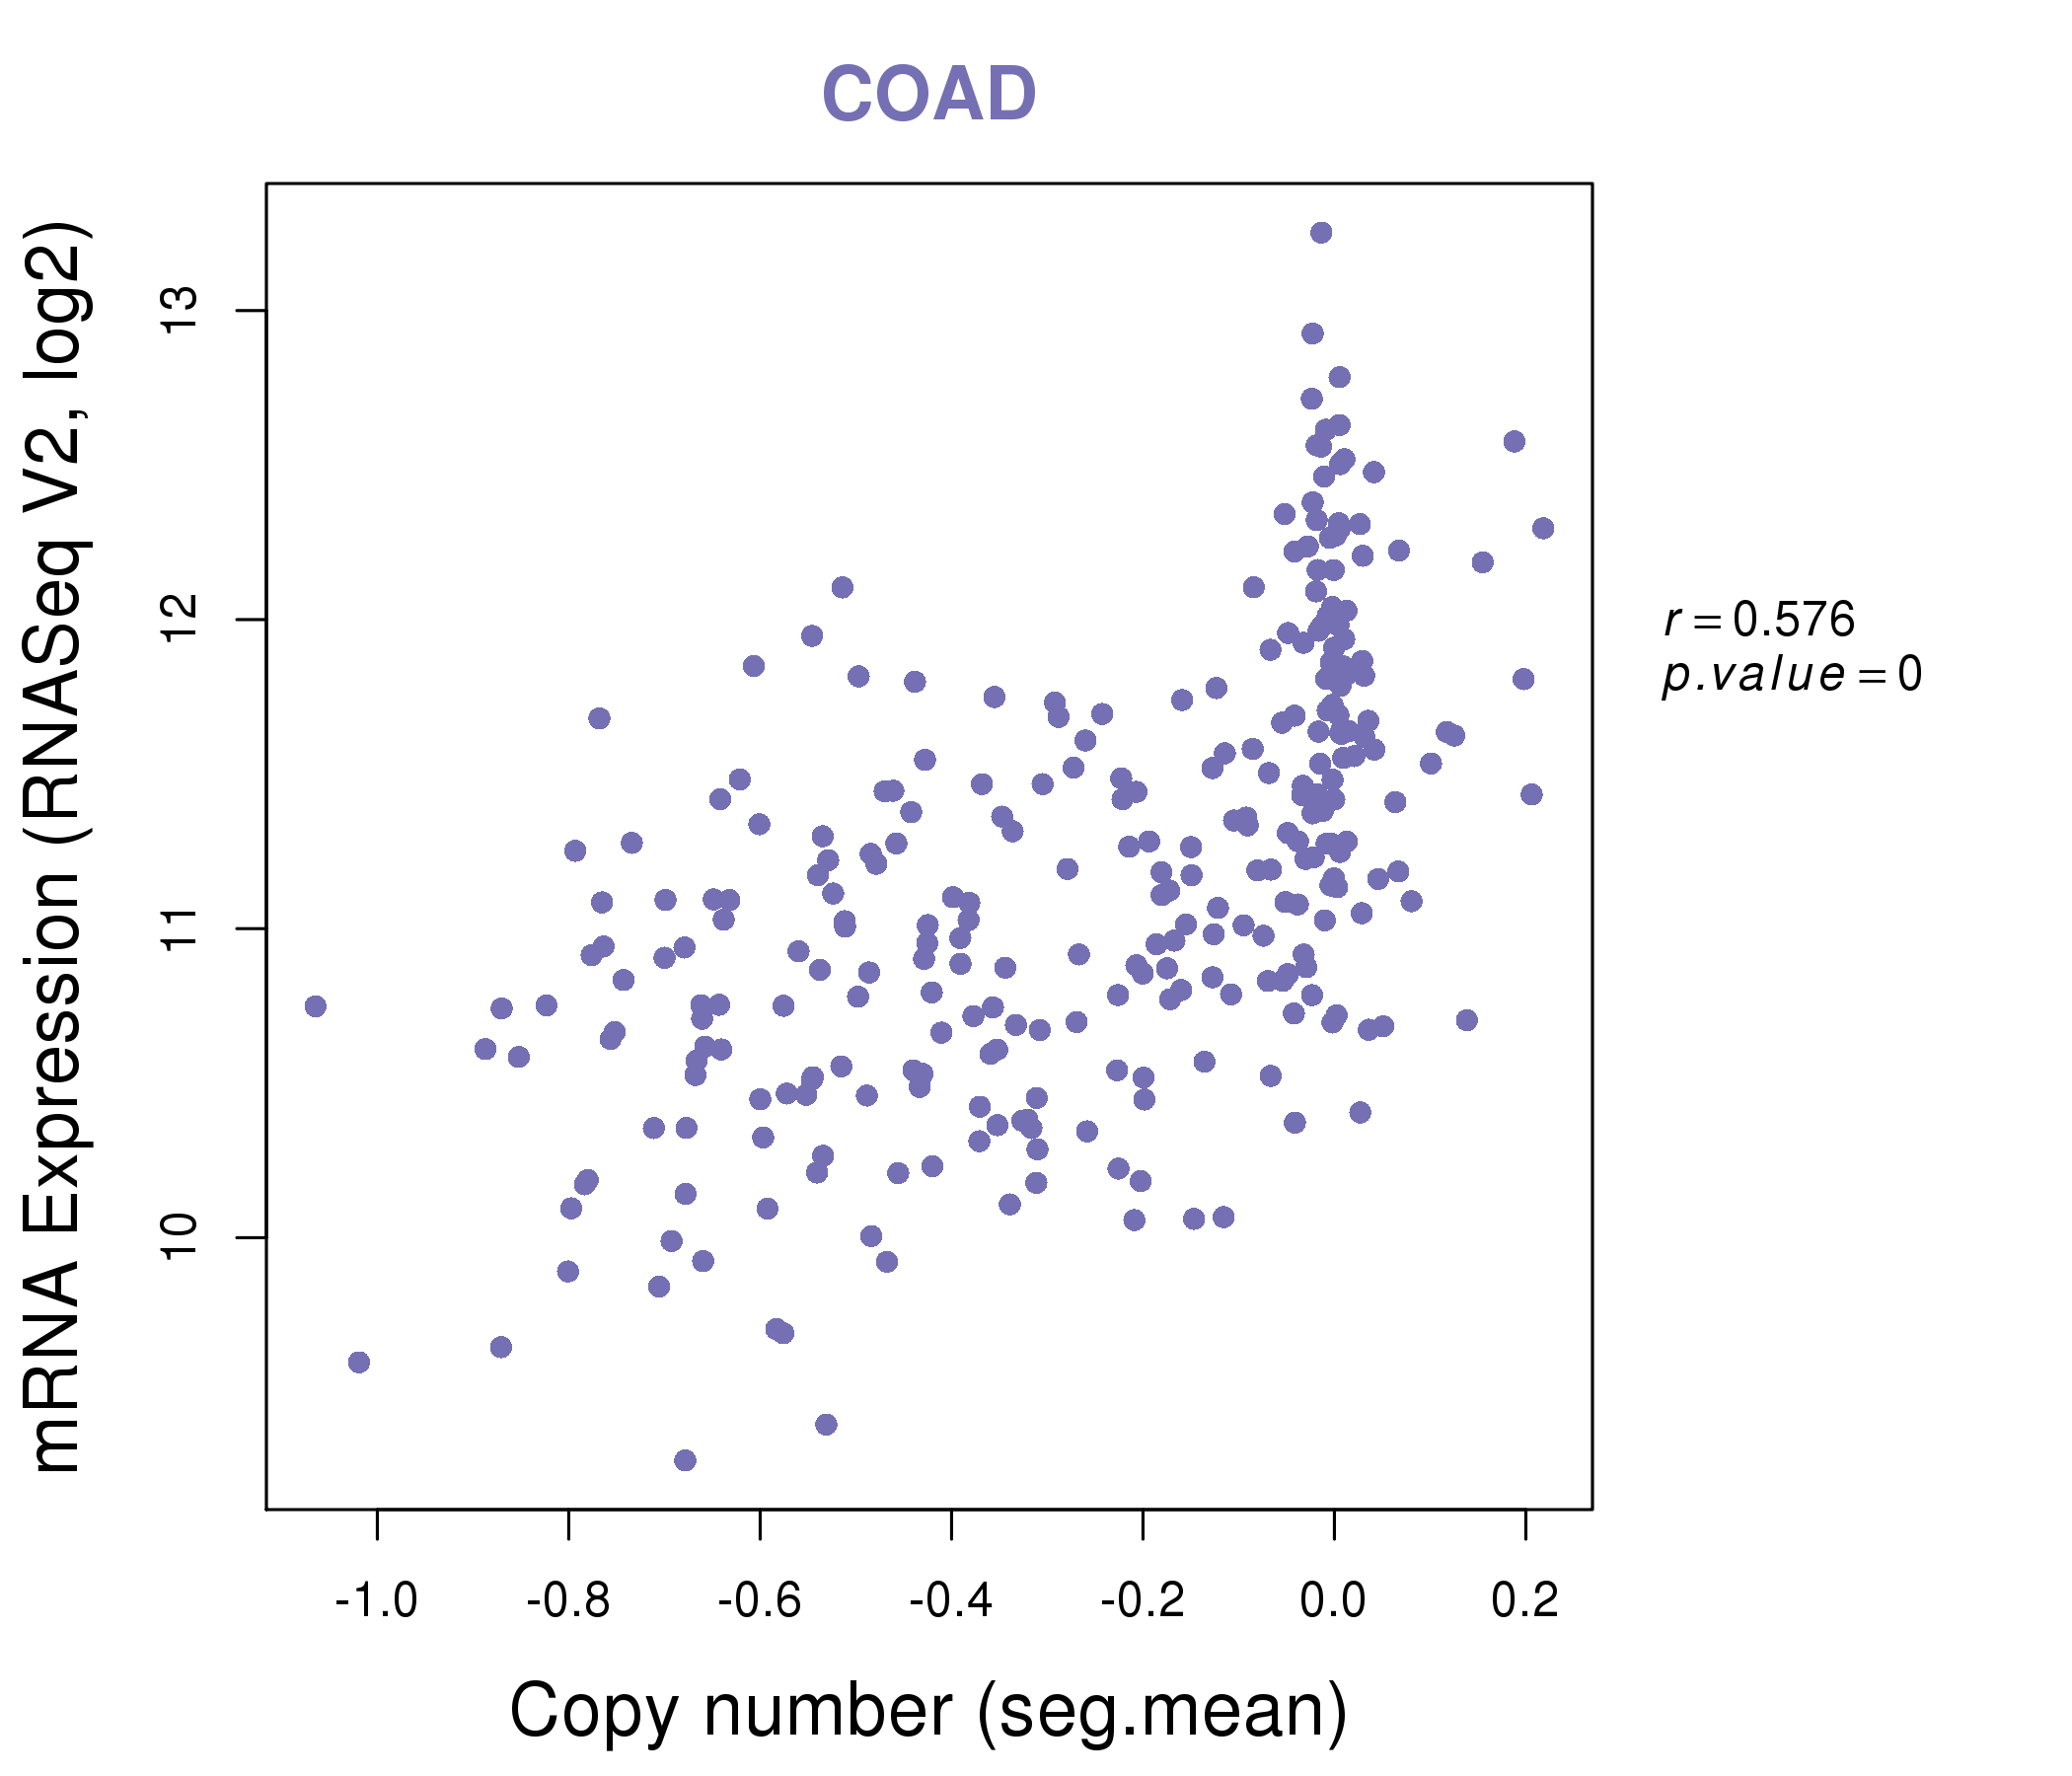
| * Normalized gene expression data of RNASeqV2 was extracted from TCGA using R package TCGA-Assembler. The URLs of all public data files on TCGA DCC data server were gathered at Jan-05-2015. Only eight cancer types have enough normal control samples for differential expression analysis. (t test, adjusted p<0.05 (using Benjamini-Hochberg FDR)) |
 |
| Top |
| * This plots show the correlation between CNV and gene expression. |
: Open all plots for all cancer types
 |
|
 |
|


| Top |
| Gene-Gene Network Information |
| * Co-Expression network figures were drawn using R package igraph. Only the top 20 genes with the highest correlations were shown. Red circle: input gene, orange circle: cell metabolism gene, sky circle: other gene |
: Open all plots for all cancer types
 |
| ||||
| ABCA3,APEH,ATPAF2,LINC00263,CYB561D2,DALRD3,FASN, IVD,MFSD7,MYO1C,NPRL2,P4HTM,RAI1,RTN4RL1, SCD,MIEF2,SREBF1,TMEM25,TNK1,TOM1L2,TTC36 | ACAT2,ARHGEF16,CTNNBIP1,CYB561,CYB561D2,EBP,FDPS, FIBCD1,G6PD,GMPPB,IGSF8,IVD,MMAB,MVD, MVK,NUDT8,PEX10,REEP6,SREBF1,TMEM63B,TOLLIP | ||||
 |
| ||||
| ATP5A1,CDC42EP1,COX10,CTDNEP1,ELAC2,FLII,GEMIN4, CLUH,LPIN1,MINK1,PCSK9,RAI1,RNMTL1,SCO1, SREBF1,TMEM102,TNFSF13,TNK1,TRIM16,USP43,WRAP53 | ACLY,ALDH16A1,CDC42BPB,CDRT15P1,DAZAP1,DDX54,DOT1L, EVPL,HTT,KLF16,TONSL,NUDT16,PCLO,PCSK5, PHRF1,PTGER1,SLC38A10,SMAD6,SREBF1,TTLL4,ZNF598 |


| * Co-Expression network figures were drawn using R package igraph. Only the top 20 genes with the highest correlations were shown. Red circle: input gene, orange circle: cell metabolism gene, sky circle: other gene |
: Open all plots for all cancer types
| Top |
: Open all interacting genes' information including KEGG pathway for all interacting genes from DAVID
| Top |
| Pharmacological Information for SREBF1 |
| DB Category | DB Name | DB's ID and Url link |
| Organism-specific databases | PharmGKB | PA335; -. |
| Organism-specific databases | PharmGKB | PA335; -. |
| Organism-specific databases | CTD | 6720; -. |
| Organism-specific databases | CTD | 6720; -. |
| * Gene Centered Interaction Network. |
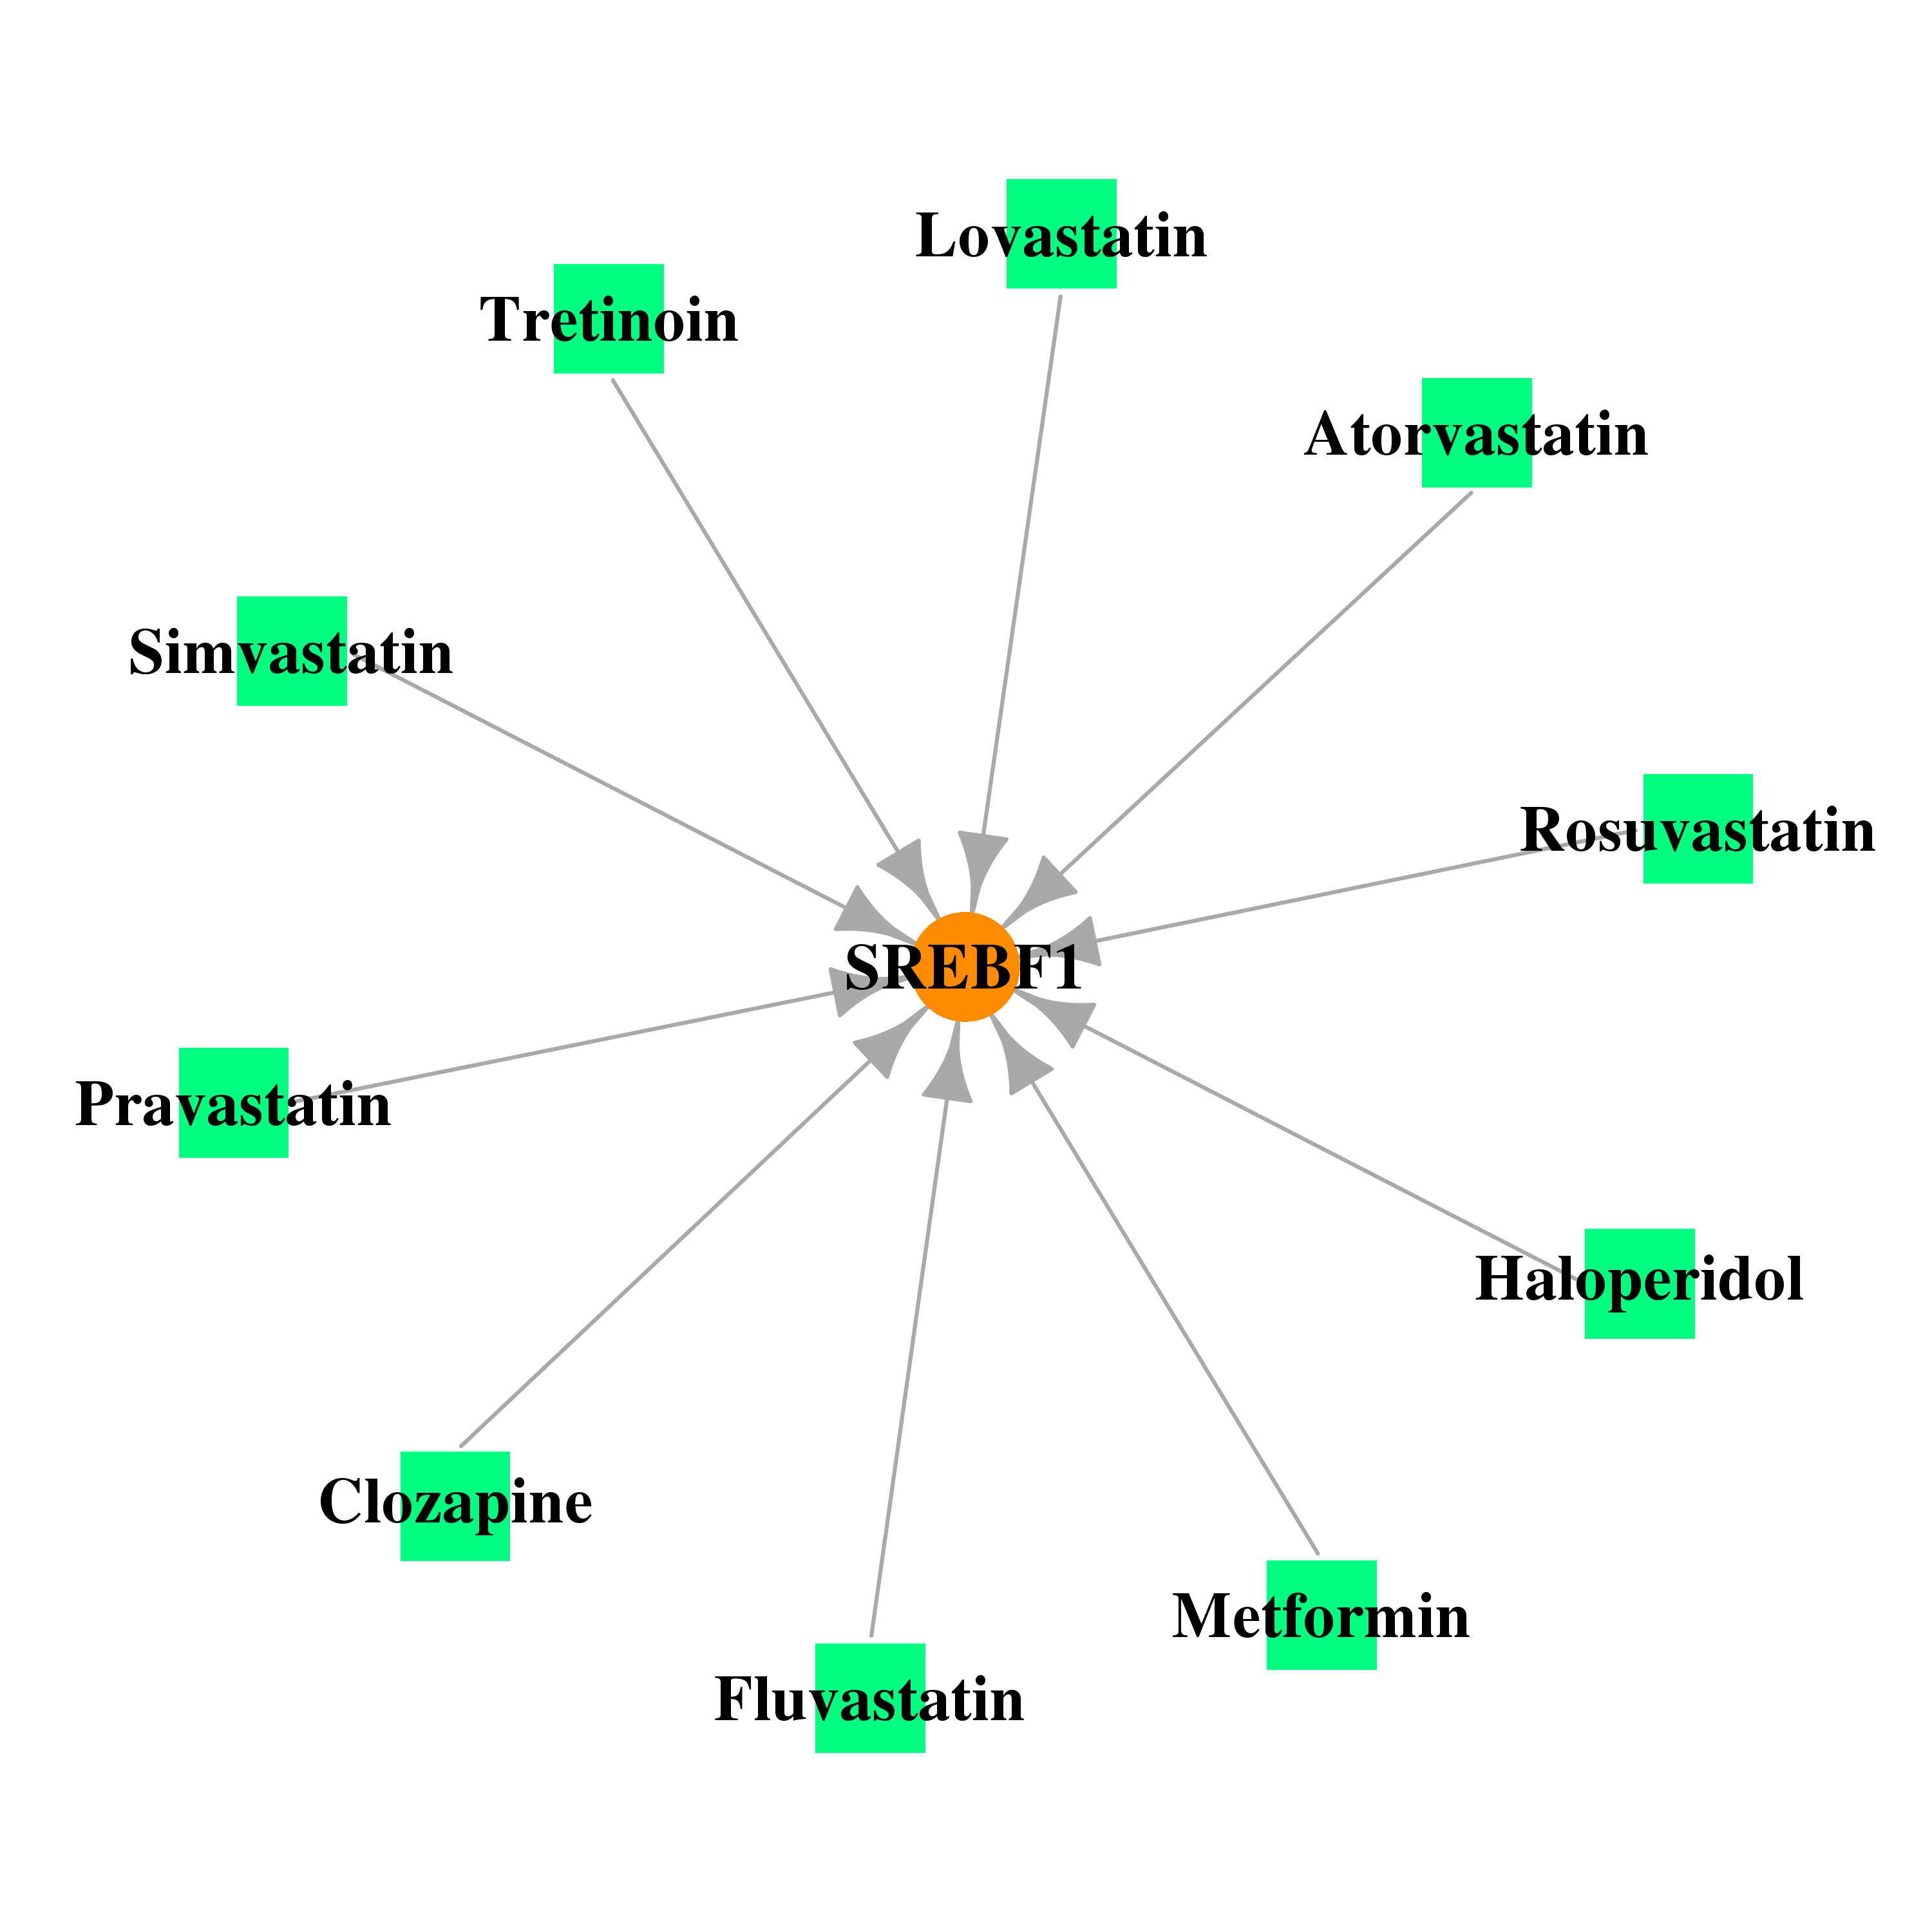 |
| * Drug Centered Interaction Network. |
| DrugBank ID | Target Name | Drug Groups | Generic Name | Drug Centered Network | Drug Structure |
| DB00363 | sterol regulatory element binding transcription factor 1 | approved | Clozapine | 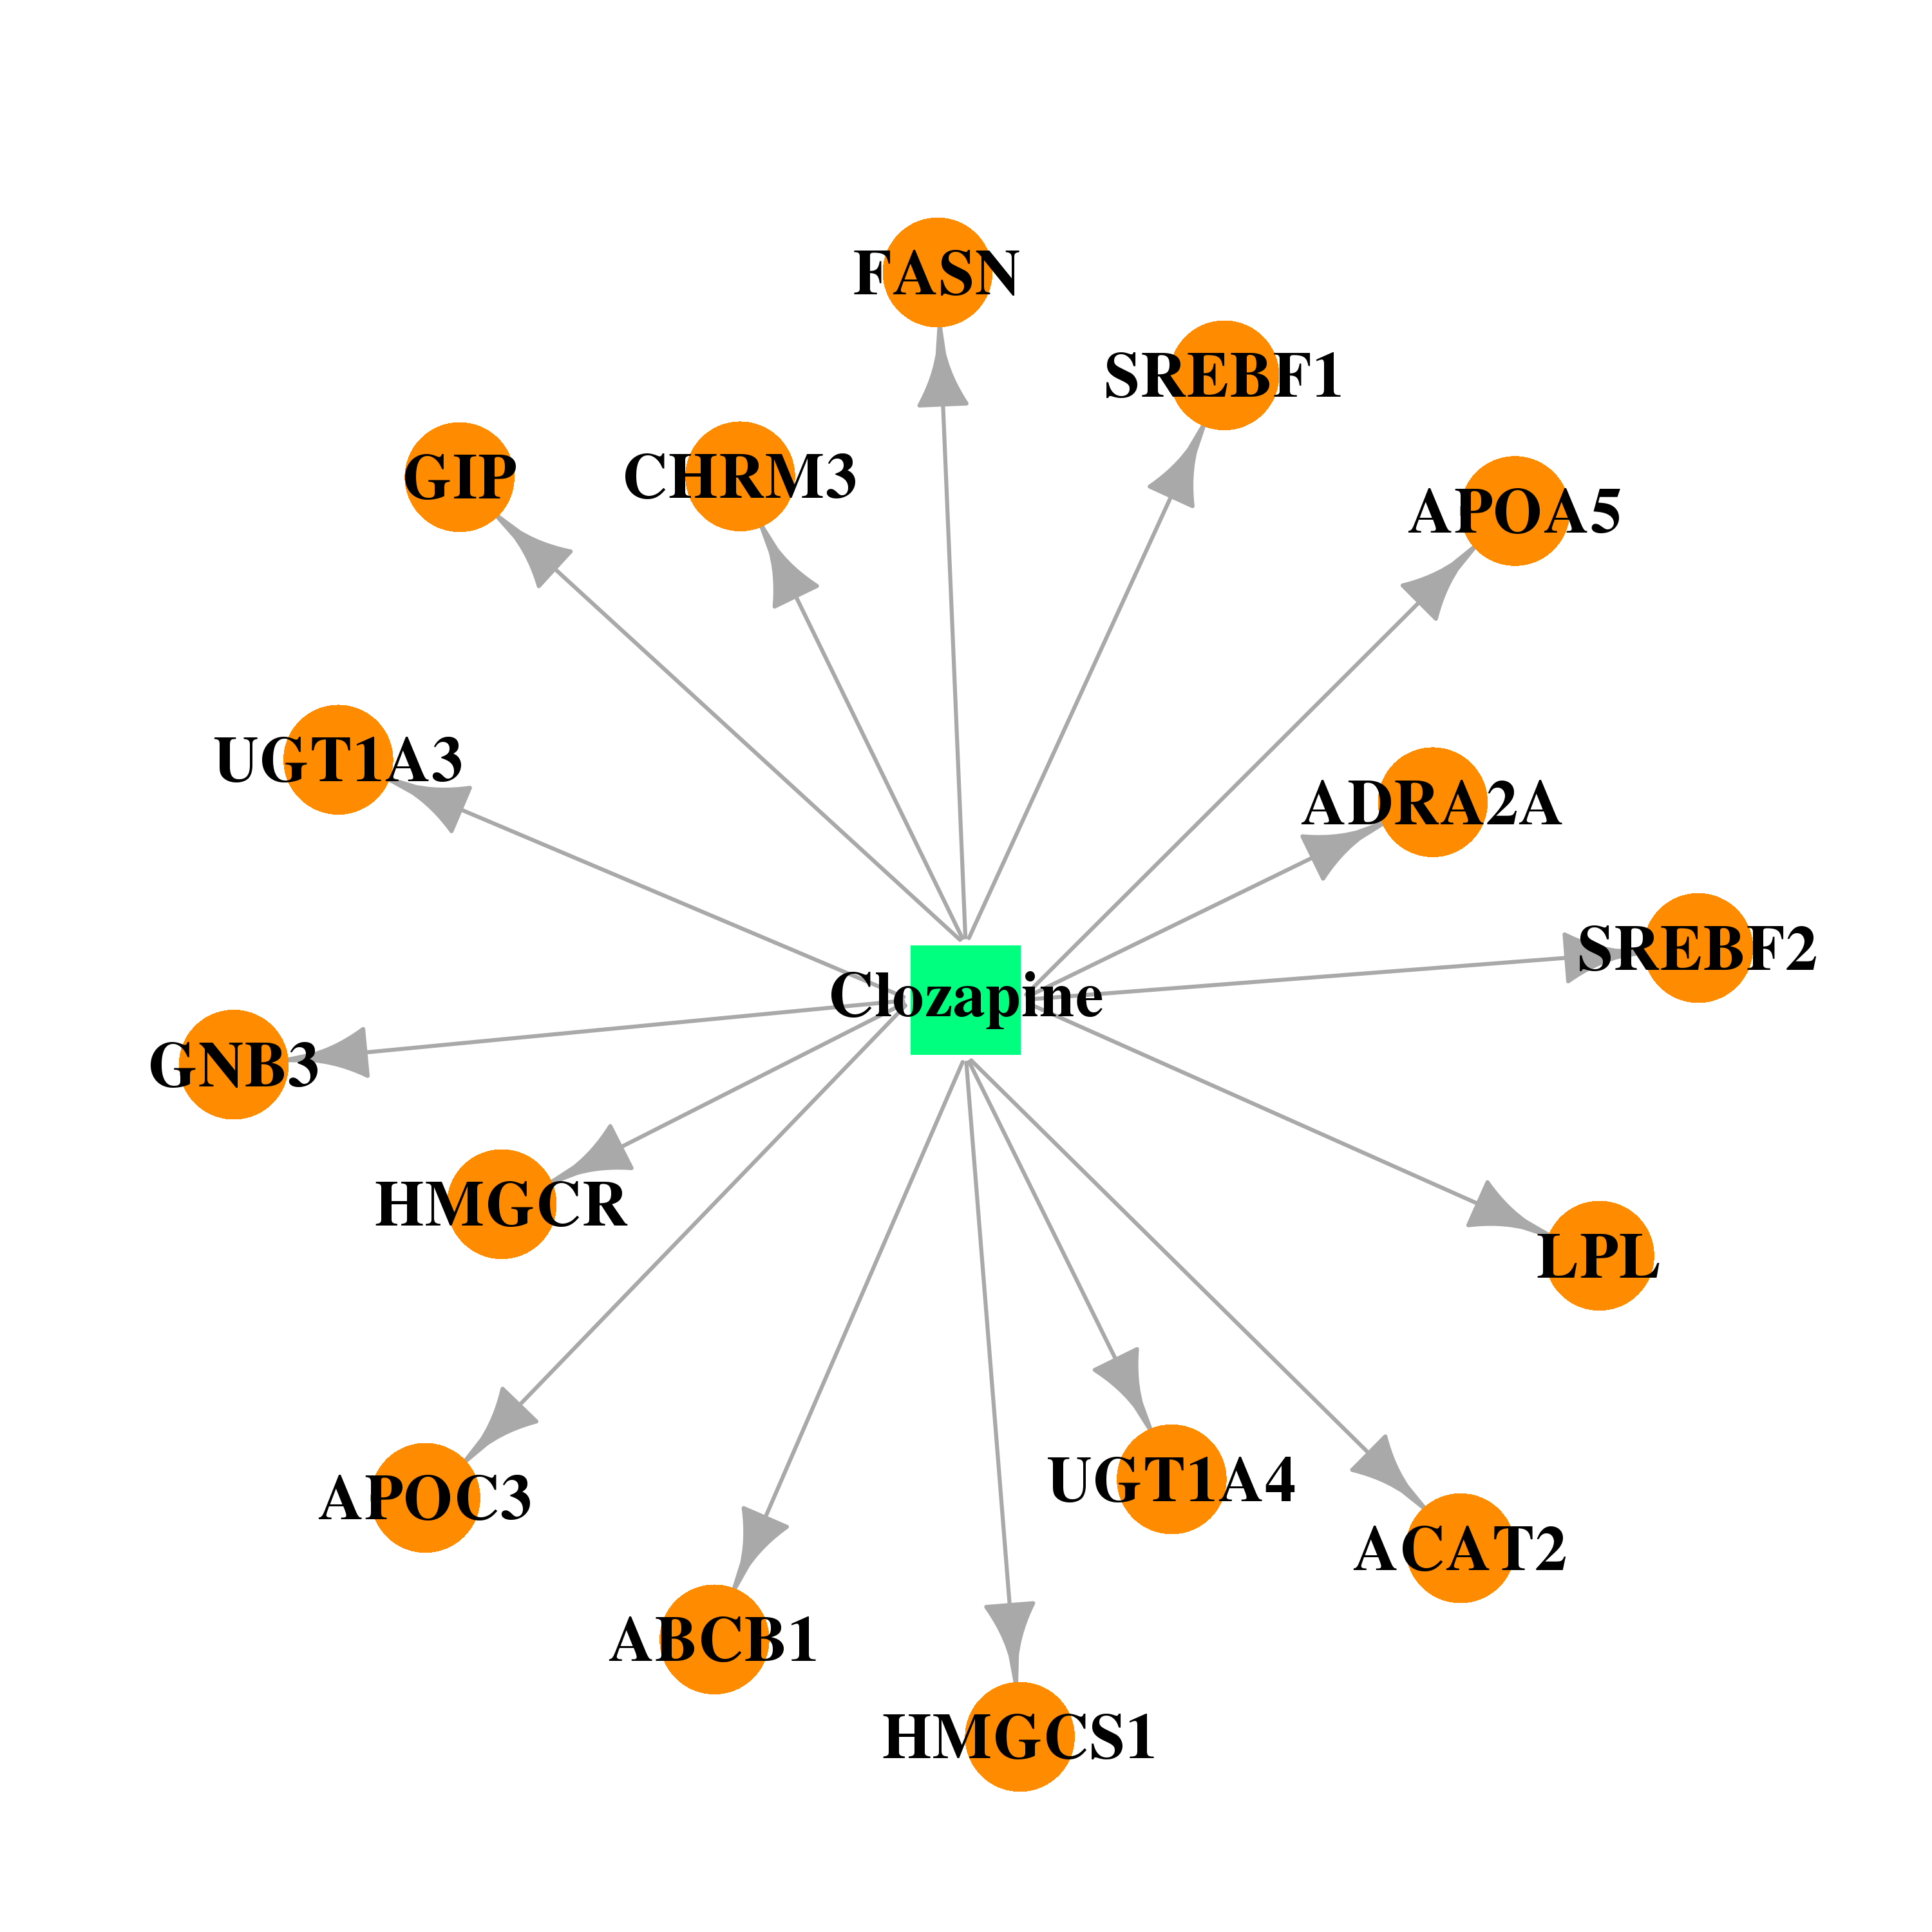 | 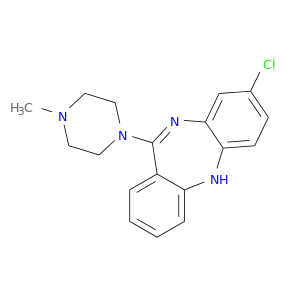 |
| DB00502 | sterol regulatory element binding transcription factor 1 | approved | Haloperidol |  | 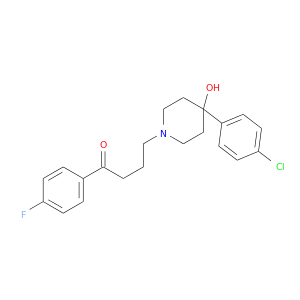 |
| DB00755 | sterol regulatory element binding transcription factor 1 | approved; nutraceutical; investigational | Tretinoin | 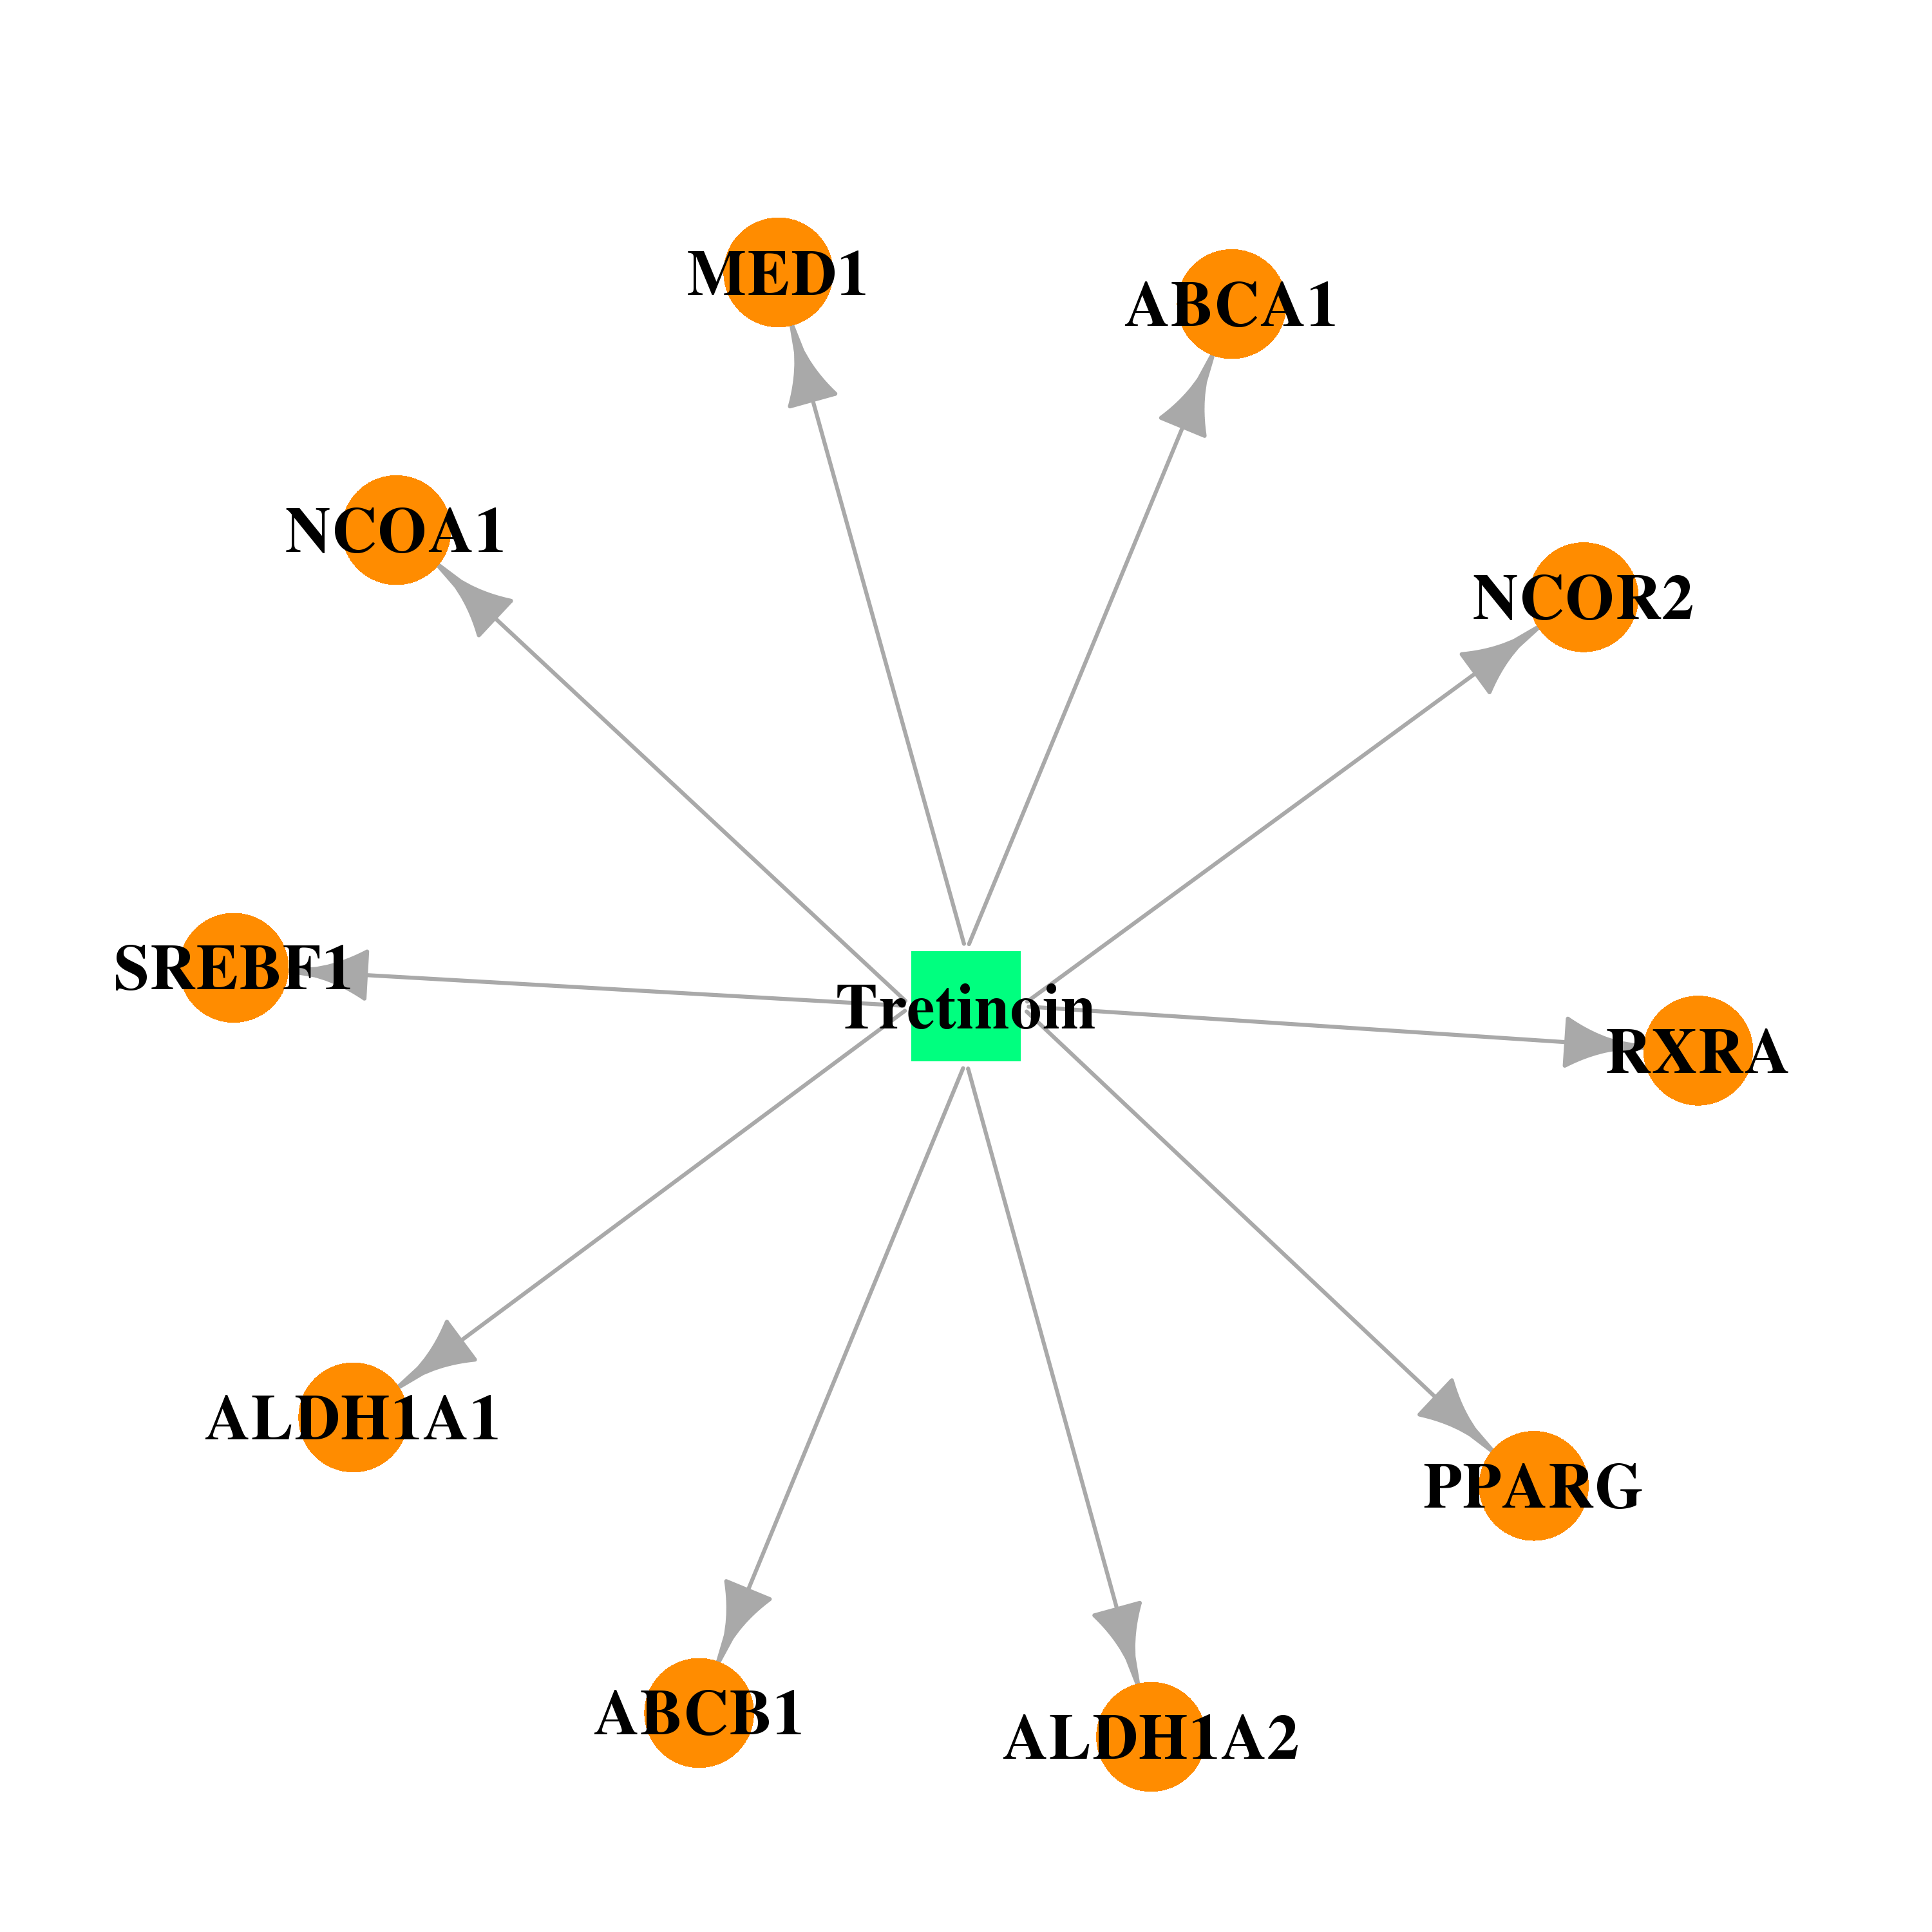 | 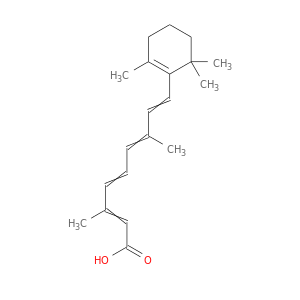 |
| DB00331 | sterol regulatory element binding transcription factor 1 | approved | Metformin |  |  |
| DB01076 | sterol regulatory element binding transcription factor 1 | approved | Atorvastatin | 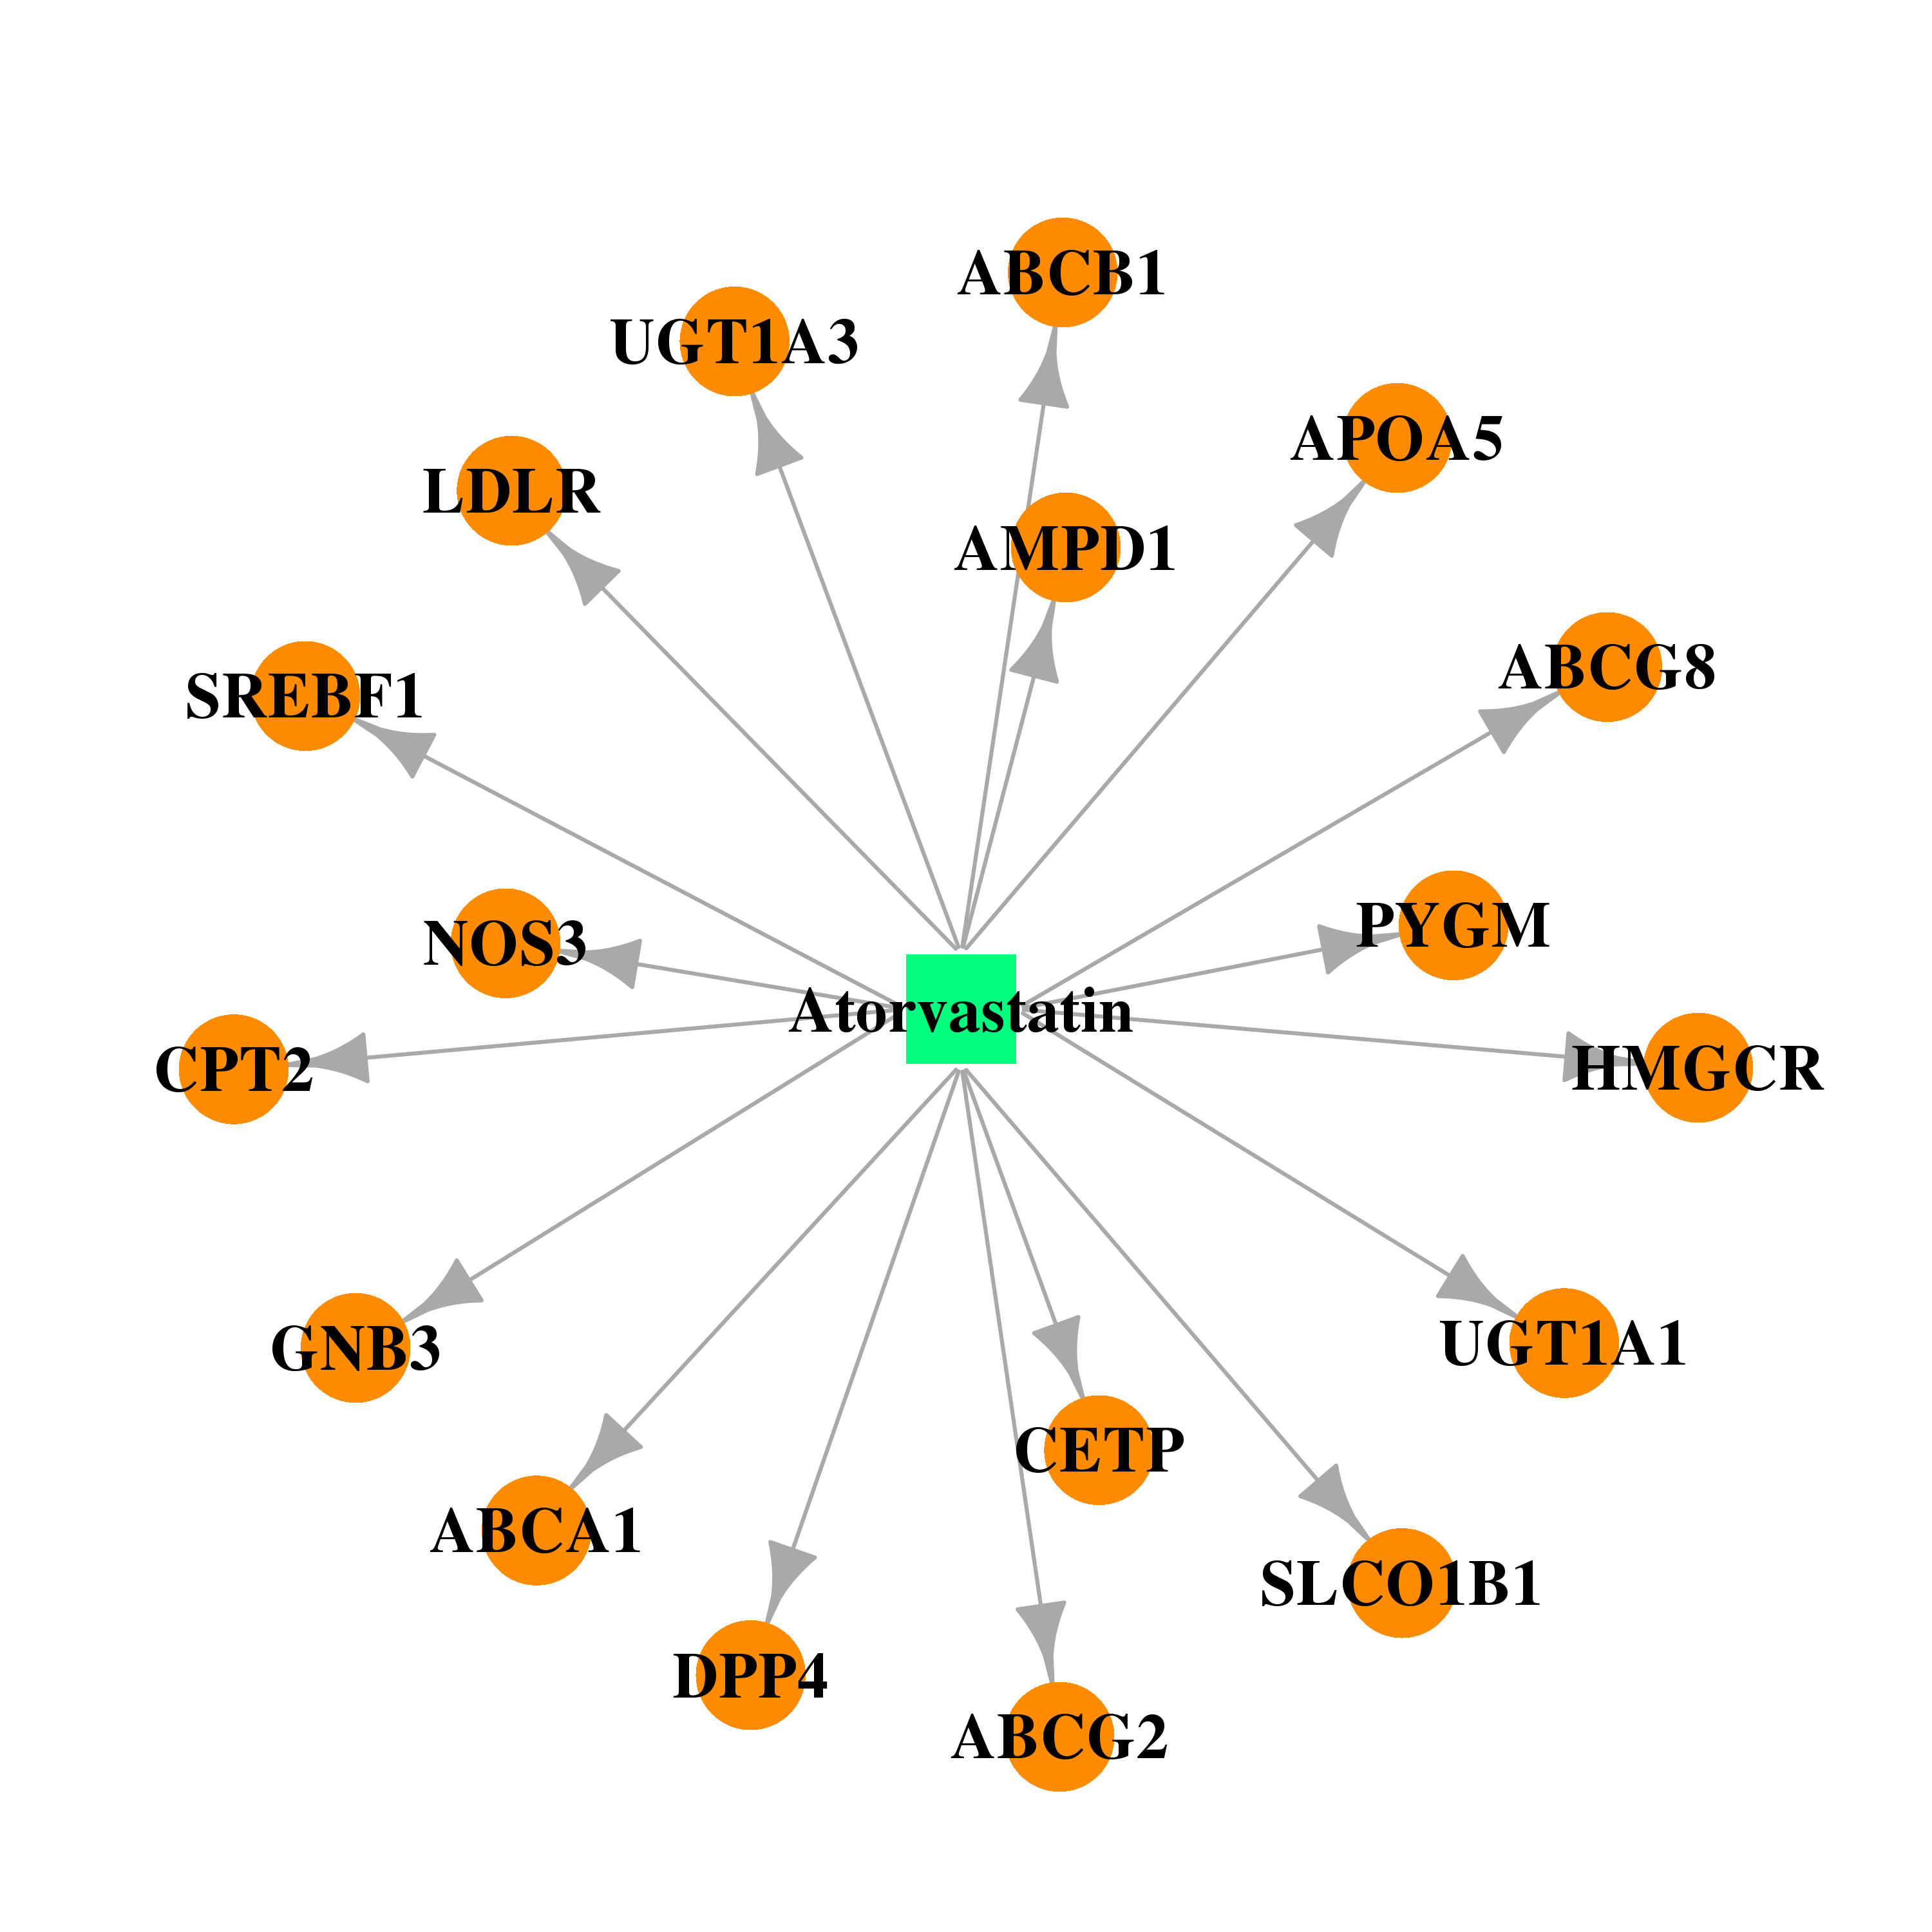 |  |
| DB01095 | sterol regulatory element binding transcription factor 1 | approved | Fluvastatin | 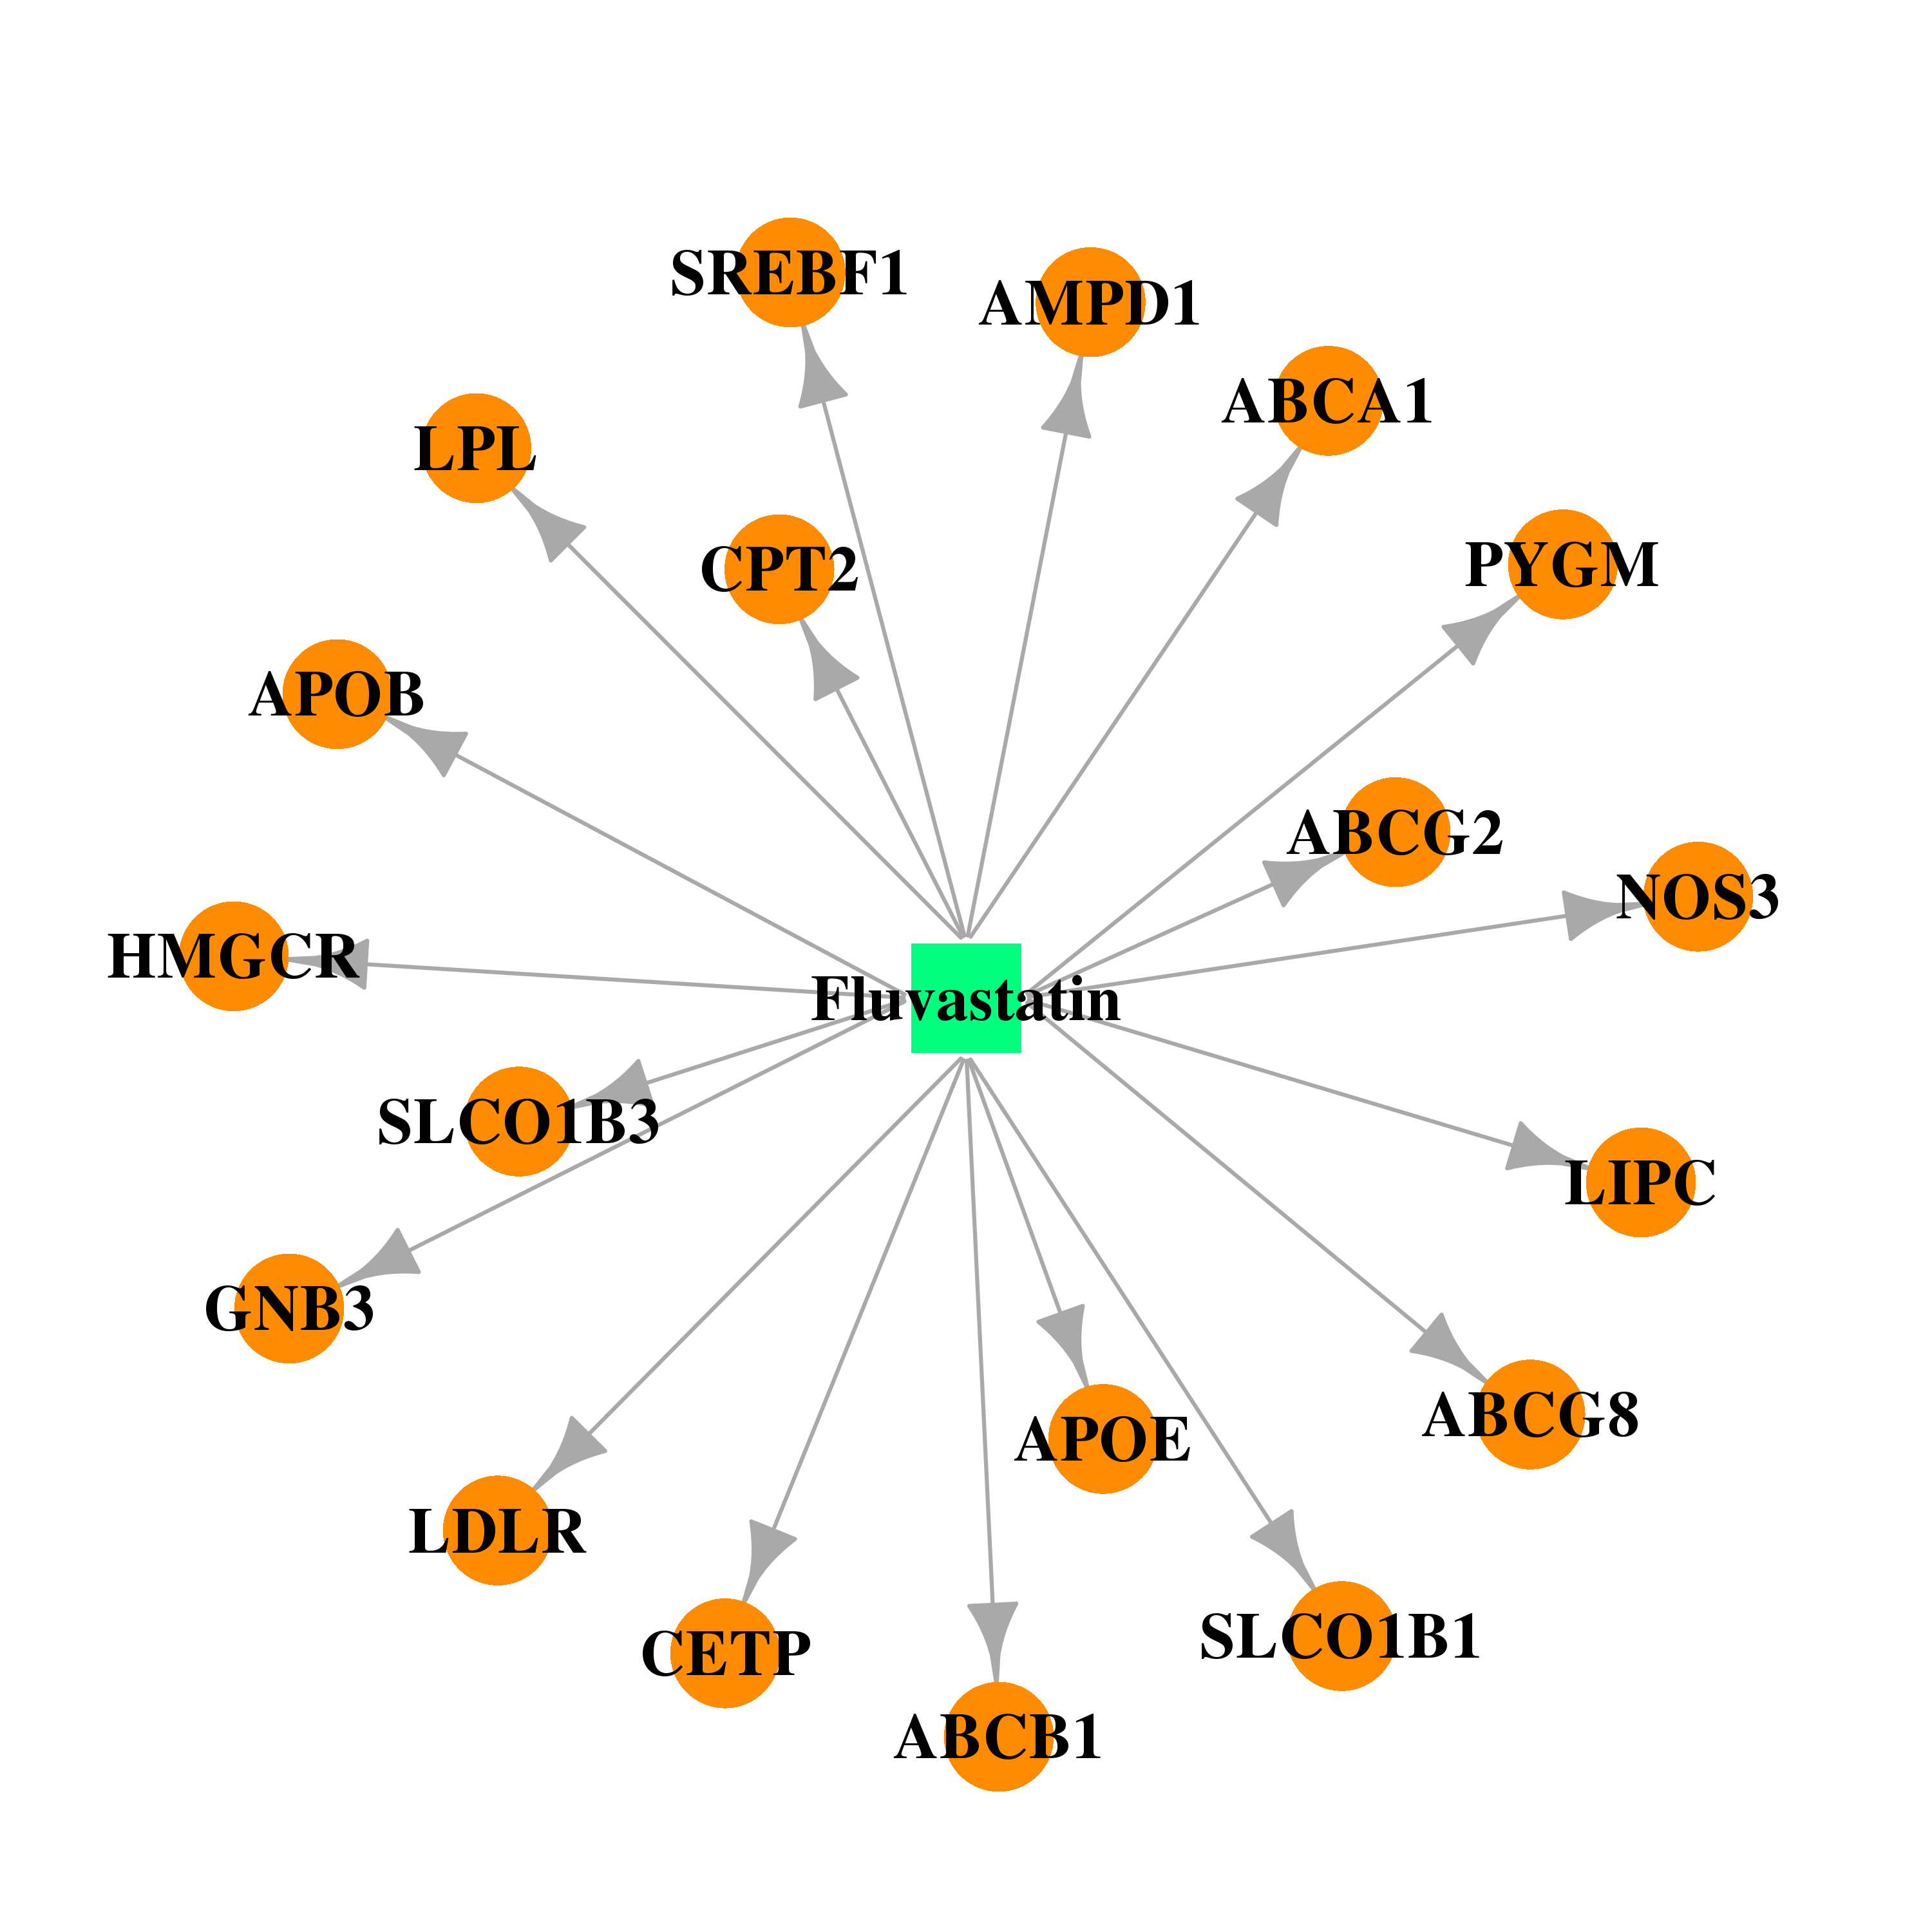 |  |
| DB00227 | sterol regulatory element binding transcription factor 1 | approved; investigational | Lovastatin | 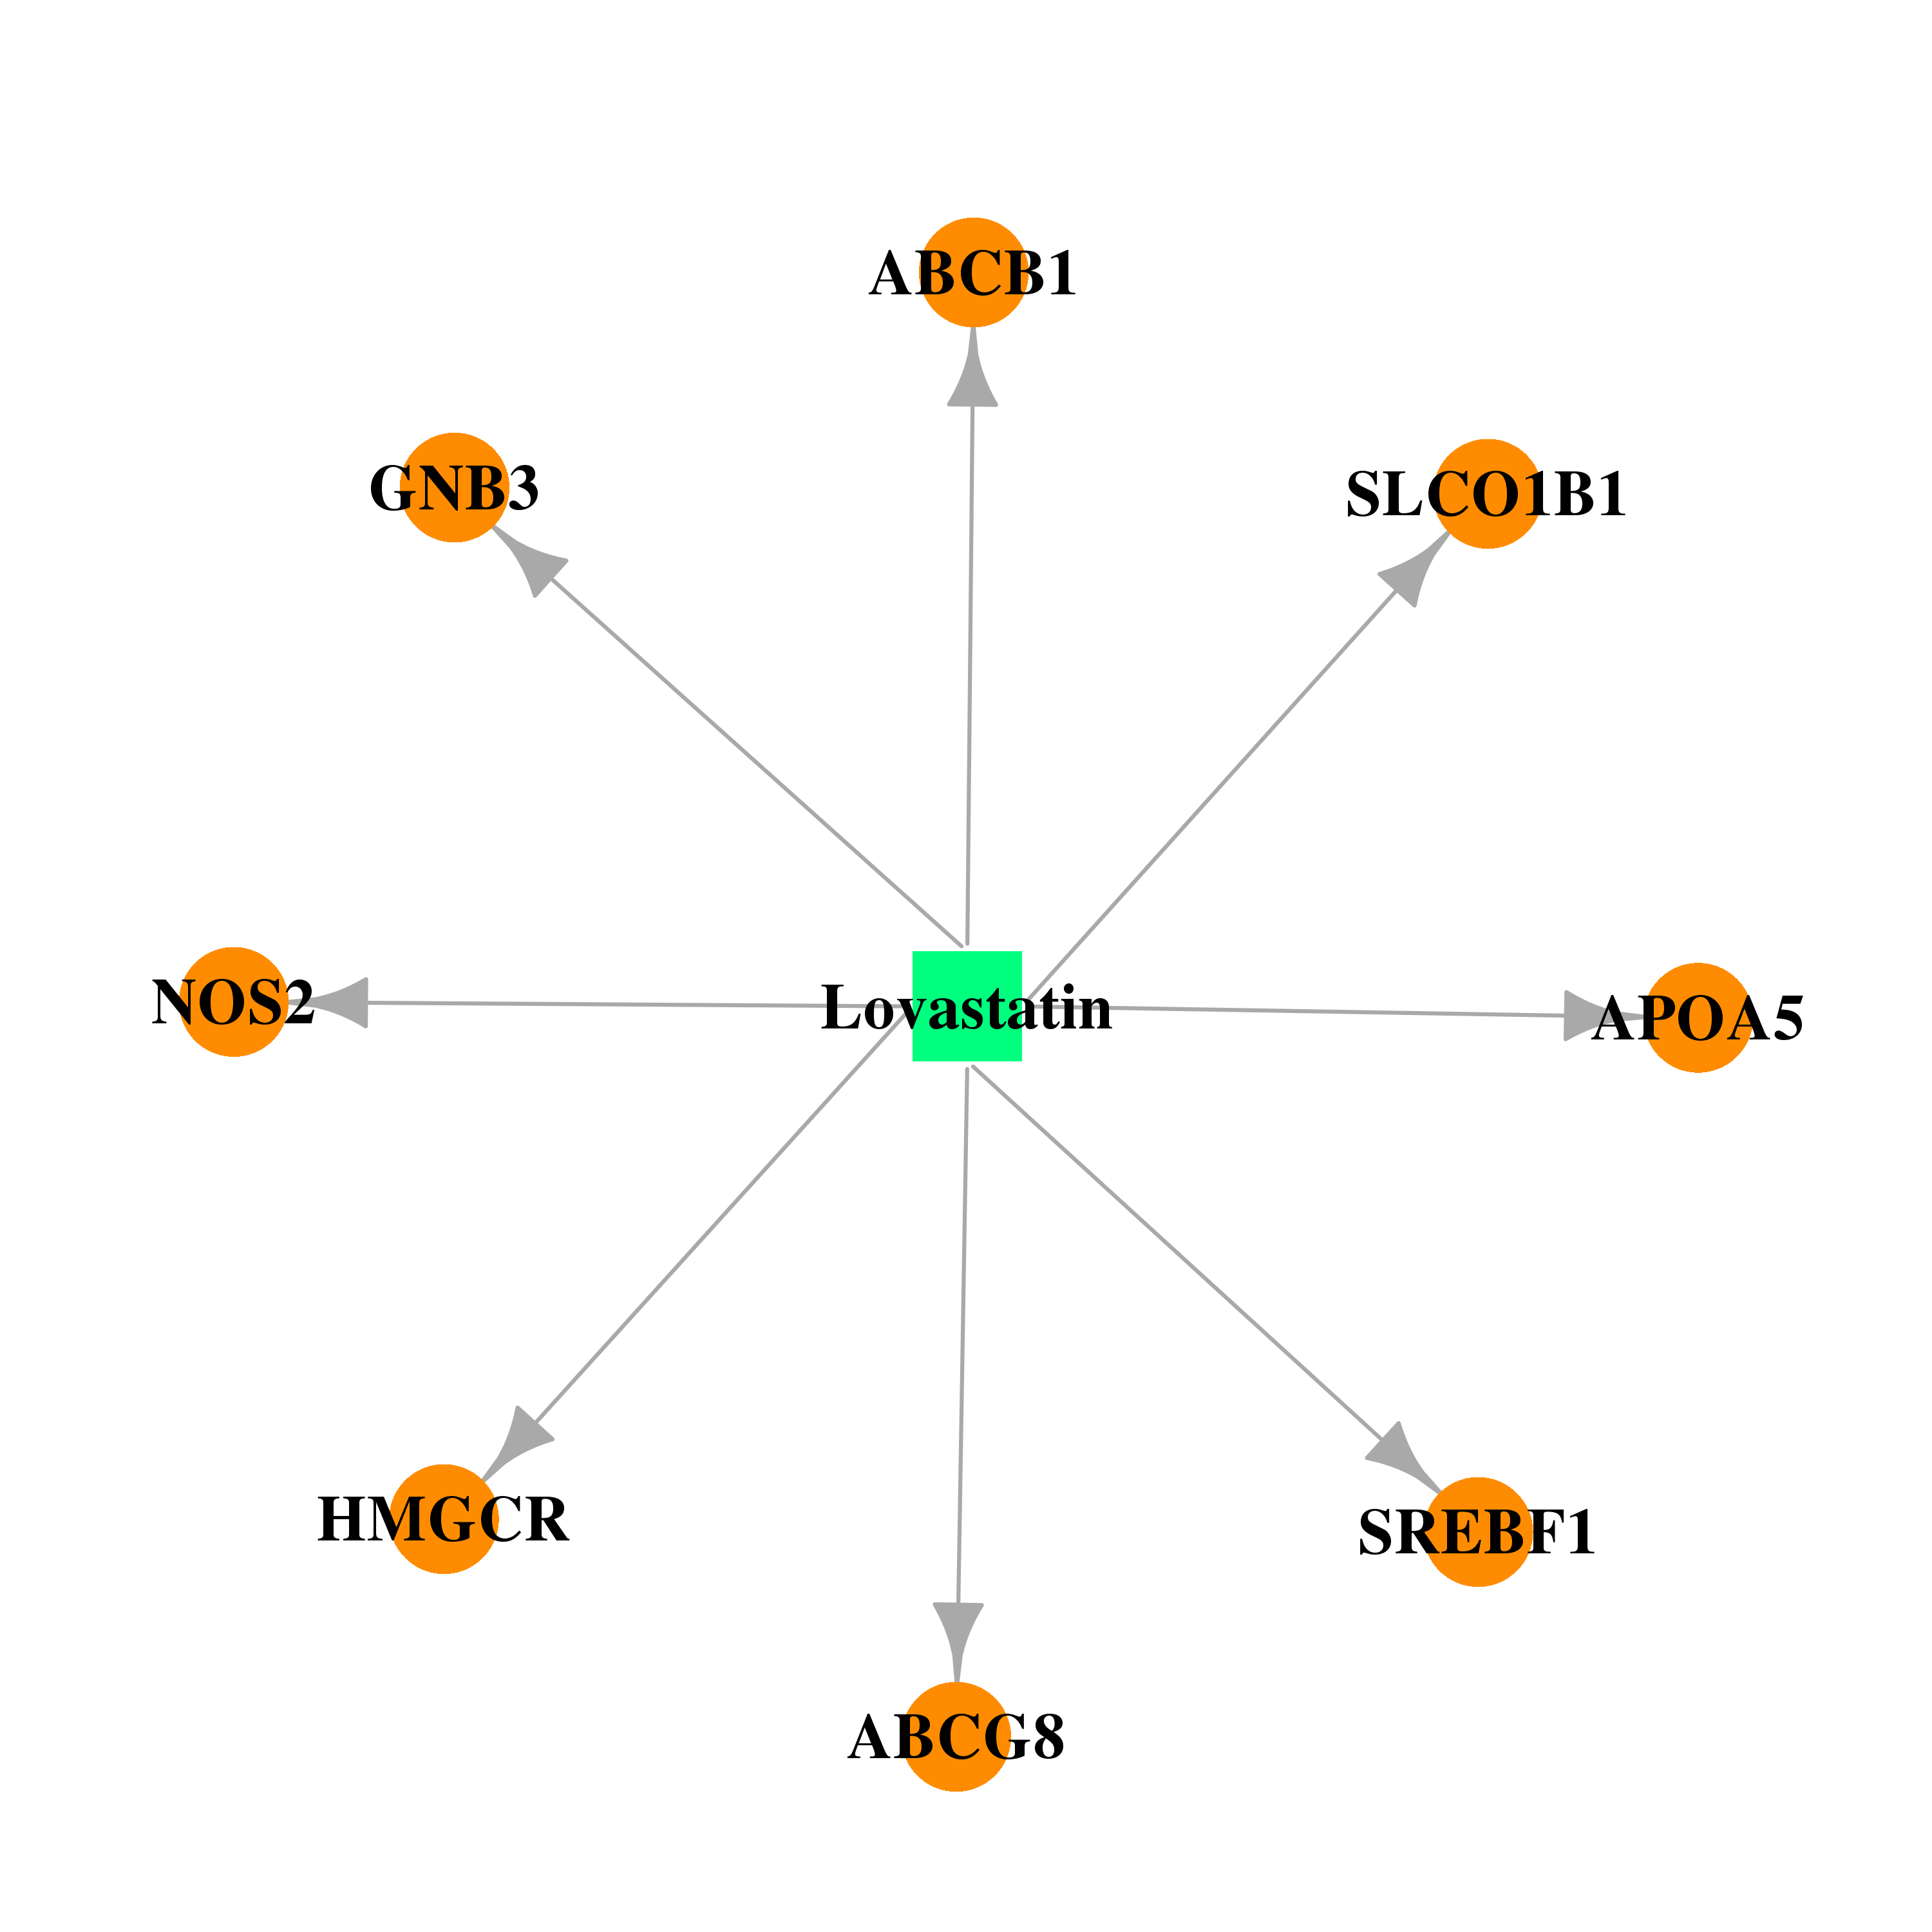 |  |
| DB00175 | sterol regulatory element binding transcription factor 1 | approved | Pravastatin | 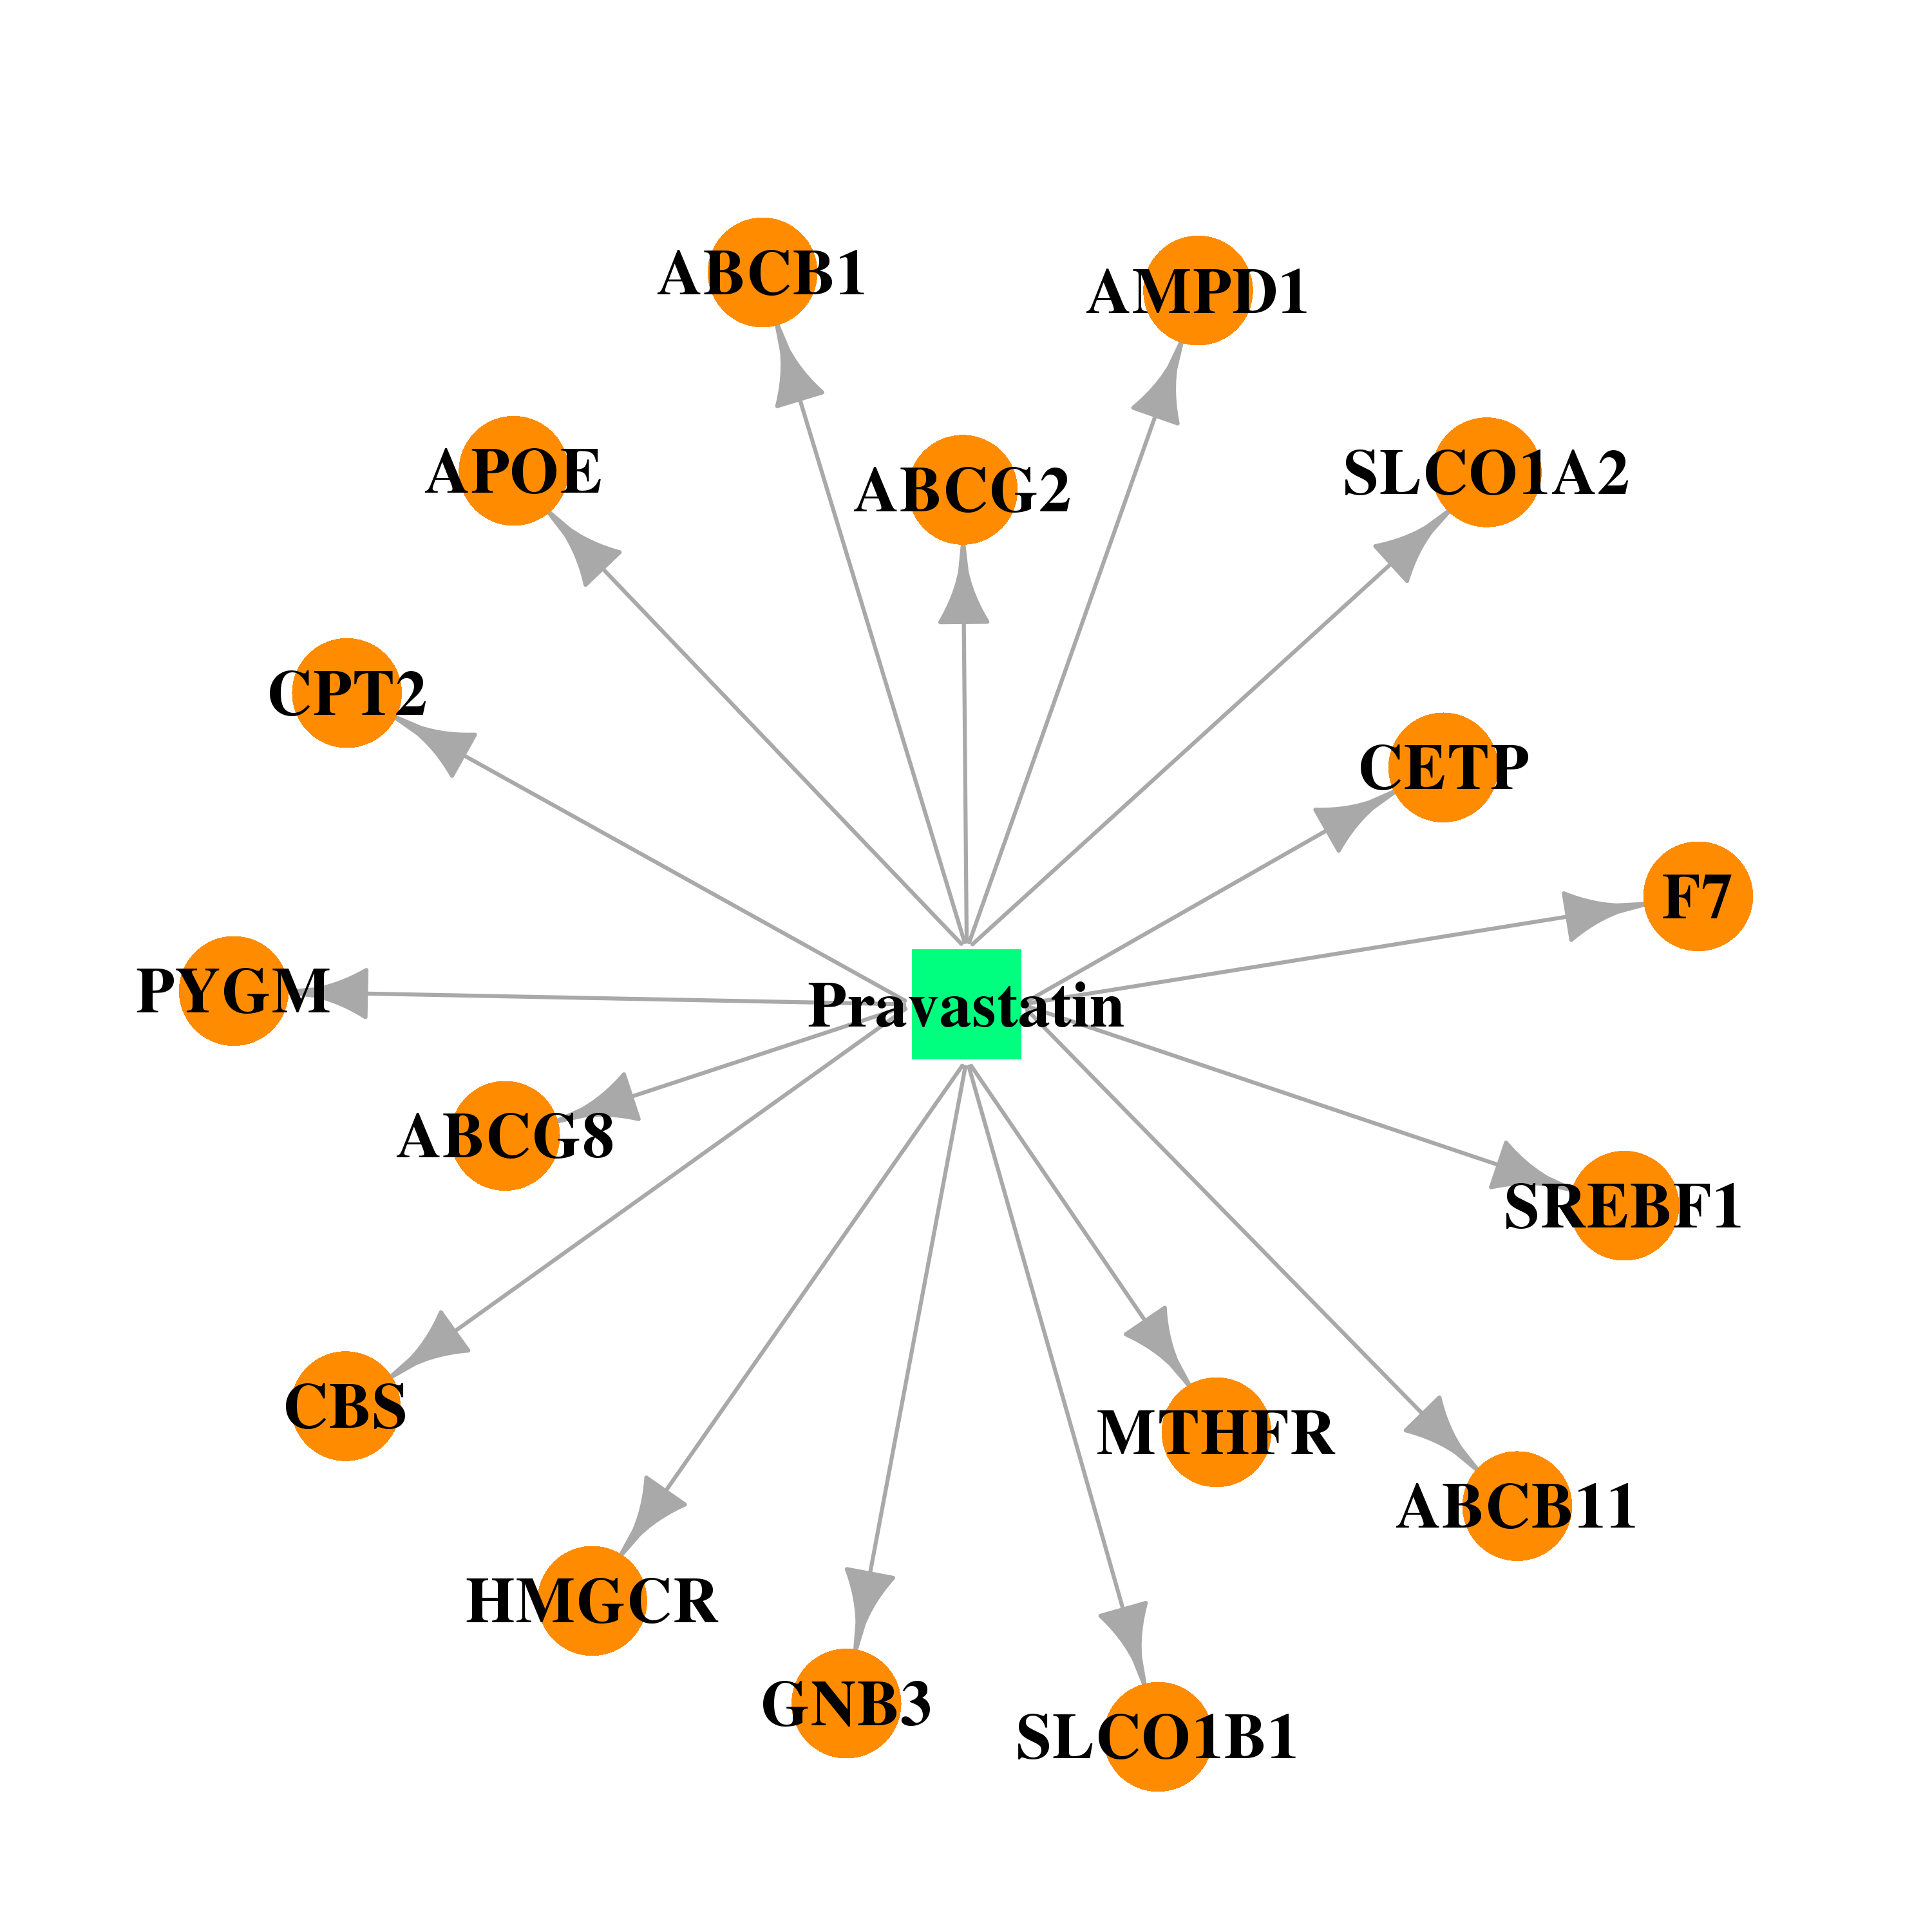 |  |
| DB01098 | sterol regulatory element binding transcription factor 1 | approved | Rosuvastatin | 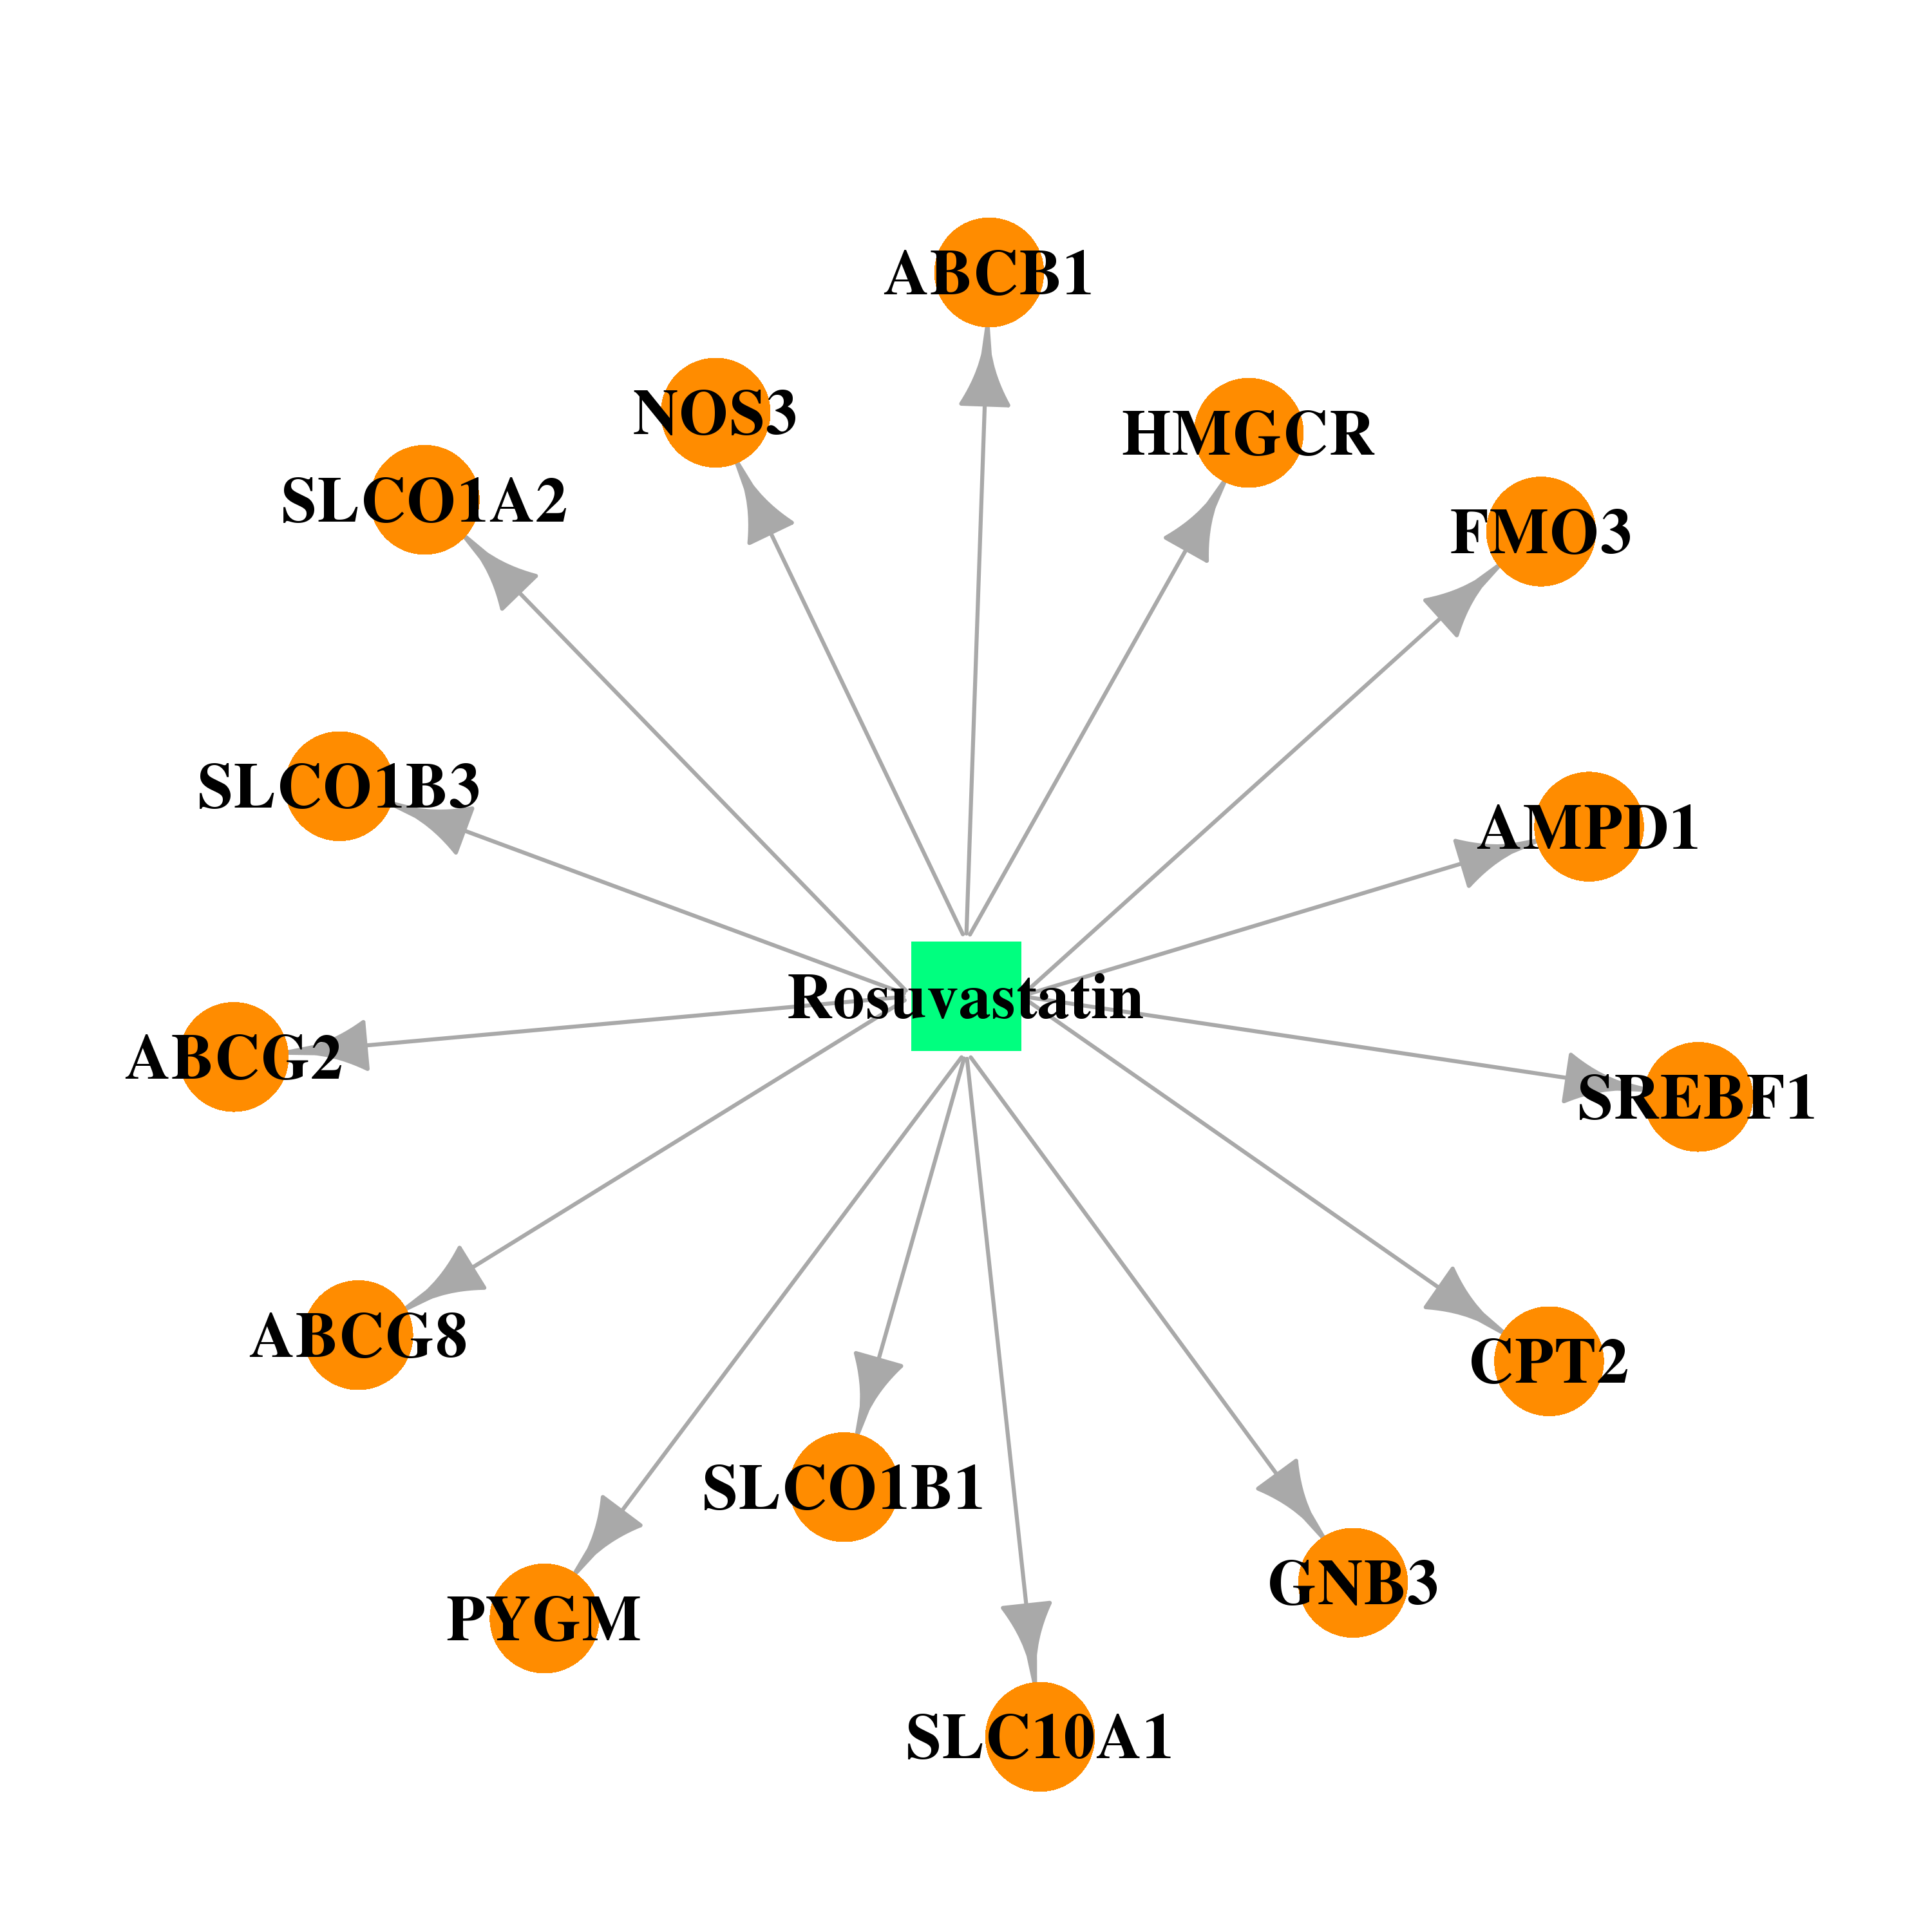 |  |
| DB00641 | sterol regulatory element binding transcription factor 1 | approved | Simvastatin | 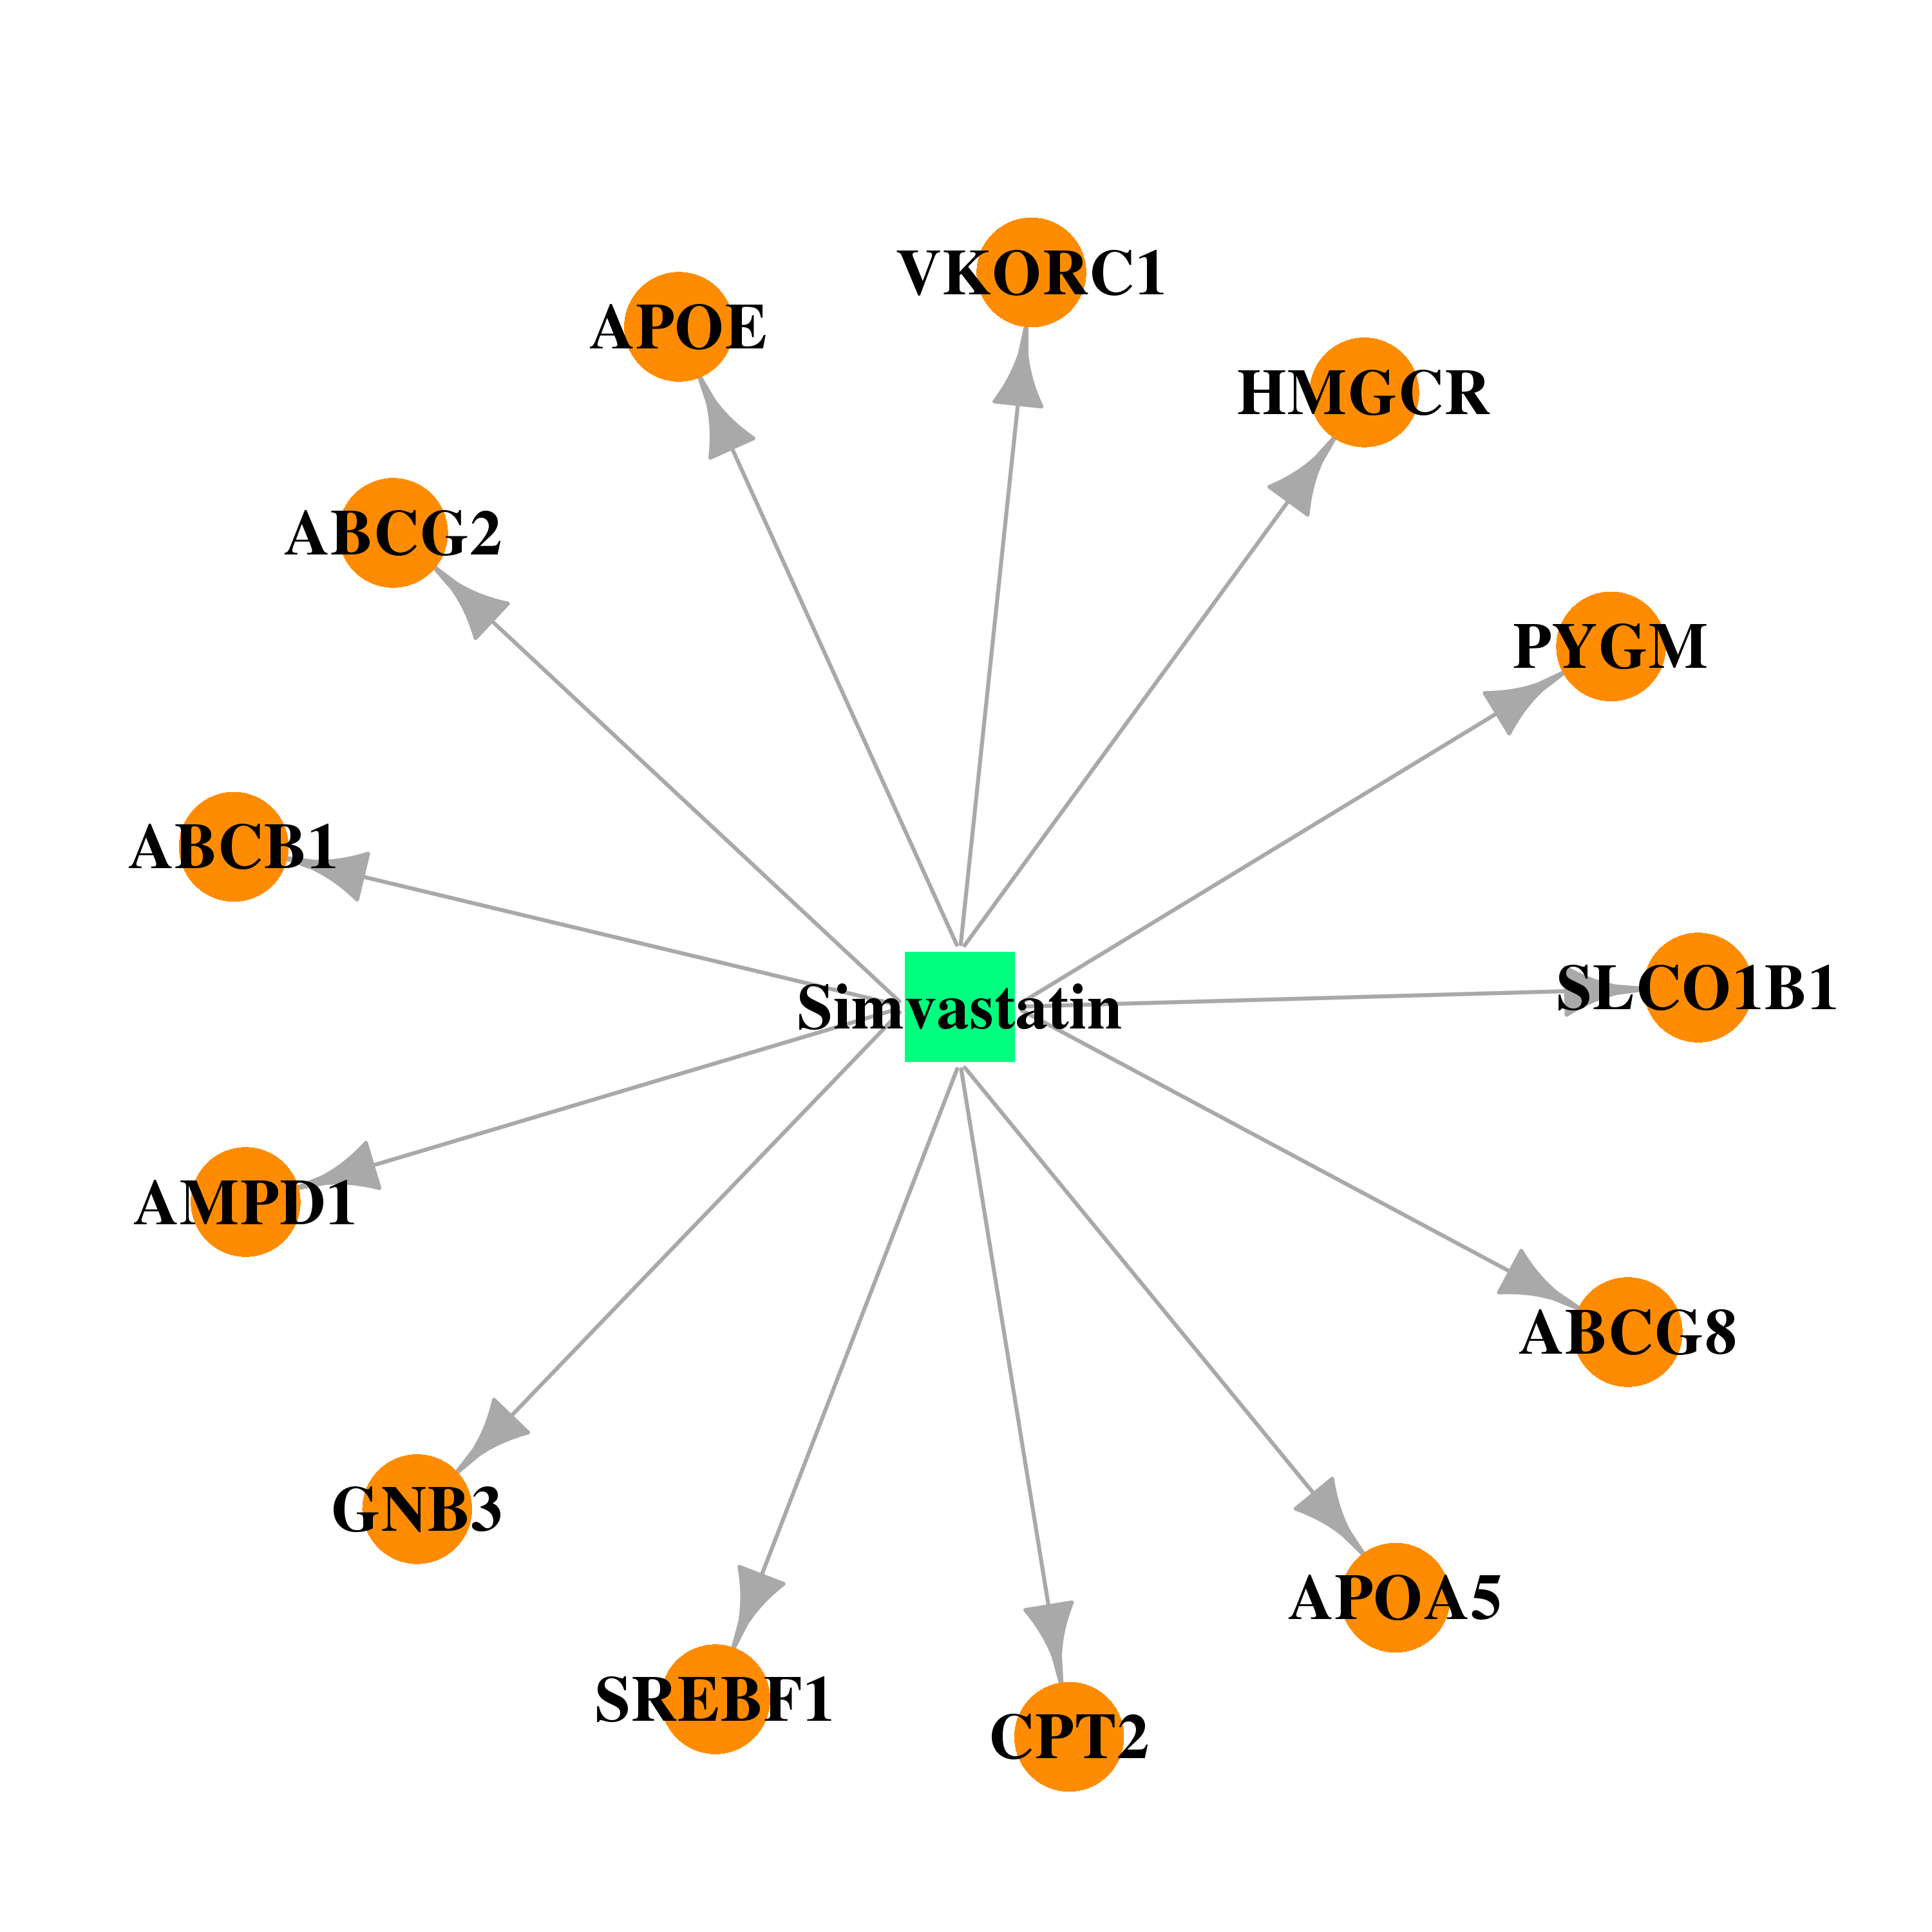 |  |
| Top |
| Cross referenced IDs for SREBF1 |
| * We obtained these cross-references from Uniprot database. It covers 150 different DBs, 18 categories. http://www.uniprot.org/help/cross_references_section |
: Open all cross reference information
|
Copyright © 2016-Present - The Univsersity of Texas Health Science Center at Houston @ |