|
||||||||||||||||||||
| |
| Phenotypic Information (metabolism pathway, cancer, disease, phenome) |
| |
| |
| Gene-Gene Network Information: Co-Expression Network, Interacting Genes & KEGG |
| |
|


| Gene Summary for SRPR |
| Top |
| Phenotypic Information for SRPR(metabolism pathway, cancer, disease, phenome) |
| Cancer | CGAP: SRPR |
| Familial Cancer Database: SRPR | |
| * This gene is included in those cancer gene databases. |
|
|
|
|
|
| . | ||||||||||||||
Oncogene 1 | Significant driver gene in BRCA 6, | |||||||||||||||||||
| cf) number; DB name 1 Oncogene; http://nar.oxfordjournals.org/content/35/suppl_1/D721.long, 2 Tumor Suppressor gene; https://bioinfo.uth.edu/TSGene/, 3 Cancer Gene Census; http://www.nature.com/nrc/journal/v4/n3/abs/nrc1299.html, 4 CancerGenes; http://nar.oxfordjournals.org/content/35/suppl_1/D721.long, 5 Network of Cancer Gene; http://ncg.kcl.ac.uk/index.php, 6 http://www.nature.com/nature/journal/v490/n7418/full/nature11412.html, 7Therapeutic Vulnerabilities in Cancer; http://cbio.mskcc.org/cancergenomics/statius/ |
| REACTOME_METABOLISM_OF_PROTEINS | |
| OMIM | 182180; gene. |
| Orphanet | |
| Disease | KEGG Disease: SRPR |
| MedGen: SRPR (Human Medical Genetics with Condition) | |
| ClinVar: SRPR | |
| Phenotype | MGI: SRPR (International Mouse Phenotyping Consortium) |
| PhenomicDB: SRPR | |
| Mutations for SRPR |
| * Under tables are showing count per each tissue to give us broad intuition about tissue specific mutation patterns.You can go to the detailed page for each mutation database's web site. |
| There's no structural variation information in COSMIC data for this gene. |
| * From mRNA Sanger sequences, Chitars2.0 arranged chimeric transcripts. This table shows SRPR related fusion information. |
| ID | Head Gene | Tail Gene | Accession | Gene_a | qStart_a | qEnd_a | Chromosome_a | tStart_a | tEnd_a | Gene_a | qStart_a | qEnd_a | Chromosome_a | tStart_a | tEnd_a |
| DA280072 | SNHG1 | 1 | 57 | 11 | 62621379 | 62621435 | SRPR | 58 | 588 | 11 | 126136495 | 126137913 | |
| BE166221 | SRPR | 1 | 94 | 11 | 126134084 | 126134178 | SRPR | 88 | 227 | 11 | 126134269 | 126134408 | |
| BE166227 | SRPR | 1 | 94 | 11 | 126134084 | 126134178 | SRPR | 88 | 233 | 11 | 126134269 | 126134412 | |
| BE764327 | USH1C | 1 | 247 | 11 | 17515806 | 17519781 | SRPR | 241 | 314 | 11 | 126135594 | 126135667 | |
| Top |
| There's no copy number variation information in COSMIC data for this gene. |
| Top |
|
 |
| Top |
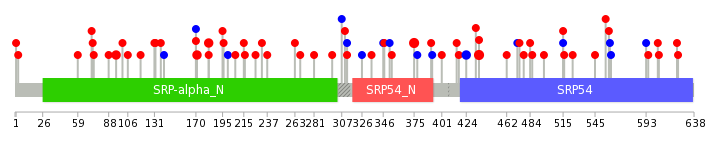
| Stat. for Non-Synonymous SNVs (# total SNVs=49) | (# total SNVs=14) |
 |  |
(# total SNVs=13) | (# total SNVs=0) |
 |
| Top |
| * When you move the cursor on each content, you can see more deailed mutation information on the Tooltip. Those are primary_site,primary_histology,mutation(aa),pubmedID. |
| GRCh37 position | Mutation(aa) | Unique sampleID count |
| chr11:126137087-126137087 | p.K170fs*33 | 13 |
| chr11:126135645-126135645 | p.M375I | 3 |
| chr11:126135167-126135167 | p.A436V | 3 |
| chr11:126134415-126134415 | p.D515E | 2 |
| chr11:126135202-126135202 | p.C424C | 2 |
| chr11:126136799-126136799 | p.A182D | 2 |
| chr11:126137525-126137525 | p.R95H | 2 |
| chr11:126137085-126137085 | p.G171R | 2 |
| chr11:126134309-126134309 | p.G551* | 2 |
| chr11:126134994-126134994 | p.V462A | 1 |
| Top |
|
 |
| Point Mutation/ Tissue ID | 1 | 2 | 3 | 4 | 5 | 6 | 7 | 8 | 9 | 10 | 11 | 12 | 13 | 14 | 15 | 16 | 17 | 18 | 19 | 20 |
| # sample | 2 | 7 | 3 | 1 | 2 | 1 | 5 | 2 | 1 | 2 | 10 | 1 | 15 | |||||||
| # mutation | 2 | 8 | 3 | 1 | 2 | 1 | 8 | 2 | 1 | 3 | 10 | 1 | 15 | |||||||
| nonsynonymous SNV | 2 | 8 | 2 | 1 | 2 | 1 | 6 | 2 | 1 | 2 | 9 | 1 | 11 | |||||||
| synonymous SNV | 1 | 2 | 1 | 1 | 4 |
| cf) Tissue ID; Tissue type (1; BLCA[Bladder Urothelial Carcinoma], 2; BRCA[Breast invasive carcinoma], 3; CESC[Cervical squamous cell carcinoma and endocervical adenocarcinoma], 4; COAD[Colon adenocarcinoma], 5; GBM[Glioblastoma multiforme], 6; Glioma Low Grade, 7; HNSC[Head and Neck squamous cell carcinoma], 8; KICH[Kidney Chromophobe], 9; KIRC[Kidney renal clear cell carcinoma], 10; KIRP[Kidney renal papillary cell carcinoma], 11; LAML[Acute Myeloid Leukemia], 12; LUAD[Lung adenocarcinoma], 13; LUSC[Lung squamous cell carcinoma], 14; OV[Ovarian serous cystadenocarcinoma ], 15; PAAD[Pancreatic adenocarcinoma], 16; PRAD[Prostate adenocarcinoma], 17; SKCM[Skin Cutaneous Melanoma], 18:STAD[Stomach adenocarcinoma], 19:THCA[Thyroid carcinoma], 20:UCEC[Uterine Corpus Endometrial Carcinoma]) |
| Top |
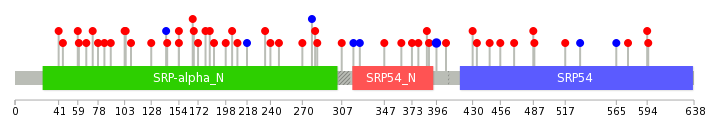
| * We represented just top 10 SNVs. When you move the cursor on each content, you can see more deailed mutation information on the Tooltip. Those are primary_site, primary_histology, mutation(aa), pubmedID. |
| Genomic Position | Mutation(aa) | Unique sampleID count |
| chr11:126135202 | p.C396C,SRPR | 2 |
| chr11:126135871 | p.R373C,SRPR | 1 |
| chr11:126137546 | p.E198D,SRPR | 1 |
| chr11:126136516 | p.D84H,SRPR | 1 |
| chr11:126133864 | p.T576M,SRPR | 1 |
| chr11:126135007 | p.E363Q,SRPR | 1 |
| chr11:126137086 | p.E187K,SRPR | 1 |
| chr11:126135906 | p.L78V,SRPR | 1 |
| chr11:126137590 | p.I565I,SRPR | 1 |
| chr11:126136666 | p.M347I,SRPR | 1 |
| * Copy number data were extracted from TCGA using R package TCGA-Assembler. The URLs of all public data files on TCGA DCC data server were gathered on Jan-05-2015. Function ProcessCNAData in TCGA-Assembler package was used to obtain gene-level copy number value which is calculated as the average copy number of the genomic region of a gene. |
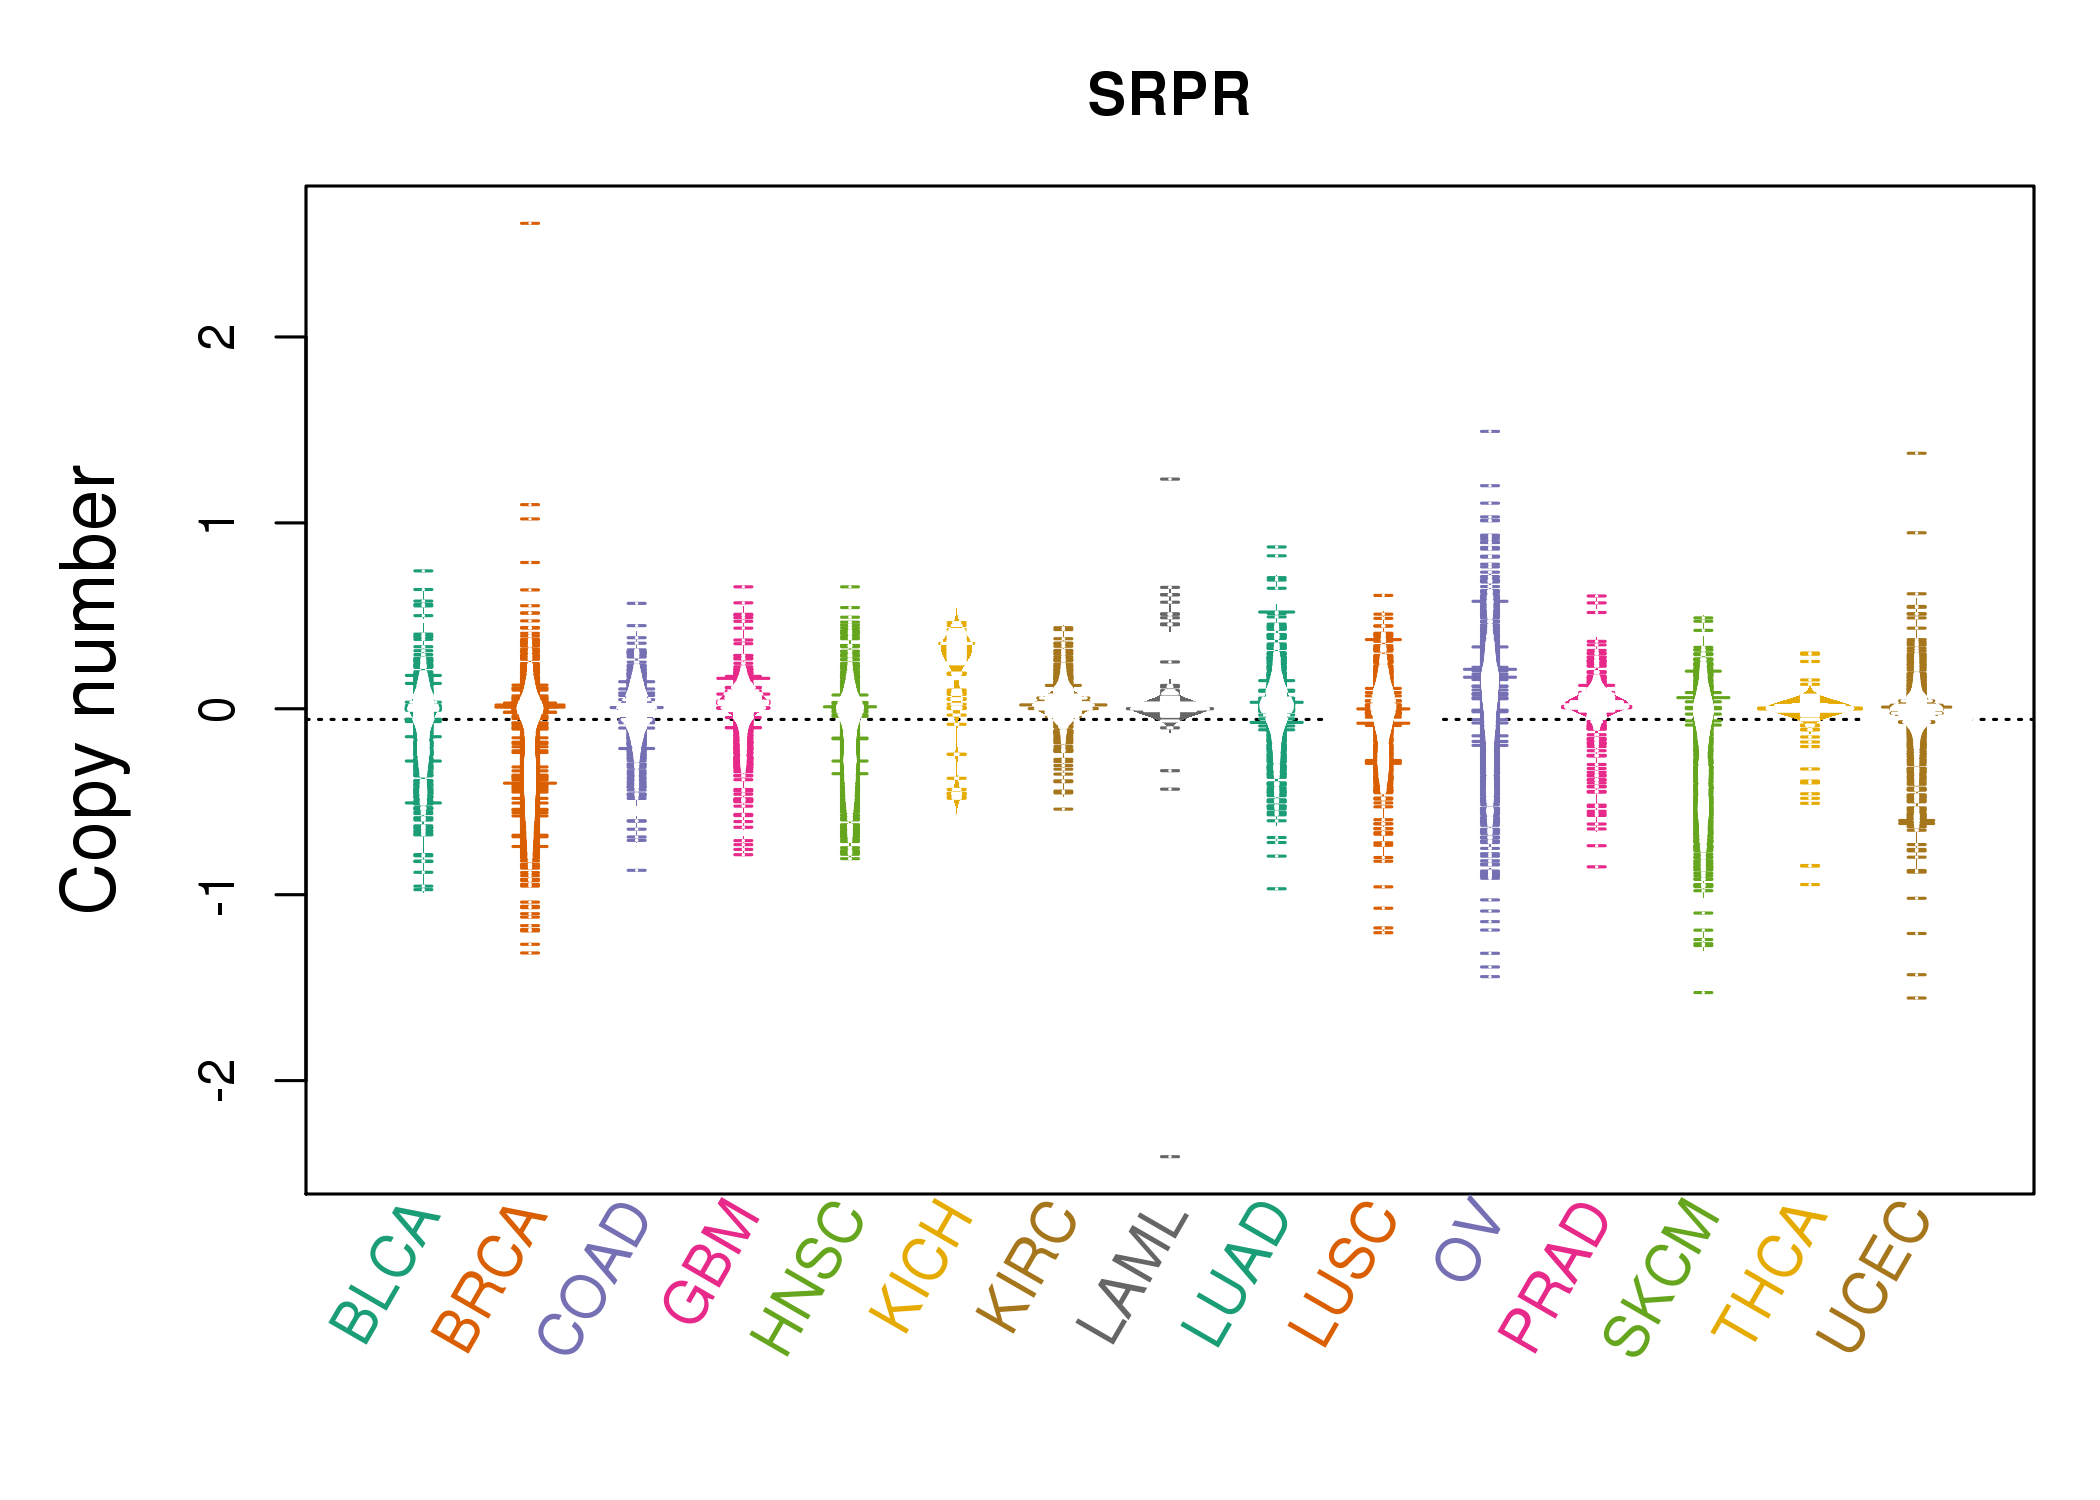 |
| cf) Tissue ID[Tissue type]: BLCA[Bladder Urothelial Carcinoma], BRCA[Breast invasive carcinoma], CESC[Cervical squamous cell carcinoma and endocervical adenocarcinoma], COAD[Colon adenocarcinoma], GBM[Glioblastoma multiforme], Glioma Low Grade, HNSC[Head and Neck squamous cell carcinoma], KICH[Kidney Chromophobe], KIRC[Kidney renal clear cell carcinoma], KIRP[Kidney renal papillary cell carcinoma], LAML[Acute Myeloid Leukemia], LUAD[Lung adenocarcinoma], LUSC[Lung squamous cell carcinoma], OV[Ovarian serous cystadenocarcinoma ], PAAD[Pancreatic adenocarcinoma], PRAD[Prostate adenocarcinoma], SKCM[Skin Cutaneous Melanoma], STAD[Stomach adenocarcinoma], THCA[Thyroid carcinoma], UCEC[Uterine Corpus Endometrial Carcinoma] |
| Top |
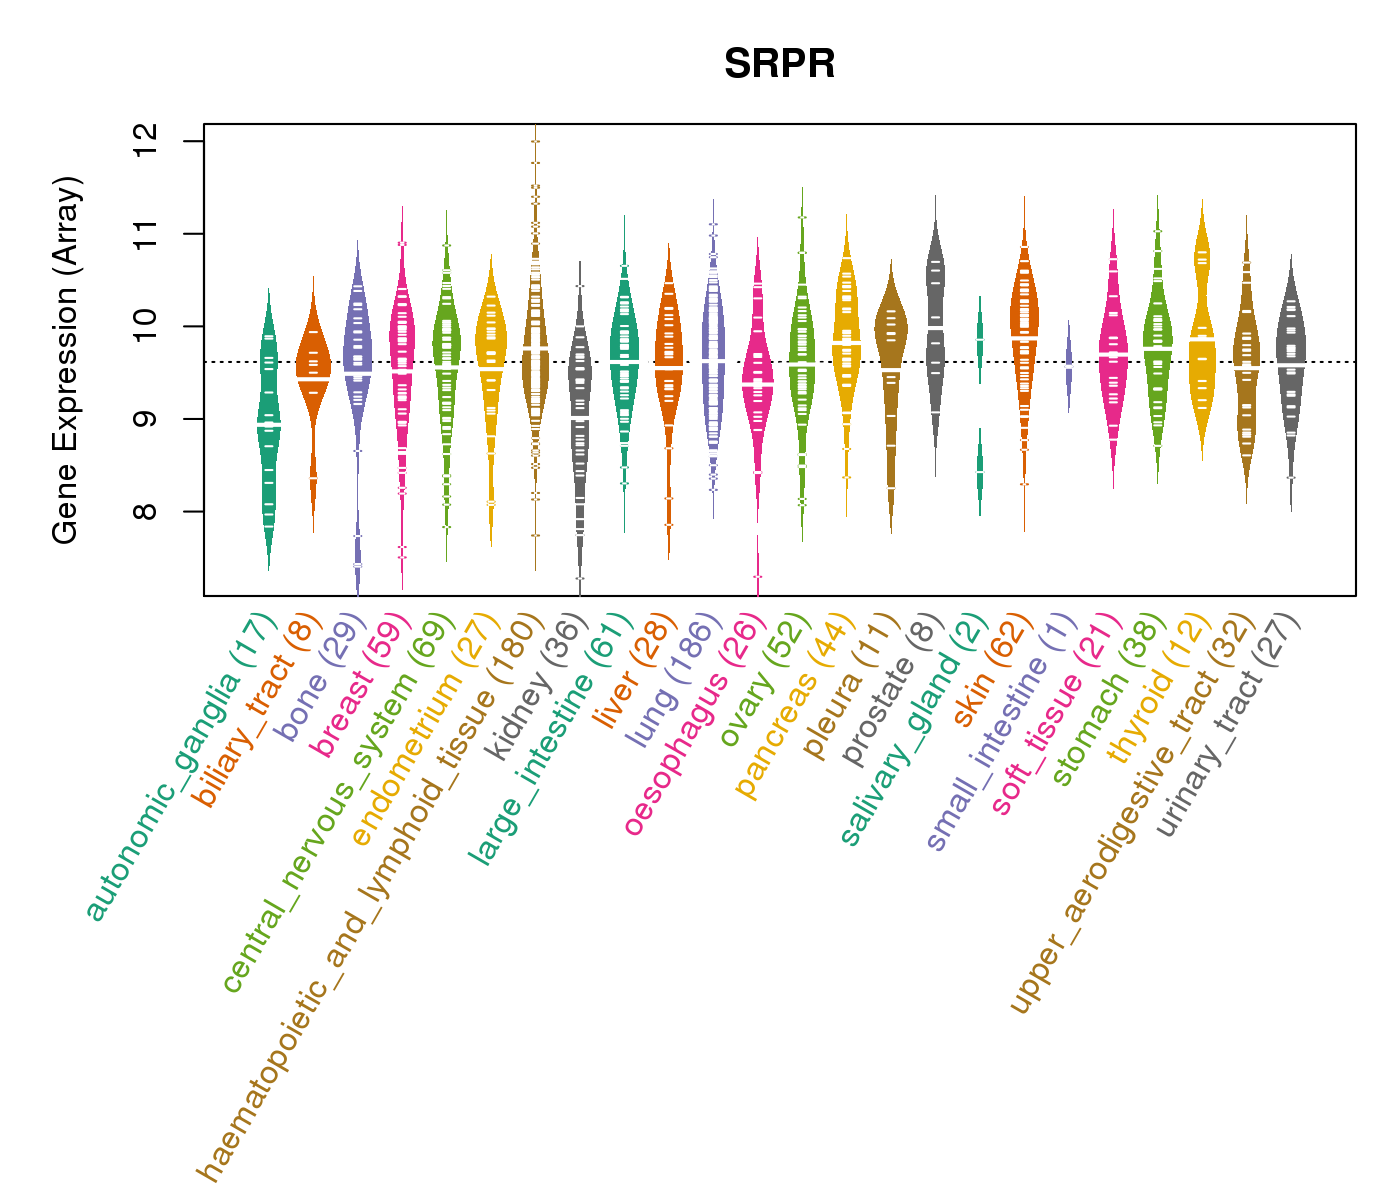
| Gene Expression for SRPR |
| * CCLE gene expression data were extracted from CCLE_Expression_Entrez_2012-10-18.res: Gene-centric RMA-normalized mRNA expression data. |
 |
| * Normalized gene expression data of RNASeqV2 was extracted from TCGA using R package TCGA-Assembler. The URLs of all public data files on TCGA DCC data server were gathered at Jan-05-2015. Only eight cancer types have enough normal control samples for differential expression analysis. (t test, adjusted p<0.05 (using Benjamini-Hochberg FDR)) |
 |
| Top |
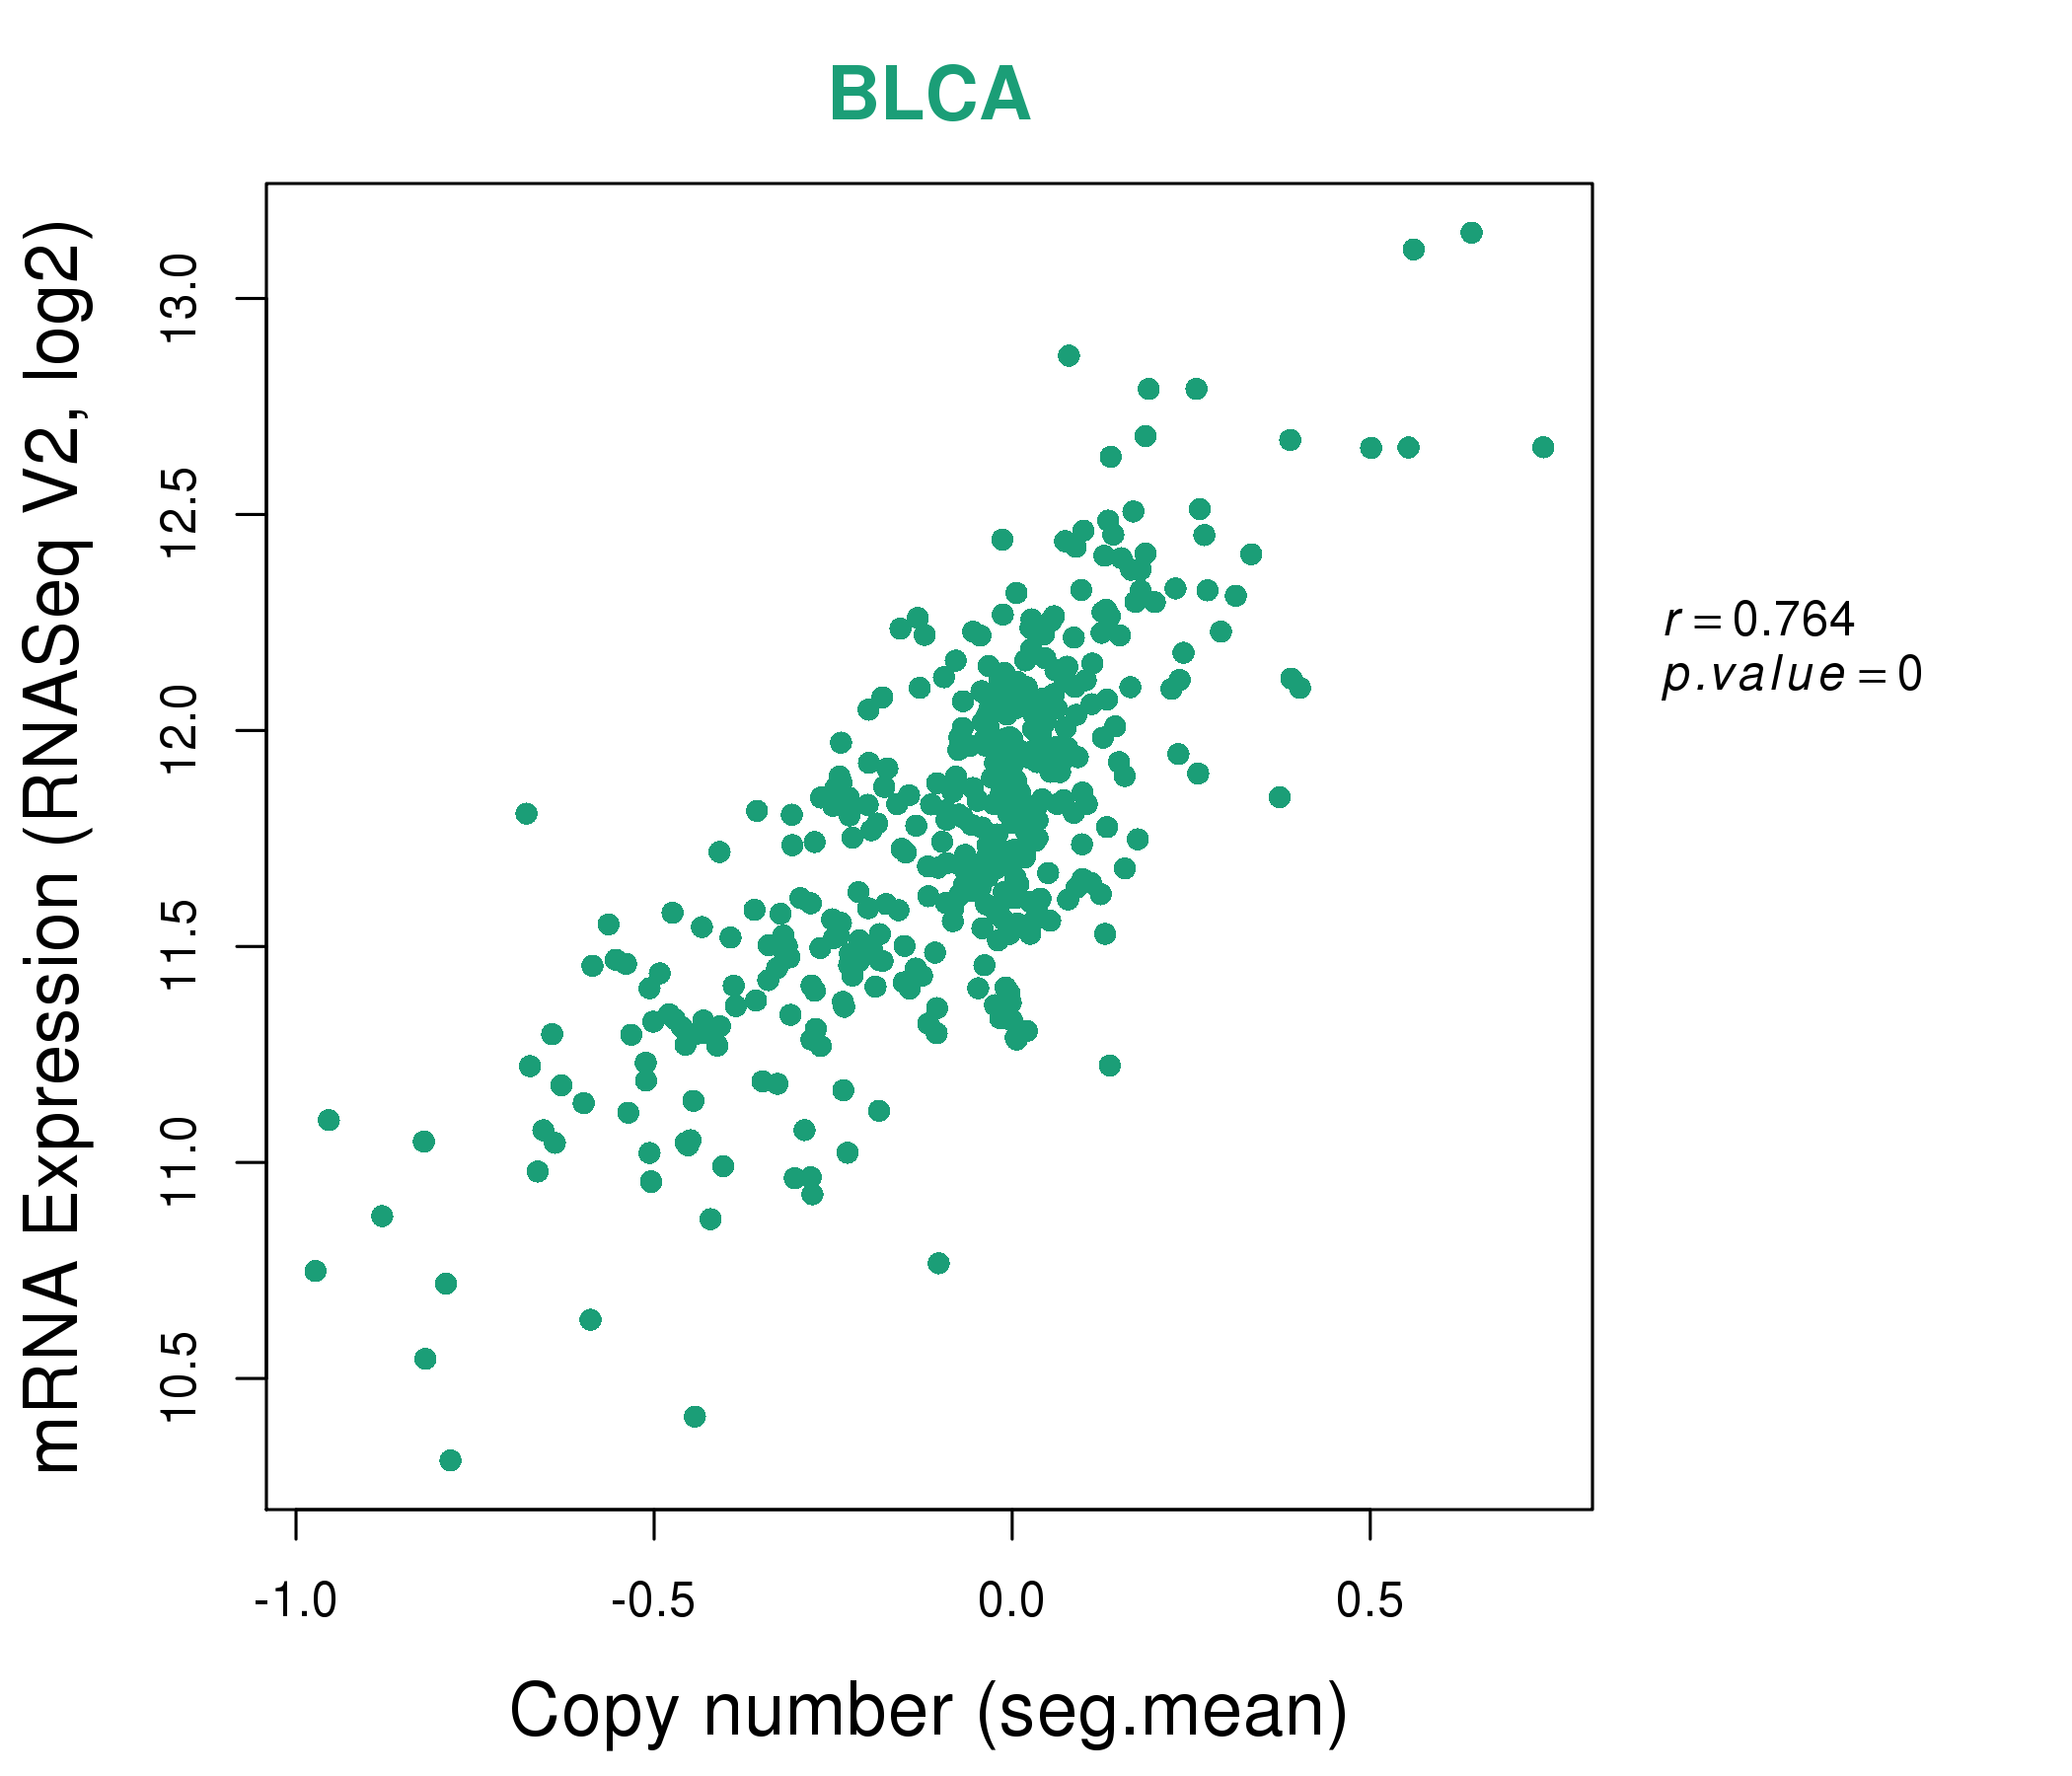
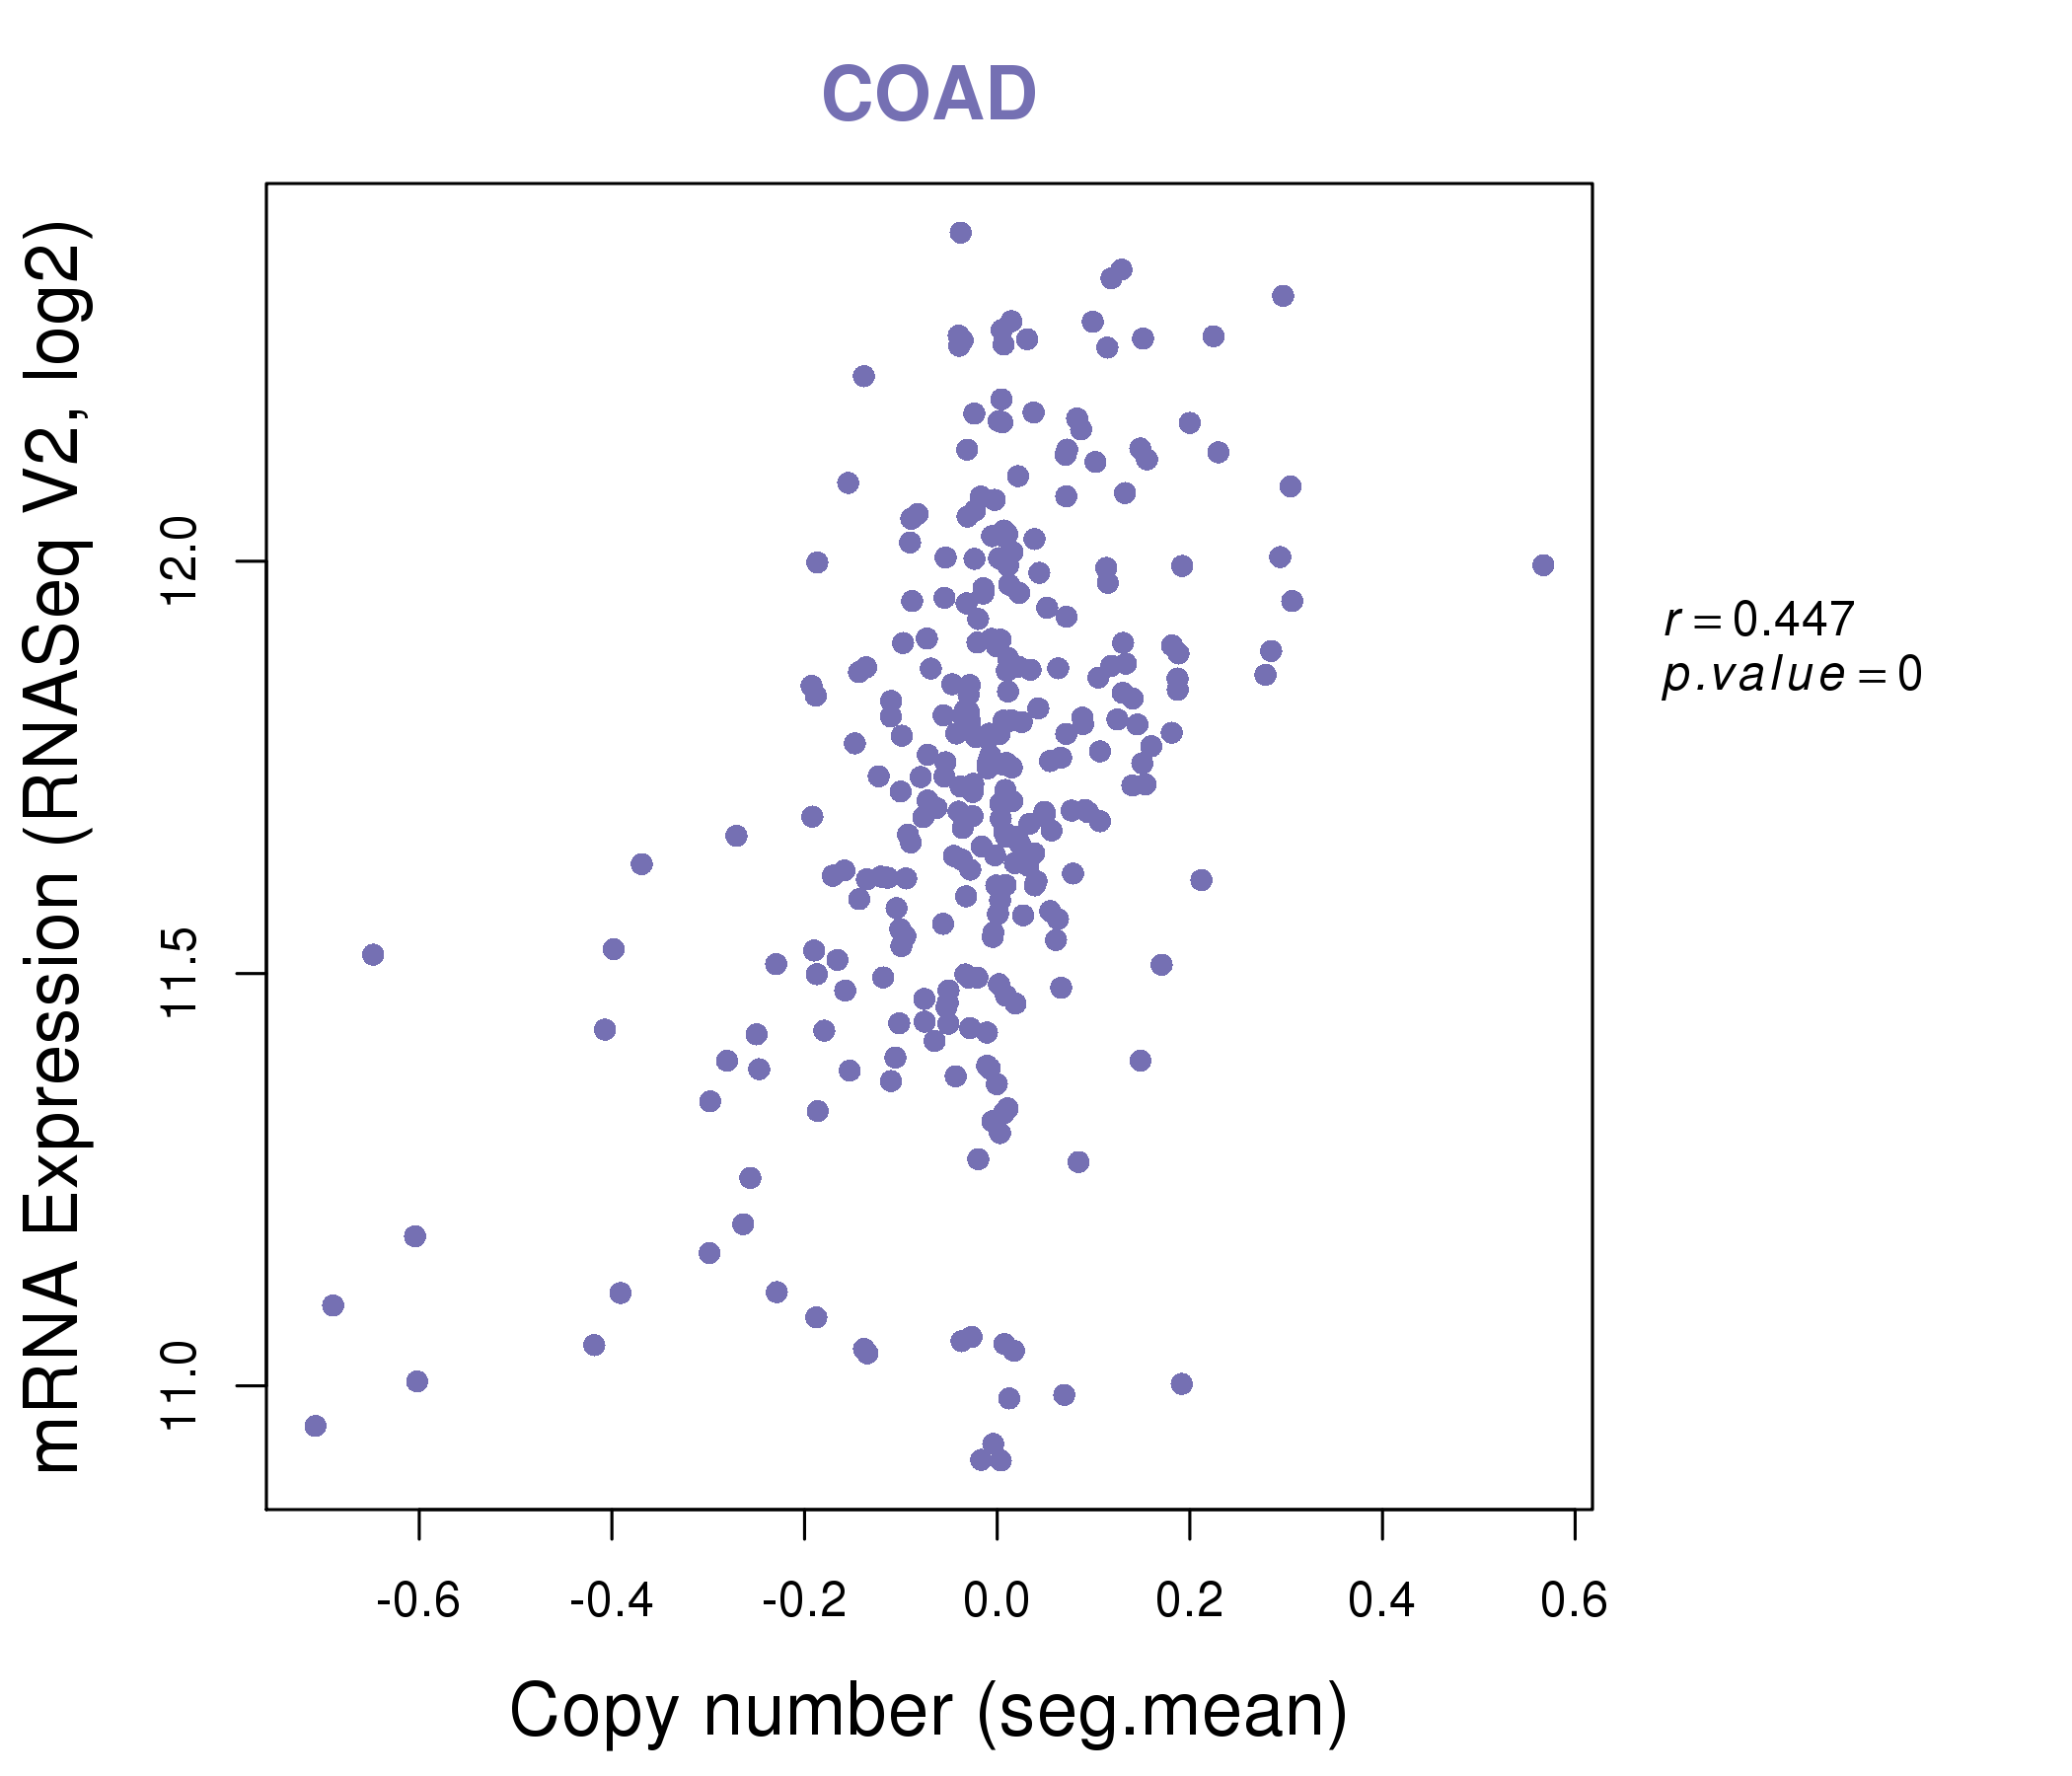
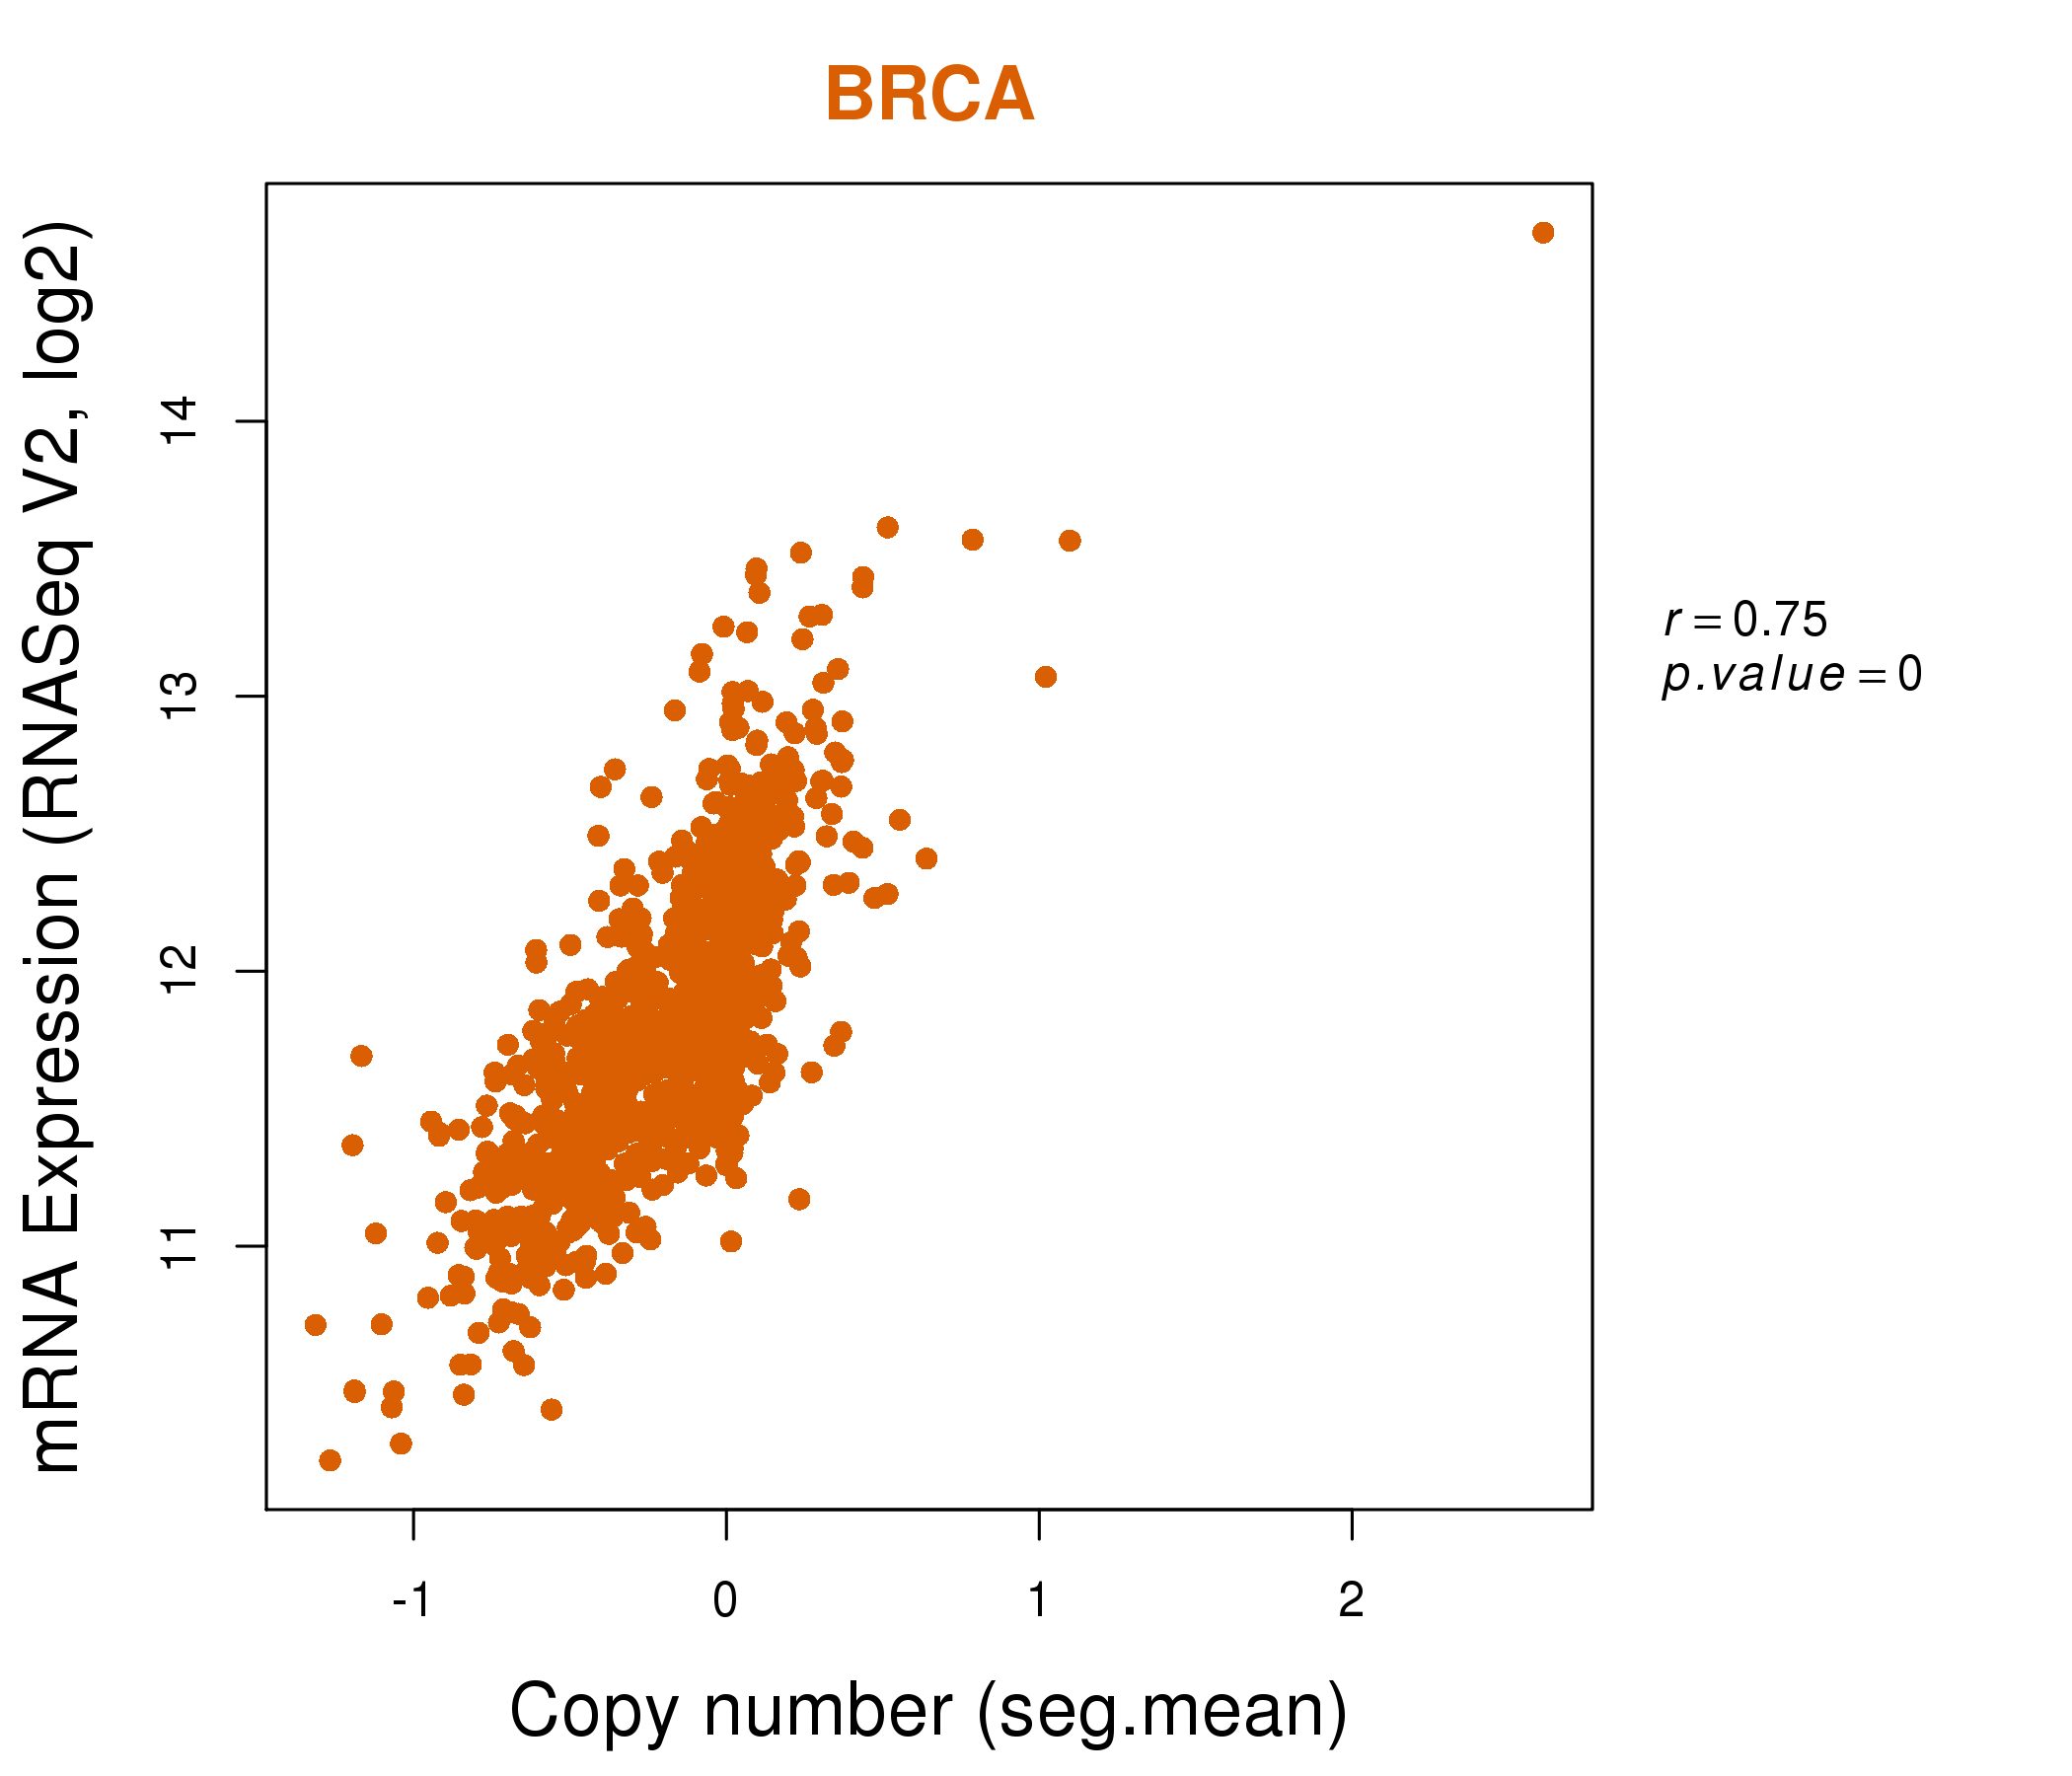
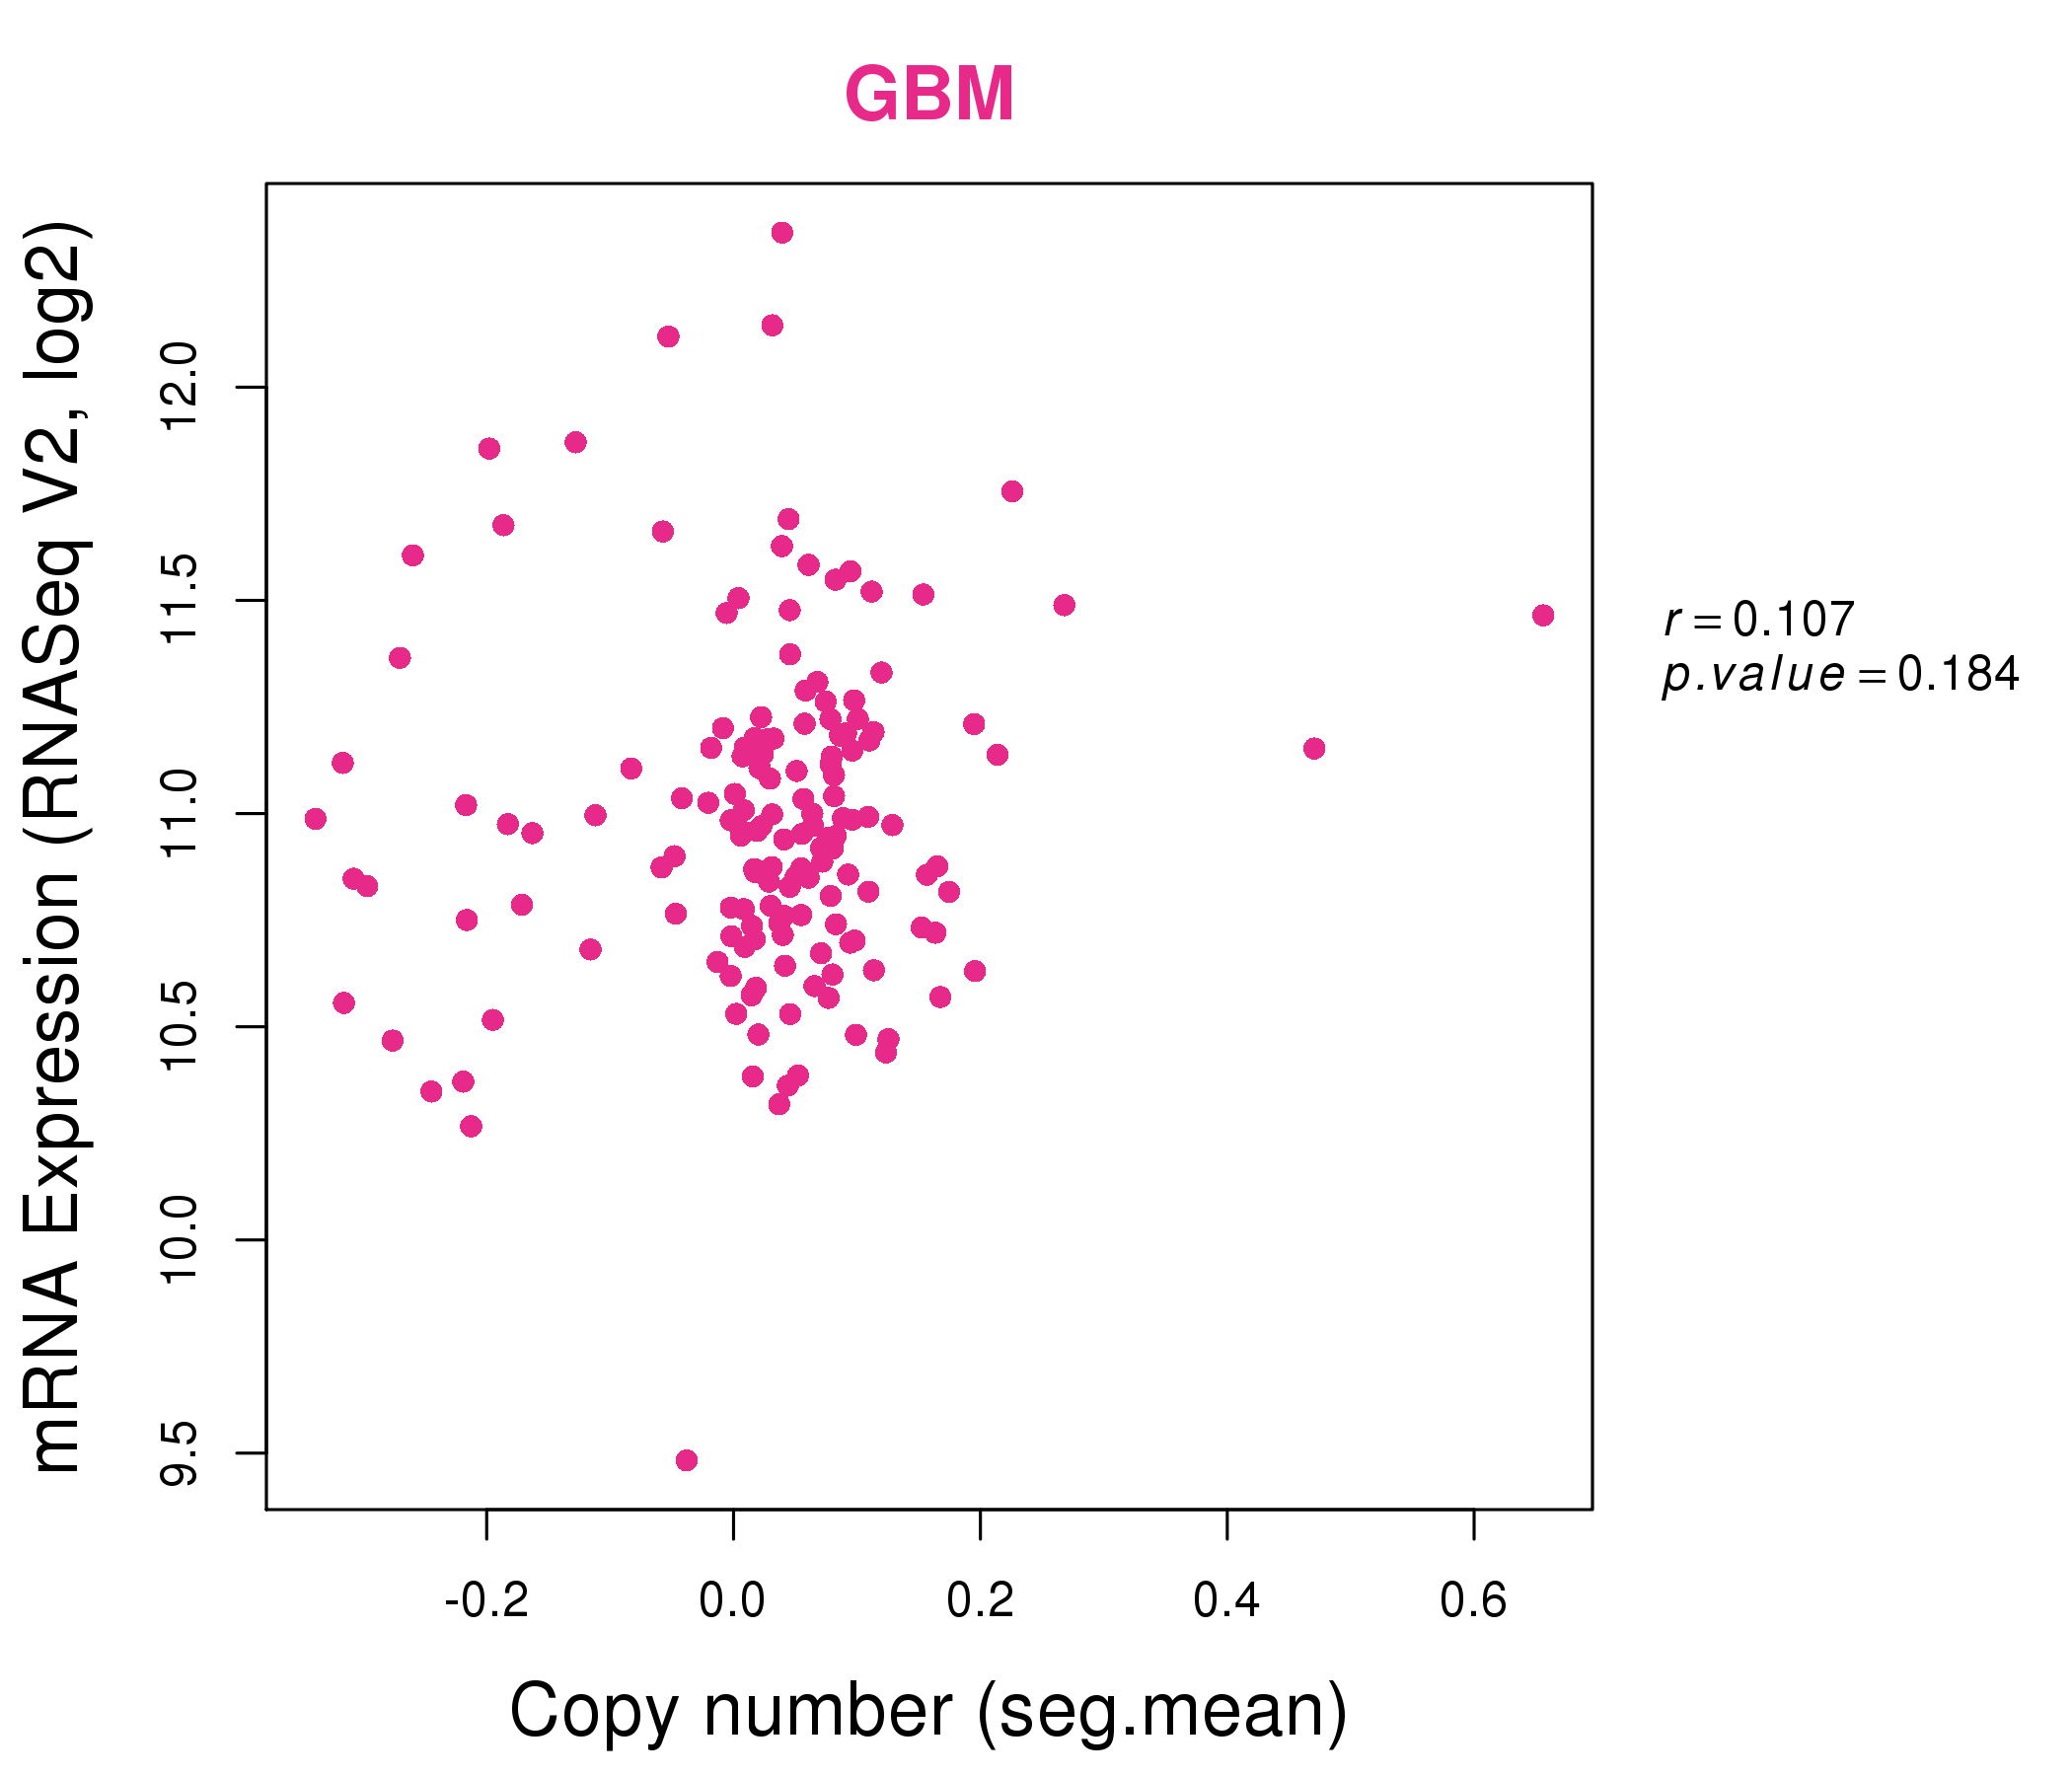
| * This plots show the correlation between CNV and gene expression. |
: Open all plots for all cancer types
 |
|
 |
|
| Top |
| Gene-Gene Network Information |
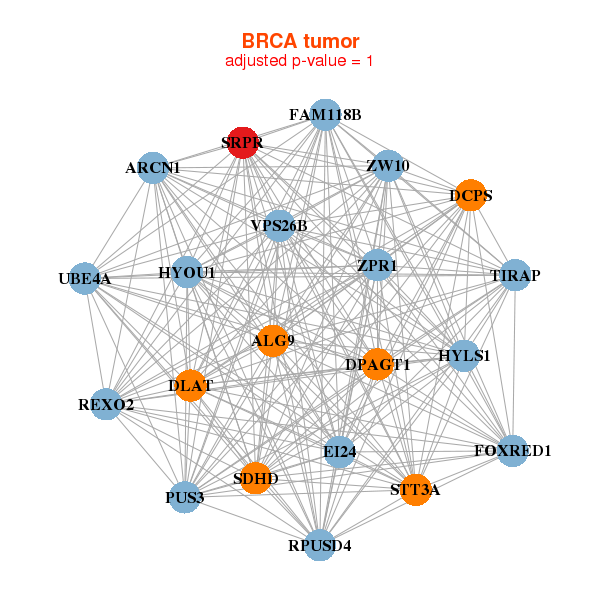
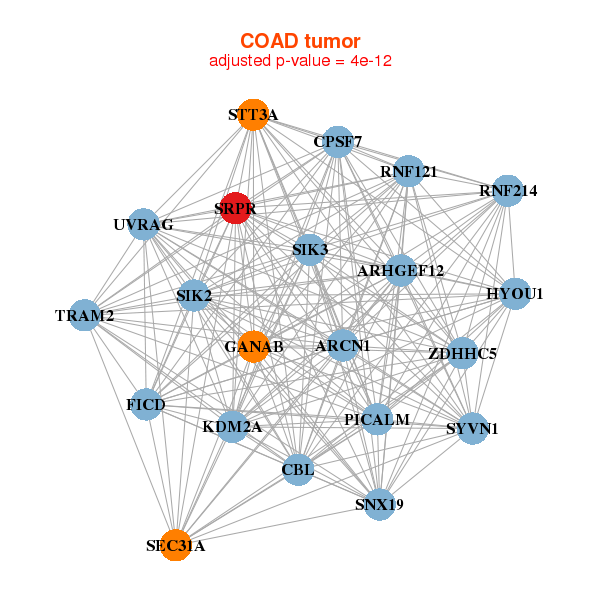
| * Co-Expression network figures were drawn using R package igraph. Only the top 20 genes with the highest correlations were shown. Red circle: input gene, orange circle: cell metabolism gene, sky circle: other gene |
: Open all plots for all cancer types
 |
|
| ALG3,BOLA3,CMC2,C20orf24,CCDC58,COPG1,DNAJB11, DRG1,ECE2,HM13,MRPL3,MRPS22,NDUFA6,OSTC, P4HB,PRDX4,RPN1,SEC61A1,SRPRB,TOMM22,UFD1L | CIAPIN1,DDOST,DPAGT1,EIF4A1,GMDS,HSPA5,ILF2, MANF,OSTC,PDIA3,PDIA6,PPIA,RAN,RPN1, RPN2,SEC61A1,SRSF9,SRPRB,SSR2,TM9SF1,TMED3 |
 |
|
| CCDC58,CHAC2,ECE2,GTPBP8,LSM2,MRPL3,MRPL54, MRPS22,NDUFB6,OSTC,POLE3,PPIL1,RPN1,SEC61B, SELT,SERP1,SRPRB,SSR3,STOML2,TIMM8B,TRIAP1 | C1QBP,CCT2,CDC123,CHAC2,DCAF13,GLRX3,GNL3, HSPE1,METTL1,MRPL3,MRTO4,PAK1IP1,PGAM5,PNO1, POLR1C,PRDX4,PREB,RAN,SNRNP40,SRPRB,TOMM5 |
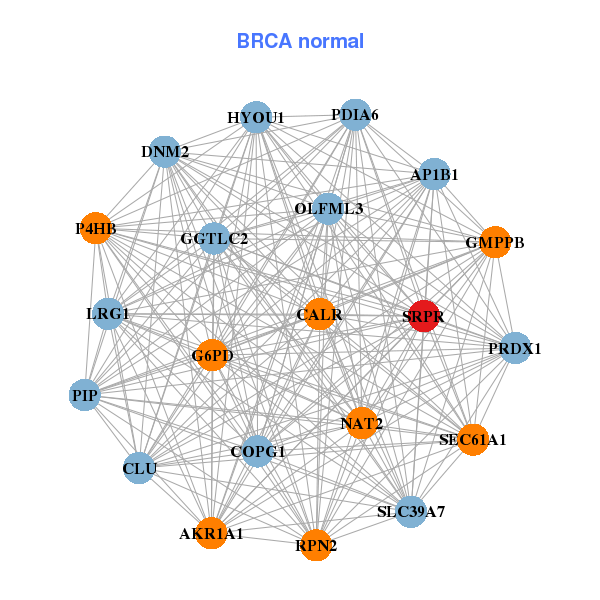
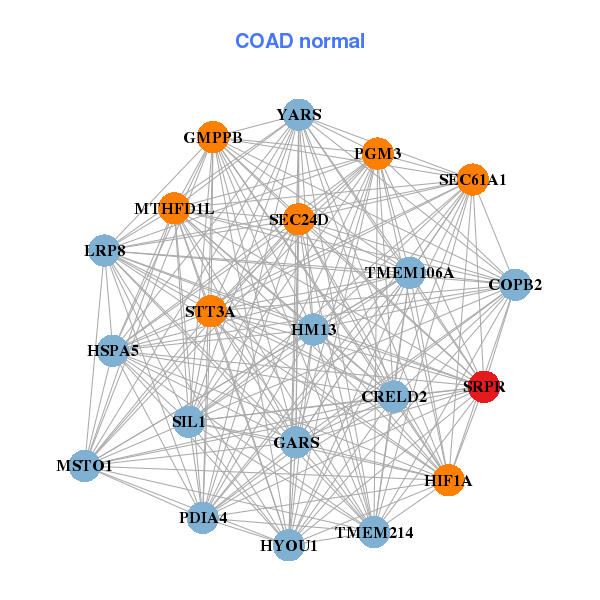
| * Co-Expression network figures were drawn using R package igraph. Only the top 20 genes with the highest correlations were shown. Red circle: input gene, orange circle: cell metabolism gene, sky circle: other gene |
: Open all plots for all cancer types
| Top |
: Open all interacting genes' information including KEGG pathway for all interacting genes from DAVID
| Top |
| Pharmacological Information for SRPR |
| There's no related Drug. |
| Top |
| Cross referenced IDs for SRPR |
| * We obtained these cross-references from Uniprot database. It covers 150 different DBs, 18 categories. http://www.uniprot.org/help/cross_references_section |
: Open all cross reference information
|
Copyright © 2016-Present - The Univsersity of Texas Health Science Center at Houston @ |