|
||||||||||||||||||||
| |
| Phenotypic Information (metabolism pathway, cancer, disease, phenome) |
| |
| |
| Gene-Gene Network Information: Co-Expression Network, Interacting Genes & KEGG |
| |
|


| Gene Summary for CALR |
| Basic gene info. | Gene symbol | CALR |
| Gene name | calreticulin | |
| Synonyms | CRT|HEL-S-99n|RO|SSA|cC1qR | |
| Cytomap | UCSC genome browser: 19p13.3-p13.2 | |
| Genomic location | chr19 :13049413-13055304 | |
| Type of gene | protein-coding | |
| RefGenes | NM_004343.3, | |
| Ensembl id | ENSG00000179218 | |
| Description | CRP55ERp60HACBPSicca syndrome antigen A (autoantigen Ro; calreticulin)calregulinendoplasmic reticulum resident protein 60epididymis secretory sperm binding protein Li 99ngrp60 | |
| Modification date | 20141222 | |
| dbXrefs | MIM : 109091 | |
| HGNC : HGNC | ||
| Ensembl : ENSG00000179218 | ||
| HPRD : 00169 | ||
| Vega : OTTHUMG00000180574 | ||
| Protein | UniProt: P27797 go to UniProt's Cross Reference DB Table | |
| Expression | CleanEX: HS_CALR | |
| BioGPS: 811 | ||
| Gene Expression Atlas: ENSG00000179218 | ||
| The Human Protein Atlas: ENSG00000179218 | ||
| Pathway | NCI Pathway Interaction Database: CALR | |
| KEGG: CALR | ||
| REACTOME: CALR | ||
| ConsensusPathDB | ||
| Pathway Commons: CALR | ||
| Metabolism | MetaCyc: CALR | |
| HUMANCyc: CALR | ||
| Regulation | Ensembl's Regulation: ENSG00000179218 | |
| miRBase: chr19 :13,049,413-13,055,304 | ||
| TargetScan: NM_004343 | ||
| cisRED: ENSG00000179218 | ||
| Context | iHOP: CALR | |
| cancer metabolism search in PubMed: CALR | ||
| UCL Cancer Institute: CALR | ||
| Assigned class in ccmGDB | A - This gene has a literature evidence and it belongs to cancer gene. | |
| References showing role of CALR in cancer cell metabolism | 1. Cleyrat C, Darehshouri A, Steinkamp MP, Vilaine M, Boassa D, et al. (2014) Mpl traffics to the cell surface through conventional and unconventional routes. Traffic 15: 961-982. doi: 10.1111/tra.12185. pmid: 4141020. go to article 2. Liu XL, Zhao D, Sun DP, Wang Y, Li Y, et al. (2012) Adenovirus-mediated delivery of CALR and MAGE-A3 inhibits invasion and angiogenesis of glioblastoma cell line U87. J Exp Clin Cancer Res 31: 8. doi: 10.1186/1756-9966-31-8. pmid: 3337230. go to article | |
| Top |
| Phenotypic Information for CALR(metabolism pathway, cancer, disease, phenome) |
| Cancer | CGAP: CALR |
| Familial Cancer Database: CALR | |
| * This gene is included in those cancer gene databases. |
|
|
|
|
|
| . | ||||||||||||||
Oncogene 1 | Significant driver gene in | |||||||||||||||||||
| cf) number; DB name 1 Oncogene; http://nar.oxfordjournals.org/content/35/suppl_1/D721.long, 2 Tumor Suppressor gene; https://bioinfo.uth.edu/TSGene/, 3 Cancer Gene Census; http://www.nature.com/nrc/journal/v4/n3/abs/nrc1299.html, 4 CancerGenes; http://nar.oxfordjournals.org/content/35/suppl_1/D721.long, 5 Network of Cancer Gene; http://ncg.kcl.ac.uk/index.php, 1Therapeutic Vulnerabilities in Cancer; http://cbio.mskcc.org/cancergenomics/statius/ |
| REACTOME_METABOLISM_OF_PROTEINS | |
| OMIM | 109091; gene. |
| Orphanet | 3318; Essential thrombocythemia. 824; Myelofibrosis with myeloid metaplasia. |
| Disease | KEGG Disease: CALR |
| MedGen: CALR (Human Medical Genetics with Condition) | |
| ClinVar: CALR | |
| Phenotype | MGI: CALR (International Mouse Phenotyping Consortium) |
| PhenomicDB: CALR | |
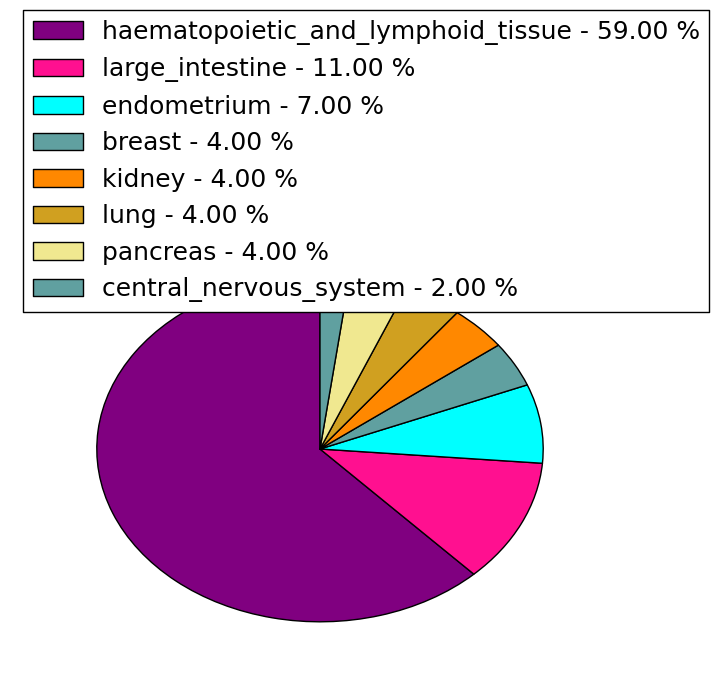
| Mutations for CALR |
| * Under tables are showing count per each tissue to give us broad intuition about tissue specific mutation patterns.You can go to the detailed page for each mutation database's web site. |
| - Statistics for Tissue and Mutation type | Top |
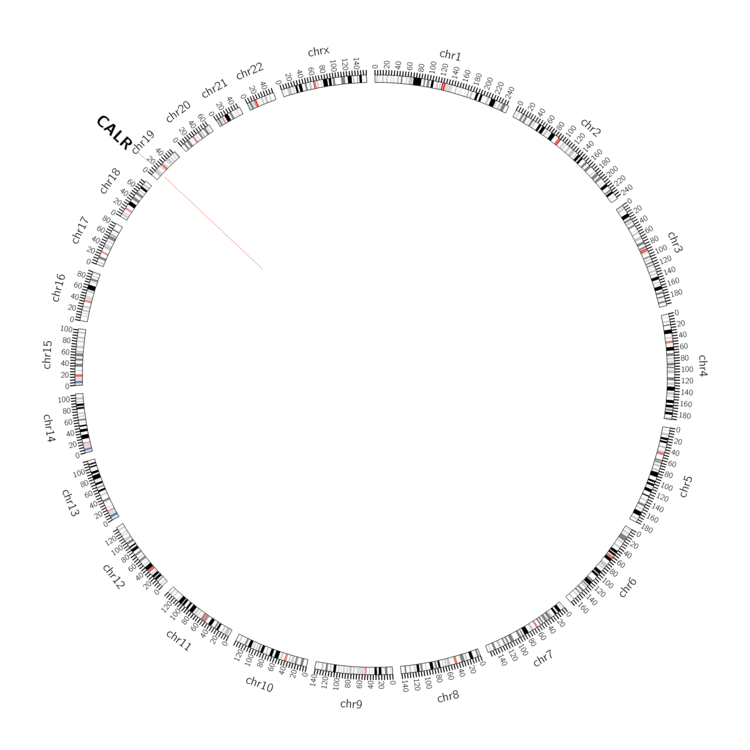 |
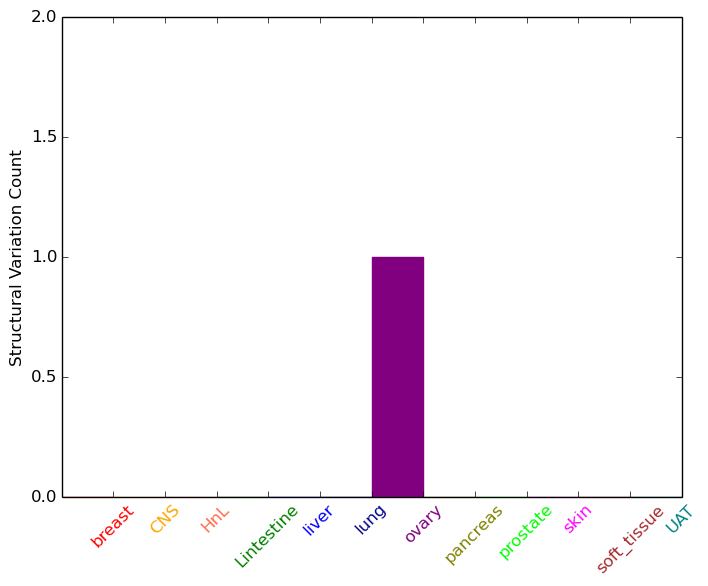
| - For Inter-chromosomal Variations |
| There's no inter-chromosomal structural variation. |
| - For Intra-chromosomal Variations |
| * Intra-chromosomal variantions includes 'intrachromosomal amplicon to amplicon', 'intrachromosomal amplicon to non-amplified dna', 'intrachromosomal deletion', 'intrachromosomal fold-back inversion', 'intrachromosomal inversion', 'intrachromosomal tandem duplication', 'Intrachromosomal unknown type', 'intrachromosomal with inverted orientation', 'intrachromosomal with non-inverted orientation'. |
 |
| Sample | Symbol_a | Chr_a | Start_a | End_a | Symbol_b | Chr_b | Start_b | End_b |
| ovary | CALR | chr19 | 13050078 | 13050098 | CALR | chr19 | 13052687 | 13052707 |
| cf) Tissue number; Tissue name (1;Breast, 2;Central_nervous_system, 3;Haematopoietic_and_lymphoid_tissue, 4;Large_intestine, 5;Liver, 6;Lung, 7;Ovary, 8;Pancreas, 9;Prostate, 10;Skin, 11;Soft_tissue, 12;Upper_aerodigestive_tract) |
| * From mRNA Sanger sequences, Chitars2.0 arranged chimeric transcripts. This table shows CALR related fusion information. |
| ID | Head Gene | Tail Gene | Accession | Gene_a | qStart_a | qEnd_a | Chromosome_a | tStart_a | tEnd_a | Gene_a | qStart_a | qEnd_a | Chromosome_a | tStart_a | tEnd_a |
| BE837730 | CALR | 4 | 134 | 19 | 13050894 | 13051121 | MCM3 | 126 | 275 | 6 | 52137100 | 52137249 | |
| BQ305064 | NME4 | 1 | 197 | 16 | 449730 | 450405 | CALR | 190 | 533 | 19 | 13050924 | 13051448 | |
| CA425105 | RPLP2 | 22 | 338 | 11 | 810303 | 812873 | CALR | 333 | 615 | 19 | 13051583 | 13054597 | |
| BU191818 | KIF18B | 1 | 384 | 17 | 43003791 | 43005610 | CALR | 385 | 913 | 19 | 13049435 | 13050937 | |
| AW615310 | GPR115 | 22 | 369 | 6 | 47689402 | 47689749 | CALR | 363 | 559 | 19 | 13054658 | 13054854 | |
| BX501381 | RYR2 | 4 | 449 | 1 | 237794746 | 237801769 | CALR | 444 | 563 | 19 | 13055184 | 13055303 | |
| BF873592 | NDRG2 | 1 | 131 | 14 | 21485187 | 21485317 | CALR | 129 | 390 | 19 | 13054348 | 13054692 | |
| BE763150 | CALR | 1 | 164 | 19 | 13051604 | 13054416 | CALR | 163 | 228 | 19 | 13054525 | 13054590 | |
| D83840 | CALR | 1 | 56 | 19 | 13050261 | 13050316 | CALR | 52 | 473 | 19 | 13050325 | 13051266 | |
| BQ304201 | CALR | 14 | 206 | 19 | 13050313 | 13050926 | CALR | 203 | 354 | 19 | 13050929 | 13051175 | |
| BG491927 | FAU | 20 | 101 | 11 | 64888178 | 64888260 | CALR | 98 | 950 | 19 | 13050328 | 13054606 | |
| BE005287 | OXSR1 | 10 | 248 | 3 | 38284244 | 38289224 | CALR | 246 | 380 | 19 | 13050895 | 13051124 | |
| AW367058 | CALR | 37 | 431 | 19 | 13051156 | 13054375 | CALR | 427 | 537 | 19 | 13054369 | 13054561 | |
| BE717818 | TENM4 | 33 | 304 | 11 | 78860798 | 78861068 | CALR | 295 | 453 | 19 | 13051432 | 13051680 | |
| C06296 | CALR | 1 | 56 | 19 | 13050261 | 13050316 | CALR | 52 | 411 | 19 | 13050325 | 13051205 | |
| N39173 | CALR | 4 | 342 | 19 | 13050417 | 13055301 | CALR | 341 | 459 | 19 | 13050369 | 13050905 | |
| Top |
| There's no copy number variation information in COSMIC data for this gene. |
| Top |
|
 |
| Top |
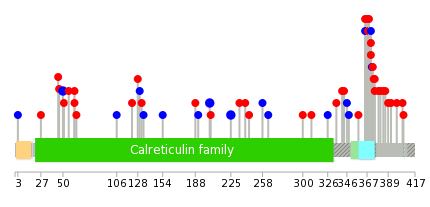
| Stat. for Non-Synonymous SNVs (# total SNVs=42) | (# total SNVs=16) |
 | 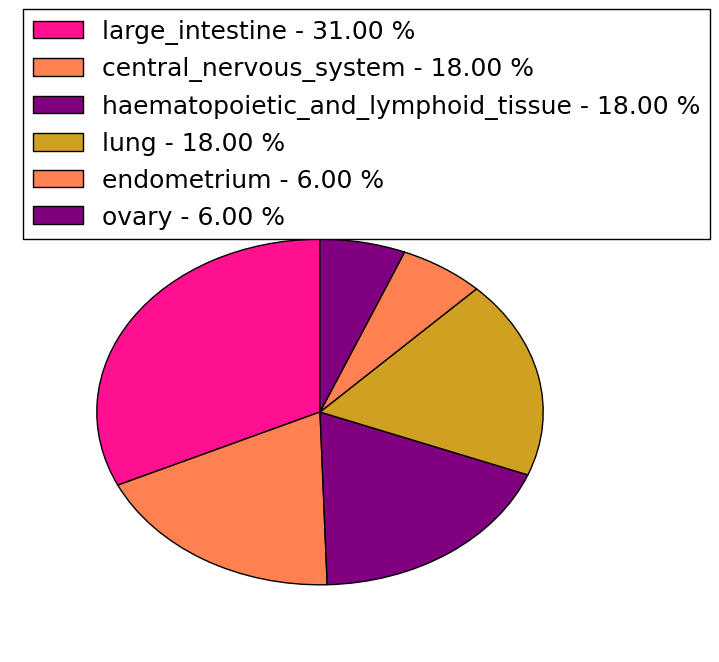 |
(# total SNVs=1017) | (# total SNVs=492) |
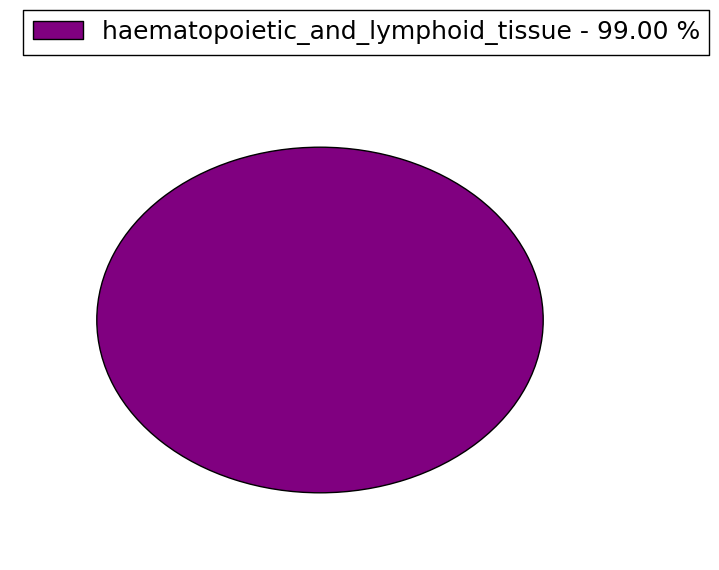 | 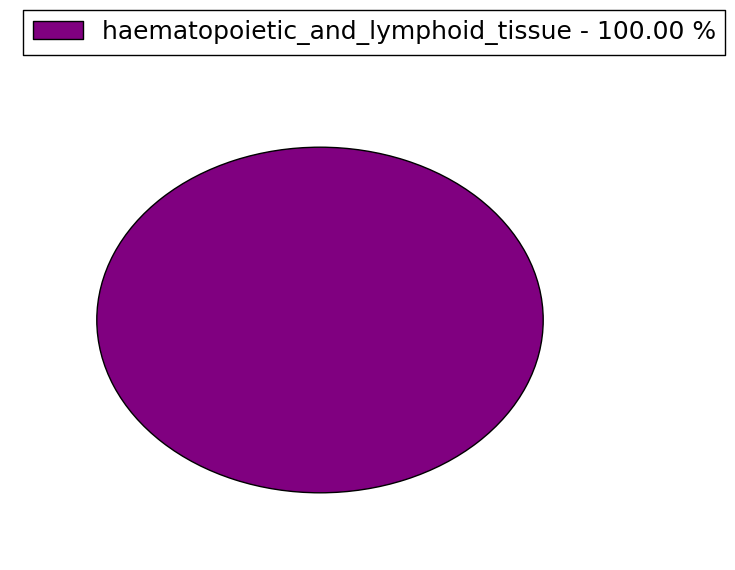 |
| Top |
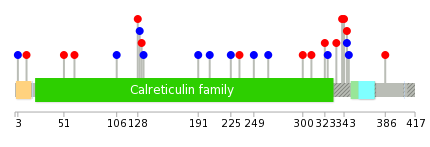
| * When you move the cursor on each content, you can see more deailed mutation information on the Tooltip. Those are primary_site,primary_histology,mutation(aa),pubmedID. |
| GRCh37 position | Mutation(aa) | Unique sampleID count |
| chr19:13054565-13054616 | p.L367fs*46 | 740 |
| chr19:13054627-13054628 | p.K385fs*47 | 433 |
| chr19:13054564-13054615 | p.E364fs*46 | 105 |
| chr19:13054575-13054608 | p.K368fs*51 | 11 |
| chr19:13054627-13054627 | p.K385fs*47 | 10 |
| chr19:13054568-13054613 | p.L367fs*48 | 10 |
| chr19:13054573-13054618 | p.L367fs*48 | 4 |
| chr19:13054595-13054598 | p.K374fs*55 | 4 |
| chr19:13054567-13054612 | p.Q365fs*50 | 4 |
| chr19:13054628-13054629 | p.E386fs*46 | 4 |
| Top |
|
 |
| Point Mutation/ Tissue ID | 1 | 2 | 3 | 4 | 5 | 6 | 7 | 8 | 9 | 10 | 11 | 12 | 13 | 14 | 15 | 16 | 17 | 18 | 19 | 20 |
| # sample | 1 | 1 | 4 | 2 | 1 | 1 | 2 | 2 | 2 | 1 | 2 | 4 | ||||||||
| # mutation | 1 | 1 | 4 | 2 | 1 | 1 | 2 | 2 | 2 | 1 | 2 | 4 | ||||||||
| nonsynonymous SNV | 1 | 1 | 1 | 1 | 1 | 1 | 1 | 2 | 3 | |||||||||||
| synonymous SNV | 1 | 3 | 2 | 1 | 2 | 1 | 1 |
| cf) Tissue ID; Tissue type (1; BLCA[Bladder Urothelial Carcinoma], 2; BRCA[Breast invasive carcinoma], 3; CESC[Cervical squamous cell carcinoma and endocervical adenocarcinoma], 4; COAD[Colon adenocarcinoma], 5; GBM[Glioblastoma multiforme], 6; Glioma Low Grade, 7; HNSC[Head and Neck squamous cell carcinoma], 8; KICH[Kidney Chromophobe], 9; KIRC[Kidney renal clear cell carcinoma], 10; KIRP[Kidney renal papillary cell carcinoma], 11; LAML[Acute Myeloid Leukemia], 12; LUAD[Lung adenocarcinoma], 13; LUSC[Lung squamous cell carcinoma], 14; OV[Ovarian serous cystadenocarcinoma ], 15; PAAD[Pancreatic adenocarcinoma], 16; PRAD[Prostate adenocarcinoma], 17; SKCM[Skin Cutaneous Melanoma], 18:STAD[Stomach adenocarcinoma], 19:THCA[Thyroid carcinoma], 20:UCEC[Uterine Corpus Endometrial Carcinoma]) |
| Top |
| * We represented just top 10 SNVs. When you move the cursor on each content, you can see more deailed mutation information on the Tooltip. Those are primary_site, primary_histology, mutation(aa), pubmedID. |
| Genomic Position | Mutation(aa) | Unique sampleID count |
| chr19:13050366 | p.G106G | 1 |
| chr19:13051640 | p.E341G | 1 |
| chr19:13050431 | p.Y128C | 1 |
| chr19:13051666 | p.G343D | 1 |
| chr19:13050438 | p.I130I | 1 |
| chr19:13054358 | p.T346M | 1 |
| chr19:13050442 | p.F132L | 1 |
| chr19:13054368 | p.T346T | 1 |
| chr19:13050871 | p.P134P | 1 |
| chr19:13054393 | p.G348G | 1 |
| * Copy number data were extracted from TCGA using R package TCGA-Assembler. The URLs of all public data files on TCGA DCC data server were gathered on Jan-05-2015. Function ProcessCNAData in TCGA-Assembler package was used to obtain gene-level copy number value which is calculated as the average copy number of the genomic region of a gene. |
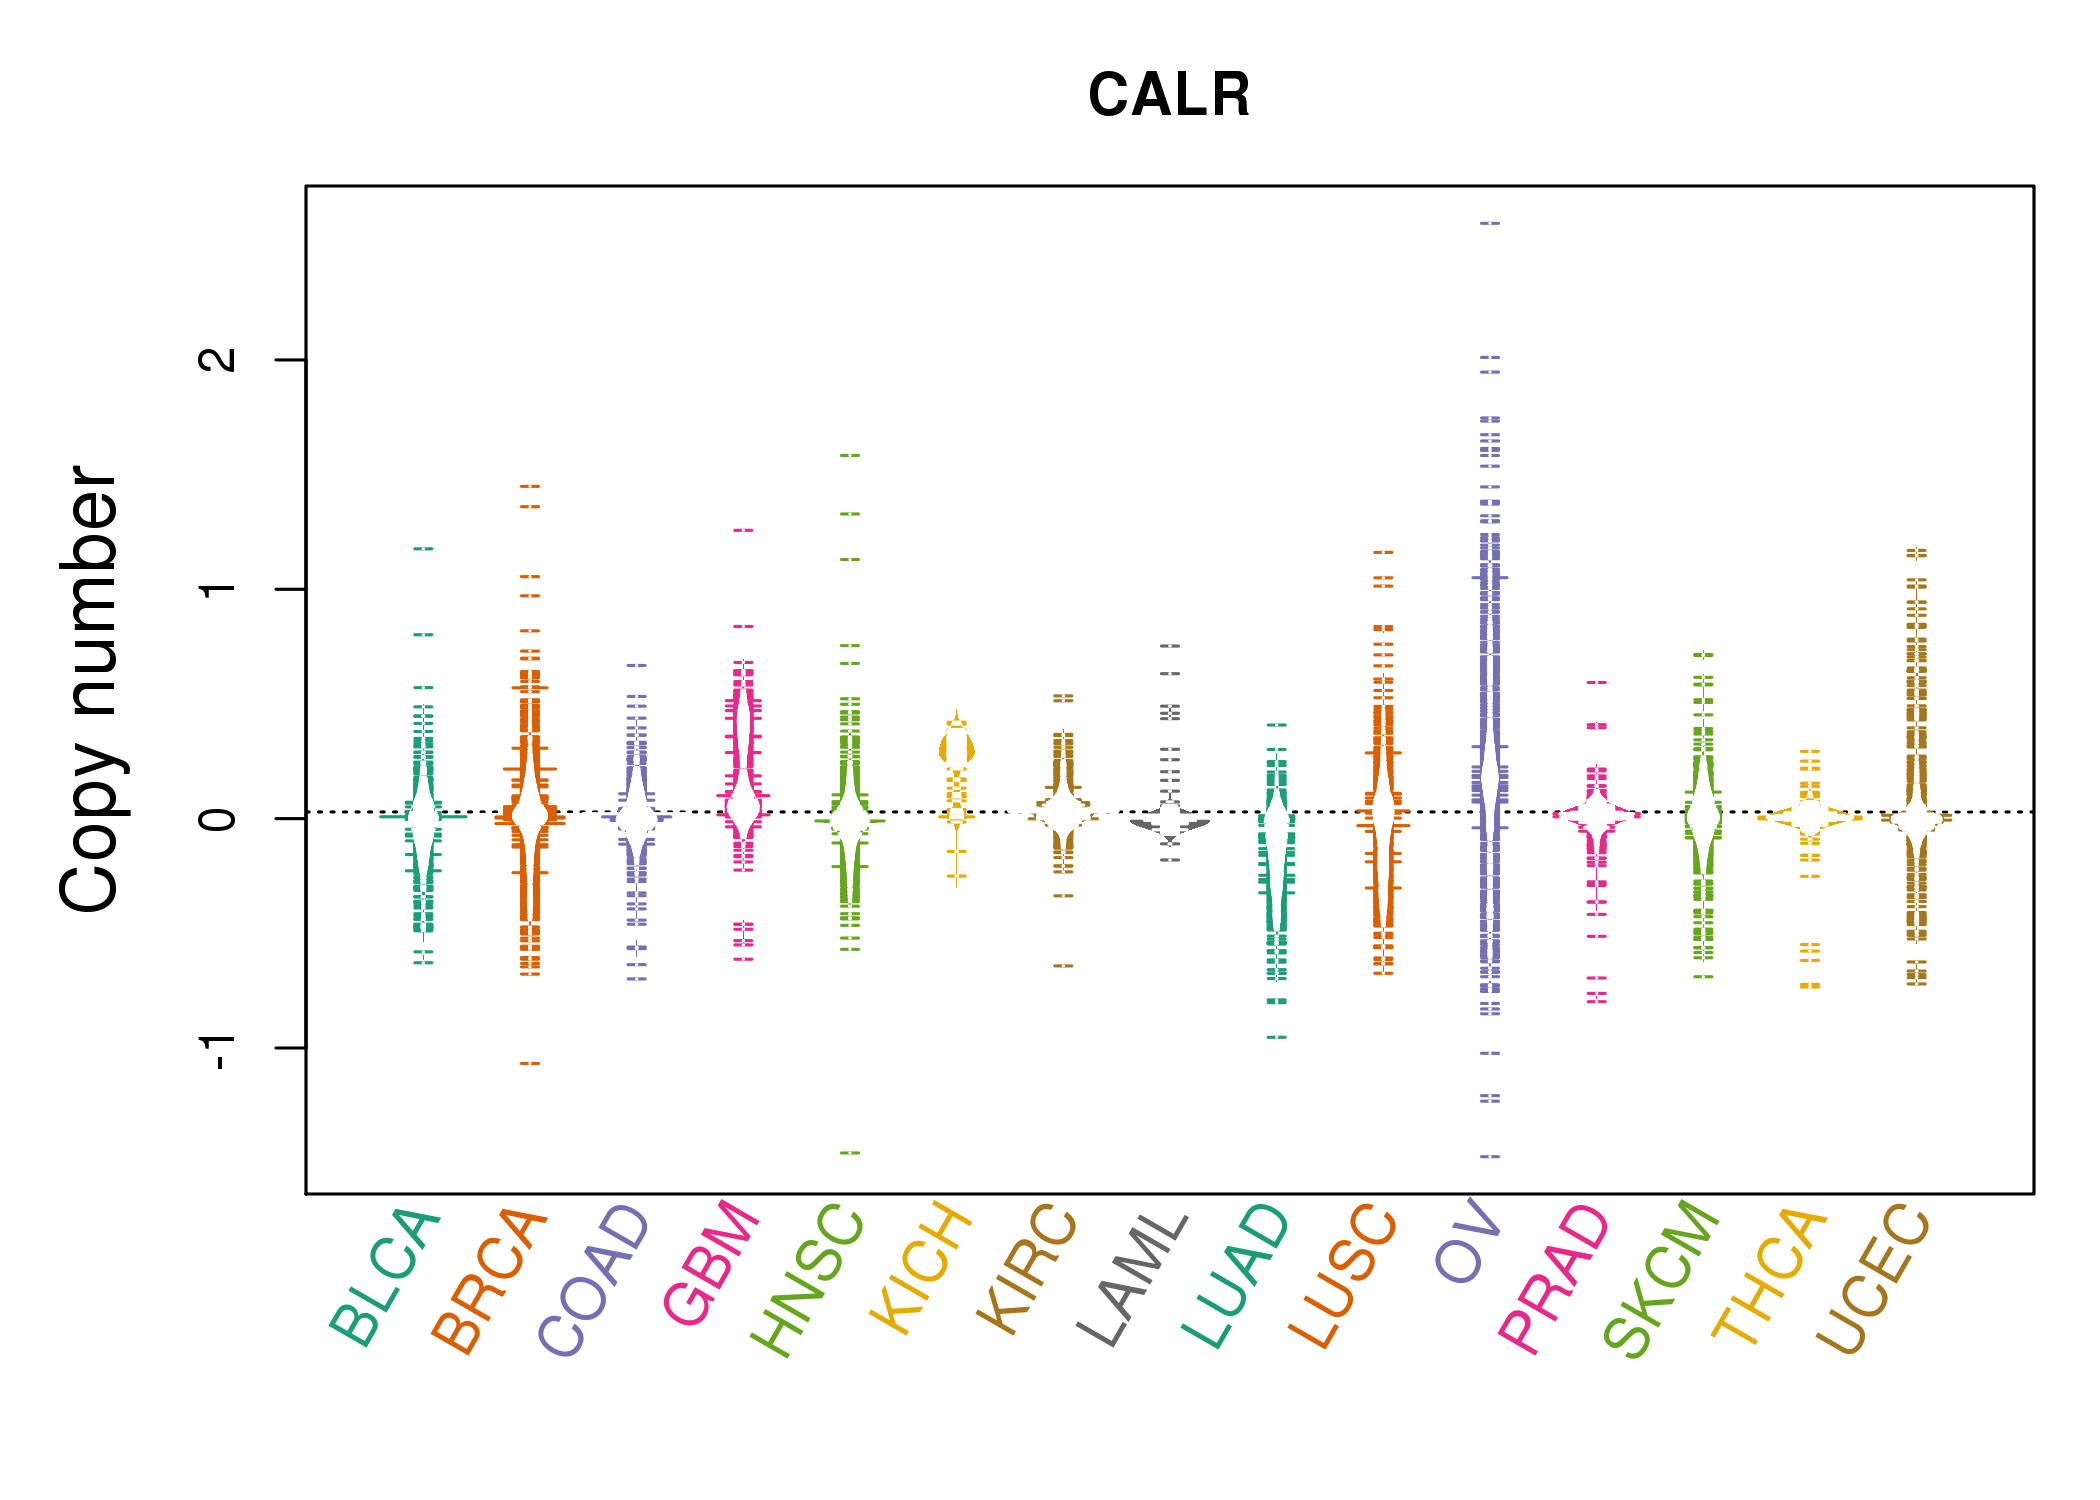 |
| cf) Tissue ID[Tissue type]: BLCA[Bladder Urothelial Carcinoma], BRCA[Breast invasive carcinoma], CESC[Cervical squamous cell carcinoma and endocervical adenocarcinoma], COAD[Colon adenocarcinoma], GBM[Glioblastoma multiforme], Glioma Low Grade, HNSC[Head and Neck squamous cell carcinoma], KICH[Kidney Chromophobe], KIRC[Kidney renal clear cell carcinoma], KIRP[Kidney renal papillary cell carcinoma], LAML[Acute Myeloid Leukemia], LUAD[Lung adenocarcinoma], LUSC[Lung squamous cell carcinoma], OV[Ovarian serous cystadenocarcinoma ], PAAD[Pancreatic adenocarcinoma], PRAD[Prostate adenocarcinoma], SKCM[Skin Cutaneous Melanoma], STAD[Stomach adenocarcinoma], THCA[Thyroid carcinoma], UCEC[Uterine Corpus Endometrial Carcinoma] |
| Top |
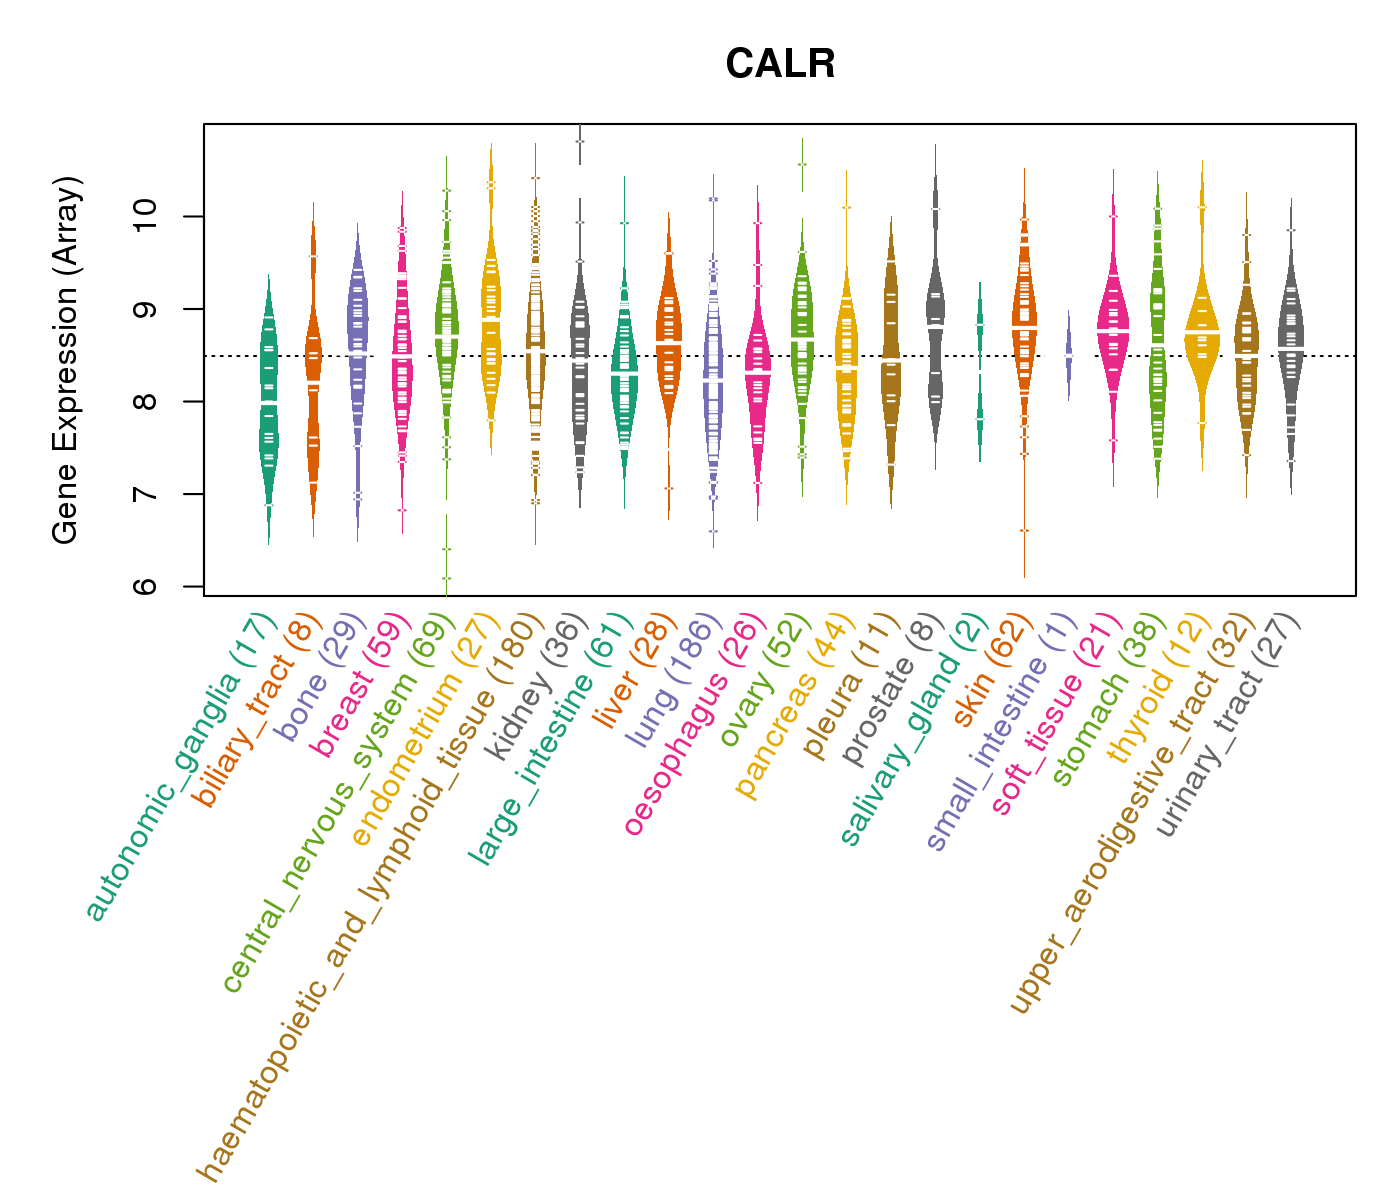
| Gene Expression for CALR |
| * CCLE gene expression data were extracted from CCLE_Expression_Entrez_2012-10-18.res: Gene-centric RMA-normalized mRNA expression data. |
 |
| * Normalized gene expression data of RNASeqV2 was extracted from TCGA using R package TCGA-Assembler. The URLs of all public data files on TCGA DCC data server were gathered at Jan-05-2015. Only eight cancer types have enough normal control samples for differential expression analysis. (t test, adjusted p<0.05 (using Benjamini-Hochberg FDR)) |
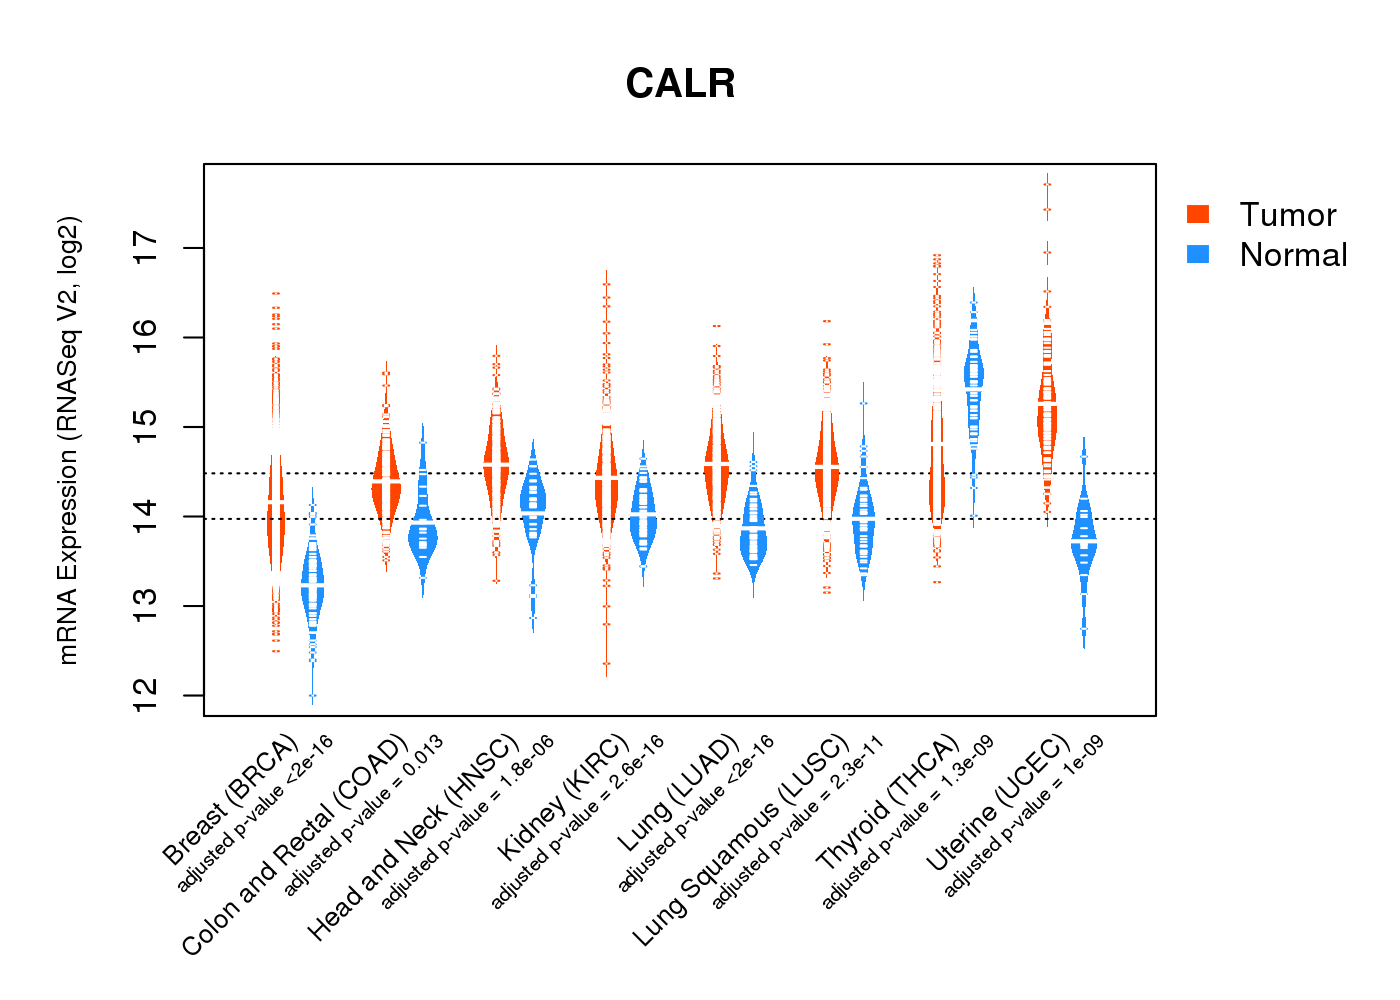 |
| Top |
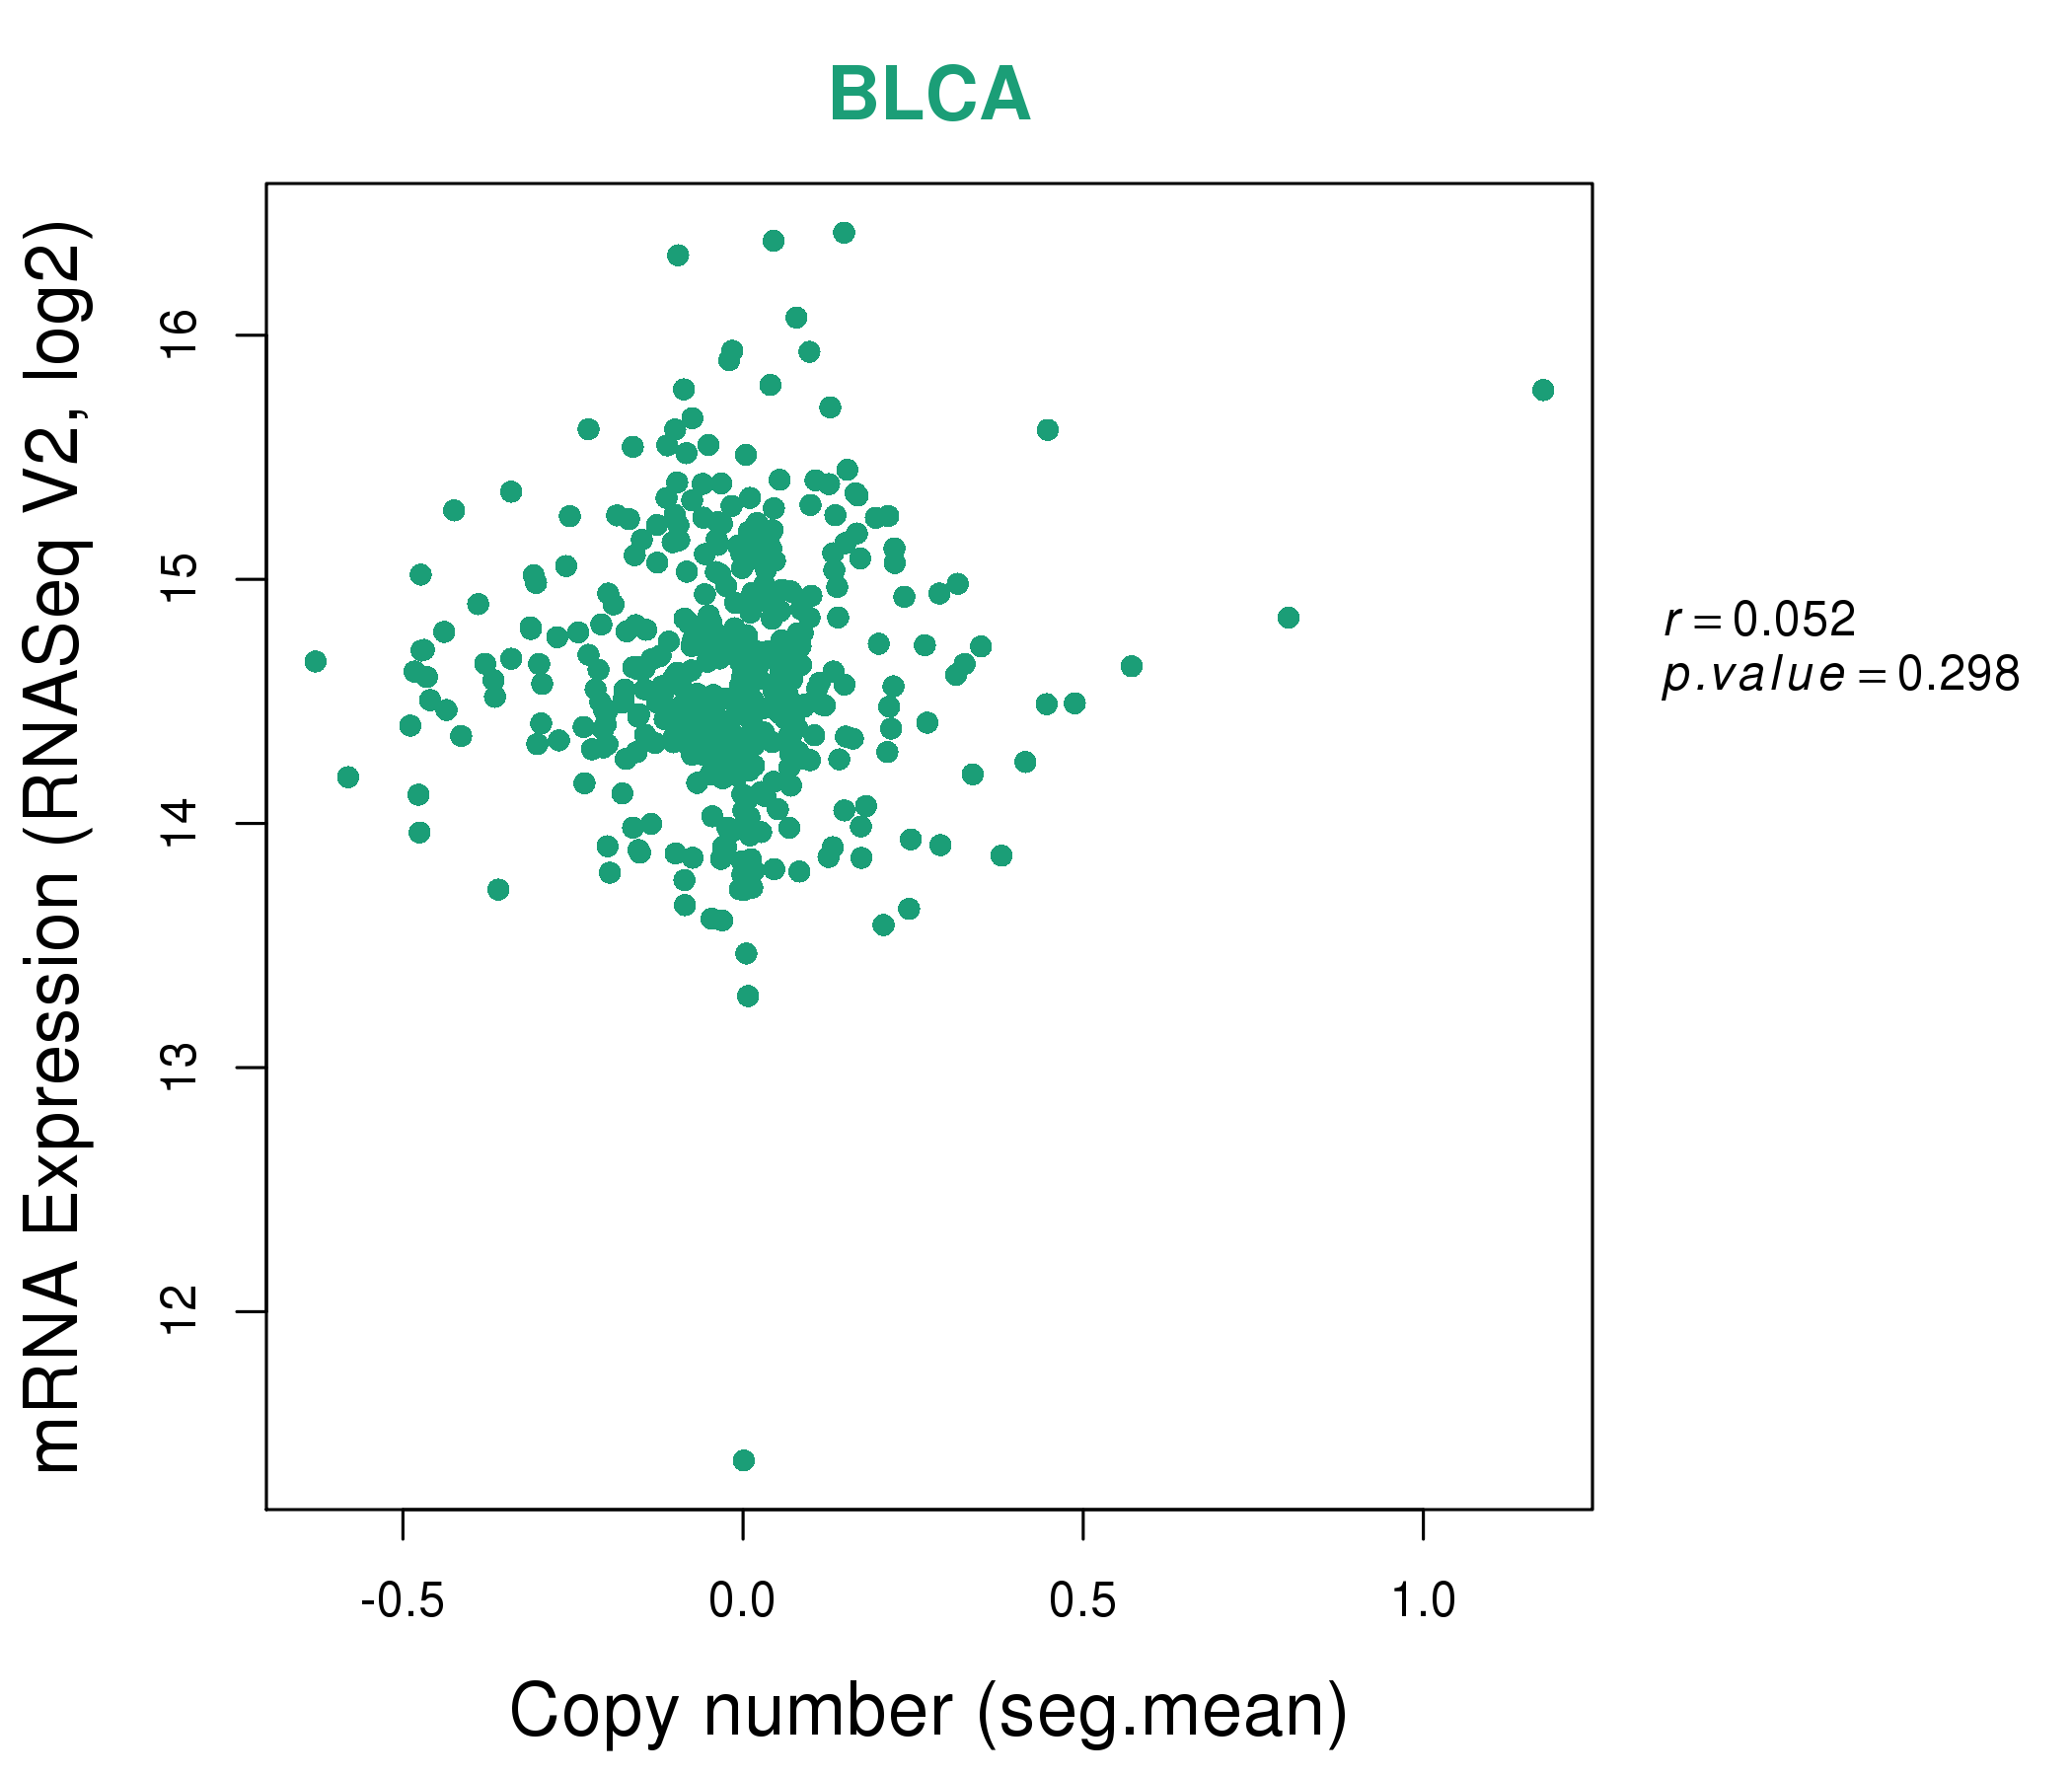
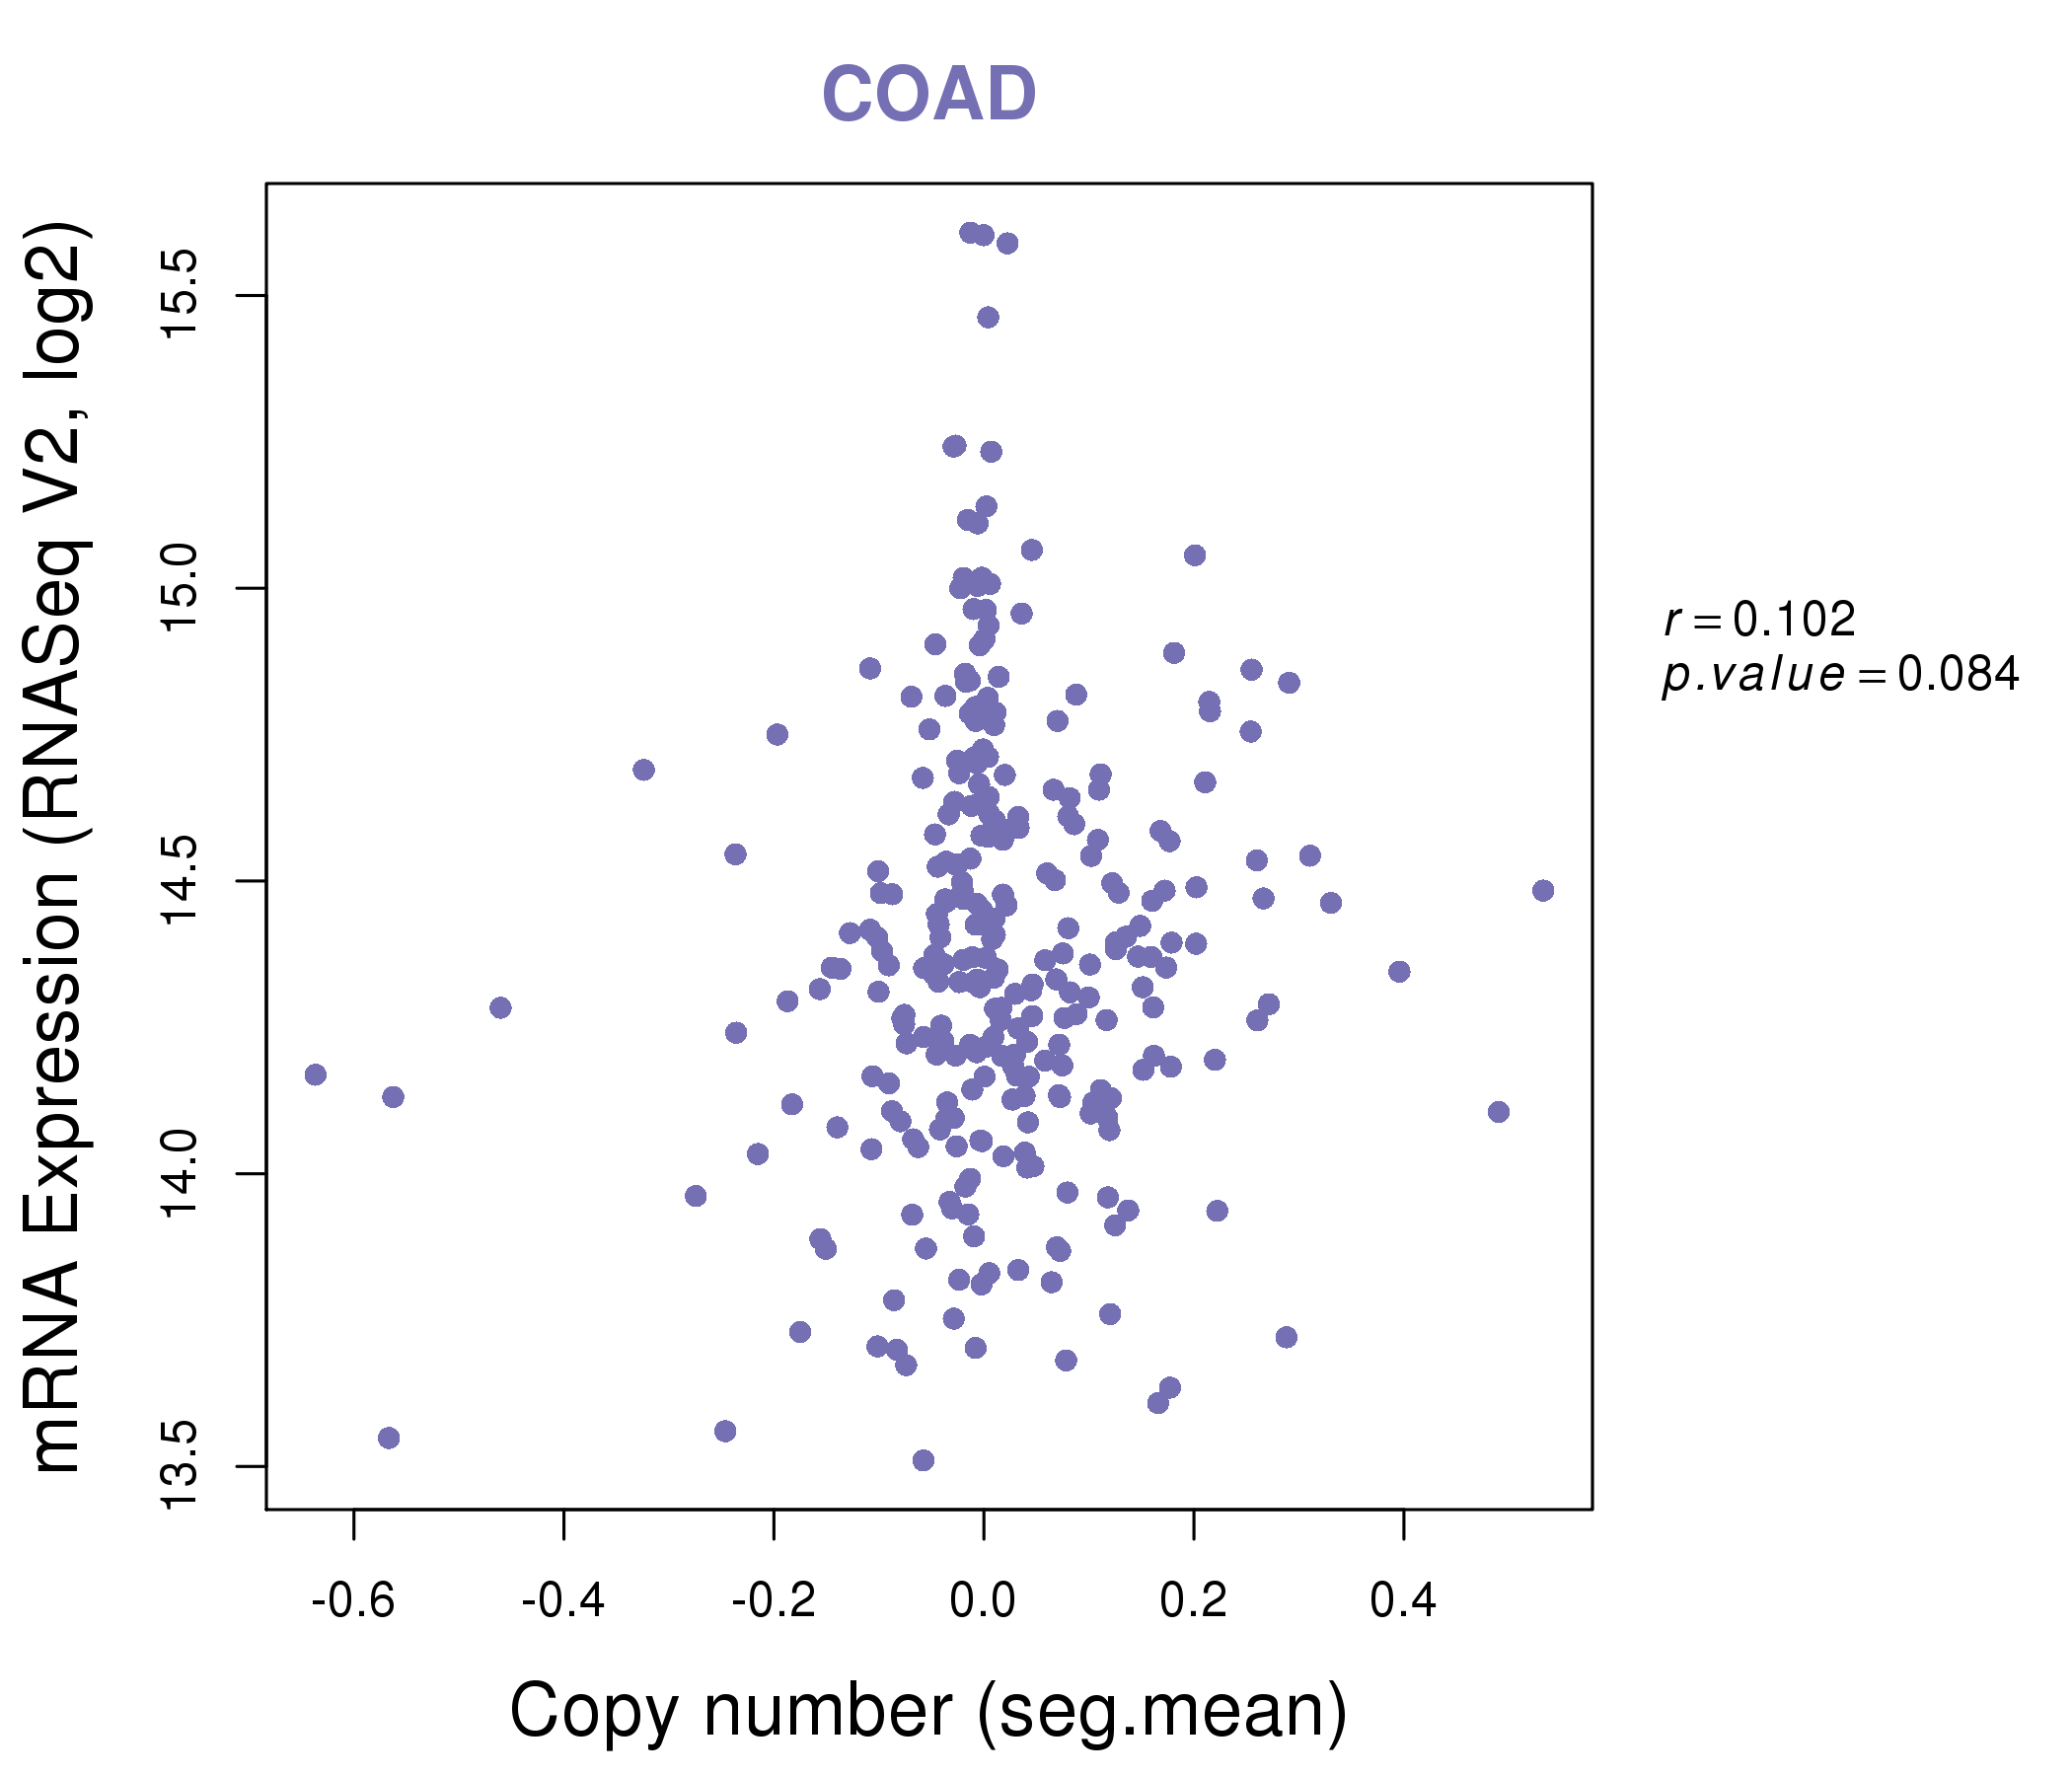
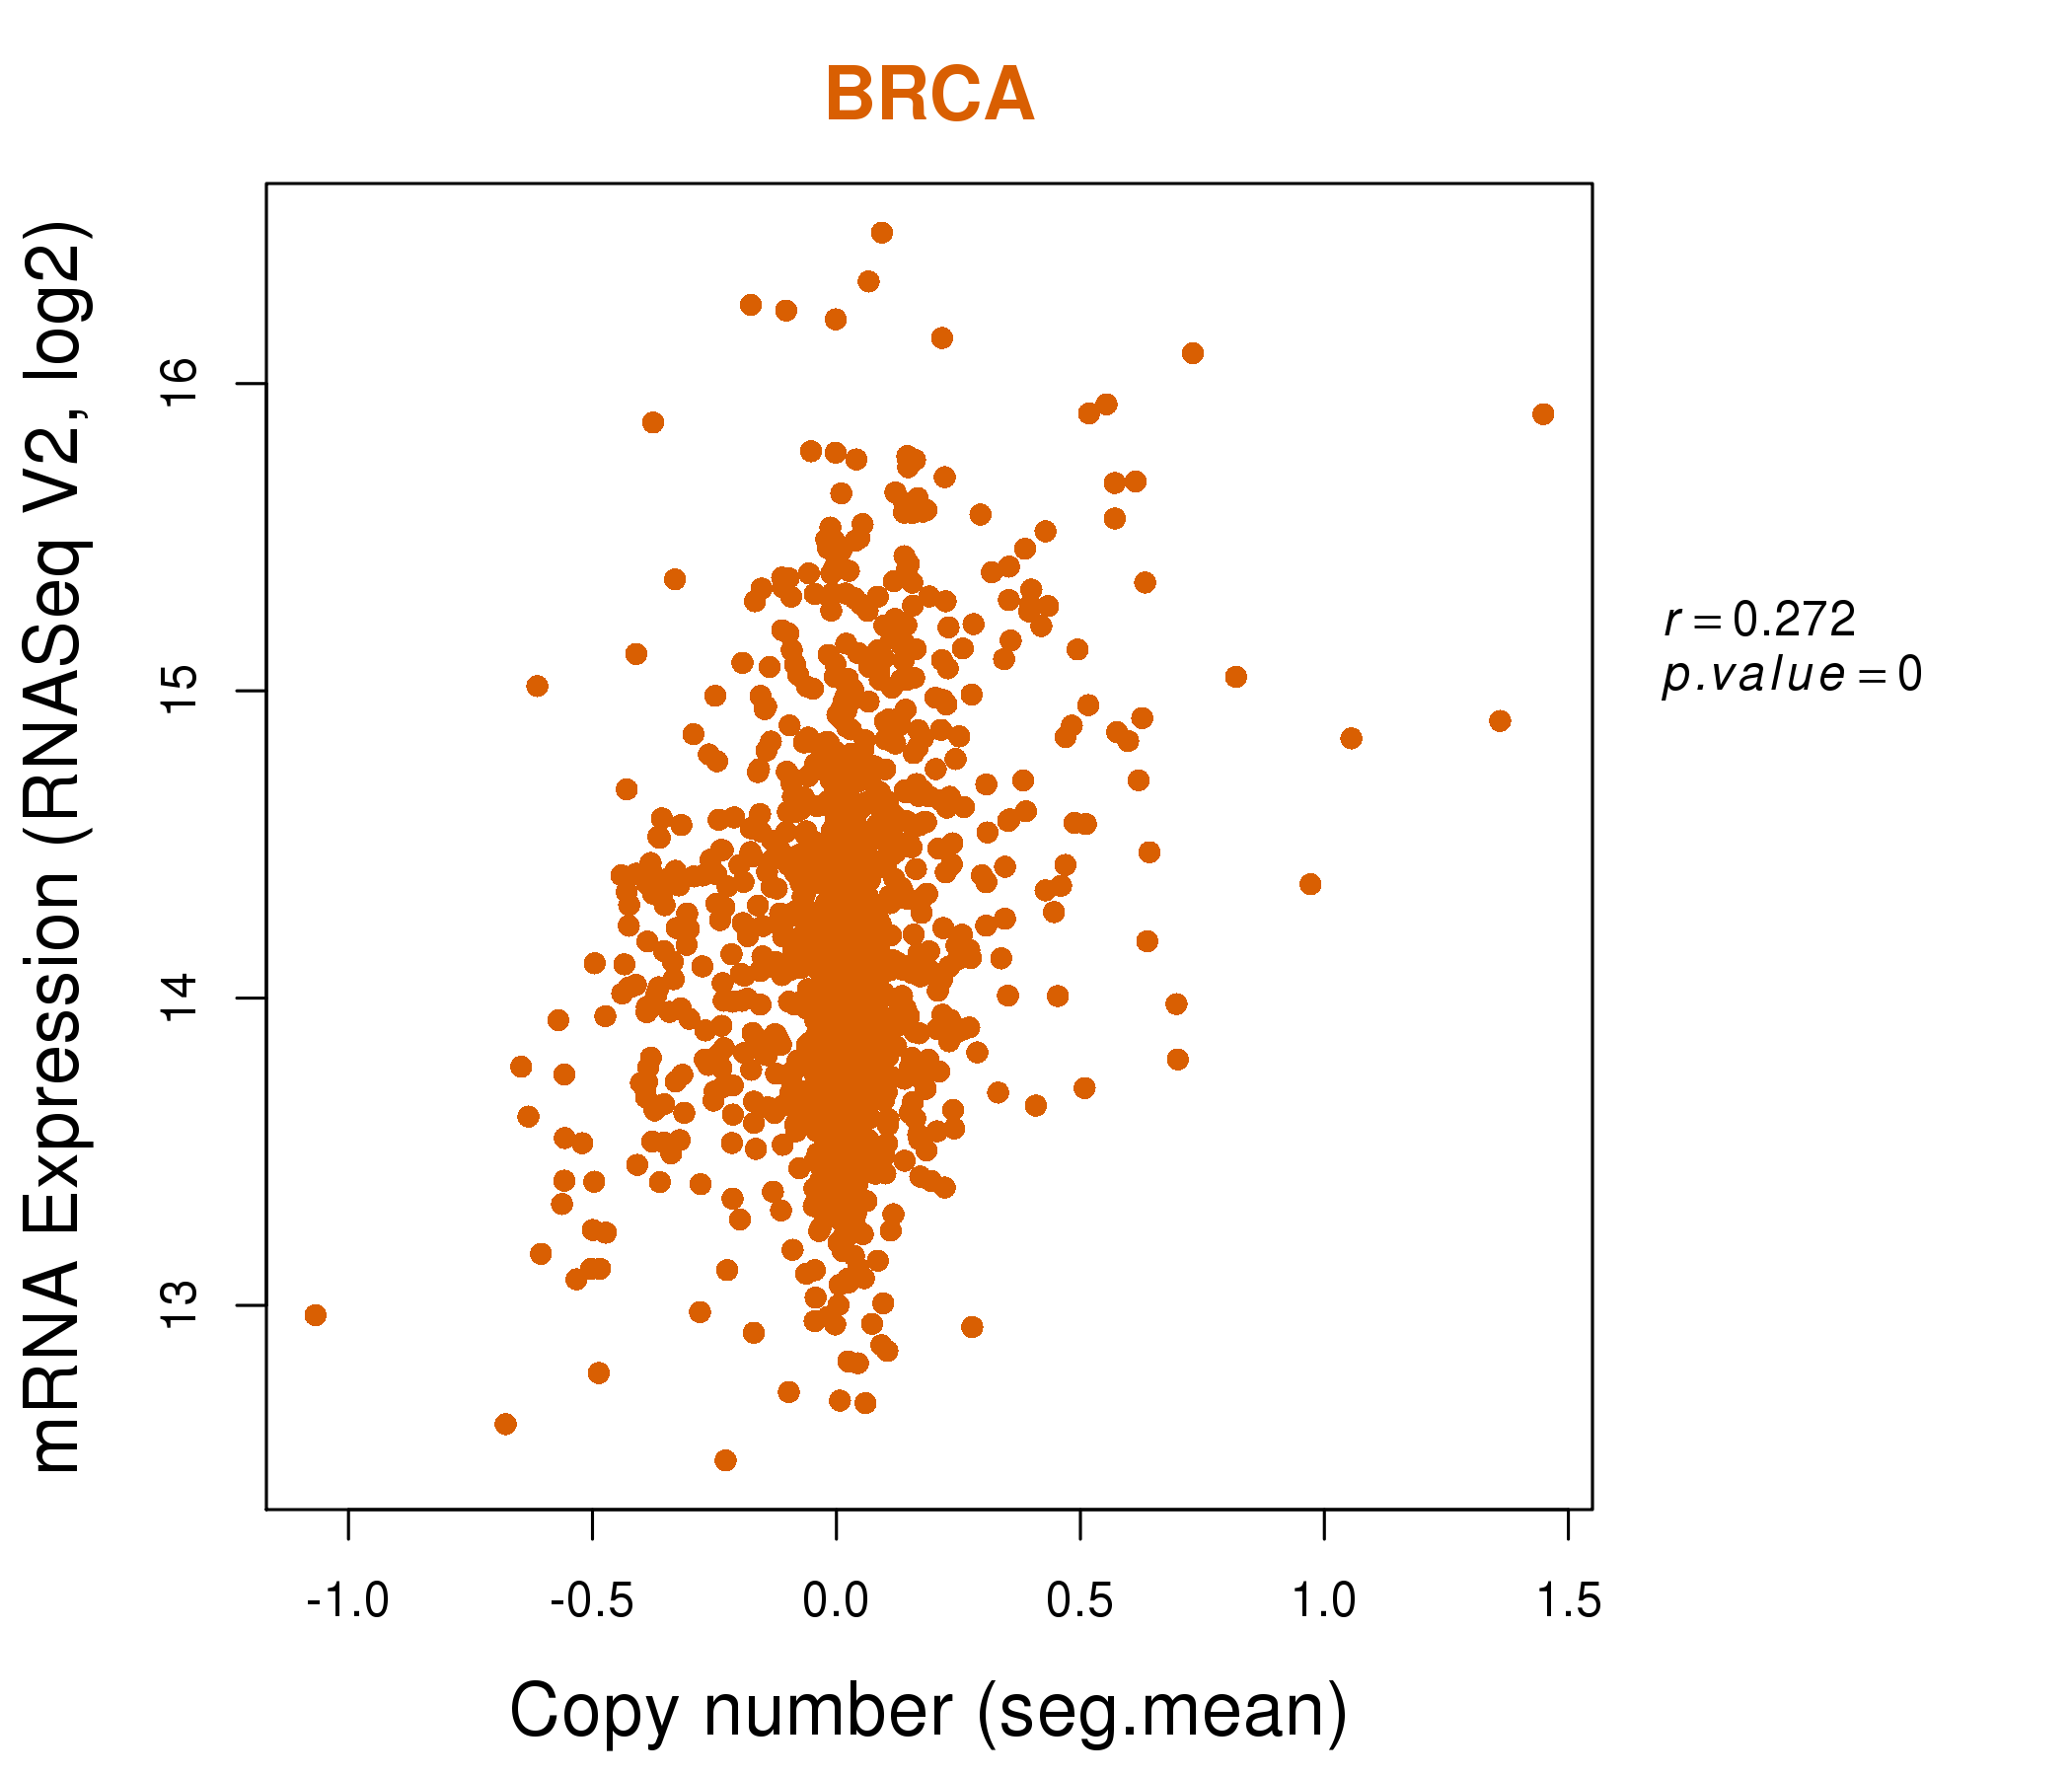
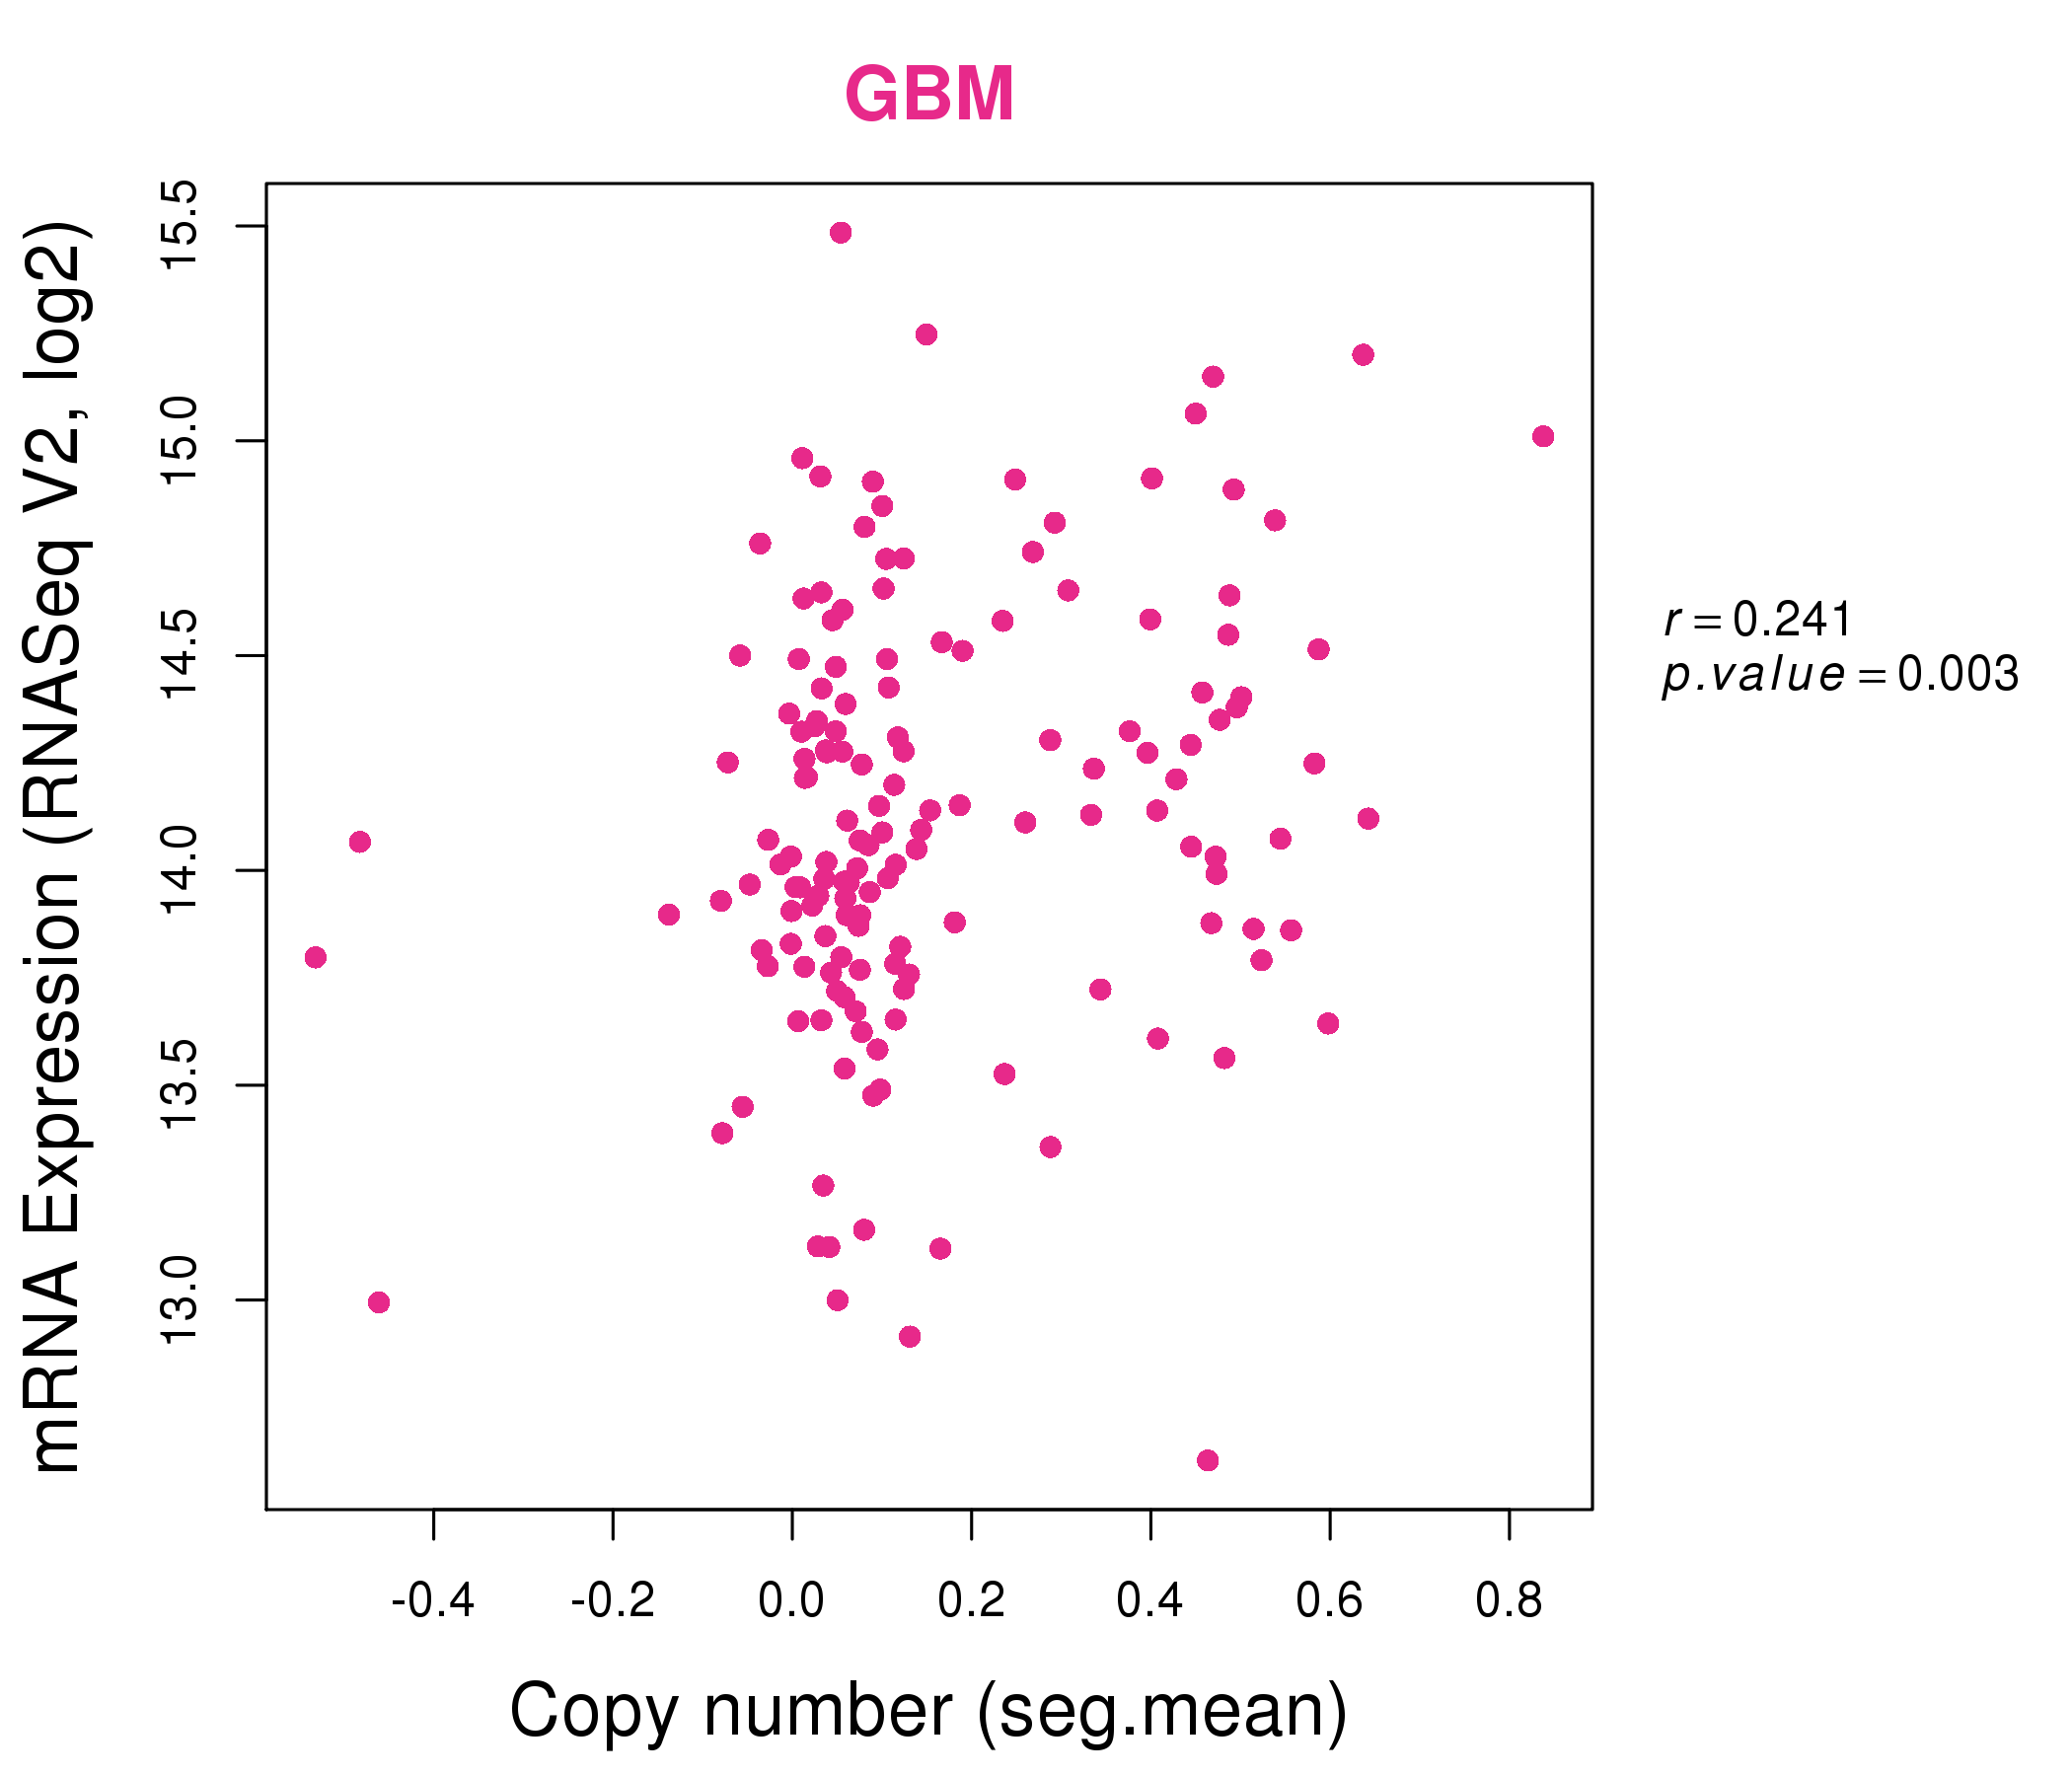
| * This plots show the correlation between CNV and gene expression. |
: Open all plots for all cancer types
 |
|
 |
|
| Top |
| Gene-Gene Network Information |
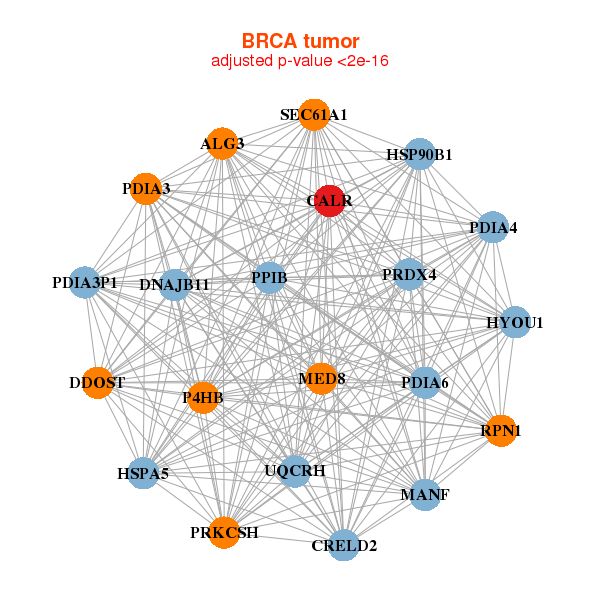
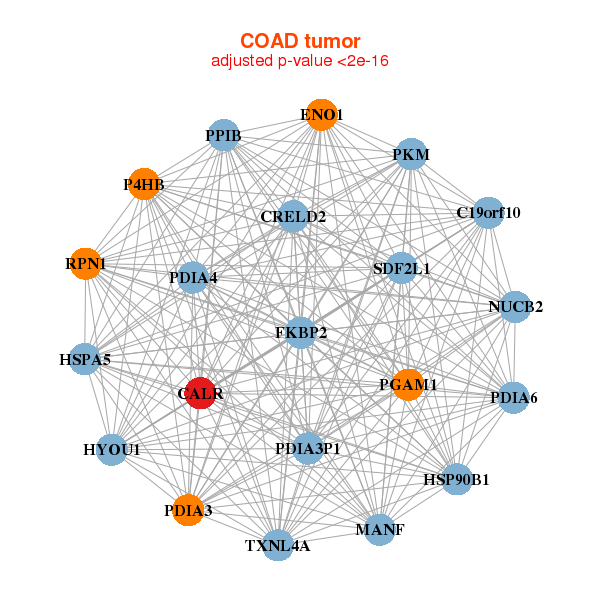
| * Co-Expression network figures were drawn using R package igraph. Only the top 20 genes with the highest correlations were shown. Red circle: input gene, orange circle: cell metabolism gene, sky circle: other gene |
: Open all plots for all cancer types
 |
| ||||
| ALG3,CALR,CRELD2,DDOST,DNAJB11,HSP90B1,HSPA5, HYOU1,MANF,MED8,P4HB,PDIA3,PDIA3P1,PDIA4, PDIA6,PPIB,PRDX4,PRKCSH,RPN1,SEC61A1,UQCRH | C19orf10,CALR,CNDP2,CNPY3,CORO1B,CRELD2,DNASE2, GMPPB,SLC52A2,HM13,LMAN2,NANS,P4HB,PPIB, RPN1,RRBP1,SDF2L1,SDF4,SLC39A1,SLC39A7,TMED9 | ||||
 |
| ||||
| C19orf10,CALR,CRELD2,ENO1,FKBP2,HSP90B1,HSPA5, HYOU1,MANF,NUCB2,P4HB,PDIA3,PDIA3P1,PDIA4, PDIA6,PGAM1,PKM,PPIB,RPN1,SDF2L1,TXNL4A | ASS1,BACE2,CALR,CRELD2,DNAJB11,ENO1,GMPPB, HSPA5,HYOU1,LRRC59,MANF,NOS2,PDIA3,PDIA3P1, PDIA4,PDIA6,PSMB2,PSMC4,RPN1,SDF2L1,TMED9 |
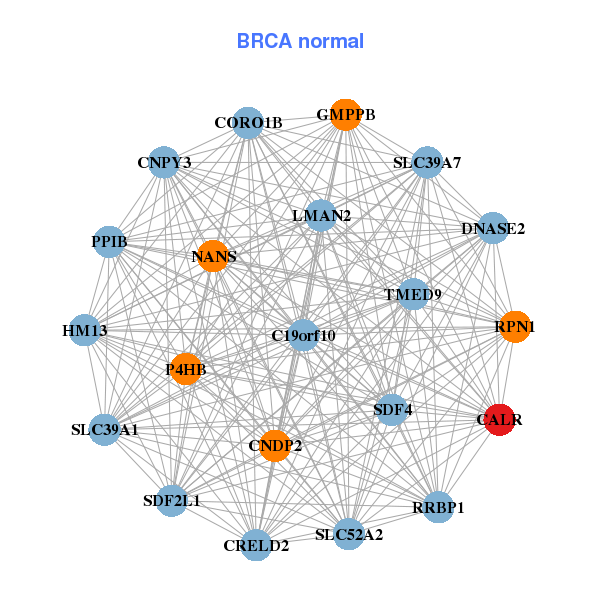
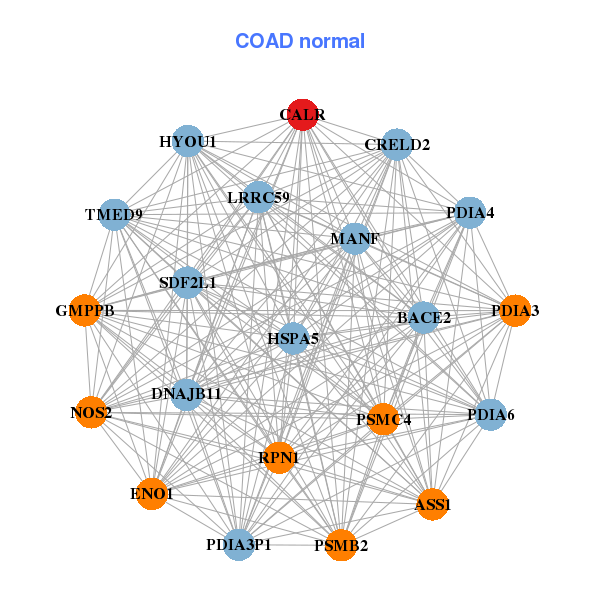
| * Co-Expression network figures were drawn using R package igraph. Only the top 20 genes with the highest correlations were shown. Red circle: input gene, orange circle: cell metabolism gene, sky circle: other gene |
: Open all plots for all cancer types
| Top |
: Open all interacting genes' information including KEGG pathway for all interacting genes from DAVID
| Top |
| Pharmacological Information for CALR |
| DB Category | DB Name | DB's ID and Url link |
| Organism-specific databases | PharmGKB | PA26046; -. |
| Organism-specific databases | CTD | 811; -. |
| * Gene Centered Interaction Network. |
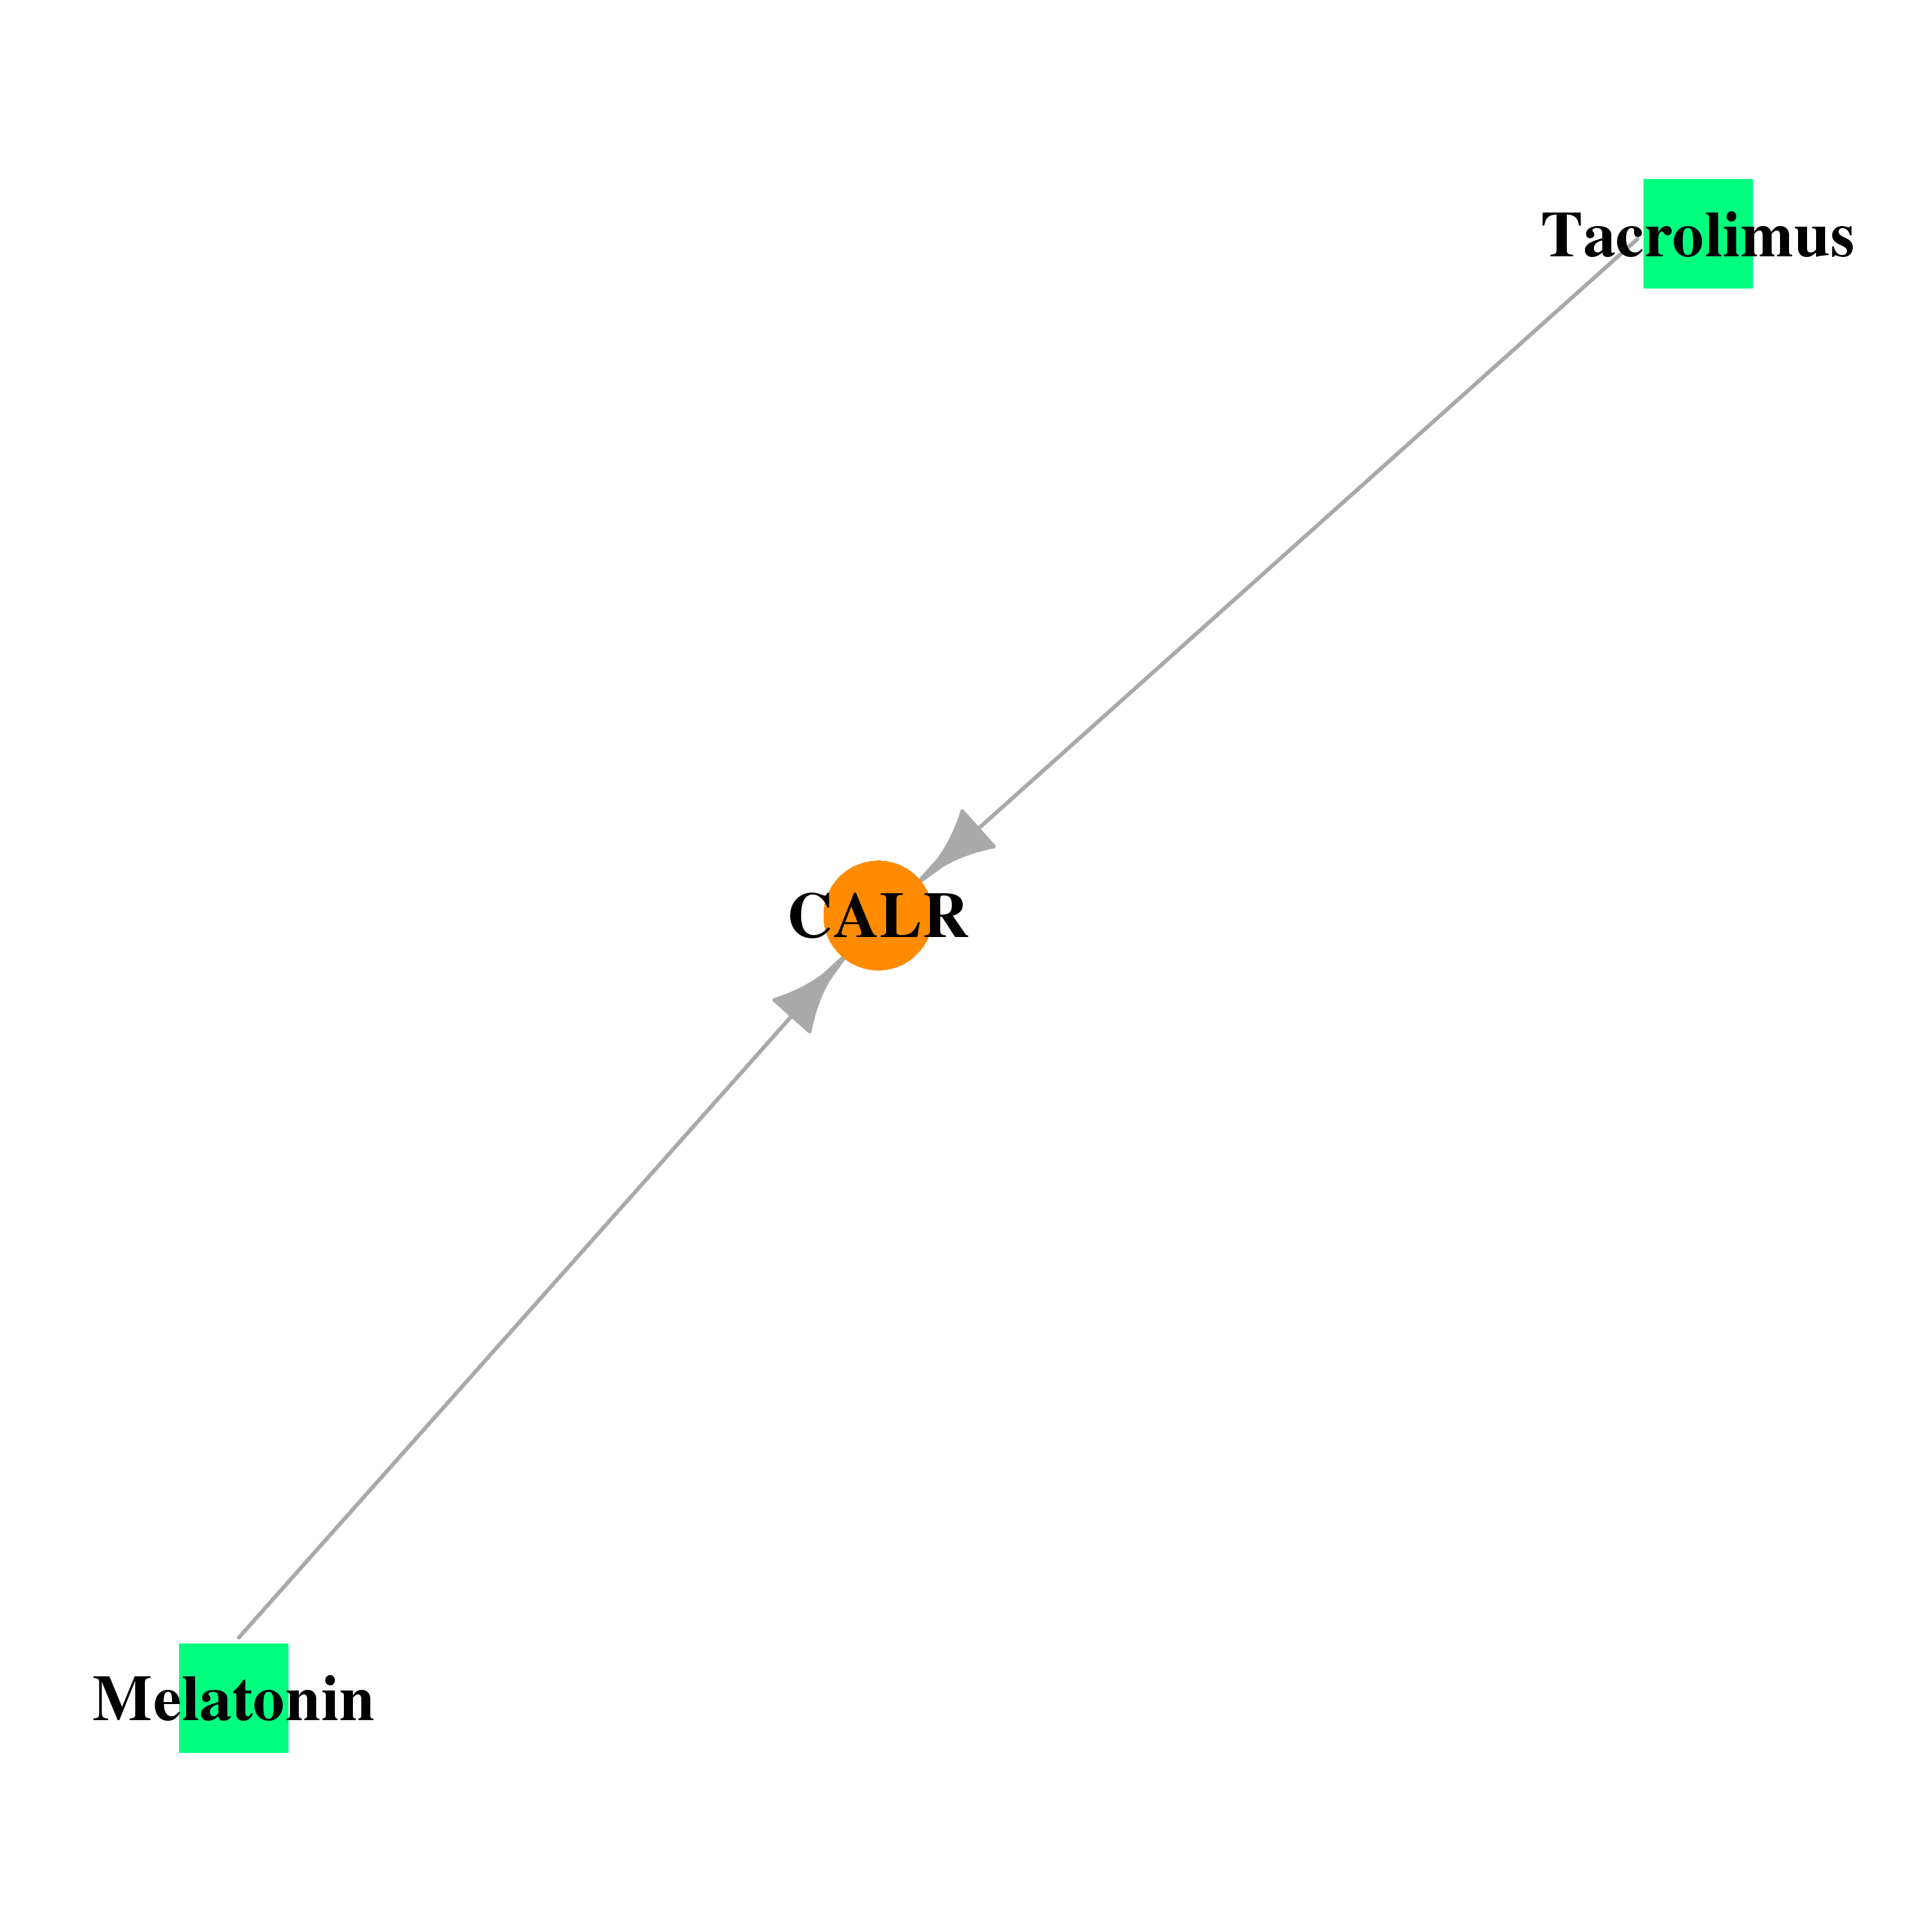 |
| * Drug Centered Interaction Network. |
| DrugBank ID | Target Name | Drug Groups | Generic Name | Drug Centered Network | Drug Structure |
| DB01065 | calreticulin | approved; nutraceutical | Melatonin | 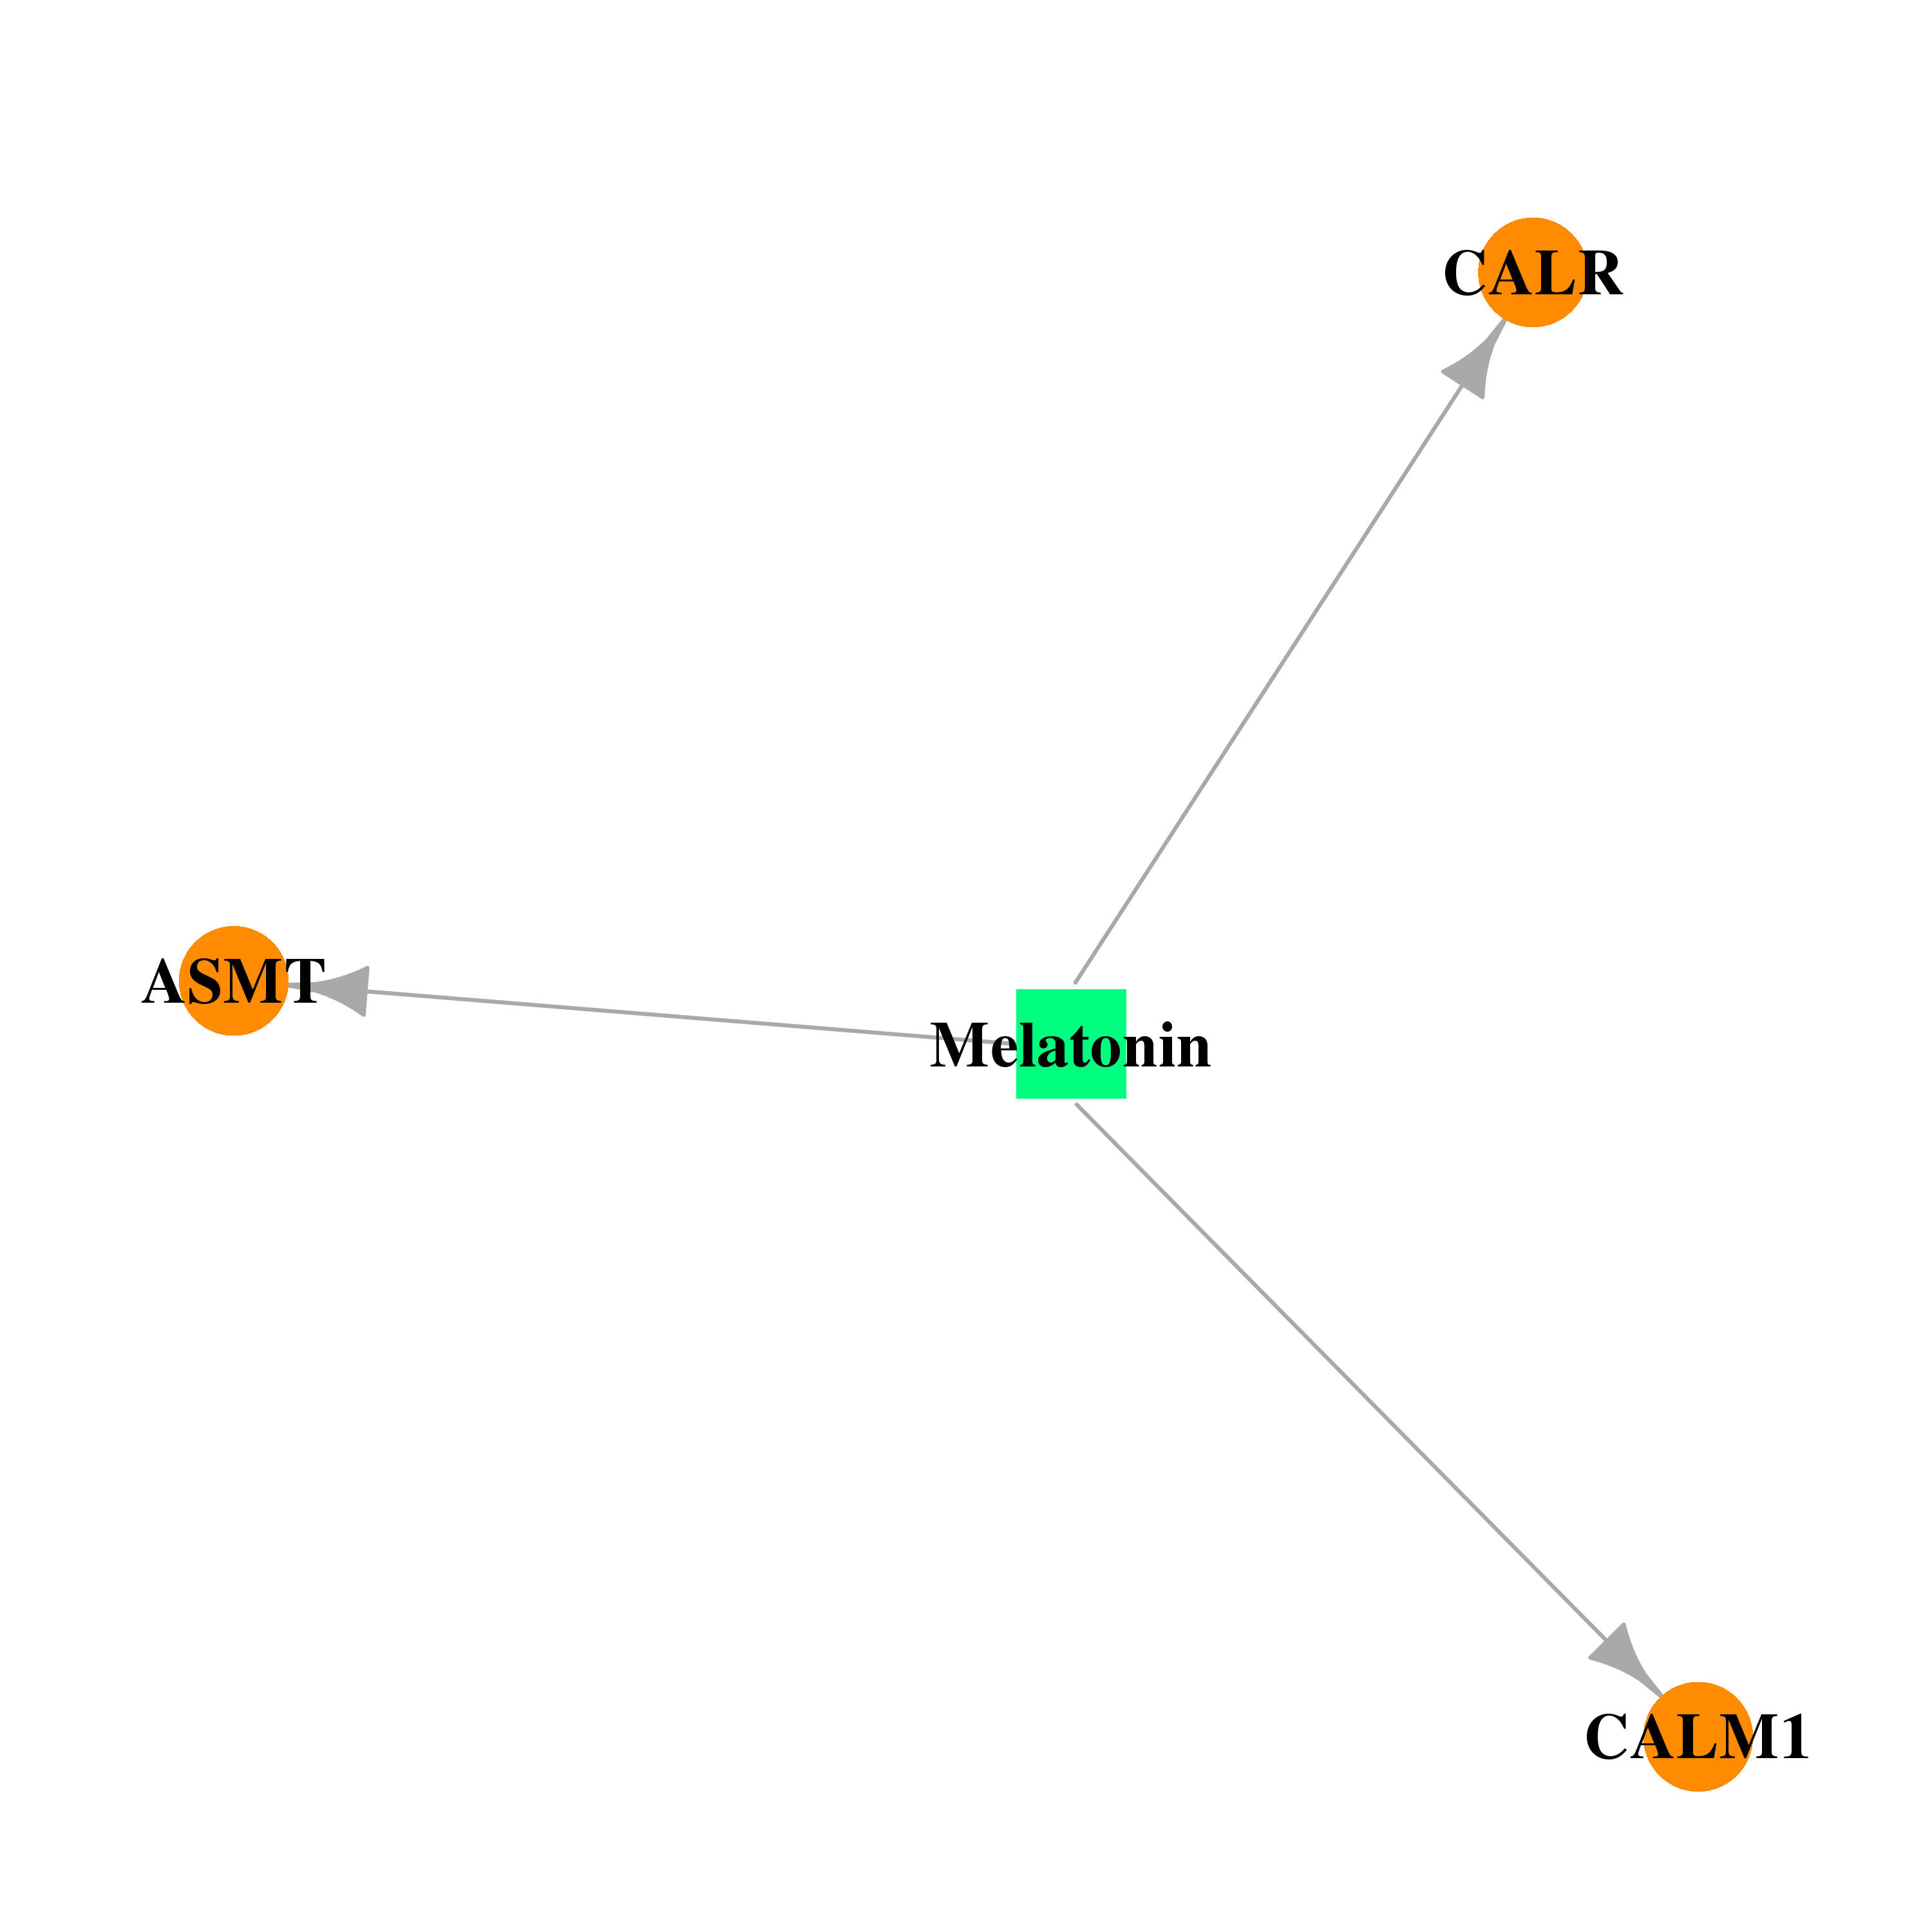 | 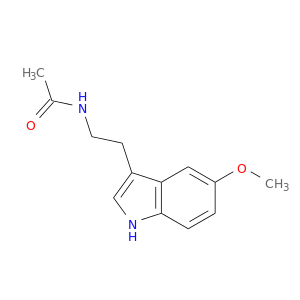 |
| DB00864 | calreticulin | approved; investigational | Tacrolimus |  |  |
| Top |
| Cross referenced IDs for CALR |
| * We obtained these cross-references from Uniprot database. It covers 150 different DBs, 18 categories. http://www.uniprot.org/help/cross_references_section |
: Open all cross reference information
|
Copyright © 2016-Present - The Univsersity of Texas Health Science Center at Houston @ |