|
||||||||||||||||||||||||||||||||||||||||||||||||||||||||||||||||||||||||||||||||||||||||||||||||||||||||||||||||||||||||||||||||||||||||||||||||||||||||||||||||||||||||||||||||||||||||||||||||||||||||||||||||||||||||||||||||||||||||||||||||||||||||||||||||||||||||||||||||||||||||||||||||||||||||||||||||||||||||||||||||||||||||||||||||||||||||||||||||||||||||||||||
| |
| Phenotypic Information (metabolism pathway, cancer, disease, phenome) |
| |
| |
| Gene-Gene Network Information: Co-Expression Network, Interacting Genes & KEGG |
| |
|


| Gene Summary for MGAM |
| Basic gene info. | Gene symbol | MGAM |
| Gene name | maltase-glucoamylase (alpha-glucosidase) | |
| Synonyms | MG|MGA | |
| Cytomap | UCSC genome browser: 7q34 | |
| Genomic location | chr7 :141695678-141806547 | |
| Type of gene | protein-coding | |
| RefGenes | NM_004668.2, | |
| Ensembl id | ENSG00000259858 | |
| Description | brush border hydrolasemaltase-glucoamylase, intestinal | |
| Modification date | 20141211 | |
| dbXrefs | MIM : 154360 | |
| HGNC : HGNC | ||
| Ensembl : ENSG00000257335 | ||
| HPRD : 01104 | ||
| Vega : OTTHUMG00000158395 | ||
| Protein | UniProt: O43451 go to UniProt's Cross Reference DB Table | |
| Expression | CleanEX: HS_MGAM | |
| BioGPS: 8972 | ||
| Gene Expression Atlas: ENSG00000259858 | ||
| The Human Protein Atlas: ENSG00000259858 | ||
| Pathway | NCI Pathway Interaction Database: MGAM | |
| KEGG: MGAM | ||
| REACTOME: MGAM | ||
| ConsensusPathDB | ||
| Pathway Commons: MGAM | ||
| Metabolism | MetaCyc: MGAM | |
| HUMANCyc: MGAM | ||
| Regulation | Ensembl's Regulation: ENSG00000259858 | |
| miRBase: chr7 :141,695,678-141,806,547 | ||
| TargetScan: NM_004668 | ||
| cisRED: ENSG00000259858 | ||
| Context | iHOP: MGAM | |
| cancer metabolism search in PubMed: MGAM | ||
| UCL Cancer Institute: MGAM | ||
| Assigned class in ccmGDB | A - This gene has a literature evidence and it belongs to cancer gene. | |
| References showing role of MGAM in cancer cell metabolism | 1. Yang S (2007) Gene amplifications at chromosome 7 of the human gastric cancer genome. International journal of molecular medicine 20: 225-231. go to article | |
| Top |
| Phenotypic Information for MGAM(metabolism pathway, cancer, disease, phenome) |
| Cancer | CGAP: MGAM |
| Familial Cancer Database: MGAM | |
| * This gene is included in those cancer gene databases. |
|
|
|
|
|
|
| ||||||||||||||||||||||||||||||||||||||||||||||||||||||||||||||||||||||||||||||||||||||||||||||||||||||||||||||||||||||||||||||||||||||||||||||||||||||||||||||||||||||||||||||||||||||||||||||||||||||||||||||||||||||||||||||||||||||||||||||||||||||||||||||||||||||||||||||||||||||||||||||||||||||||||||||||||||||||||||||||||||||||||||||||||||||||||||||||||||||||
Oncogene 1 | Significant driver gene in | |||||||||||||||||||||||||||||||||||||||||||||||||||||||||||||||||||||||||||||||||||||||||||||||||||||||||||||||||||||||||||||||||||||||||||||||||||||||||||||||||||||||||||||||||||||||||||||||||||||||||||||||||||||||||||||||||||||||||||||||||||||||||||||||||||||||||||||||||||||||||||||||||||||||||||||||||||||||||||||||||||||||||||||||||||||||||||||||||||||||||||||
| cf) number; DB name 1 Oncogene; http://nar.oxfordjournals.org/content/35/suppl_1/D721.long, 2 Tumor Suppressor gene; https://bioinfo.uth.edu/TSGene/, 3 Cancer Gene Census; http://www.nature.com/nrc/journal/v4/n3/abs/nrc1299.html, 4 CancerGenes; http://nar.oxfordjournals.org/content/35/suppl_1/D721.long, 5 Network of Cancer Gene; http://ncg.kcl.ac.uk/index.php, 1Therapeutic Vulnerabilities in Cancer; http://cbio.mskcc.org/cancergenomics/statius/ |
| KEGG_GALACTOSE_METABOLISM KEGG_STARCH_AND_SUCROSE_METABOLISM REACTOME_METABOLISM_OF_CARBOHYDRATES | |
| OMIM | 154360; gene. |
| Orphanet | |
| Disease | KEGG Disease: MGAM |
| MedGen: MGAM (Human Medical Genetics with Condition) | |
| ClinVar: MGAM | |
| Phenotype | MGI: MGAM (International Mouse Phenotyping Consortium) |
| PhenomicDB: MGAM | |
| Mutations for MGAM |
| * Under tables are showing count per each tissue to give us broad intuition about tissue specific mutation patterns.You can go to the detailed page for each mutation database's web site. |
| - Statistics for Tissue and Mutation type | Top |
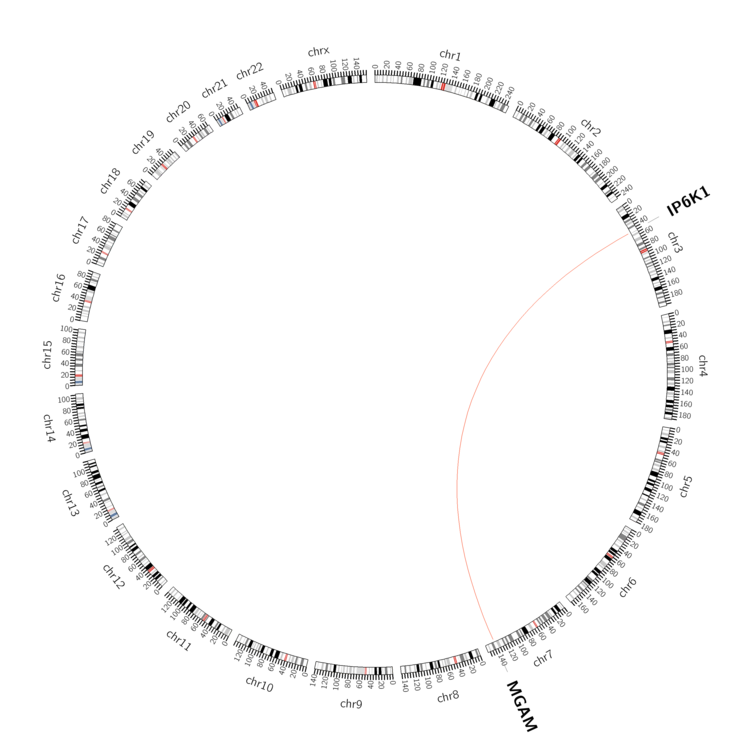 |
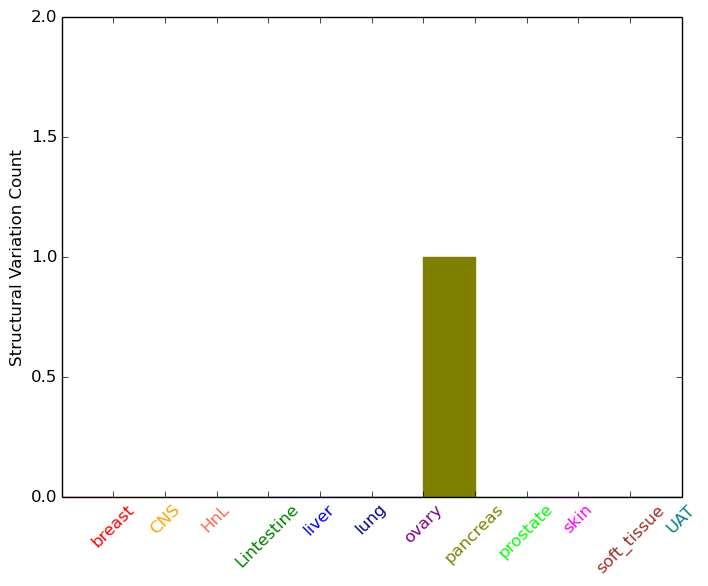
| - For Inter-chromosomal Variations |
| * Inter-chromosomal variantions includes 'interchromosomal amplicon to amplicon', 'interchromosomal amplicon to non-amplified dna', 'interchromosomal insertion', 'Interchromosomal unknown type'. |
 |
| - For Intra-chromosomal Variations |
| There's no intra-chromosomal structural variation. |
| Sample | Symbol_a | Chr_a | Start_a | End_a | Symbol_b | Chr_b | Start_b | End_b |
| cf) Tissue number; Tissue name (1;Breast, 2;Central_nervous_system, 3;Haematopoietic_and_lymphoid_tissue, 4;Large_intestine, 5;Liver, 6;Lung, 7;Ovary, 8;Pancreas, 9;Prostate, 10;Skin, 11;Soft_tissue, 12;Upper_aerodigestive_tract) |
| * From mRNA Sanger sequences, Chitars2.0 arranged chimeric transcripts. This table shows MGAM related fusion information. |
| ID | Head Gene | Tail Gene | Accession | Gene_a | qStart_a | qEnd_a | Chromosome_a | tStart_a | tEnd_a | Gene_a | qStart_a | qEnd_a | Chromosome_a | tStart_a | tEnd_a |
| Top |
| Mutation type/ Tissue ID | brca | cns | cerv | endome | haematopo | kidn | Lintest | liver | lung | ns | ovary | pancre | prost | skin | stoma | thyro | urina | |||
| Total # sample | 1 | 1 | 1 | 1 | 2 | |||||||||||||||
| GAIN (# sample) | 1 | 1 | 1 | 1 | 2 | |||||||||||||||
| LOSS (# sample) |
| cf) Tissue ID; Tissue type (1; Breast, 2; Central_nervous_system, 3; Cervix, 4; Endometrium, 5; Haematopoietic_and_lymphoid_tissue, 6; Kidney, 7; Large_intestine, 8; Liver, 9; Lung, 10; NS, 11; Ovary, 12; Pancreas, 13; Prostate, 14; Skin, 15; Stomach, 16; Thyroid, 17; Urinary_tract) |
| Top |
|
 |
| Top |
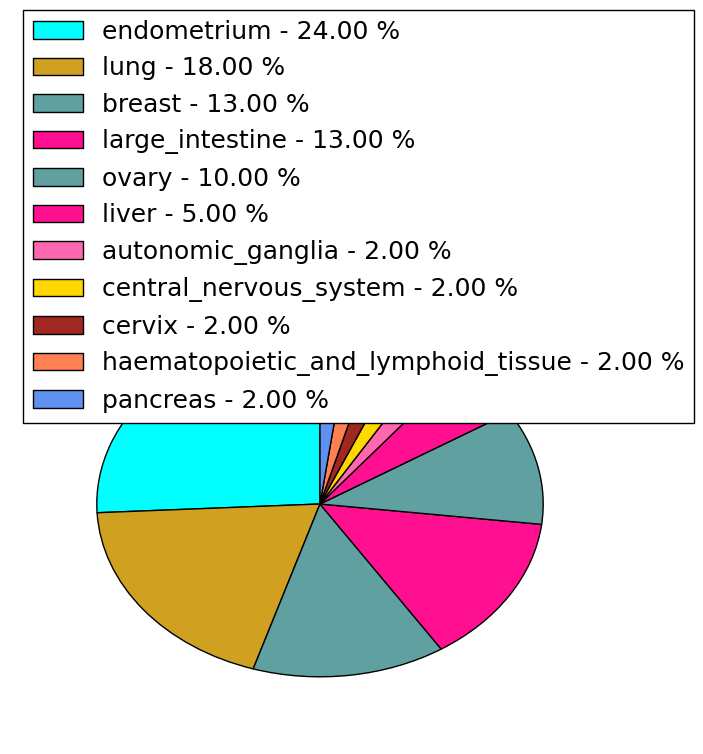
| Stat. for Non-Synonymous SNVs (# total SNVs=37) | (# total SNVs=9) |
 | 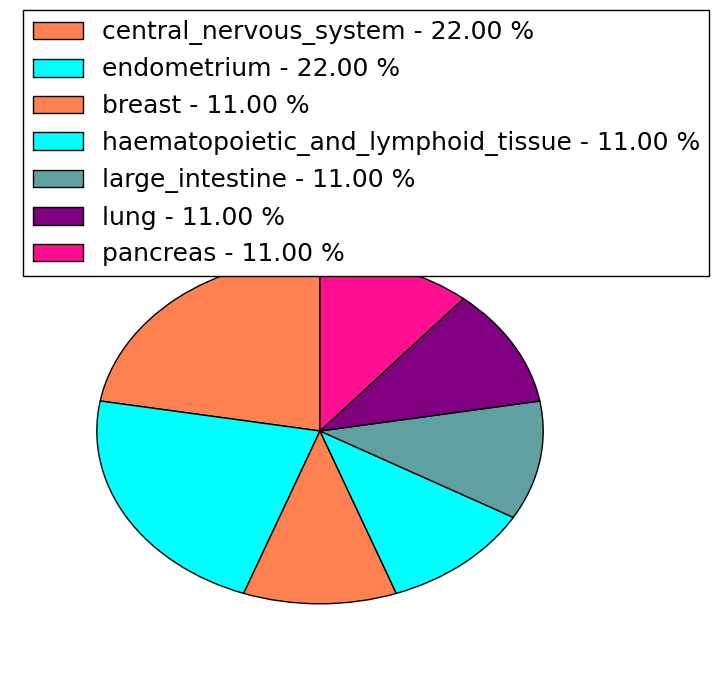 |
(# total SNVs=1) | (# total SNVs=1) |
 |  |
| Top |
| * When you move the cursor on each content, you can see more deailed mutation information on the Tooltip. Those are primary_site,primary_histology,mutation(aa),pubmedID. |
| GRCh37 position | Mutation(aa) | Unique sampleID count |
| chr7:141708471-141708471 | p.R98Q | 7 |
| chr7:141719069-141719069 | p.S133F | 4 |
| chr7:141724852-141724852 | p.N295N | 2 |
| chr7:141719073-141719073 | p.K134N | 2 |
| chr7:141724853-141724853 | p.G296R | 2 |
| chr7:141724872-141724872 | p.A302V | 2 |
| chr7:141708362-141708362 | p.P62S | 2 |
| chr7:141705382-141705382 | p.V18F | 2 |
| chr7:141722220-141722220 | p.R288K | 2 |
| chr7:141719039-141719039 | p.G123E | 2 |
| Top |
|
 |
| Point Mutation/ Tissue ID | 1 | 2 | 3 | 4 | 5 | 6 | 7 | 8 | 9 | 10 | 11 | 12 | 13 | 14 | 15 | 16 | 17 | 18 | 19 | 20 |
| # sample | 4 | 12 | 3 | 29 | 7 | 16 | 6 | 3 | 45 | 12 | 6 | 4 | 89 | 15 | 2 | 25 | ||||
| # mutation | 4 | 12 | 3 | 36 | 6 | 17 | 5 | 3 | 51 | 13 | 6 | 4 | 160 | 18 | 2 | 44 | ||||
| nonsynonymous SNV | 4 | 8 | 2 | 25 | 5 | 14 | 2 | 2 | 41 | 6 | 5 | 1 | 119 | 10 | 1 | 30 | ||||
| synonymous SNV | 4 | 1 | 11 | 1 | 3 | 3 | 1 | 10 | 7 | 1 | 3 | 41 | 8 | 1 | 14 |
| cf) Tissue ID; Tissue type (1; BLCA[Bladder Urothelial Carcinoma], 2; BRCA[Breast invasive carcinoma], 3; CESC[Cervical squamous cell carcinoma and endocervical adenocarcinoma], 4; COAD[Colon adenocarcinoma], 5; GBM[Glioblastoma multiforme], 6; Glioma Low Grade, 7; HNSC[Head and Neck squamous cell carcinoma], 8; KICH[Kidney Chromophobe], 9; KIRC[Kidney renal clear cell carcinoma], 10; KIRP[Kidney renal papillary cell carcinoma], 11; LAML[Acute Myeloid Leukemia], 12; LUAD[Lung adenocarcinoma], 13; LUSC[Lung squamous cell carcinoma], 14; OV[Ovarian serous cystadenocarcinoma ], 15; PAAD[Pancreatic adenocarcinoma], 16; PRAD[Prostate adenocarcinoma], 17; SKCM[Skin Cutaneous Melanoma], 18:STAD[Stomach adenocarcinoma], 19:THCA[Thyroid carcinoma], 20:UCEC[Uterine Corpus Endometrial Carcinoma]) |
| Top |
| * We represented just top 10 SNVs. When you move the cursor on each content, you can see more deailed mutation information on the Tooltip. Those are primary_site, primary_histology, mutation(aa), pubmedID. |
| Genomic Position | Mutation(aa) | Unique sampleID count |
| chr7:141758086 | p.R834Q | 5 |
| chr7:141747587 | p.P1327P | 5 |
| chr7:141759688 | p.I1259I | 5 |
| chr7:141708471 | p.R1097C | 4 |
| chr7:141754683 | p.R98Q | 4 |
| chr7:141760126 | p.F1677F | 3 |
| chr7:141747669 | p.T861T | 3 |
| chr7:141797419 | p.E1800K | 3 |
| chr7:141803141 | p.P1359S | 3 |
| chr7:141752215 | p.E805K | 2 |
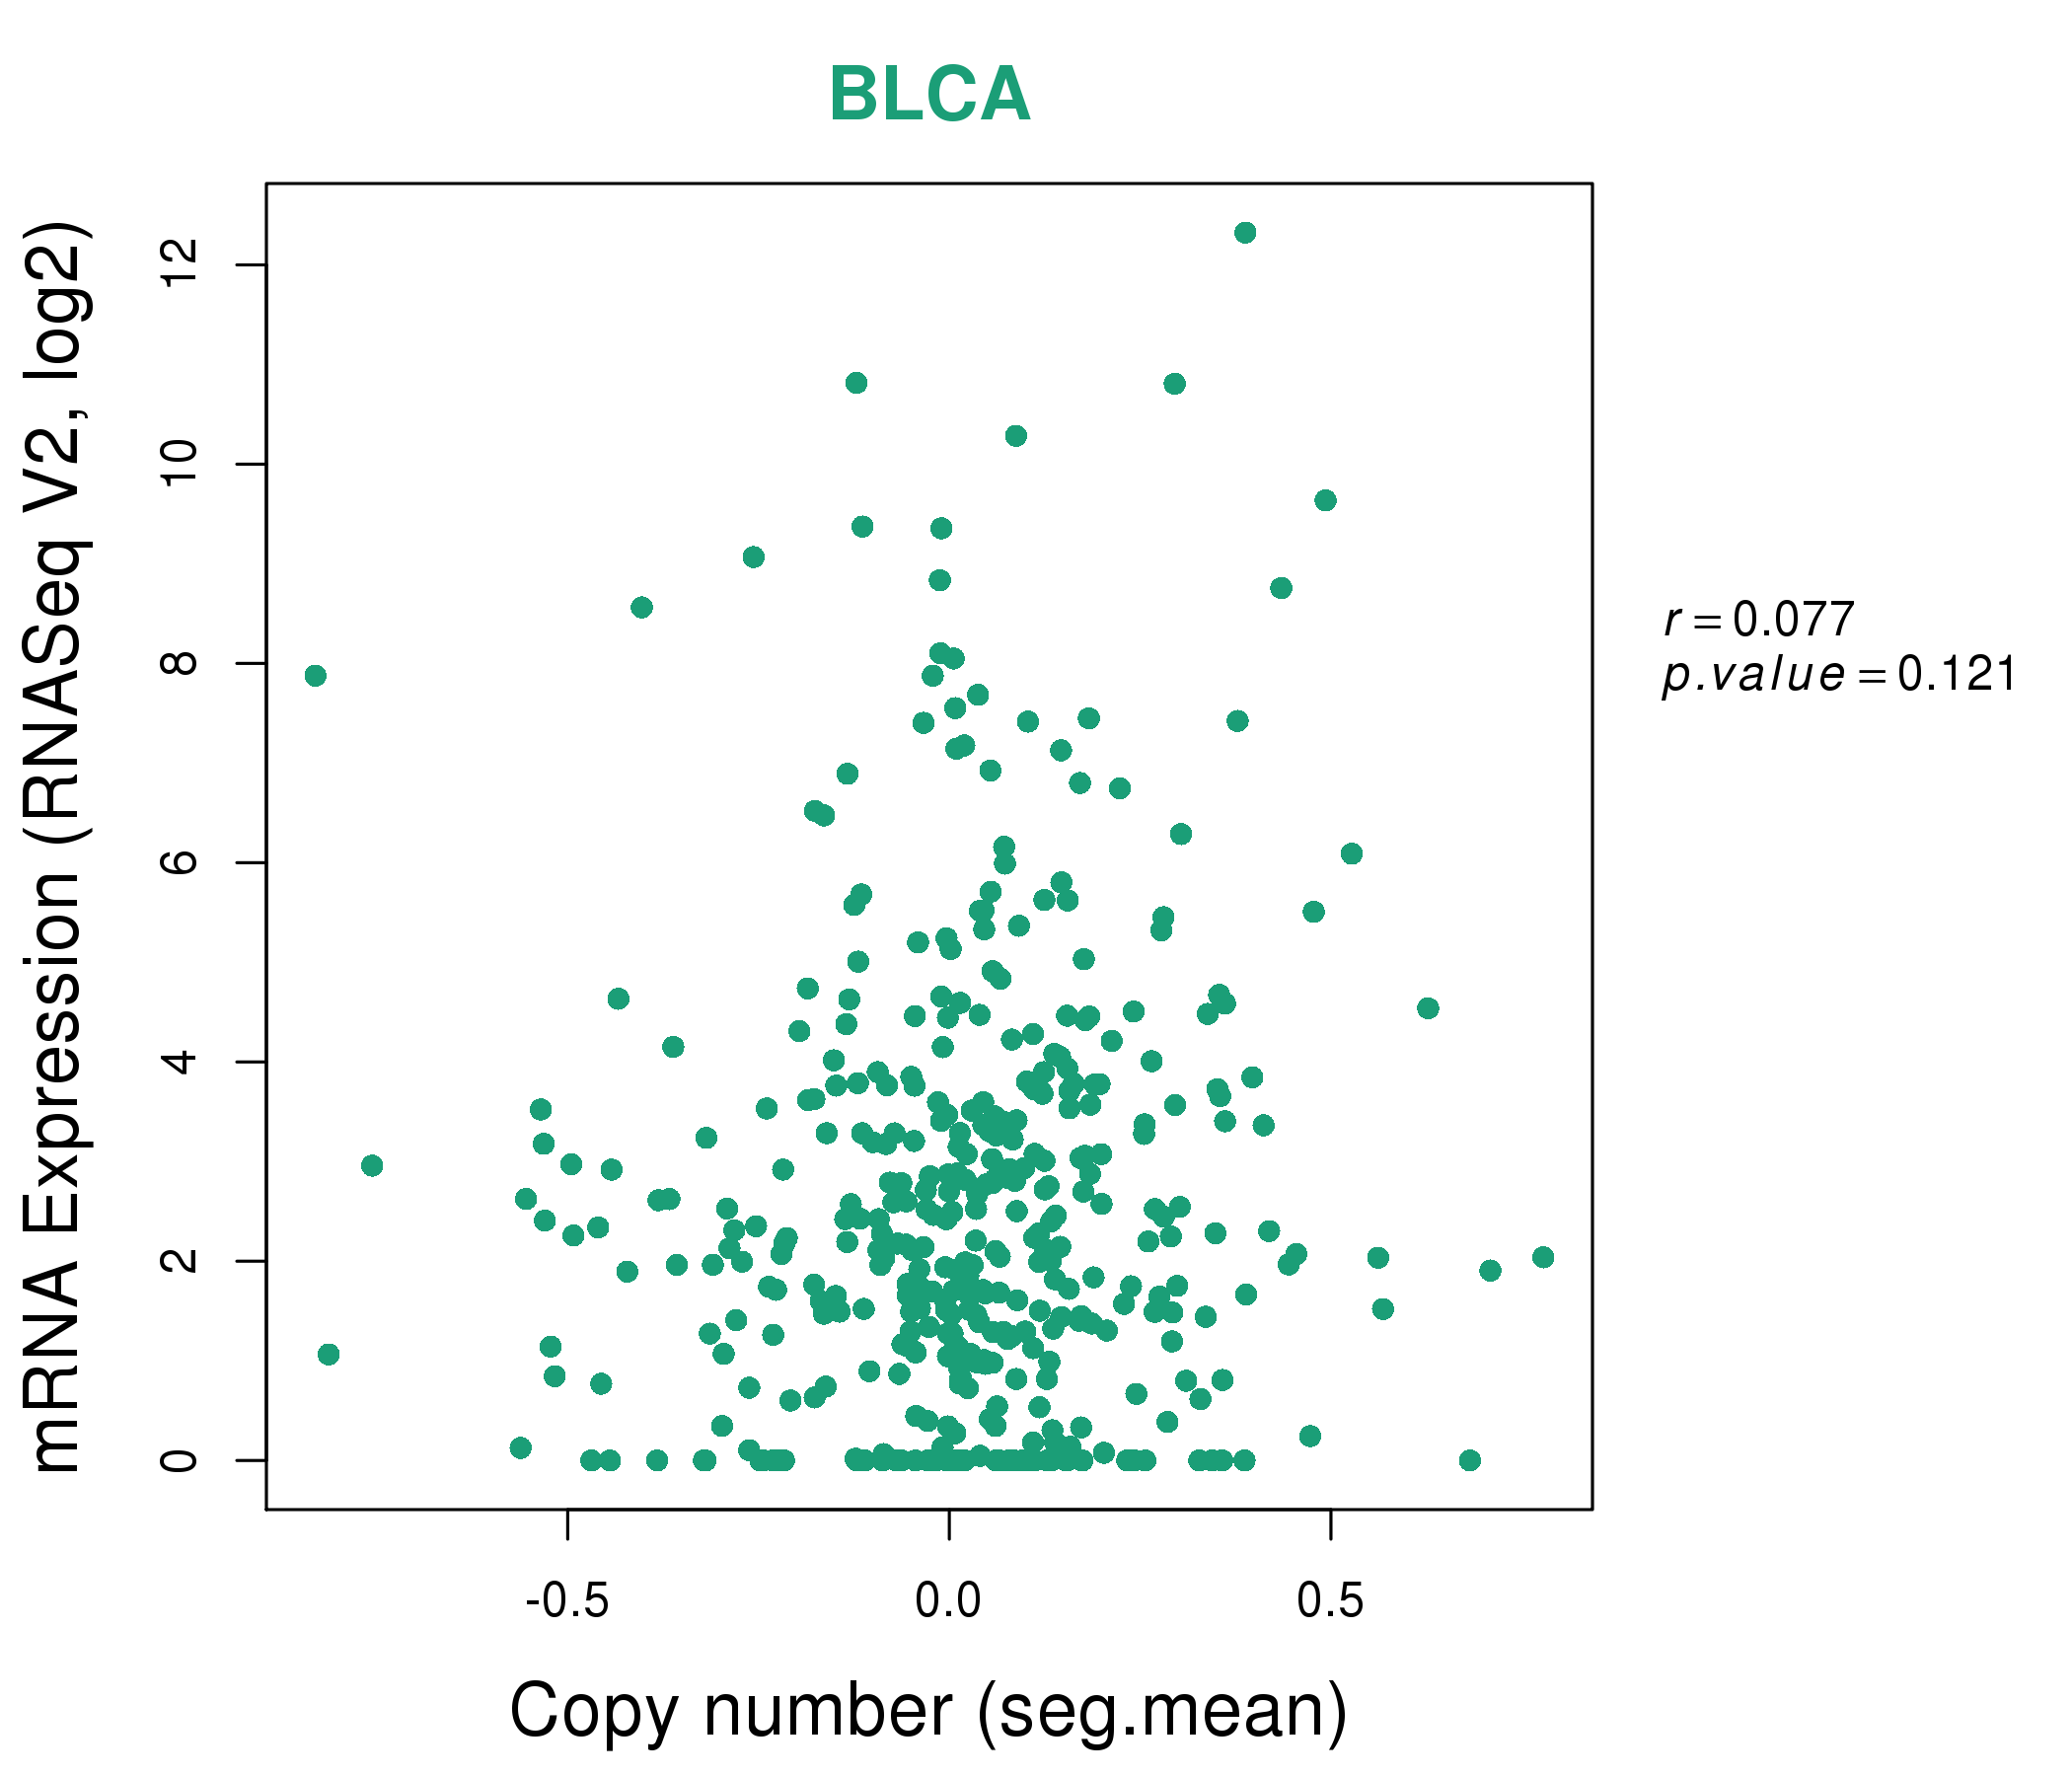
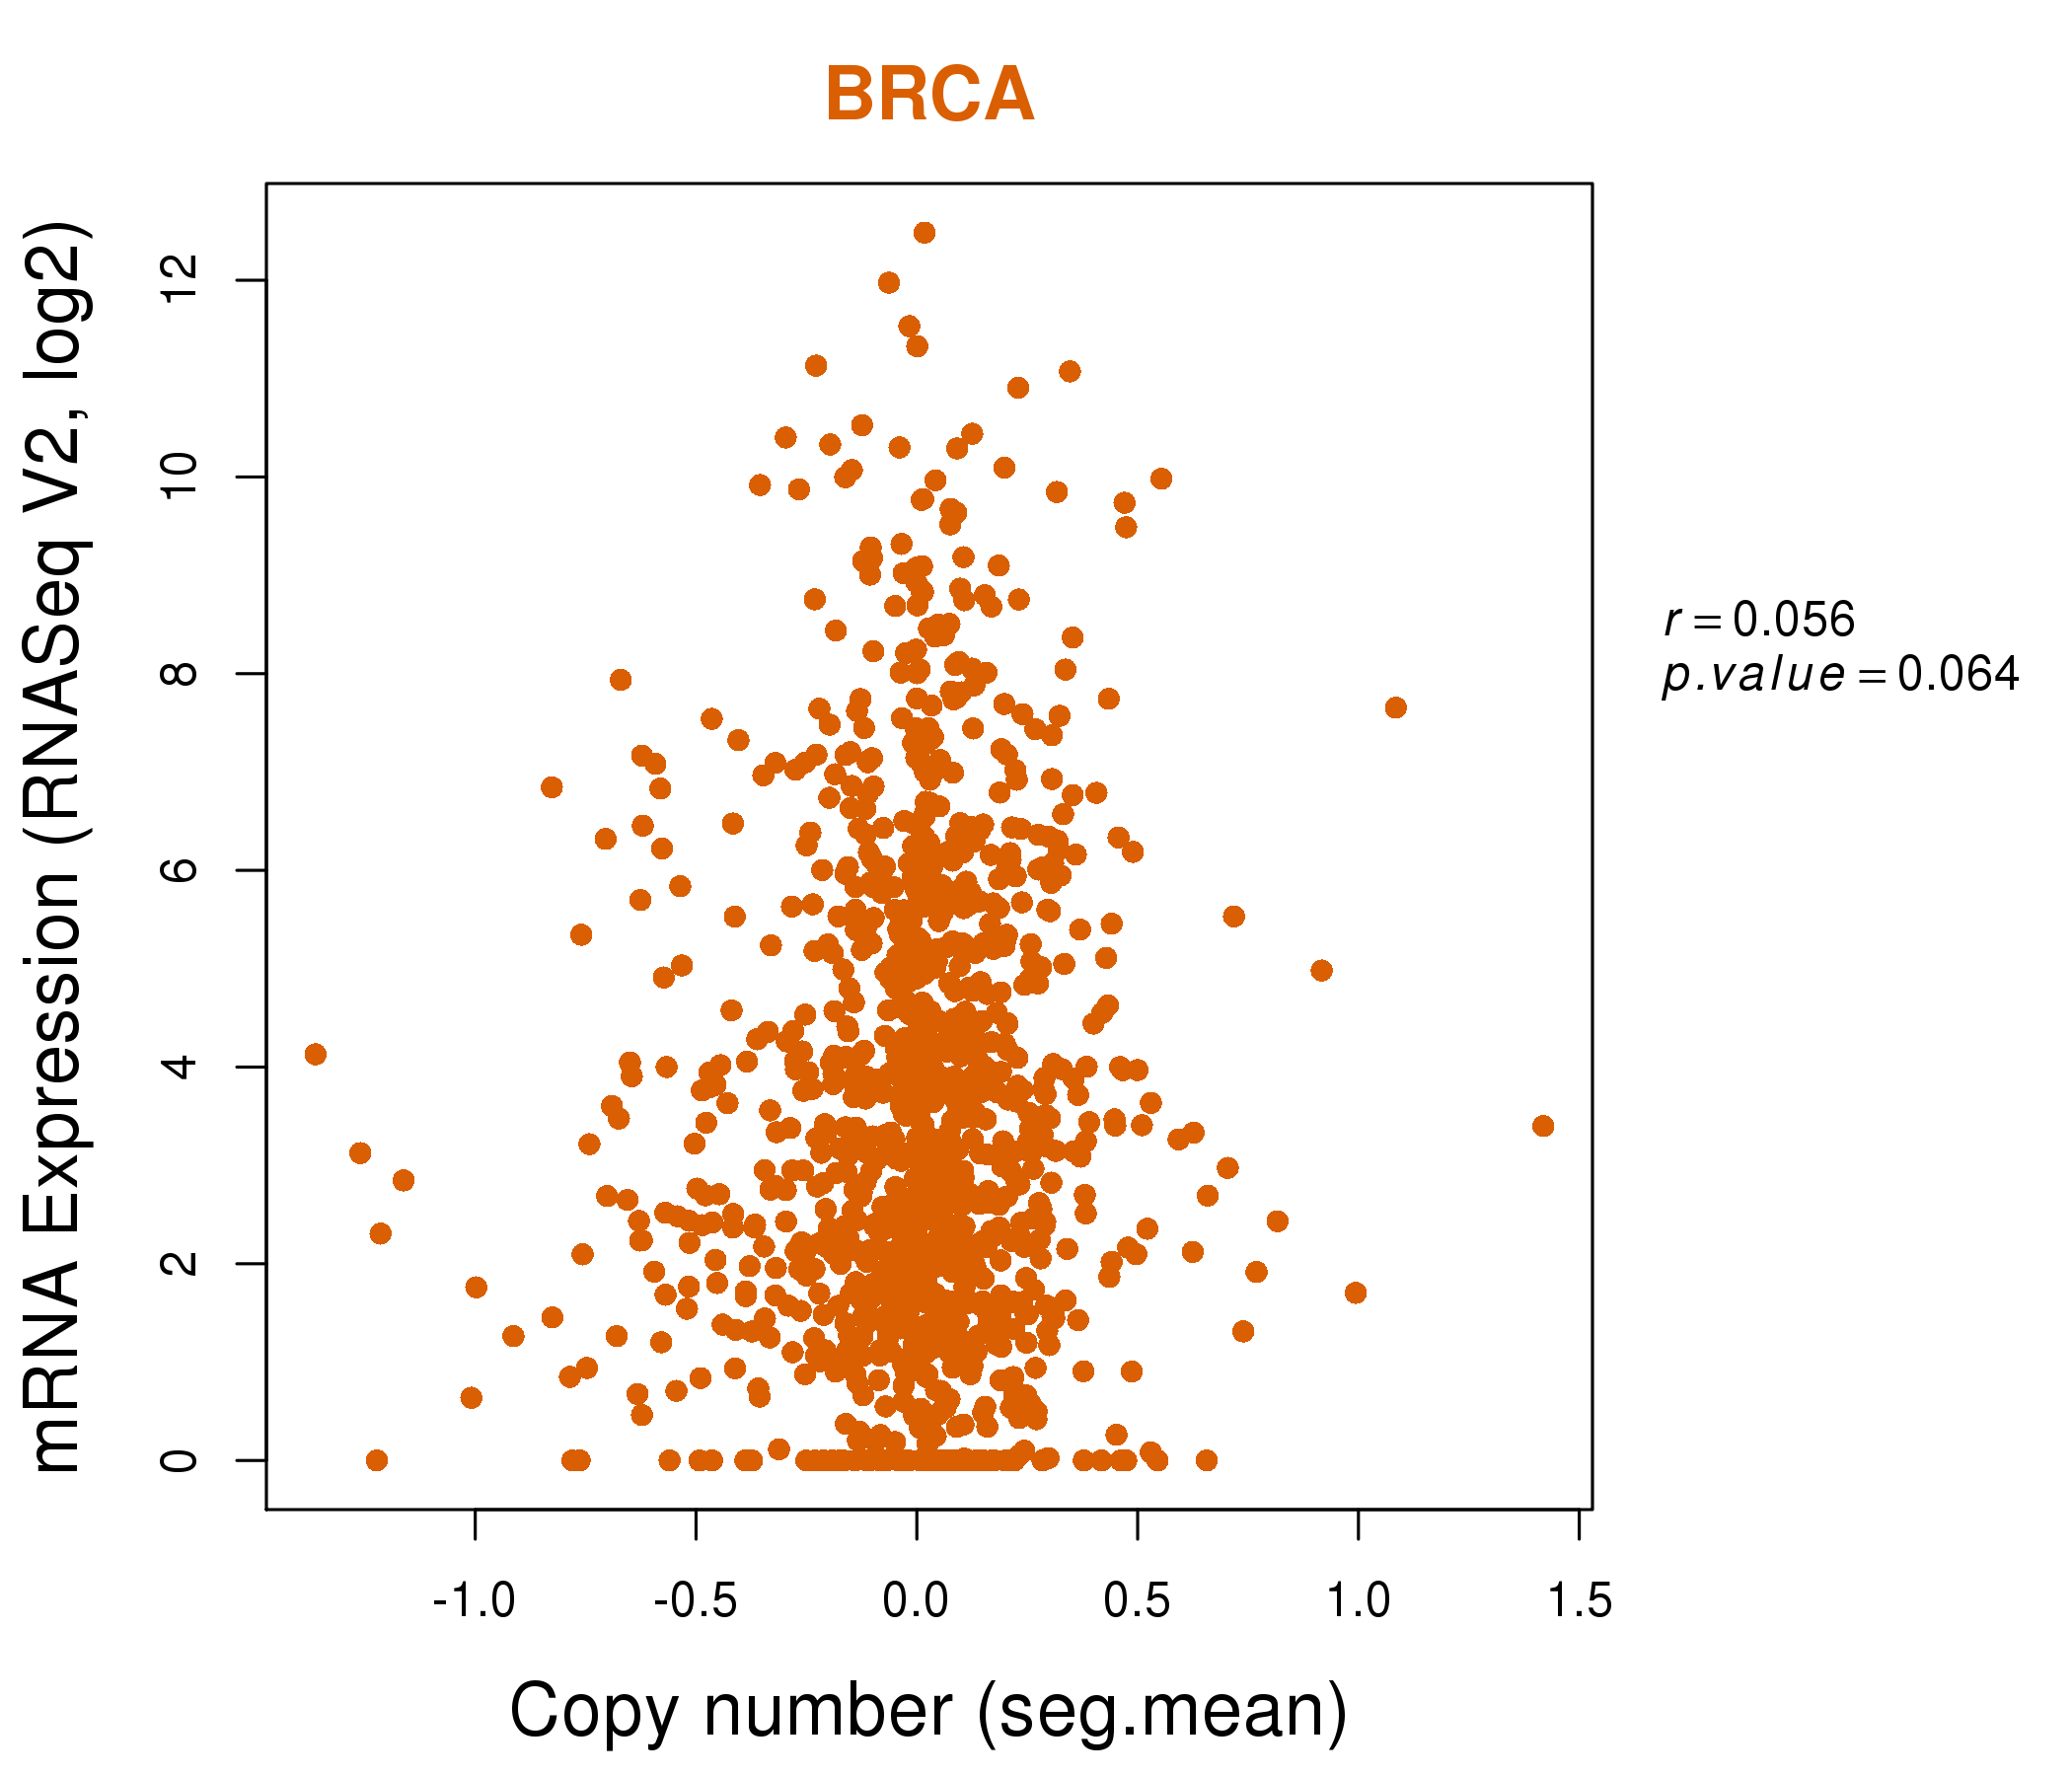
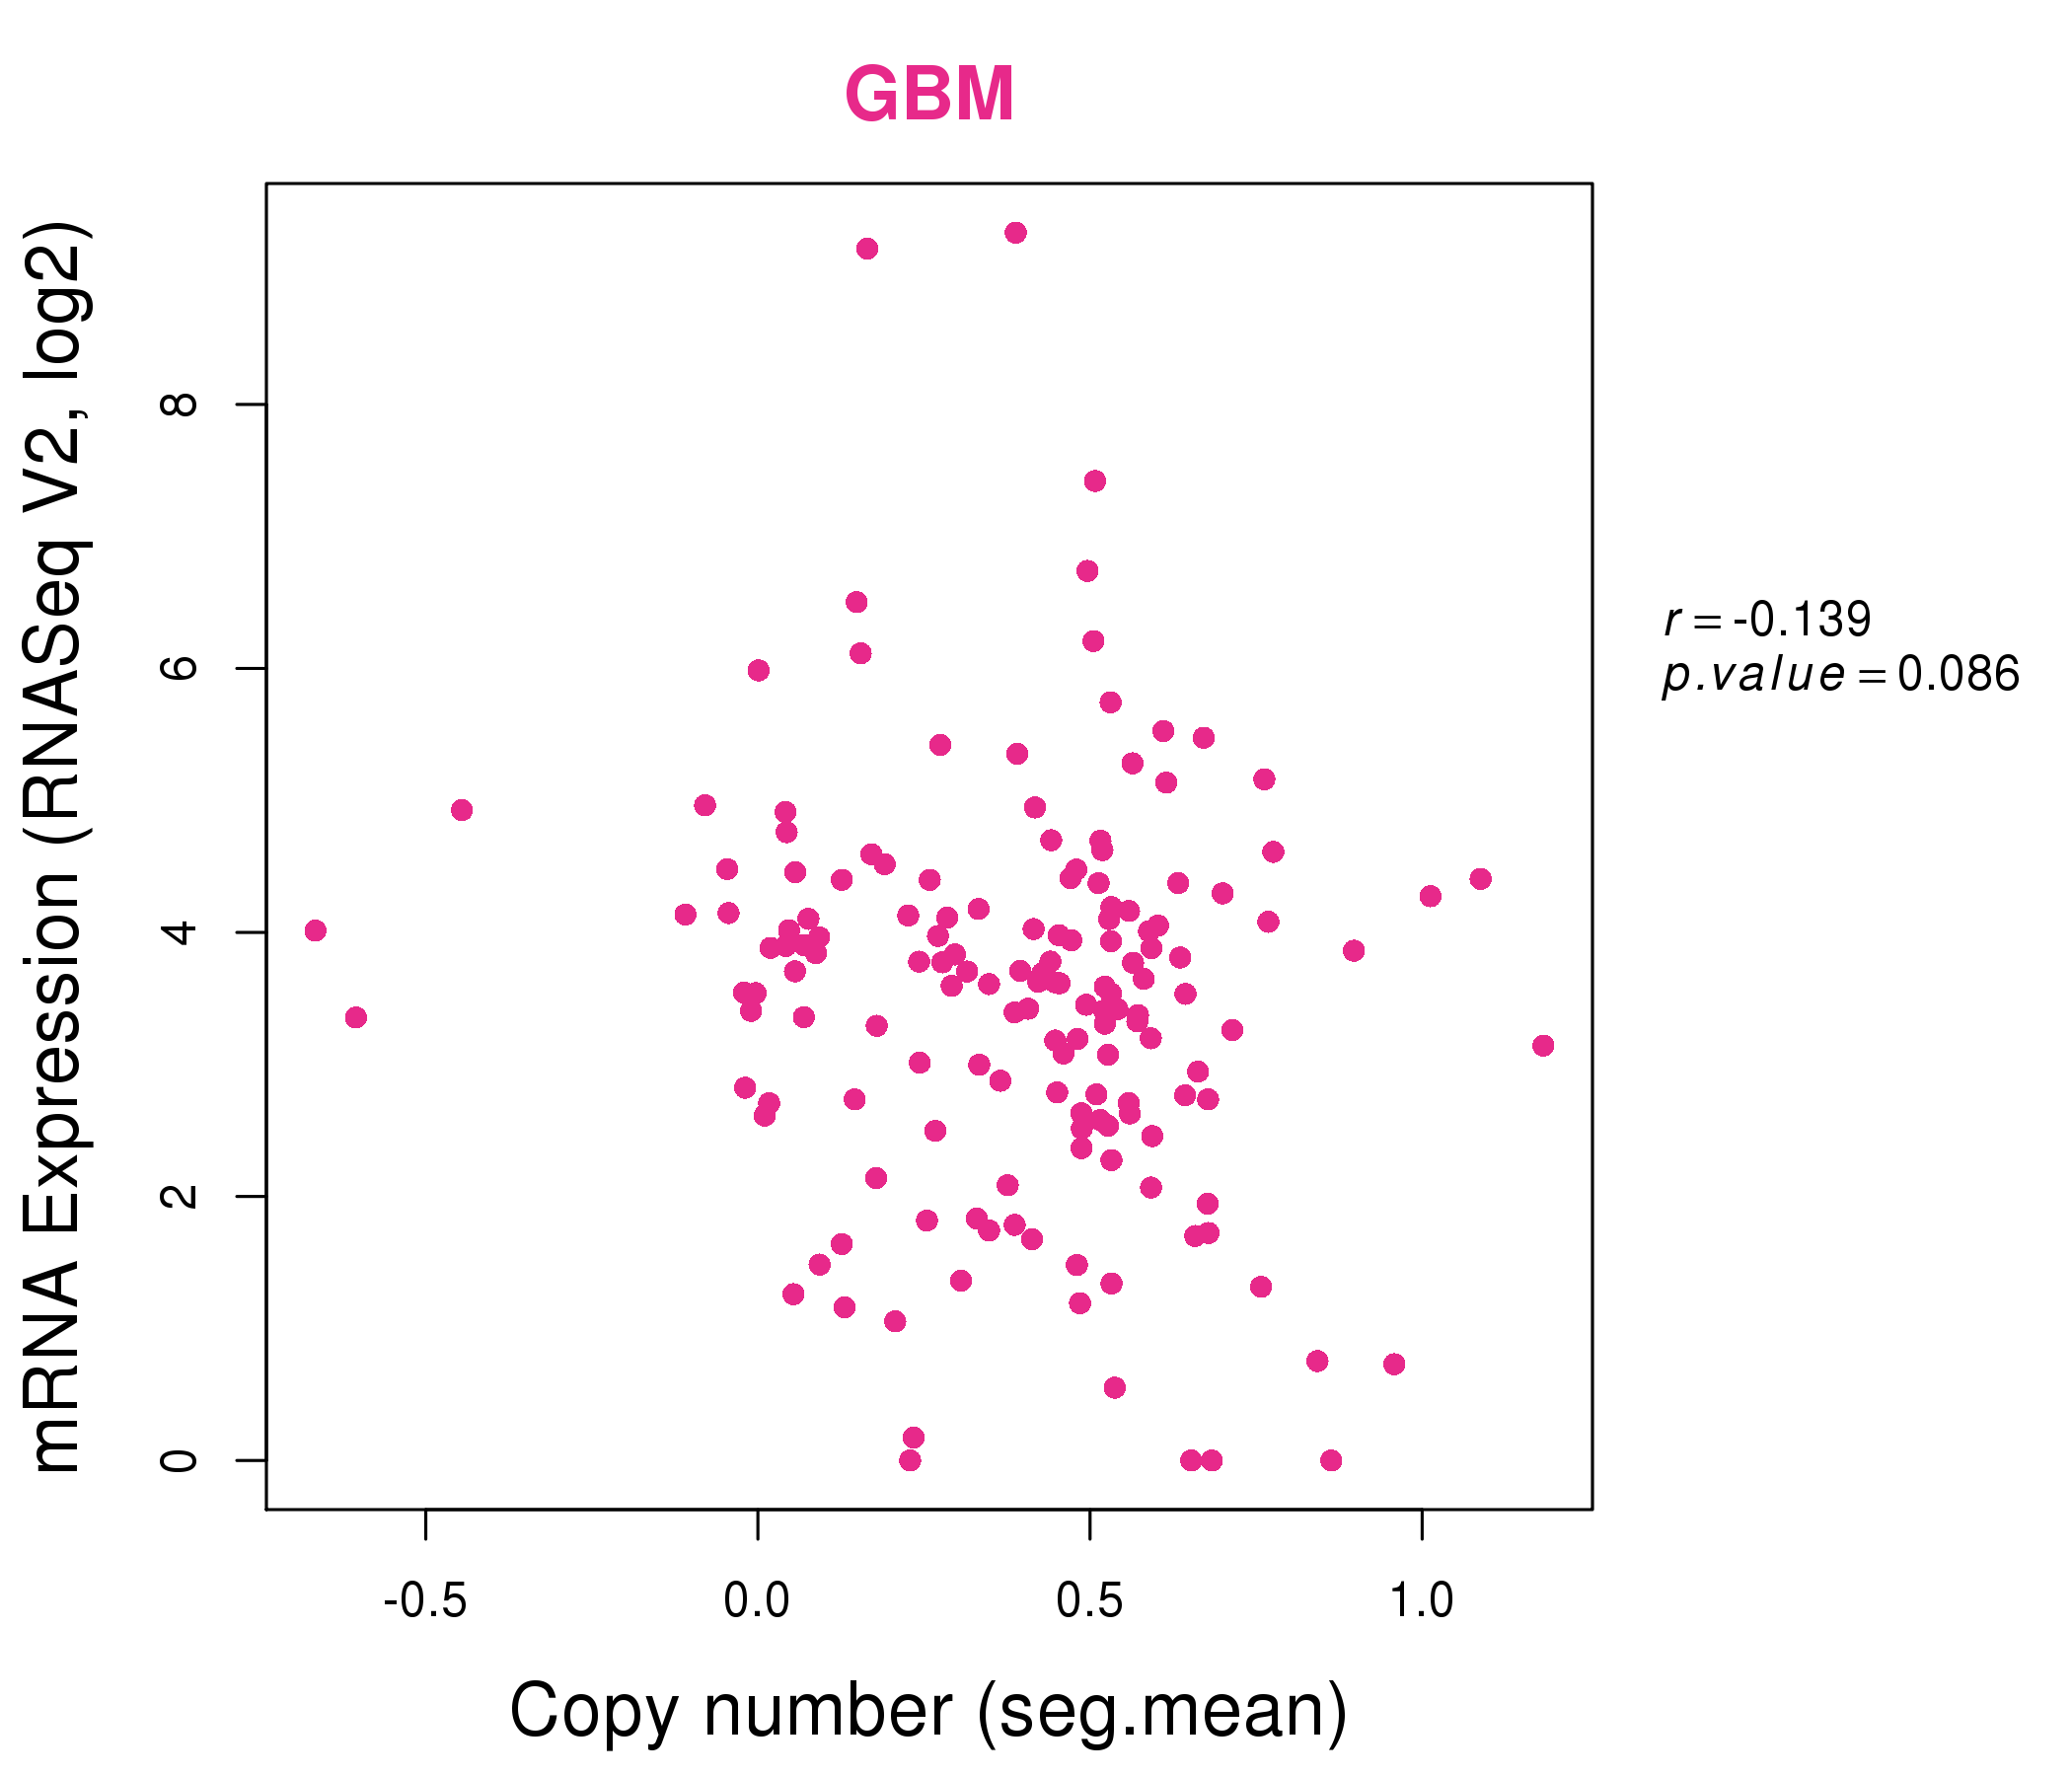
| * Copy number data were extracted from TCGA using R package TCGA-Assembler. The URLs of all public data files on TCGA DCC data server were gathered on Jan-05-2015. Function ProcessCNAData in TCGA-Assembler package was used to obtain gene-level copy number value which is calculated as the average copy number of the genomic region of a gene. |
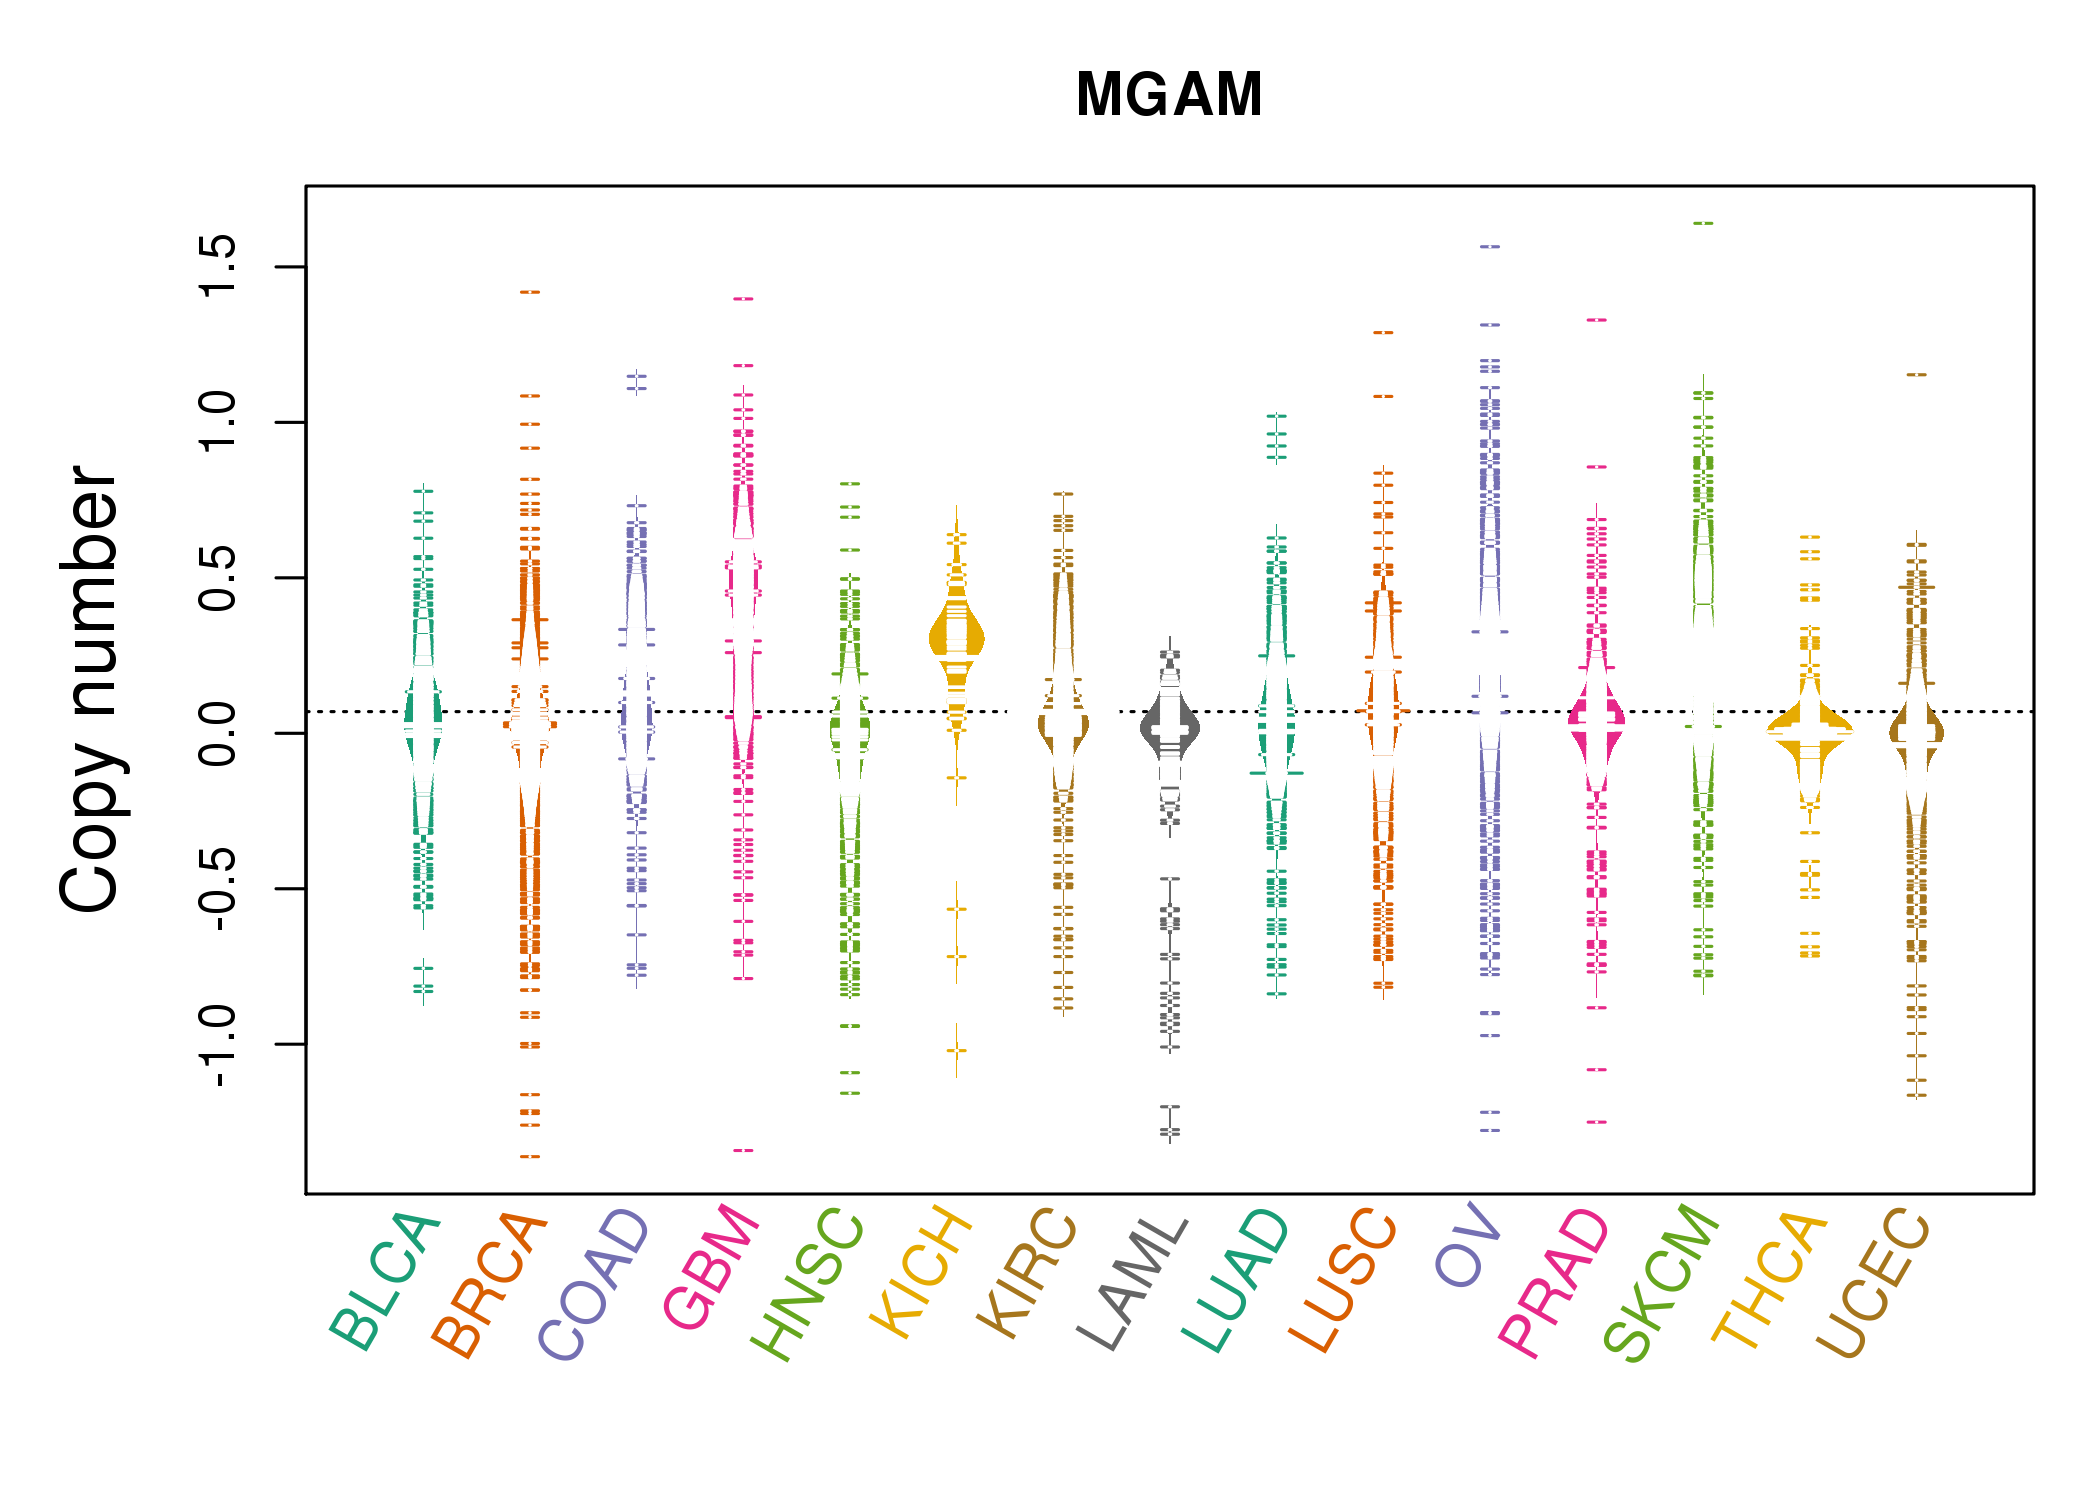 |
| cf) Tissue ID[Tissue type]: BLCA[Bladder Urothelial Carcinoma], BRCA[Breast invasive carcinoma], CESC[Cervical squamous cell carcinoma and endocervical adenocarcinoma], COAD[Colon adenocarcinoma], GBM[Glioblastoma multiforme], Glioma Low Grade, HNSC[Head and Neck squamous cell carcinoma], KICH[Kidney Chromophobe], KIRC[Kidney renal clear cell carcinoma], KIRP[Kidney renal papillary cell carcinoma], LAML[Acute Myeloid Leukemia], LUAD[Lung adenocarcinoma], LUSC[Lung squamous cell carcinoma], OV[Ovarian serous cystadenocarcinoma ], PAAD[Pancreatic adenocarcinoma], PRAD[Prostate adenocarcinoma], SKCM[Skin Cutaneous Melanoma], STAD[Stomach adenocarcinoma], THCA[Thyroid carcinoma], UCEC[Uterine Corpus Endometrial Carcinoma] |
| Top |
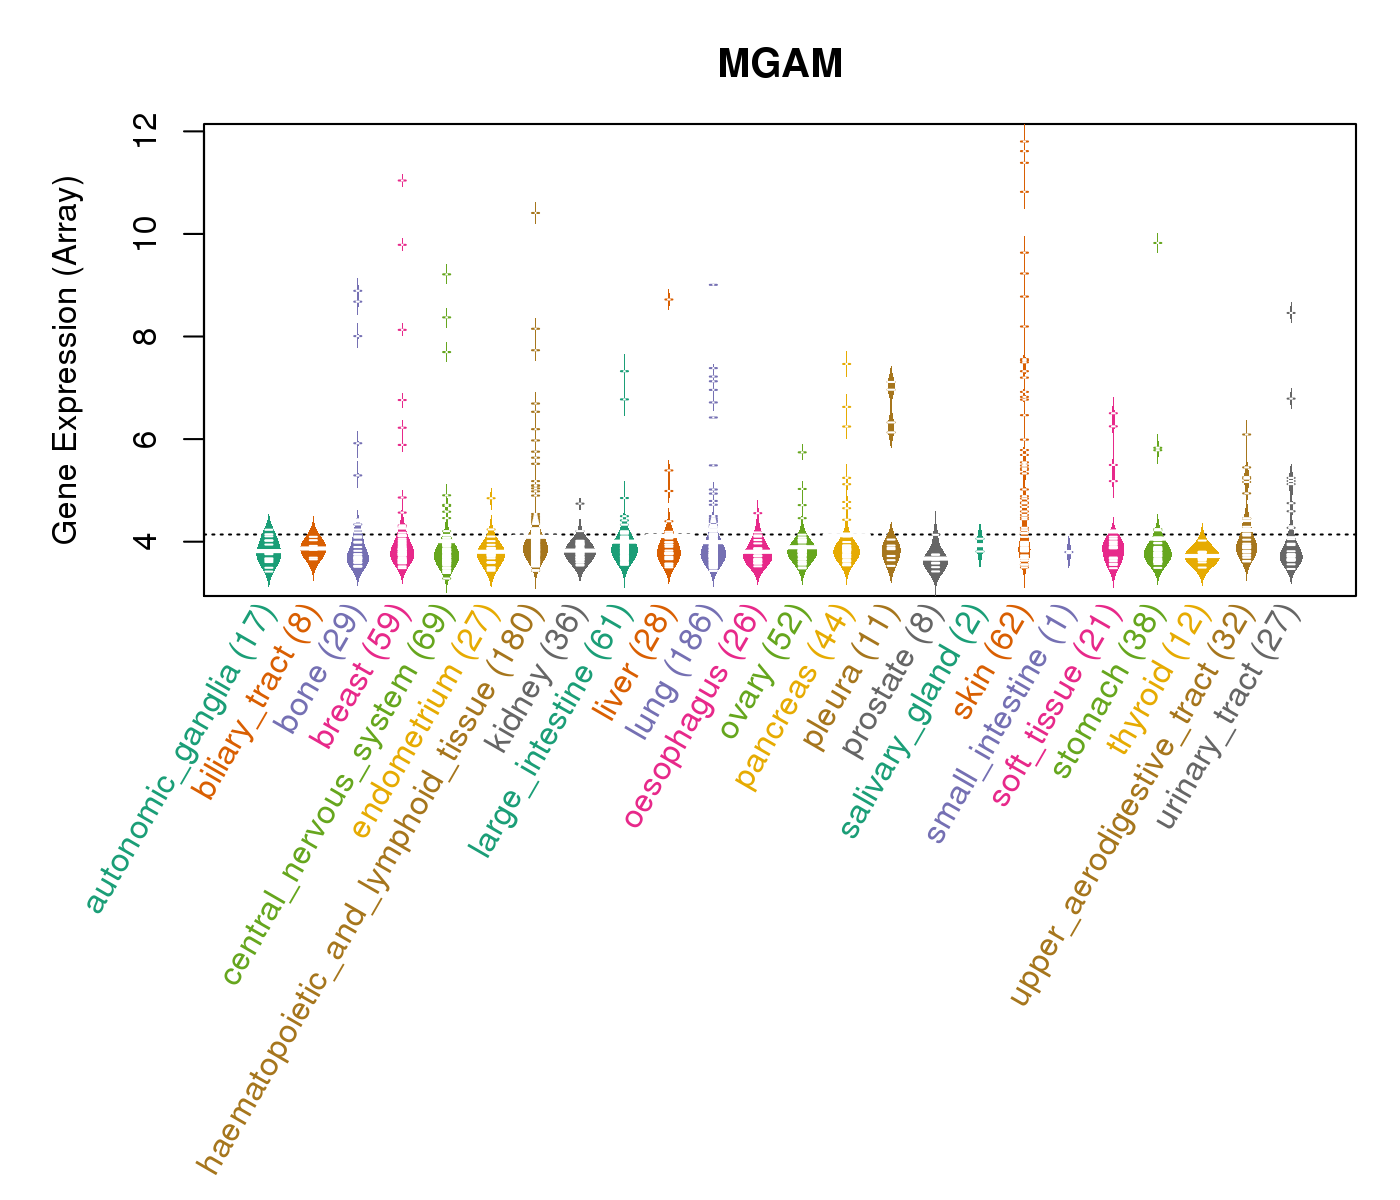
| Gene Expression for MGAM |
| * CCLE gene expression data were extracted from CCLE_Expression_Entrez_2012-10-18.res: Gene-centric RMA-normalized mRNA expression data. |
 |
| * Normalized gene expression data of RNASeqV2 was extracted from TCGA using R package TCGA-Assembler. The URLs of all public data files on TCGA DCC data server were gathered at Jan-05-2015. Only eight cancer types have enough normal control samples for differential expression analysis. (t test, adjusted p<0.05 (using Benjamini-Hochberg FDR)) |
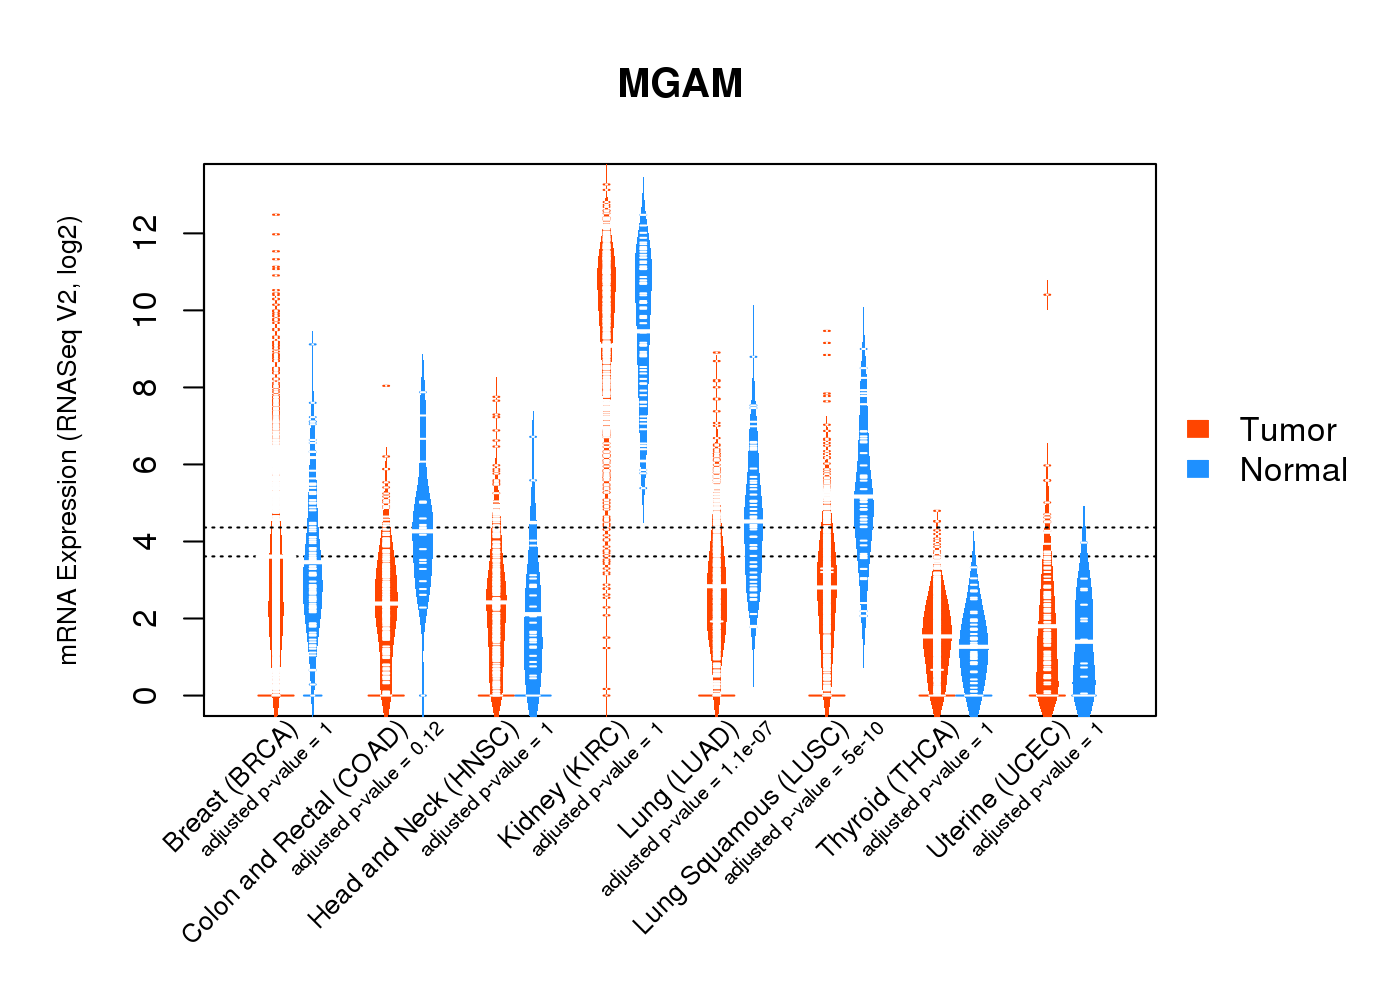 |
| Top |
| * This plots show the correlation between CNV and gene expression. |
: Open all plots for all cancer types
 |
|
 |
|
| Top |
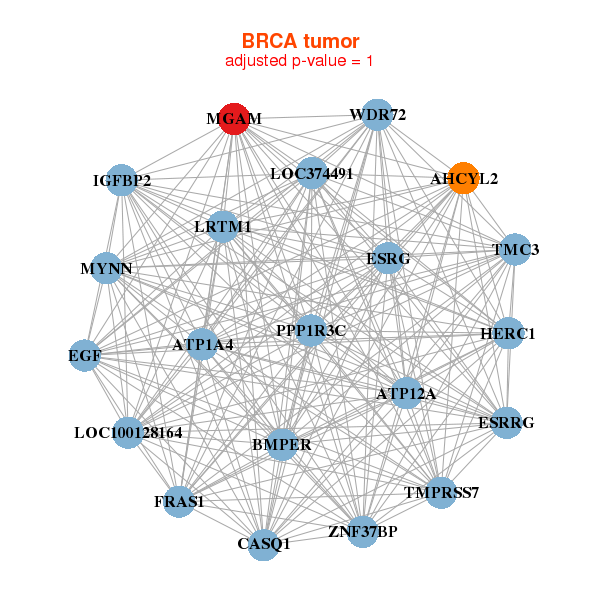
| Gene-Gene Network Information |
| * Co-Expression network figures were drawn using R package igraph. Only the top 20 genes with the highest correlations were shown. Red circle: input gene, orange circle: cell metabolism gene, sky circle: other gene |
: Open all plots for all cancer types
 |
| ||||
| AHCYL2,ATP12A,ATP1A4,BMPER,CASQ1,EGF,ESRRG, FRAS1,HERC1,ESRG,IGFBP2,LOC100128164,LOC374491,LRTM1, MGAM,MYNN,PPP1R3C,TMC3,TMPRSS7,WDR72,ZNF37BP | ADAM8,APOC1,CELA1,CHIT1,DEC1,DNAJC5B,HOXB9, HS3ST2,HTRA4,LILRA4,MGAM,LINC00112,NKX2-6,OR11A1, PKD2L1,PRAMEF22,SCARNA11,SDS,SNORA27,SULT1E1,TNFRSF11B | ||||
 |
| ||||
| AJAP1,ARG1,AVPR1A,CLEC4D,COL15A1,CXCR1,CXCR2, SUPT20HL2,FPR1,FPR2,GPR97,HRH2,IL7R,LINGO4, MGAM,PADI4,PGLYRP1,S100A12,SELE,TCTE1,TNC | AADAC,ALDOB,APOA1,APOA4,APOB,APOC3,C17orf78, ERICH4,CEACAM20,CRISP1,DPEP1,ENPEP,FABP6,GSTA2, GSTA5,KCNJ13,LOC285733,MGAM,ONECUT3,SLC2A2,SLC5A12, SL |
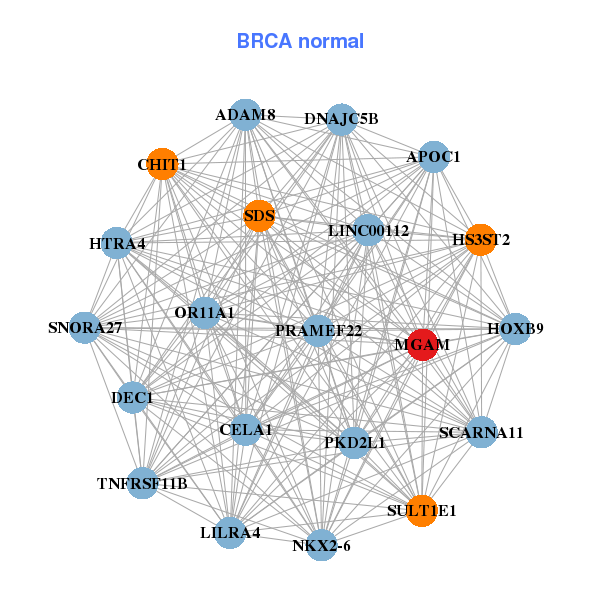

| * Co-Expression network figures were drawn using R package igraph. Only the top 20 genes with the highest correlations were shown. Red circle: input gene, orange circle: cell metabolism gene, sky circle: other gene |
: Open all plots for all cancer types
| Top |
: Open all interacting genes' information including KEGG pathway for all interacting genes from DAVID
| Top |
| Pharmacological Information for MGAM |
| DB Category | DB Name | DB's ID and Url link |
| Chemistry | BindingDB | O43451; -. |
| Chemistry | ChEMBL | CHEMBL2074; -. |
| Chemistry | GuidetoPHARMACOLOGY | 2627; -. |
| Organism-specific databases | PharmGKB | PA30778; -. |
| Organism-specific databases | CTD | 8972; -. |
| * Gene Centered Interaction Network. |
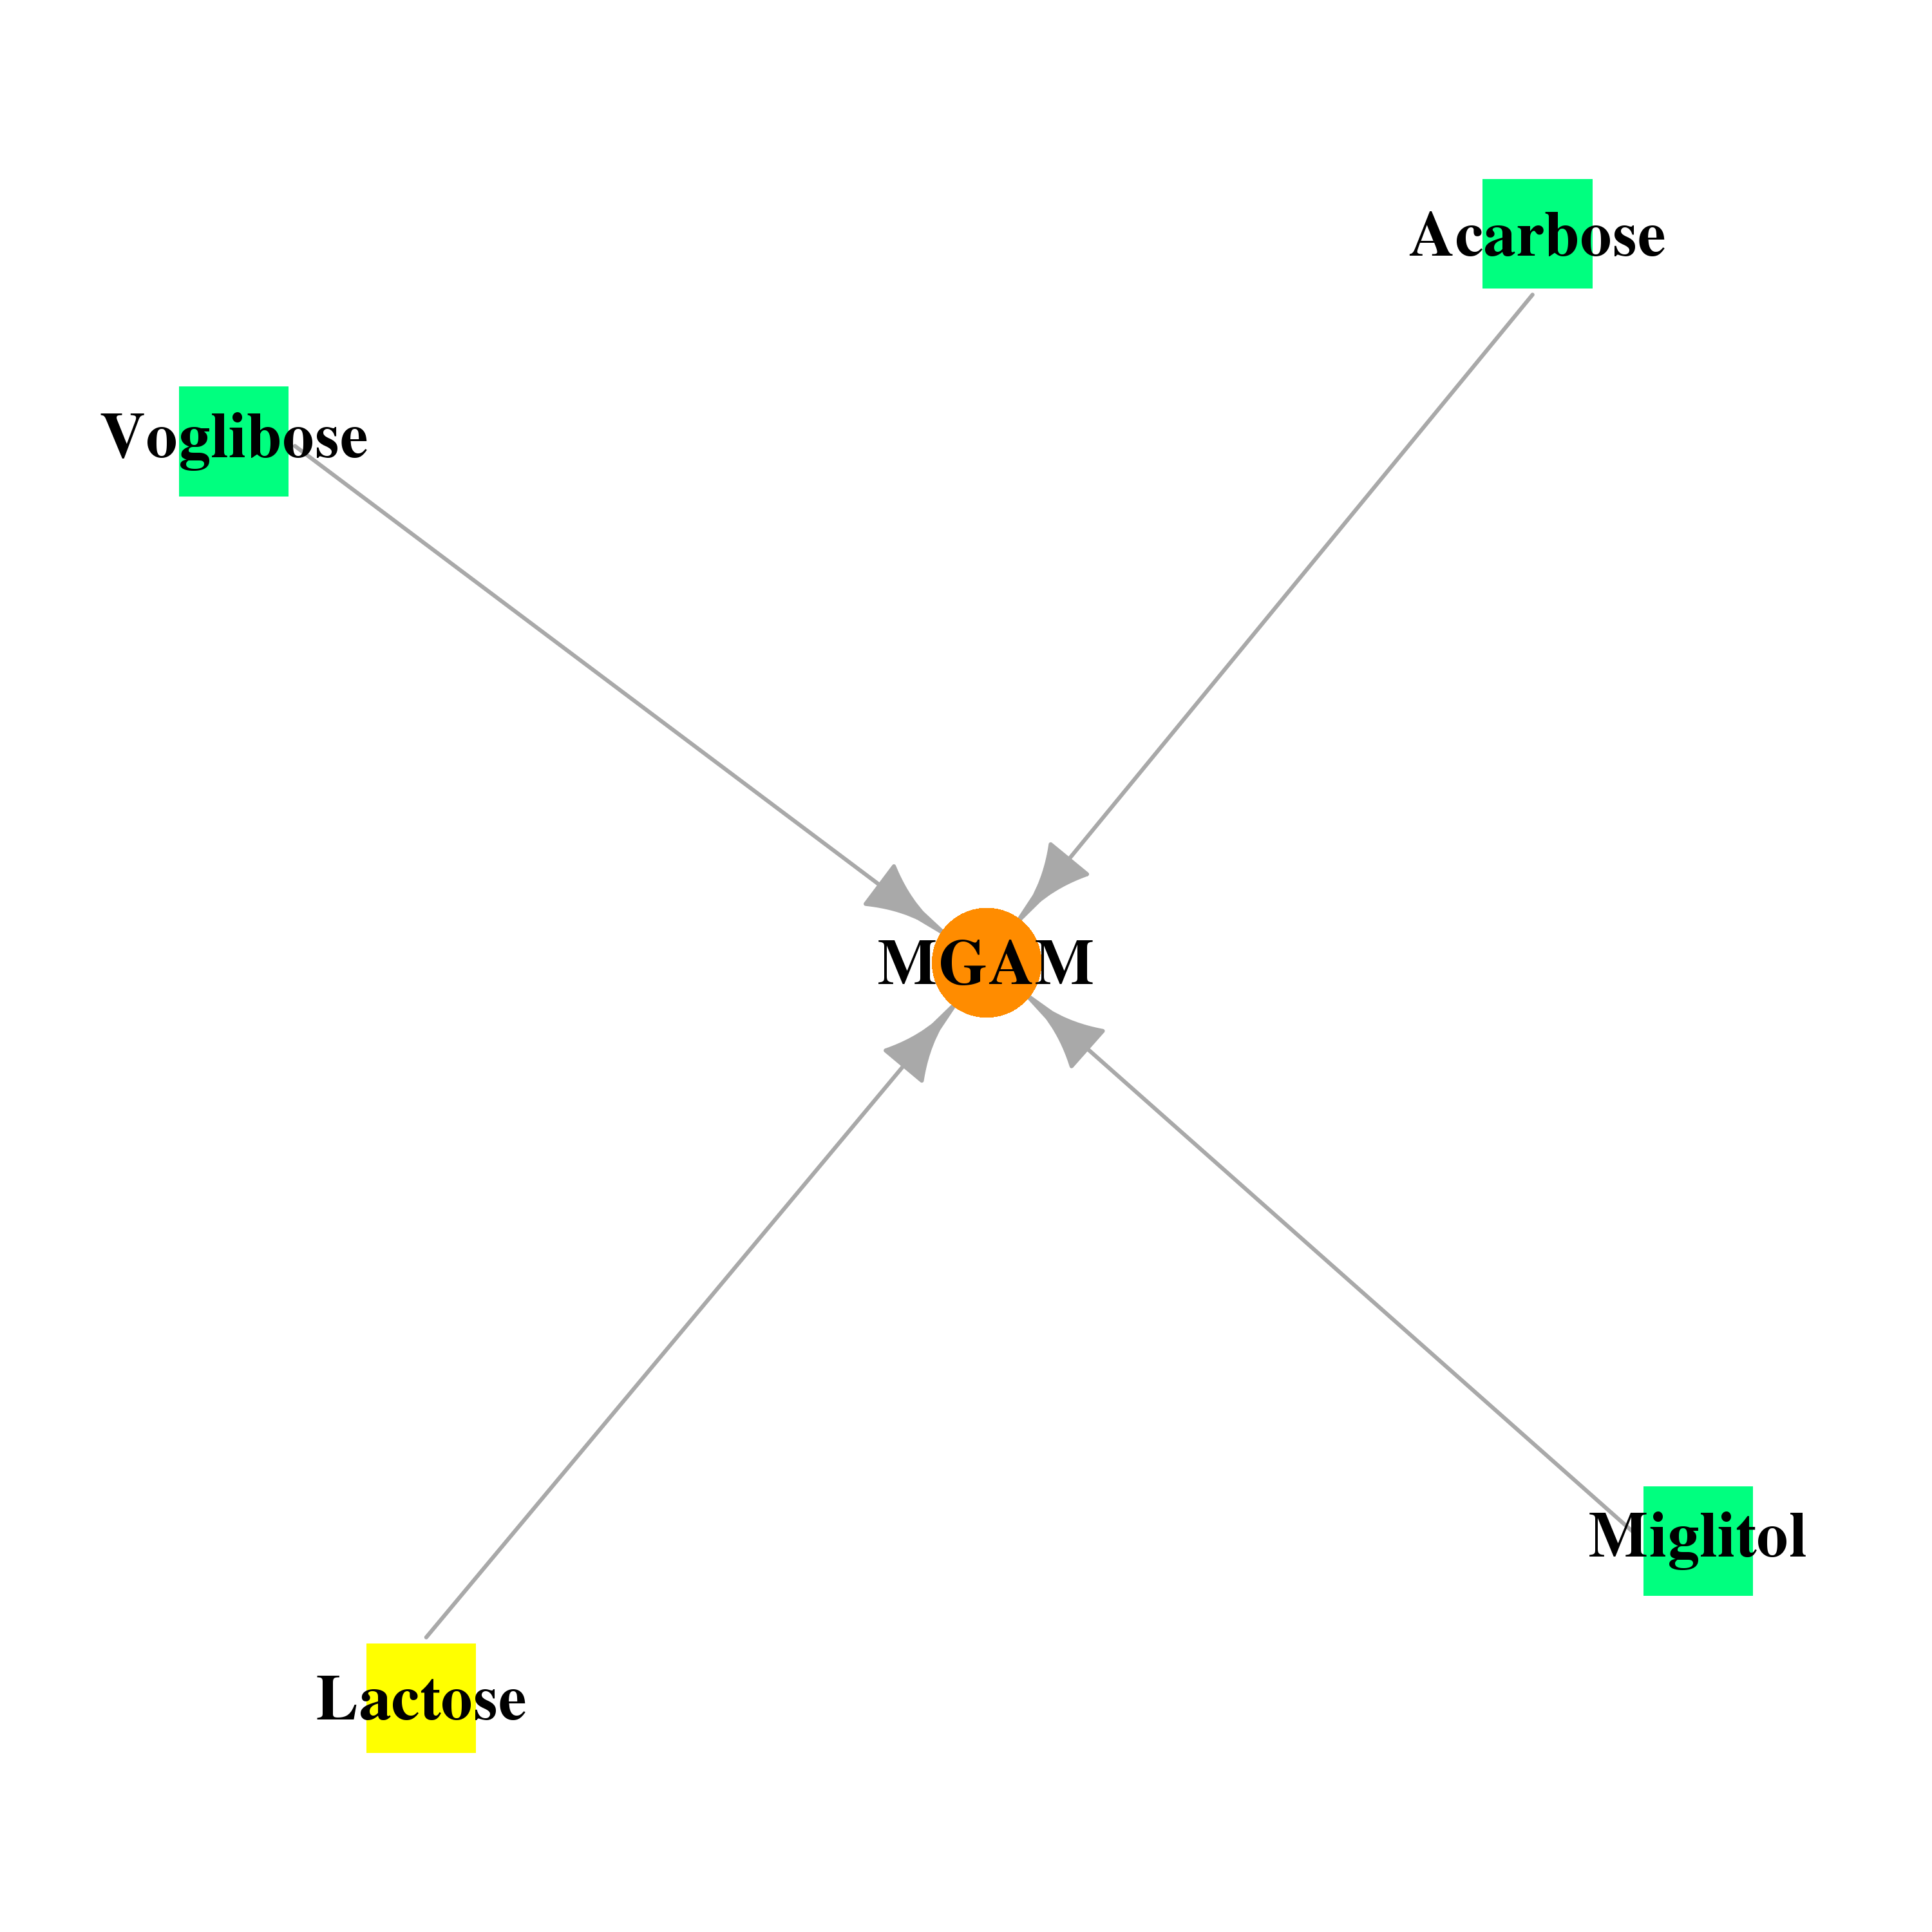 |
| * Drug Centered Interaction Network. |
| DrugBank ID | Target Name | Drug Groups | Generic Name | Drug Centered Network | Drug Structure |
| DB00284 | maltase-glucoamylase (alpha-glucosidase) | approved; investigational | Acarbose |  |  |
| DB00491 | maltase-glucoamylase (alpha-glucosidase) | approved | Miglitol | 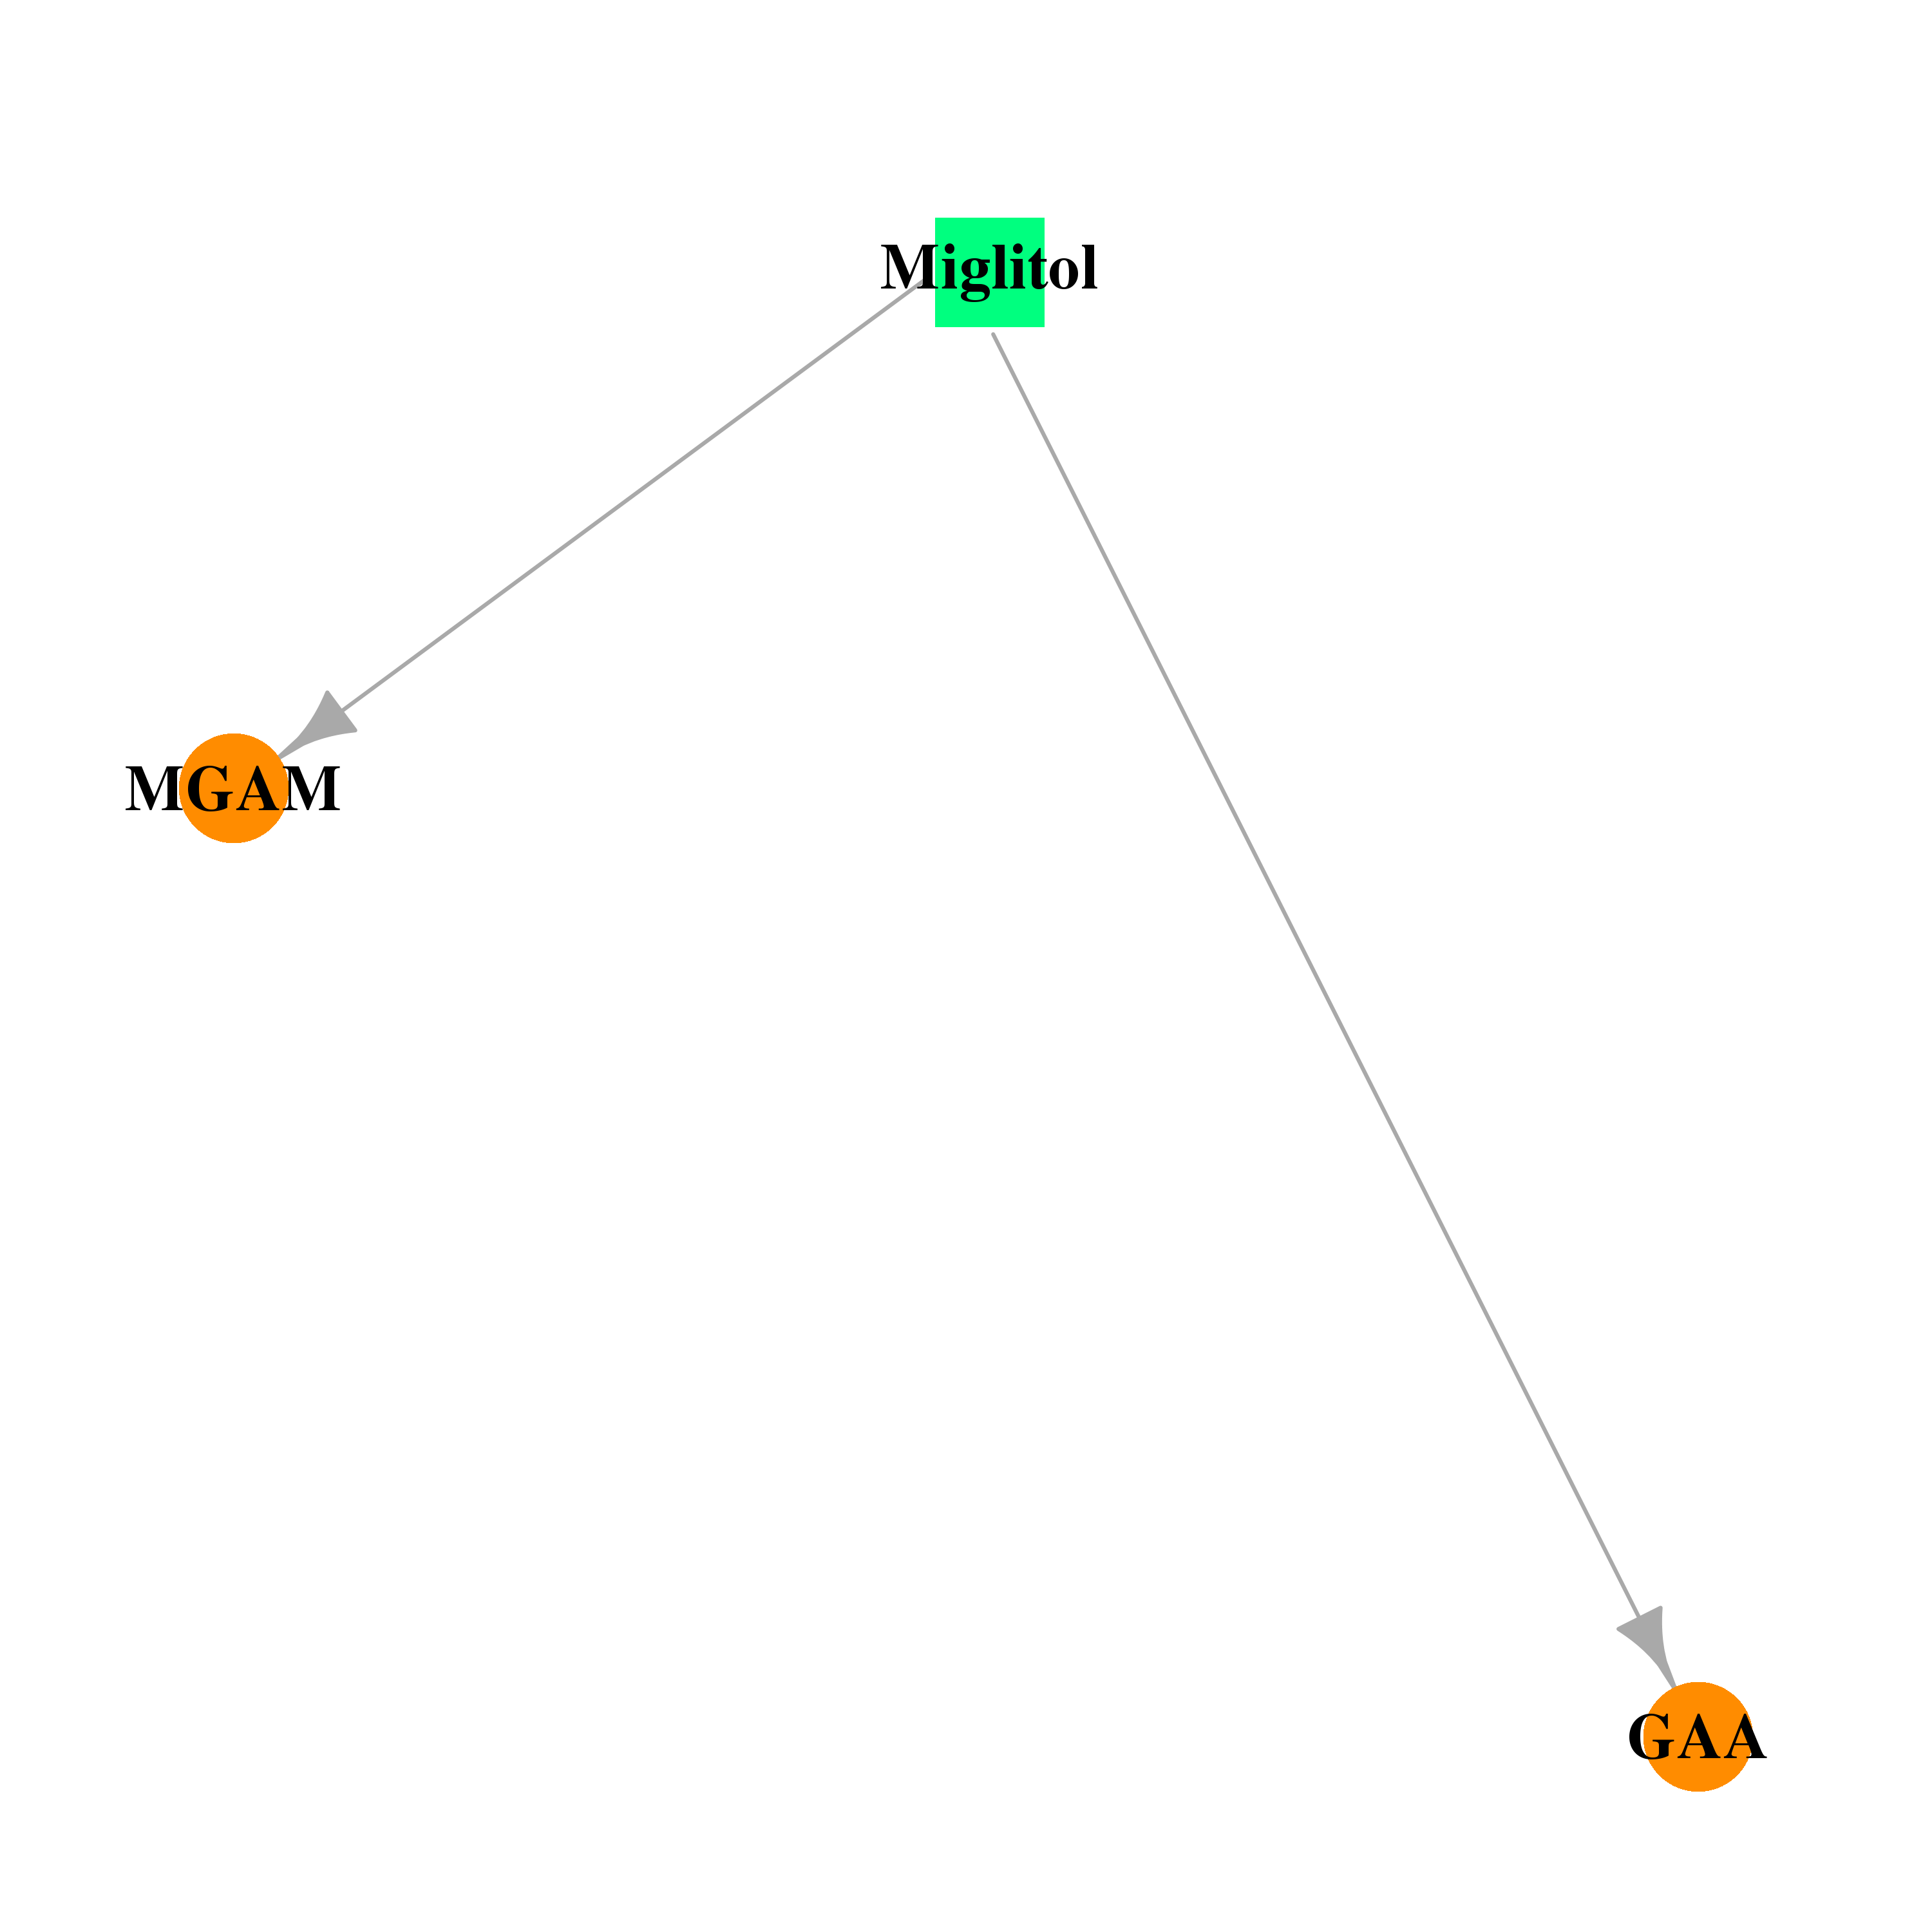 |  |
| DB04878 | maltase-glucoamylase (alpha-glucosidase) | approved; investigational | Voglibose | 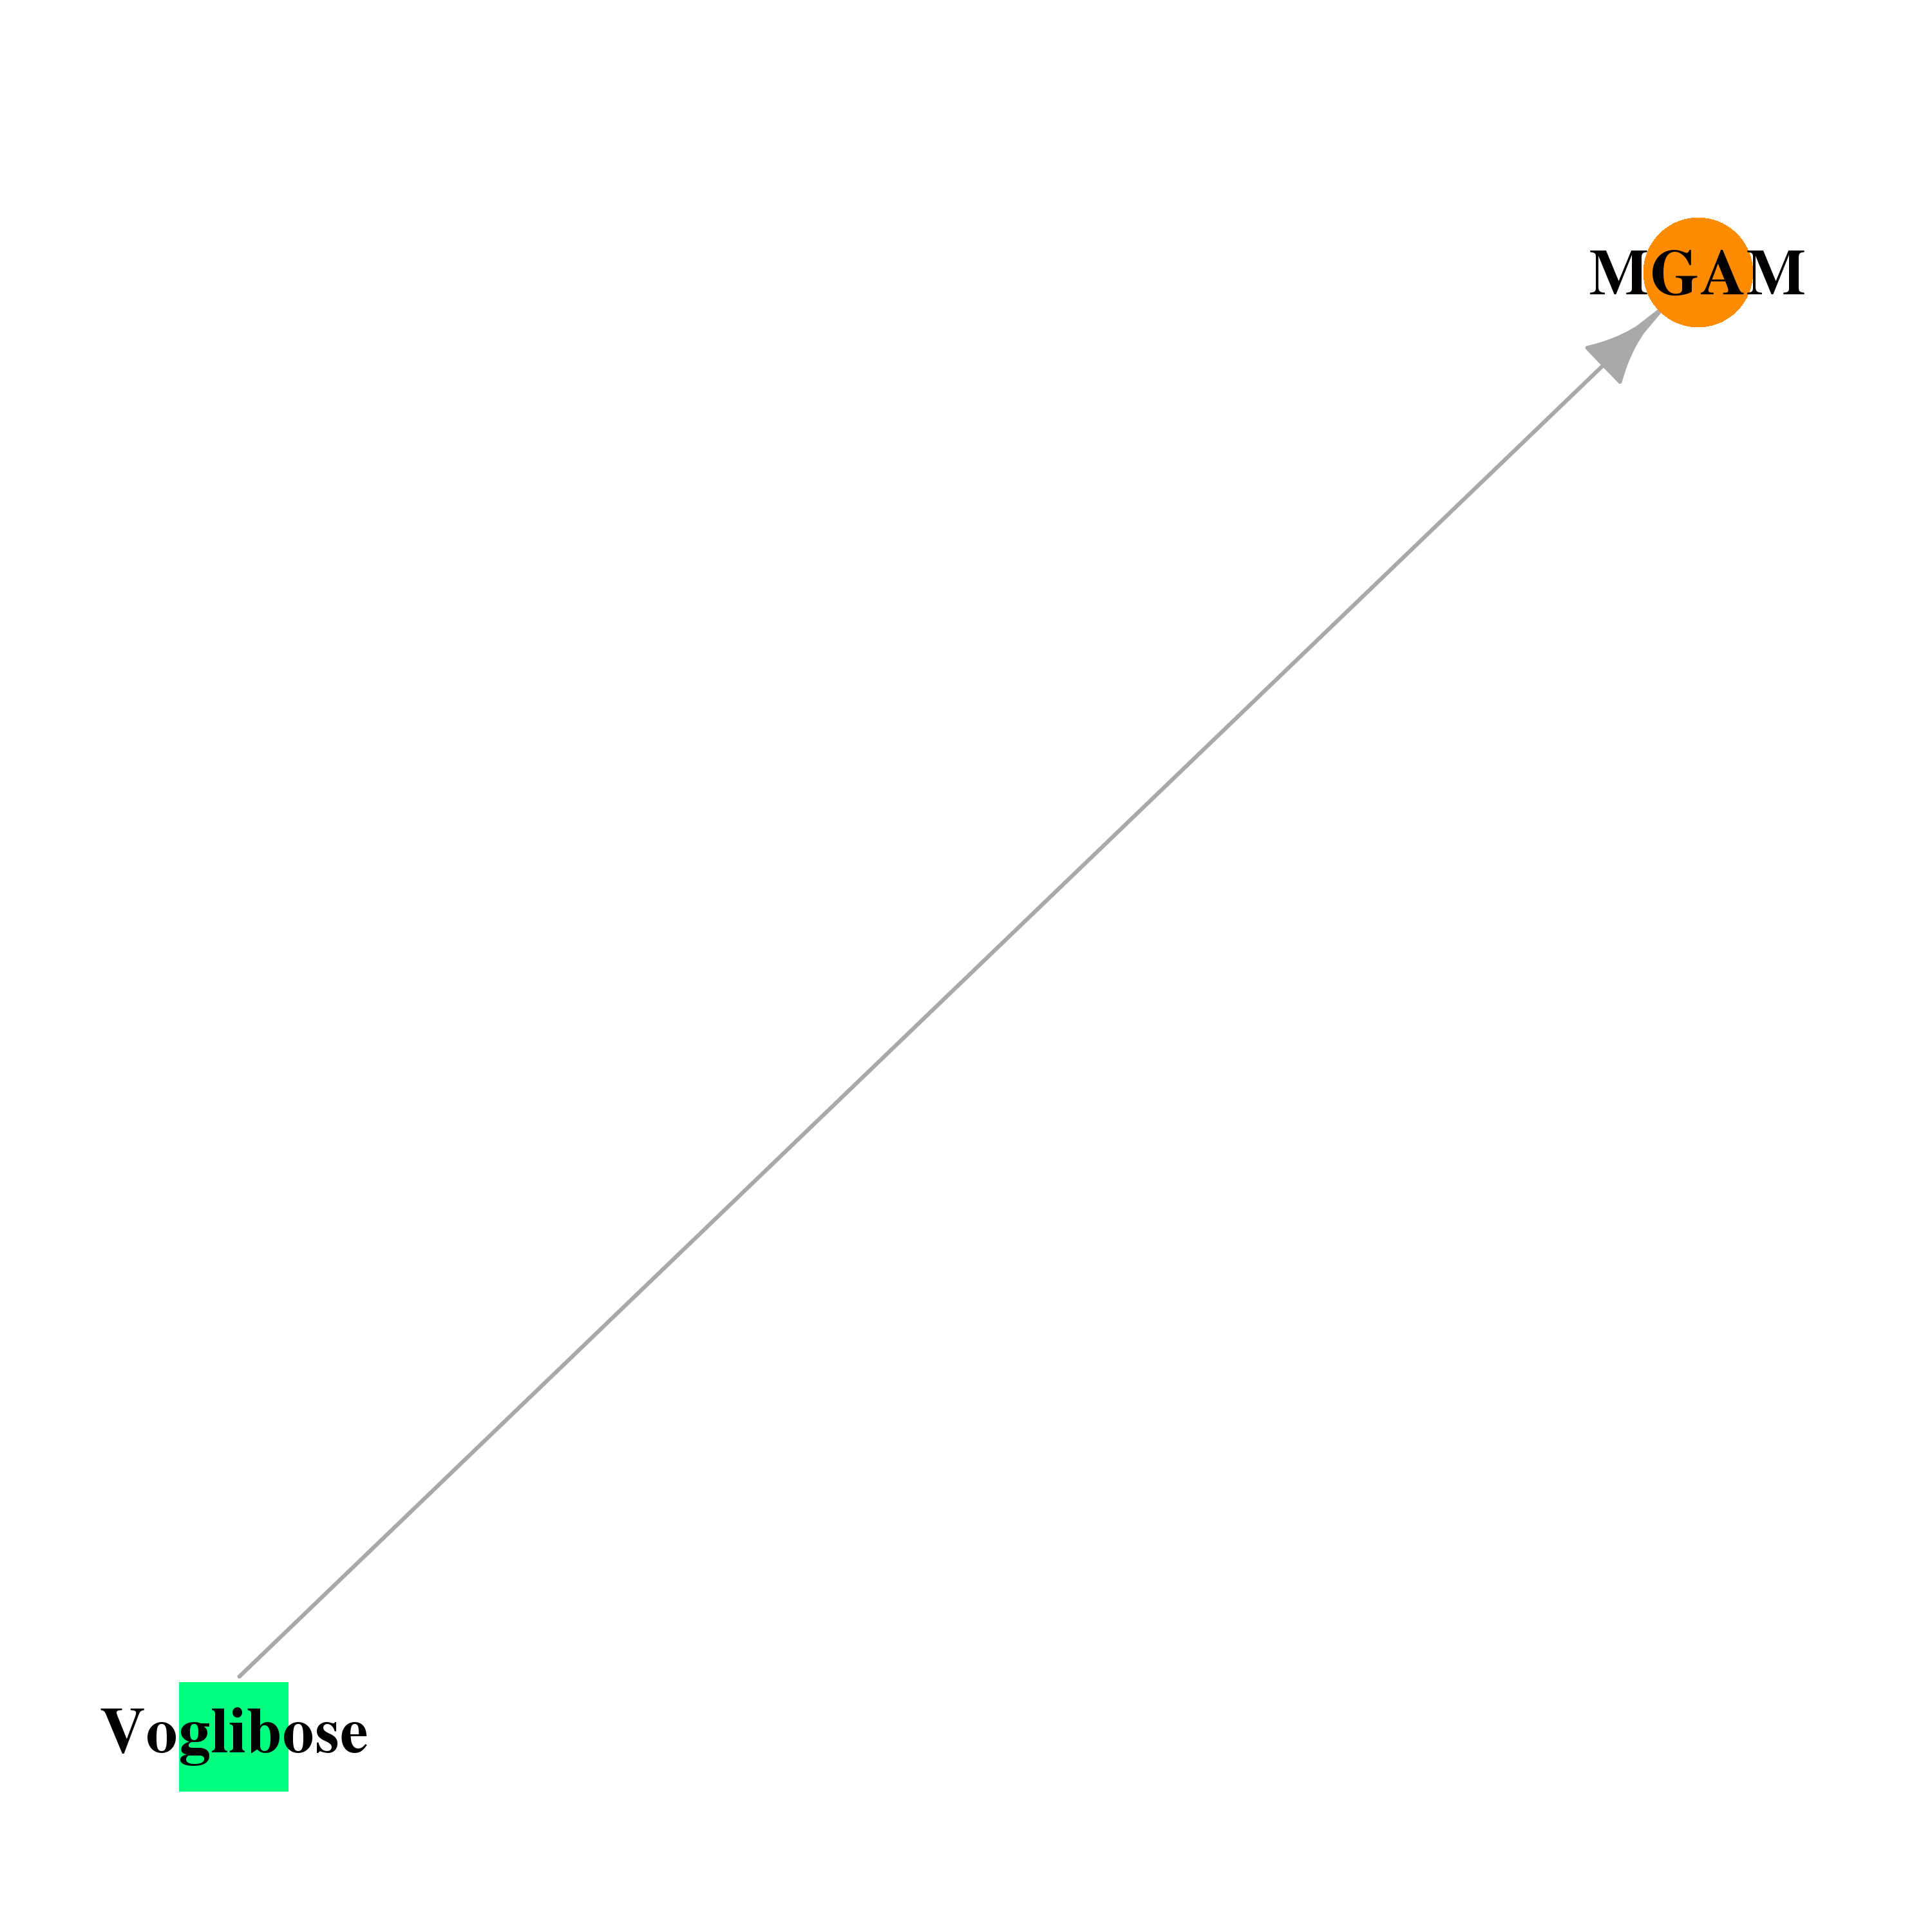 |  |
| DB04465 | maltase-glucoamylase (alpha-glucosidase) | experimental | Lactose |  |  |
| Top |
| Cross referenced IDs for MGAM |
| * We obtained these cross-references from Uniprot database. It covers 150 different DBs, 18 categories. http://www.uniprot.org/help/cross_references_section |
: Open all cross reference information
|
Copyright © 2016-Present - The Univsersity of Texas Health Science Center at Houston @ |