|
||||||||||||||||||||||||||||||||||||||||||||||||||||||||||||||||||||||||||||||||||||||||||||||||||||||||||||||||||||||||||||||||||||||||||||||||||||||||||||||||||||||||||||||||||||||||||||||||||||||||||||||||||||||||||||||||||||||||||||||||||||||||||||||||||||||||||||||||||||||||||||||||||||||||||||||||||||||||||
| |
| Phenotypic Information (metabolism pathway, cancer, disease, phenome) |
| |
| |
| Gene-Gene Network Information: Co-Expression Network, Interacting Genes & KEGG |
| |
|


| Gene Summary for CLOCK |
| Basic gene info. | Gene symbol | CLOCK |
| Gene name | clock circadian regulator | |
| Synonyms | KAT13D|bHLHe8 | |
| Cytomap | UCSC genome browser: 4q12 | |
| Genomic location | chr4 :56298659-56412997 | |
| Type of gene | protein-coding | |
| RefGenes | NM_001267843.1, NM_004898.3, | |
| Ensembl id | ENSG00000134852 | |
| Description | circadian locomoter output cycles kaput proteincircadian locomoter output cycles protein kaputclass E basic helix-loop-helix protein 8clock homolog | |
| Modification date | 20141222 | |
| dbXrefs | MIM : 601851 | |
| HGNC : HGNC | ||
| Ensembl : ENSG00000134852 | ||
| HPRD : 03508 | ||
| Vega : OTTHUMG00000102141 | ||
| Protein | UniProt: O15516 go to UniProt's Cross Reference DB Table | |
| Expression | CleanEX: HS_CLOCK | |
| BioGPS: 9575 | ||
| Gene Expression Atlas: ENSG00000134852 | ||
| The Human Protein Atlas: ENSG00000134852 | ||
| Pathway | NCI Pathway Interaction Database: CLOCK | |
| KEGG: CLOCK | ||
| REACTOME: CLOCK | ||
| ConsensusPathDB | ||
| Pathway Commons: CLOCK | ||
| Metabolism | MetaCyc: CLOCK | |
| HUMANCyc: CLOCK | ||
| Regulation | Ensembl's Regulation: ENSG00000134852 | |
| miRBase: chr4 :56,298,659-56,412,997 | ||
| TargetScan: NM_001267843 | ||
| cisRED: ENSG00000134852 | ||
| Context | iHOP: CLOCK | |
| cancer metabolism search in PubMed: CLOCK | ||
| UCL Cancer Institute: CLOCK | ||
| Assigned class in ccmGDB | B - This gene belongs to cancer gene. | |
| Top |
| Phenotypic Information for CLOCK(metabolism pathway, cancer, disease, phenome) |
| Cancer | CGAP: CLOCK |
| Familial Cancer Database: CLOCK | |
| * This gene is included in those cancer gene databases. |
|
|
|
|
|
| . | ||||||||||||||||||||||||||||||||||||||||||||||||||||||||||||||||||||||||||||||||||||||||||||||||||||||||||||||||||||||||||||||||||||||||||||||||||||||||||||||||||||||||||||||||||||||||||||||||||||||||||||||||||||||||||||||||||||||||||||||||||||||||||||||||||||||||||||||||||||||||||||||||||||||||||||||||||||
Oncogene 1 | Significant driver gene in | |||||||||||||||||||||||||||||||||||||||||||||||||||||||||||||||||||||||||||||||||||||||||||||||||||||||||||||||||||||||||||||||||||||||||||||||||||||||||||||||||||||||||||||||||||||||||||||||||||||||||||||||||||||||||||||||||||||||||||||||||||||||||||||||||||||||||||||||||||||||||||||||||||||||||||||||||||||||||
| cf) number; DB name 1 Oncogene; http://nar.oxfordjournals.org/content/35/suppl_1/D721.long, 2 Tumor Suppressor gene; https://bioinfo.uth.edu/TSGene/, 3 Cancer Gene Census; http://www.nature.com/nrc/journal/v4/n3/abs/nrc1299.html, 4 CancerGenes; http://nar.oxfordjournals.org/content/35/suppl_1/D721.long, 5 Network of Cancer Gene; http://ncg.kcl.ac.uk/index.php, 1Therapeutic Vulnerabilities in Cancer; http://cbio.mskcc.org/cancergenomics/statius/ |
| REACTOME_METABOLISM_OF_LIPIDS_AND_LIPOPROTEINS | |
| OMIM | 601851; gene. |
| Orphanet | |
| Disease | KEGG Disease: CLOCK |
| MedGen: CLOCK (Human Medical Genetics with Condition) | |
| ClinVar: CLOCK | |
| Phenotype | MGI: CLOCK (International Mouse Phenotyping Consortium) |
| PhenomicDB: CLOCK | |
| Mutations for CLOCK |
| * Under tables are showing count per each tissue to give us broad intuition about tissue specific mutation patterns.You can go to the detailed page for each mutation database's web site. |
| - Statistics for Tissue and Mutation type | Top |
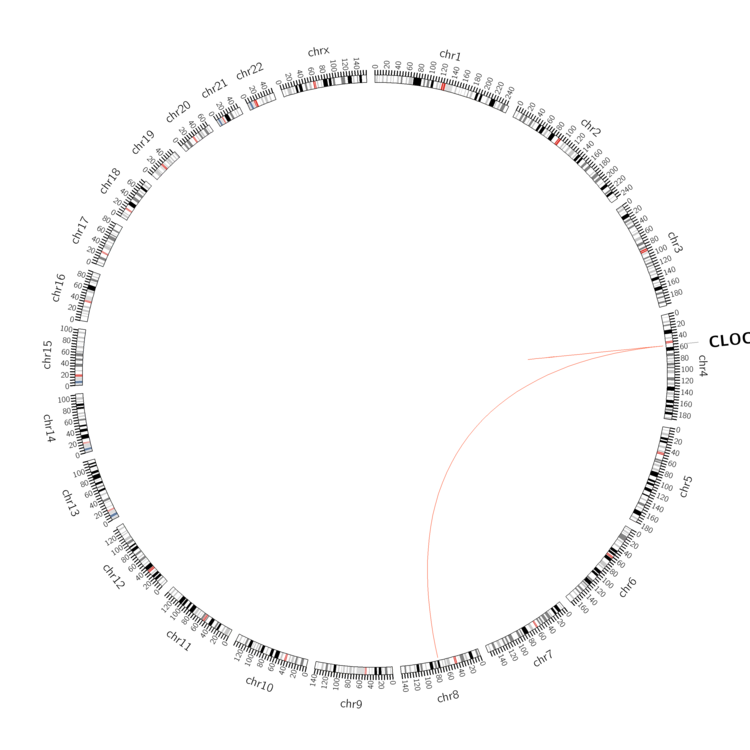 |
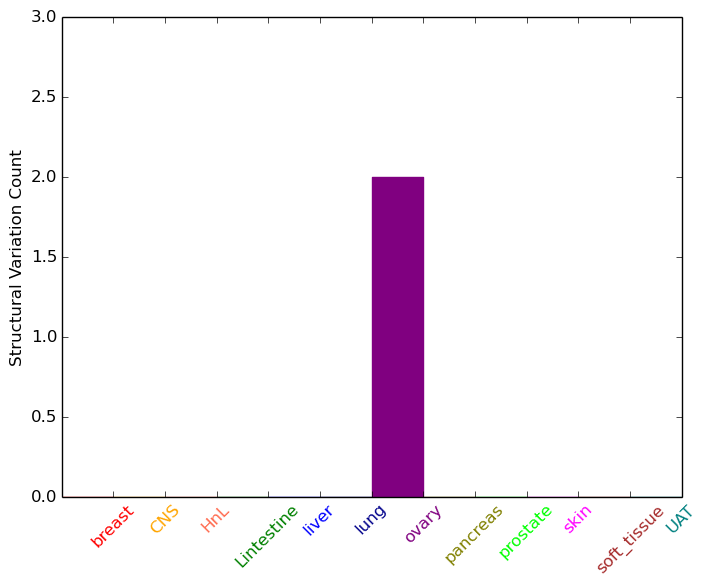
| - For Inter-chromosomal Variations |
| * Inter-chromosomal variantions includes 'interchromosomal amplicon to amplicon', 'interchromosomal amplicon to non-amplified dna', 'interchromosomal insertion', 'Interchromosomal unknown type'. |
 |
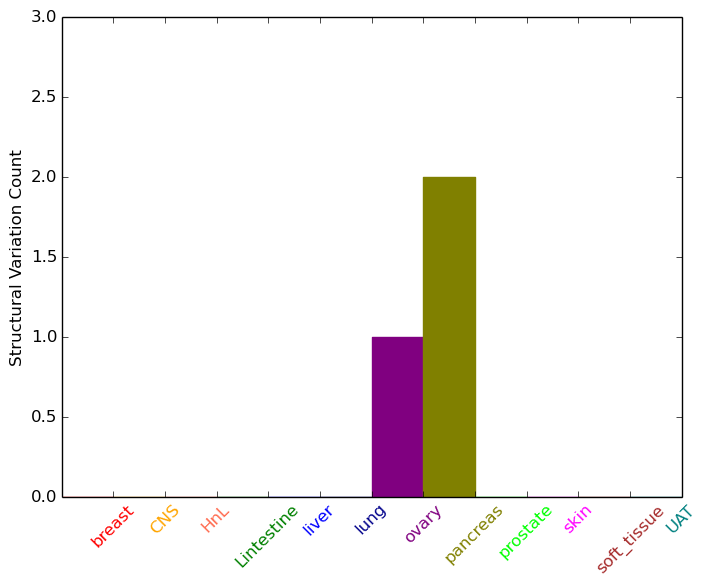
| - For Intra-chromosomal Variations |
| * Intra-chromosomal variantions includes 'intrachromosomal amplicon to amplicon', 'intrachromosomal amplicon to non-amplified dna', 'intrachromosomal deletion', 'intrachromosomal fold-back inversion', 'intrachromosomal inversion', 'intrachromosomal tandem duplication', 'Intrachromosomal unknown type', 'intrachromosomal with inverted orientation', 'intrachromosomal with non-inverted orientation'. |
 |
| Sample | Symbol_a | Chr_a | Start_a | End_a | Symbol_b | Chr_b | Start_b | End_b |
| ovary | CLOCK | chr4 | 56306510 | 56306530 | CLOCK | chr4 | 56352273 | 56352293 |
| ovary | CLOCK | chr4 | 56318273 | 56318293 | chr8 | 75768627 | 75768647 | |
| pancreas | CLOCK | chr4 | 56311262 | 56311282 | CLOCK | chr4 | 56311434 | 56311454 |
| pancreas | CLOCK | chr4 | 56311386 | 56311406 | CLOCK | chr4 | 56316157 | 56316177 |
| cf) Tissue number; Tissue name (1;Breast, 2;Central_nervous_system, 3;Haematopoietic_and_lymphoid_tissue, 4;Large_intestine, 5;Liver, 6;Lung, 7;Ovary, 8;Pancreas, 9;Prostate, 10;Skin, 11;Soft_tissue, 12;Upper_aerodigestive_tract) |
| * From mRNA Sanger sequences, Chitars2.0 arranged chimeric transcripts. This table shows CLOCK related fusion information. |
| ID | Head Gene | Tail Gene | Accession | Gene_a | qStart_a | qEnd_a | Chromosome_a | tStart_a | tEnd_a | Gene_a | qStart_a | qEnd_a | Chromosome_a | tStart_a | tEnd_a |
| BE883242 | CLOCK | 10 | 79 | 4 | 56299576 | 56299645 | CLOCK | 74 | 676 | 4 | 56299008 | 56299610 | |
| Top |
| Mutation type/ Tissue ID | brca | cns | cerv | endome | haematopo | kidn | Lintest | liver | lung | ns | ovary | pancre | prost | skin | stoma | thyro | urina | |||
| Total # sample | 1 | 1 | 4 | |||||||||||||||||
| GAIN (# sample) | 1 | 4 | ||||||||||||||||||
| LOSS (# sample) | 1 |
| cf) Tissue ID; Tissue type (1; Breast, 2; Central_nervous_system, 3; Cervix, 4; Endometrium, 5; Haematopoietic_and_lymphoid_tissue, 6; Kidney, 7; Large_intestine, 8; Liver, 9; Lung, 10; NS, 11; Ovary, 12; Pancreas, 13; Prostate, 14; Skin, 15; Stomach, 16; Thyroid, 17; Urinary_tract) |
| Top |
|
 |
| Top |
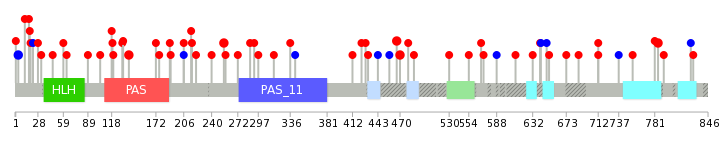
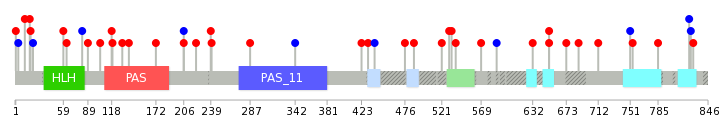
| Stat. for Non-Synonymous SNVs (# total SNVs=57) | (# total SNVs=10) |
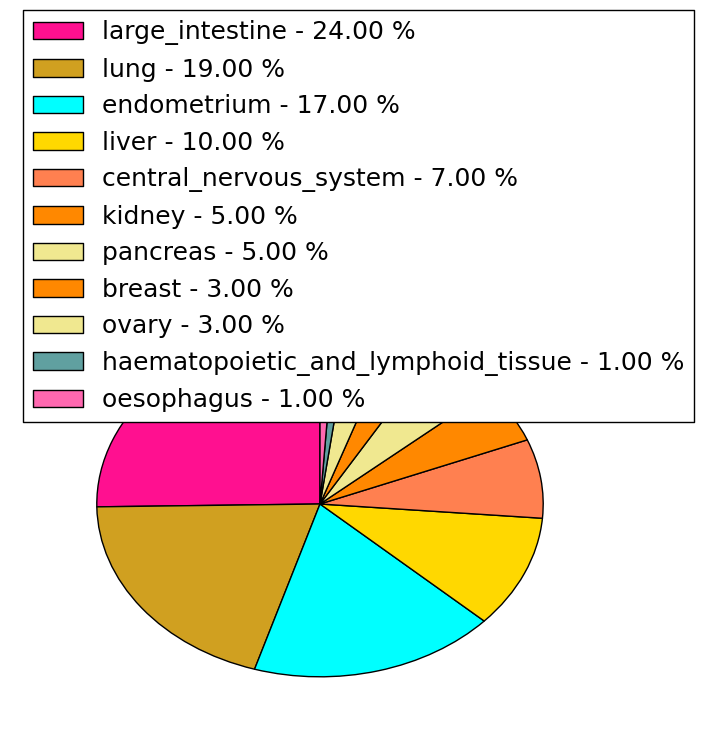 | 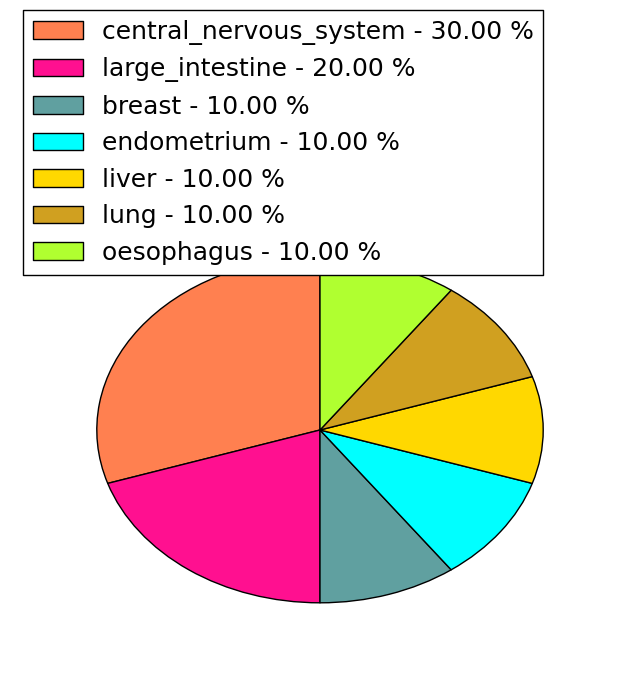 |
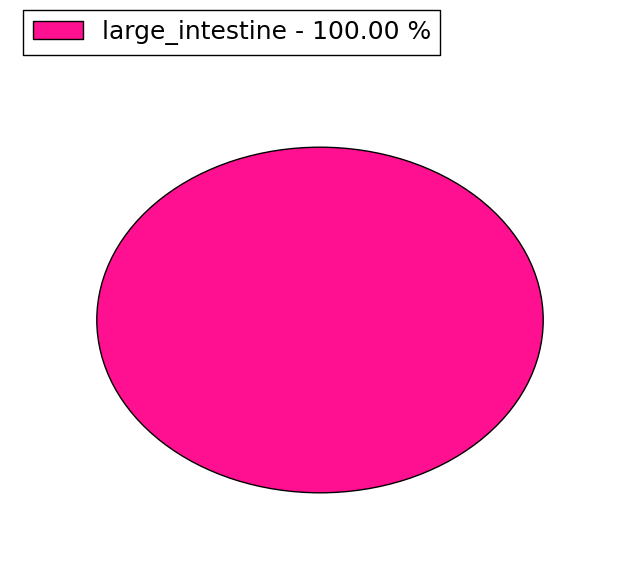
(# total SNVs=18) | (# total SNVs=4) |
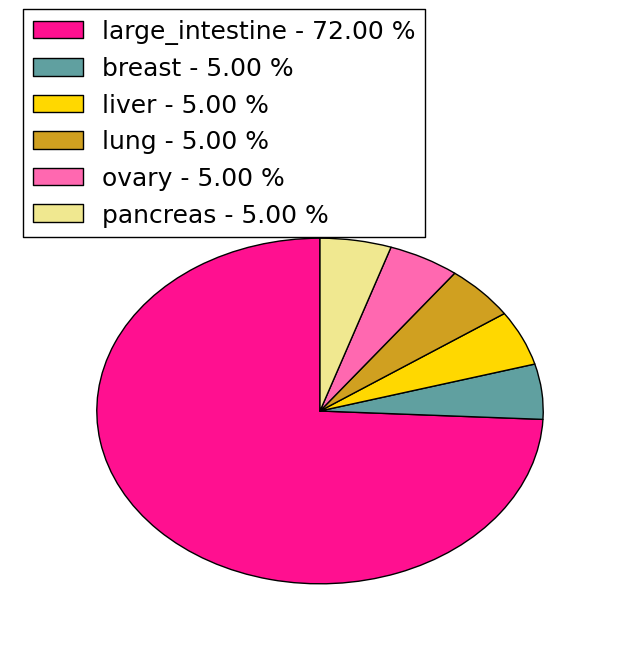 |  |
| Top |
| * When you move the cursor on each content, you can see more deailed mutation information on the Tooltip. Those are primary_site,primary_histology,mutation(aa),pubmedID. |
| GRCh37 position | Mutation(aa) | Unique sampleID count |
| chr4:56336954-56336954 | p.L123fs*1 | 17 |
| chr4:56336953-56336954 | p.L123fs*14 | 3 |
| chr4:56315604-56315604 | p.H470Y | 2 |
| chr4:56315615-56315615 | p.H466L | 2 |
| chr4:56336906-56336906 | p.T139N | 2 |
| chr4:56348941-56348941 | p.T4T | 2 |
| chr4:56304455-56304455 | p.F785L | 2 |
| chr4:56325088-56325088 | p.V255I | 2 |
| chr4:56310042-56310042 | p.P572S | 1 |
| chr4:56325133-56325133 | p.T240A | 1 |
| Top |
|
 |
| Point Mutation/ Tissue ID | 1 | 2 | 3 | 4 | 5 | 6 | 7 | 8 | 9 | 10 | 11 | 12 | 13 | 14 | 15 | 16 | 17 | 18 | 19 | 20 |
| # sample | 1 | 7 | 5 | 4 | 2 | 1 | 3 | 4 | 1 | 1 | 1 | 3 | 7 | |||||||
| # mutation | 1 | 9 | 5 | 4 | 2 | 1 | 3 | 4 | 1 | 1 | 1 | 4 | 9 | |||||||
| nonsynonymous SNV | 1 | 7 | 3 | 3 | 2 | 3 | 4 | 1 | 1 | 3 | 8 | |||||||||
| synonymous SNV | 2 | 2 | 1 | 1 | 1 | 1 | 1 |
| cf) Tissue ID; Tissue type (1; BLCA[Bladder Urothelial Carcinoma], 2; BRCA[Breast invasive carcinoma], 3; CESC[Cervical squamous cell carcinoma and endocervical adenocarcinoma], 4; COAD[Colon adenocarcinoma], 5; GBM[Glioblastoma multiforme], 6; Glioma Low Grade, 7; HNSC[Head and Neck squamous cell carcinoma], 8; KICH[Kidney Chromophobe], 9; KIRC[Kidney renal clear cell carcinoma], 10; KIRP[Kidney renal papillary cell carcinoma], 11; LAML[Acute Myeloid Leukemia], 12; LUAD[Lung adenocarcinoma], 13; LUSC[Lung squamous cell carcinoma], 14; OV[Ovarian serous cystadenocarcinoma ], 15; PAAD[Pancreatic adenocarcinoma], 16; PRAD[Prostate adenocarcinoma], 17; SKCM[Skin Cutaneous Melanoma], 18:STAD[Stomach adenocarcinoma], 19:THCA[Thyroid carcinoma], 20:UCEC[Uterine Corpus Endometrial Carcinoma]) |
| Top |
| * We represented just top 10 SNVs. When you move the cursor on each content, you can see more deailed mutation information on the Tooltip. Those are primary_site, primary_histology, mutation(aa), pubmedID. |
| Genomic Position | Mutation(aa) | Unique sampleID count |
| chr4:56308750 | p.Q652K,CLOCK | 2 |
| chr4:56310894 | p.Q688R,CLOCK | 1 |
| chr4:56325135 | p.L287M,CLOCK | 1 |
| chr4:56304549 | p.F22F,CLOCK | 1 |
| chr4:56344994 | p.G673R,CLOCK | 1 |
| chr4:56310904 | p.T240A,CLOCK | 1 |
| chr4:56325326 | p.S19G,CLOCK | 1 |
| chr4:56304557 | p.R239H,CLOCK | 1 |
| chr4:56345050 | p.D18G,CLOCK | 1 |
| chr4:56310930 | p.S632L,CLOCK | 1 |
| * Copy number data were extracted from TCGA using R package TCGA-Assembler. The URLs of all public data files on TCGA DCC data server were gathered on Jan-05-2015. Function ProcessCNAData in TCGA-Assembler package was used to obtain gene-level copy number value which is calculated as the average copy number of the genomic region of a gene. |
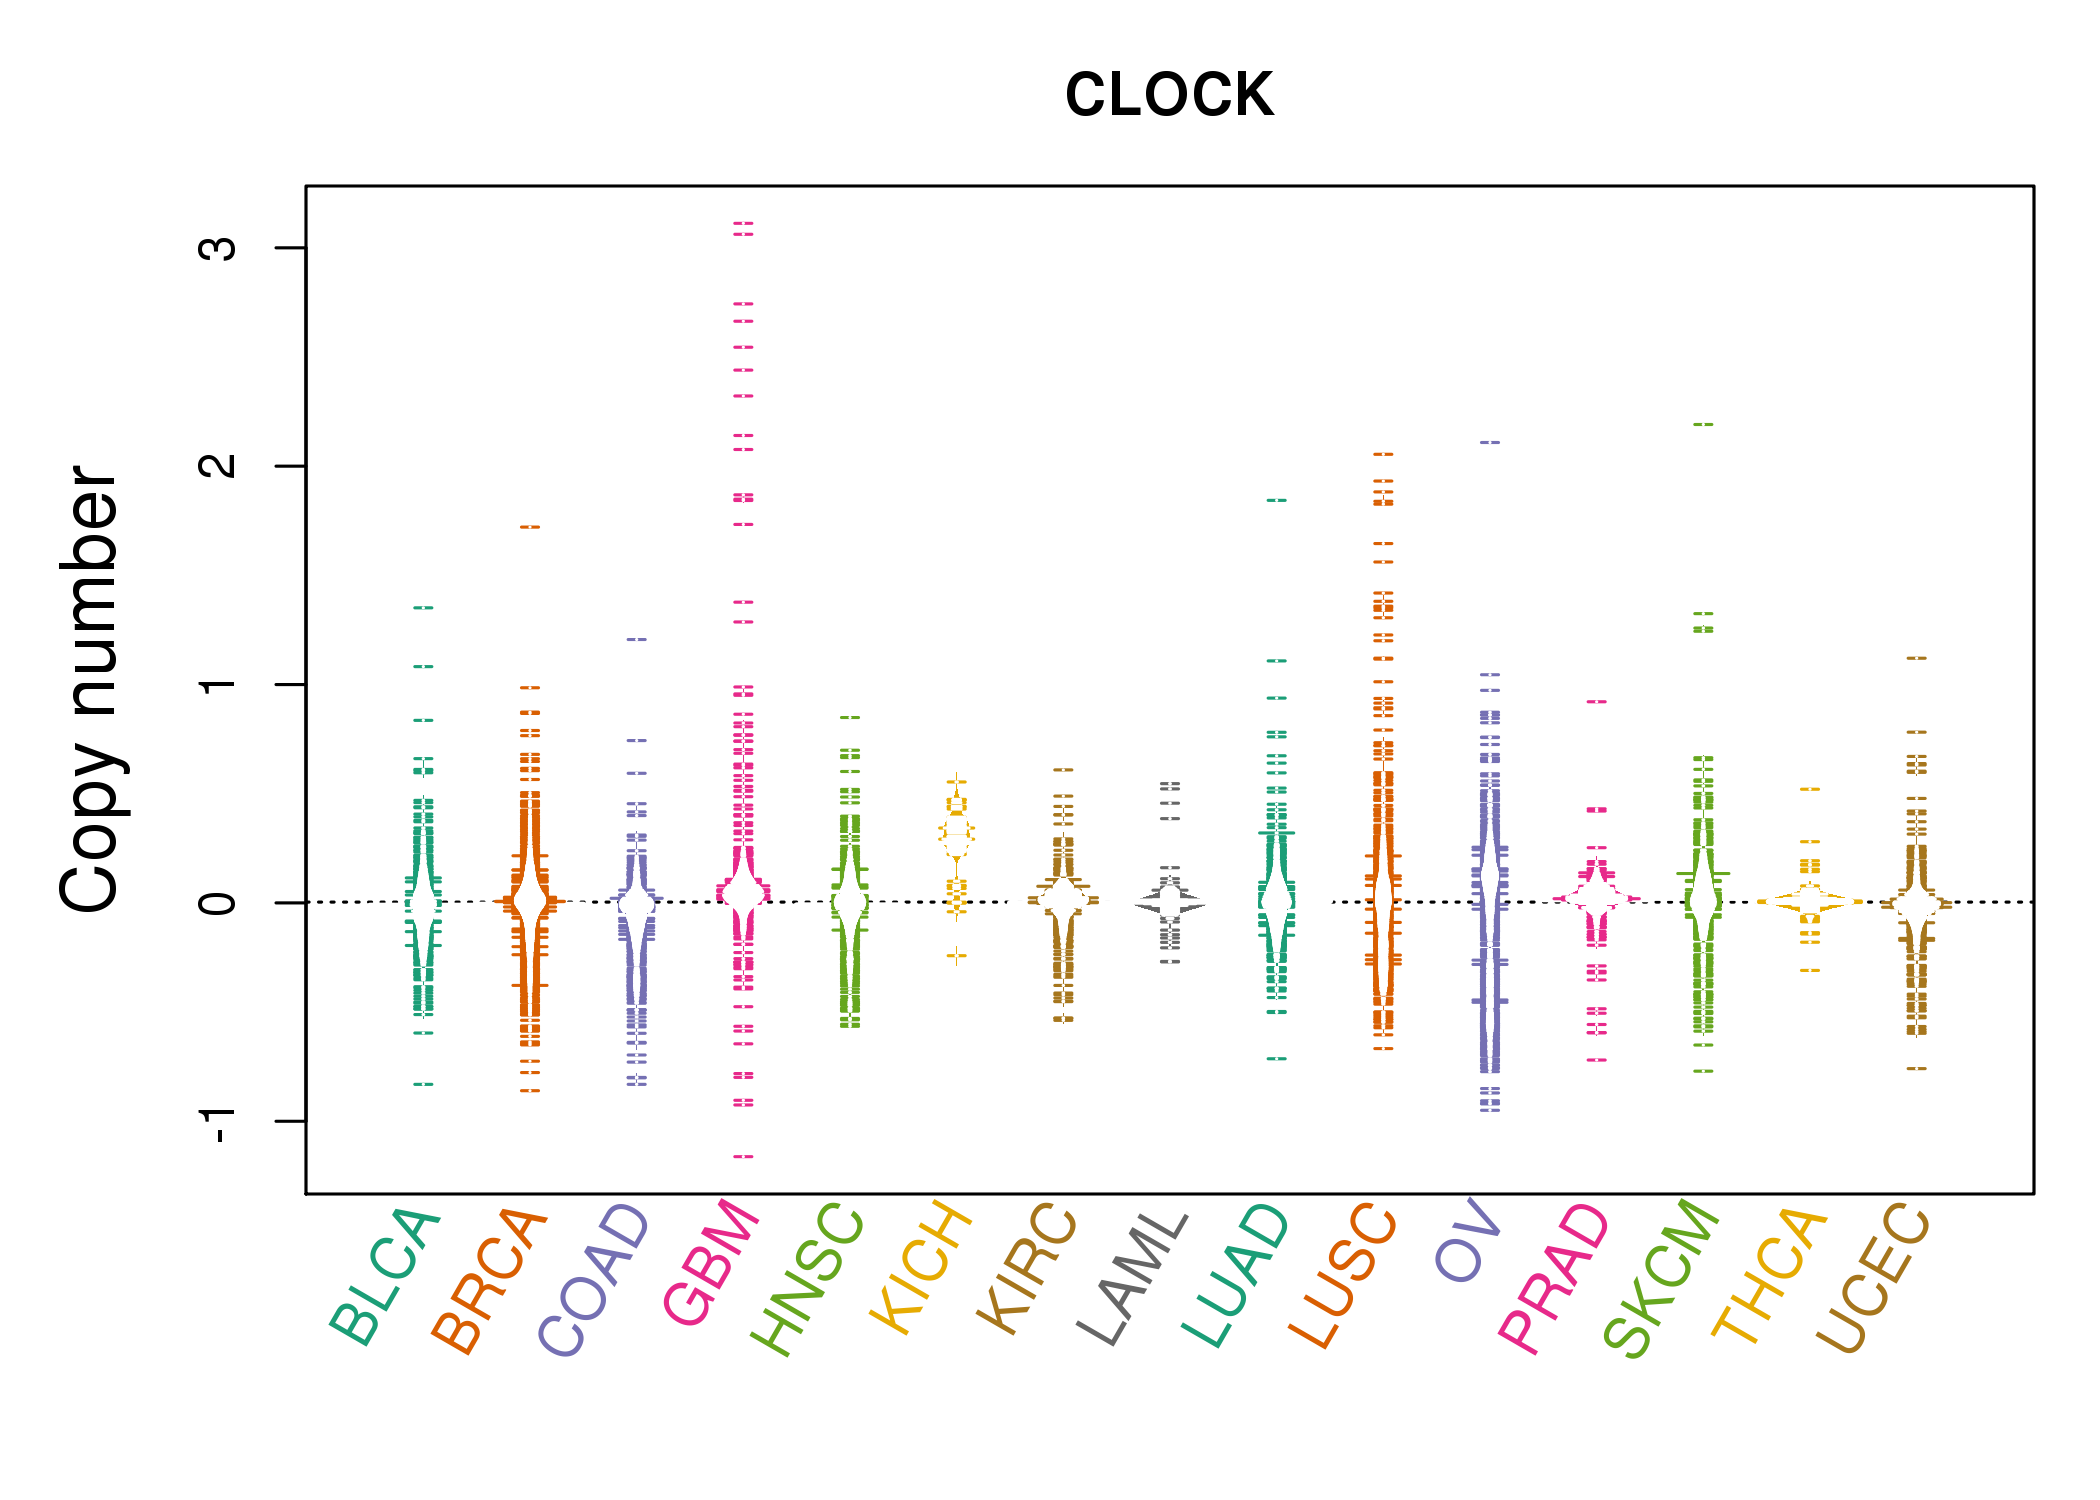 |
| cf) Tissue ID[Tissue type]: BLCA[Bladder Urothelial Carcinoma], BRCA[Breast invasive carcinoma], CESC[Cervical squamous cell carcinoma and endocervical adenocarcinoma], COAD[Colon adenocarcinoma], GBM[Glioblastoma multiforme], Glioma Low Grade, HNSC[Head and Neck squamous cell carcinoma], KICH[Kidney Chromophobe], KIRC[Kidney renal clear cell carcinoma], KIRP[Kidney renal papillary cell carcinoma], LAML[Acute Myeloid Leukemia], LUAD[Lung adenocarcinoma], LUSC[Lung squamous cell carcinoma], OV[Ovarian serous cystadenocarcinoma ], PAAD[Pancreatic adenocarcinoma], PRAD[Prostate adenocarcinoma], SKCM[Skin Cutaneous Melanoma], STAD[Stomach adenocarcinoma], THCA[Thyroid carcinoma], UCEC[Uterine Corpus Endometrial Carcinoma] |
| Top |
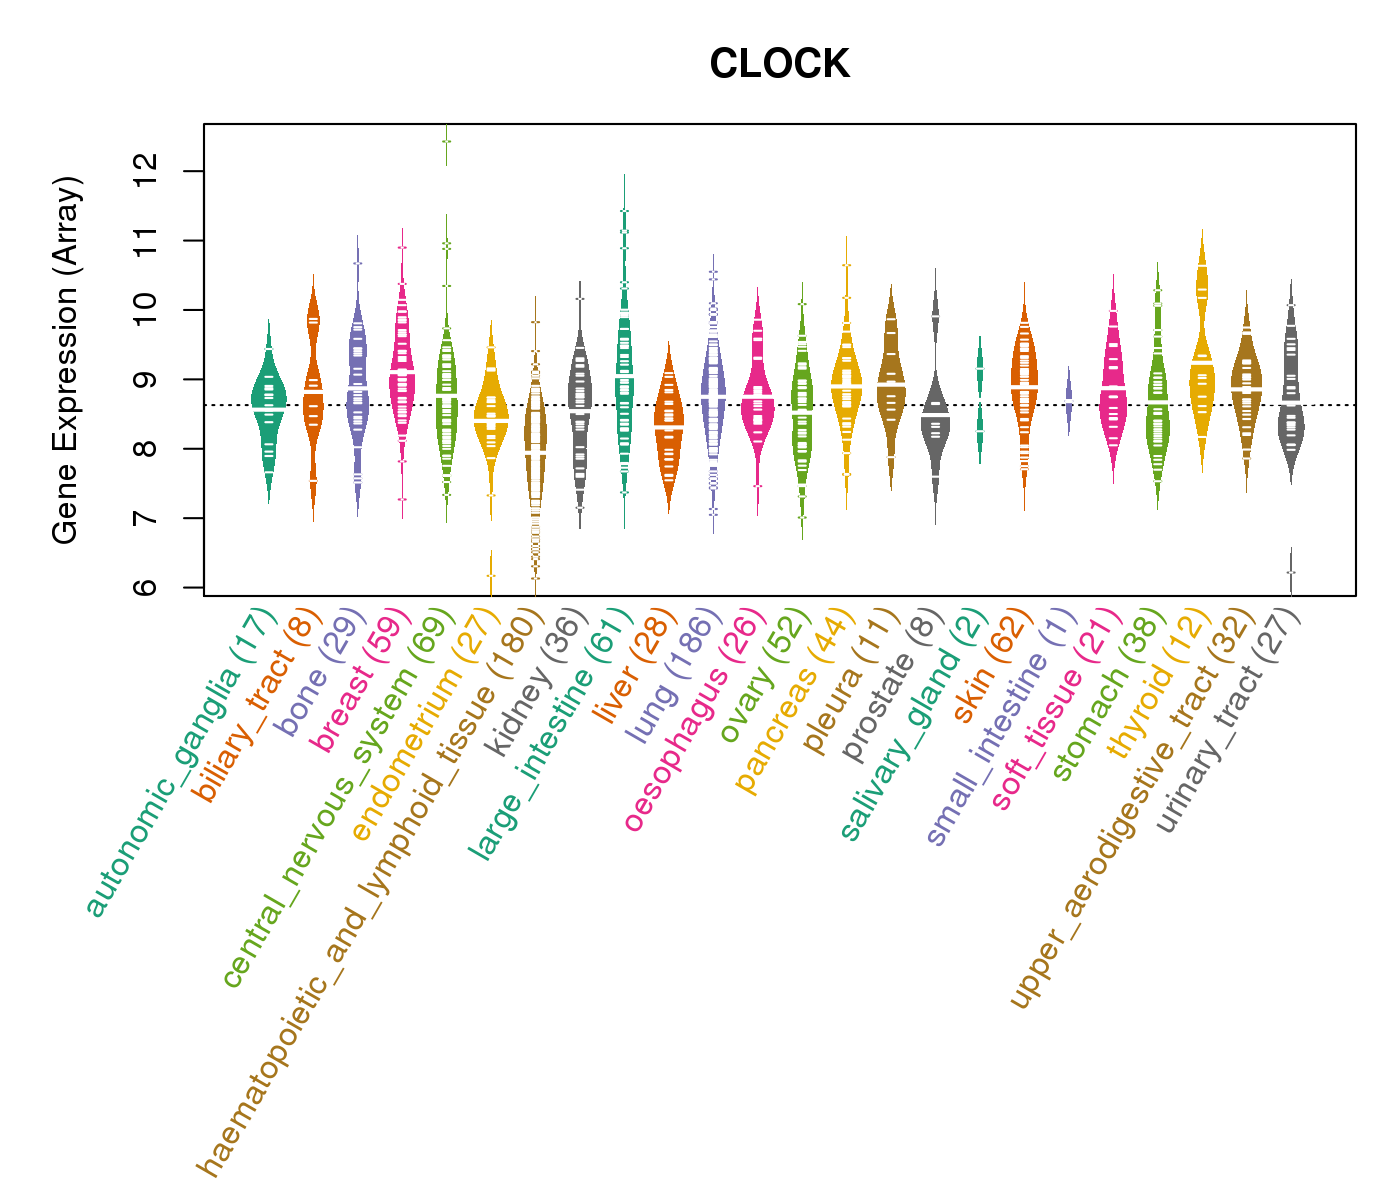
| Gene Expression for CLOCK |
| * CCLE gene expression data were extracted from CCLE_Expression_Entrez_2012-10-18.res: Gene-centric RMA-normalized mRNA expression data. |
 |
| * Normalized gene expression data of RNASeqV2 was extracted from TCGA using R package TCGA-Assembler. The URLs of all public data files on TCGA DCC data server were gathered at Jan-05-2015. Only eight cancer types have enough normal control samples for differential expression analysis. (t test, adjusted p<0.05 (using Benjamini-Hochberg FDR)) |
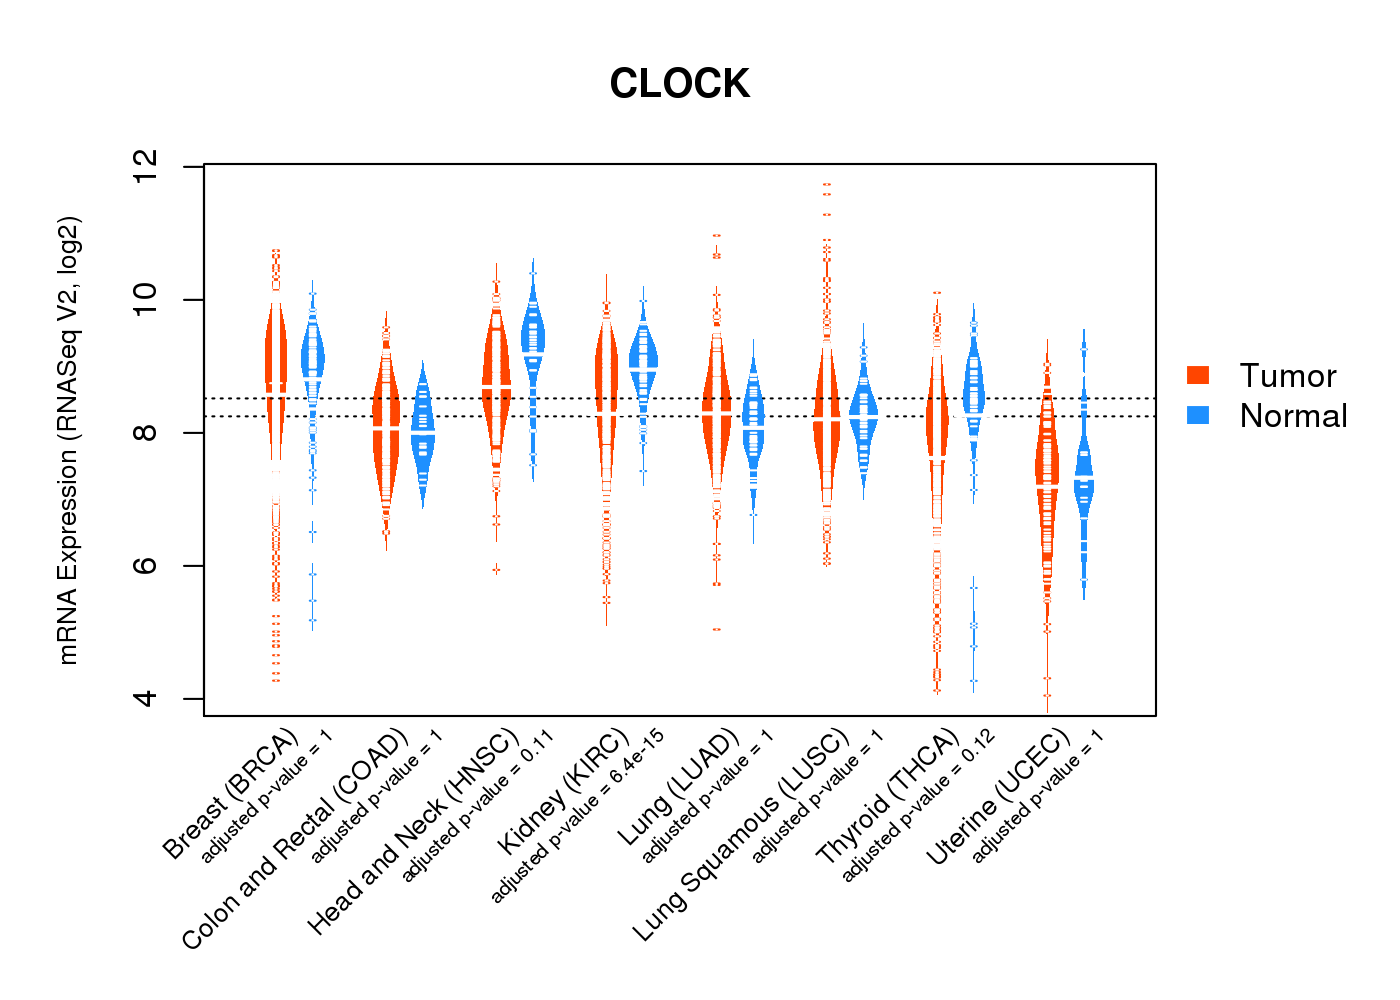 |
| Top |
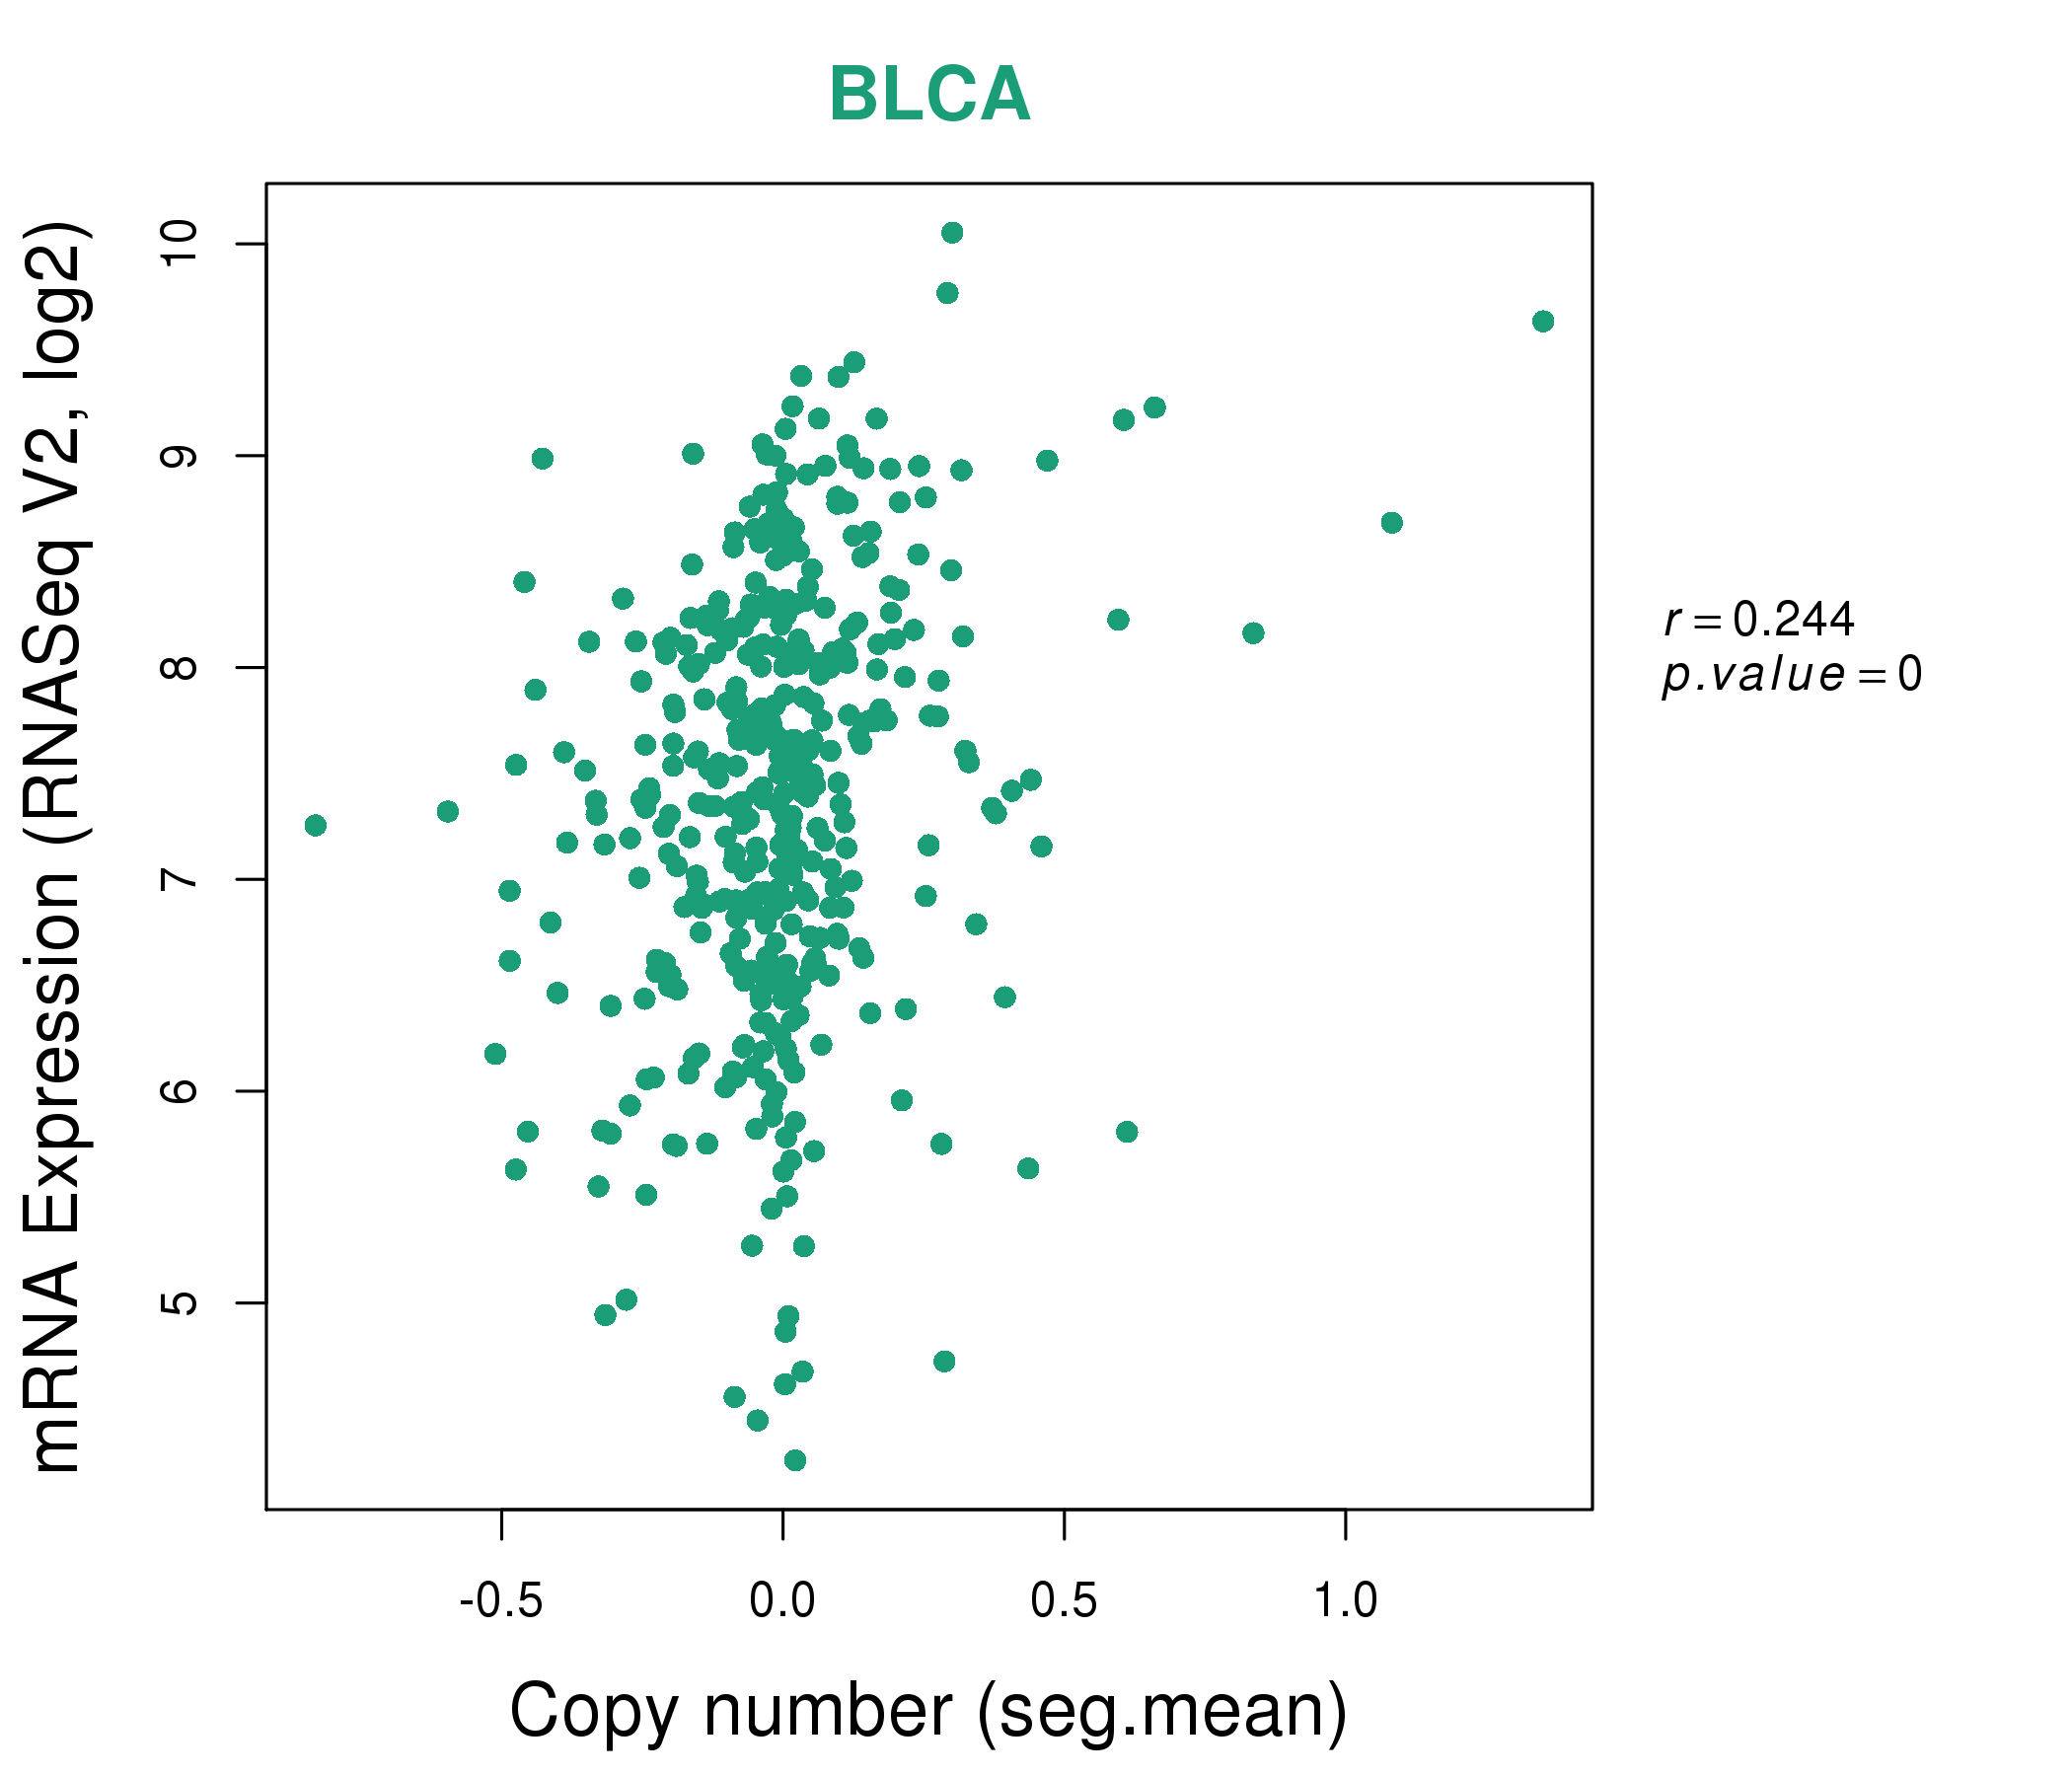
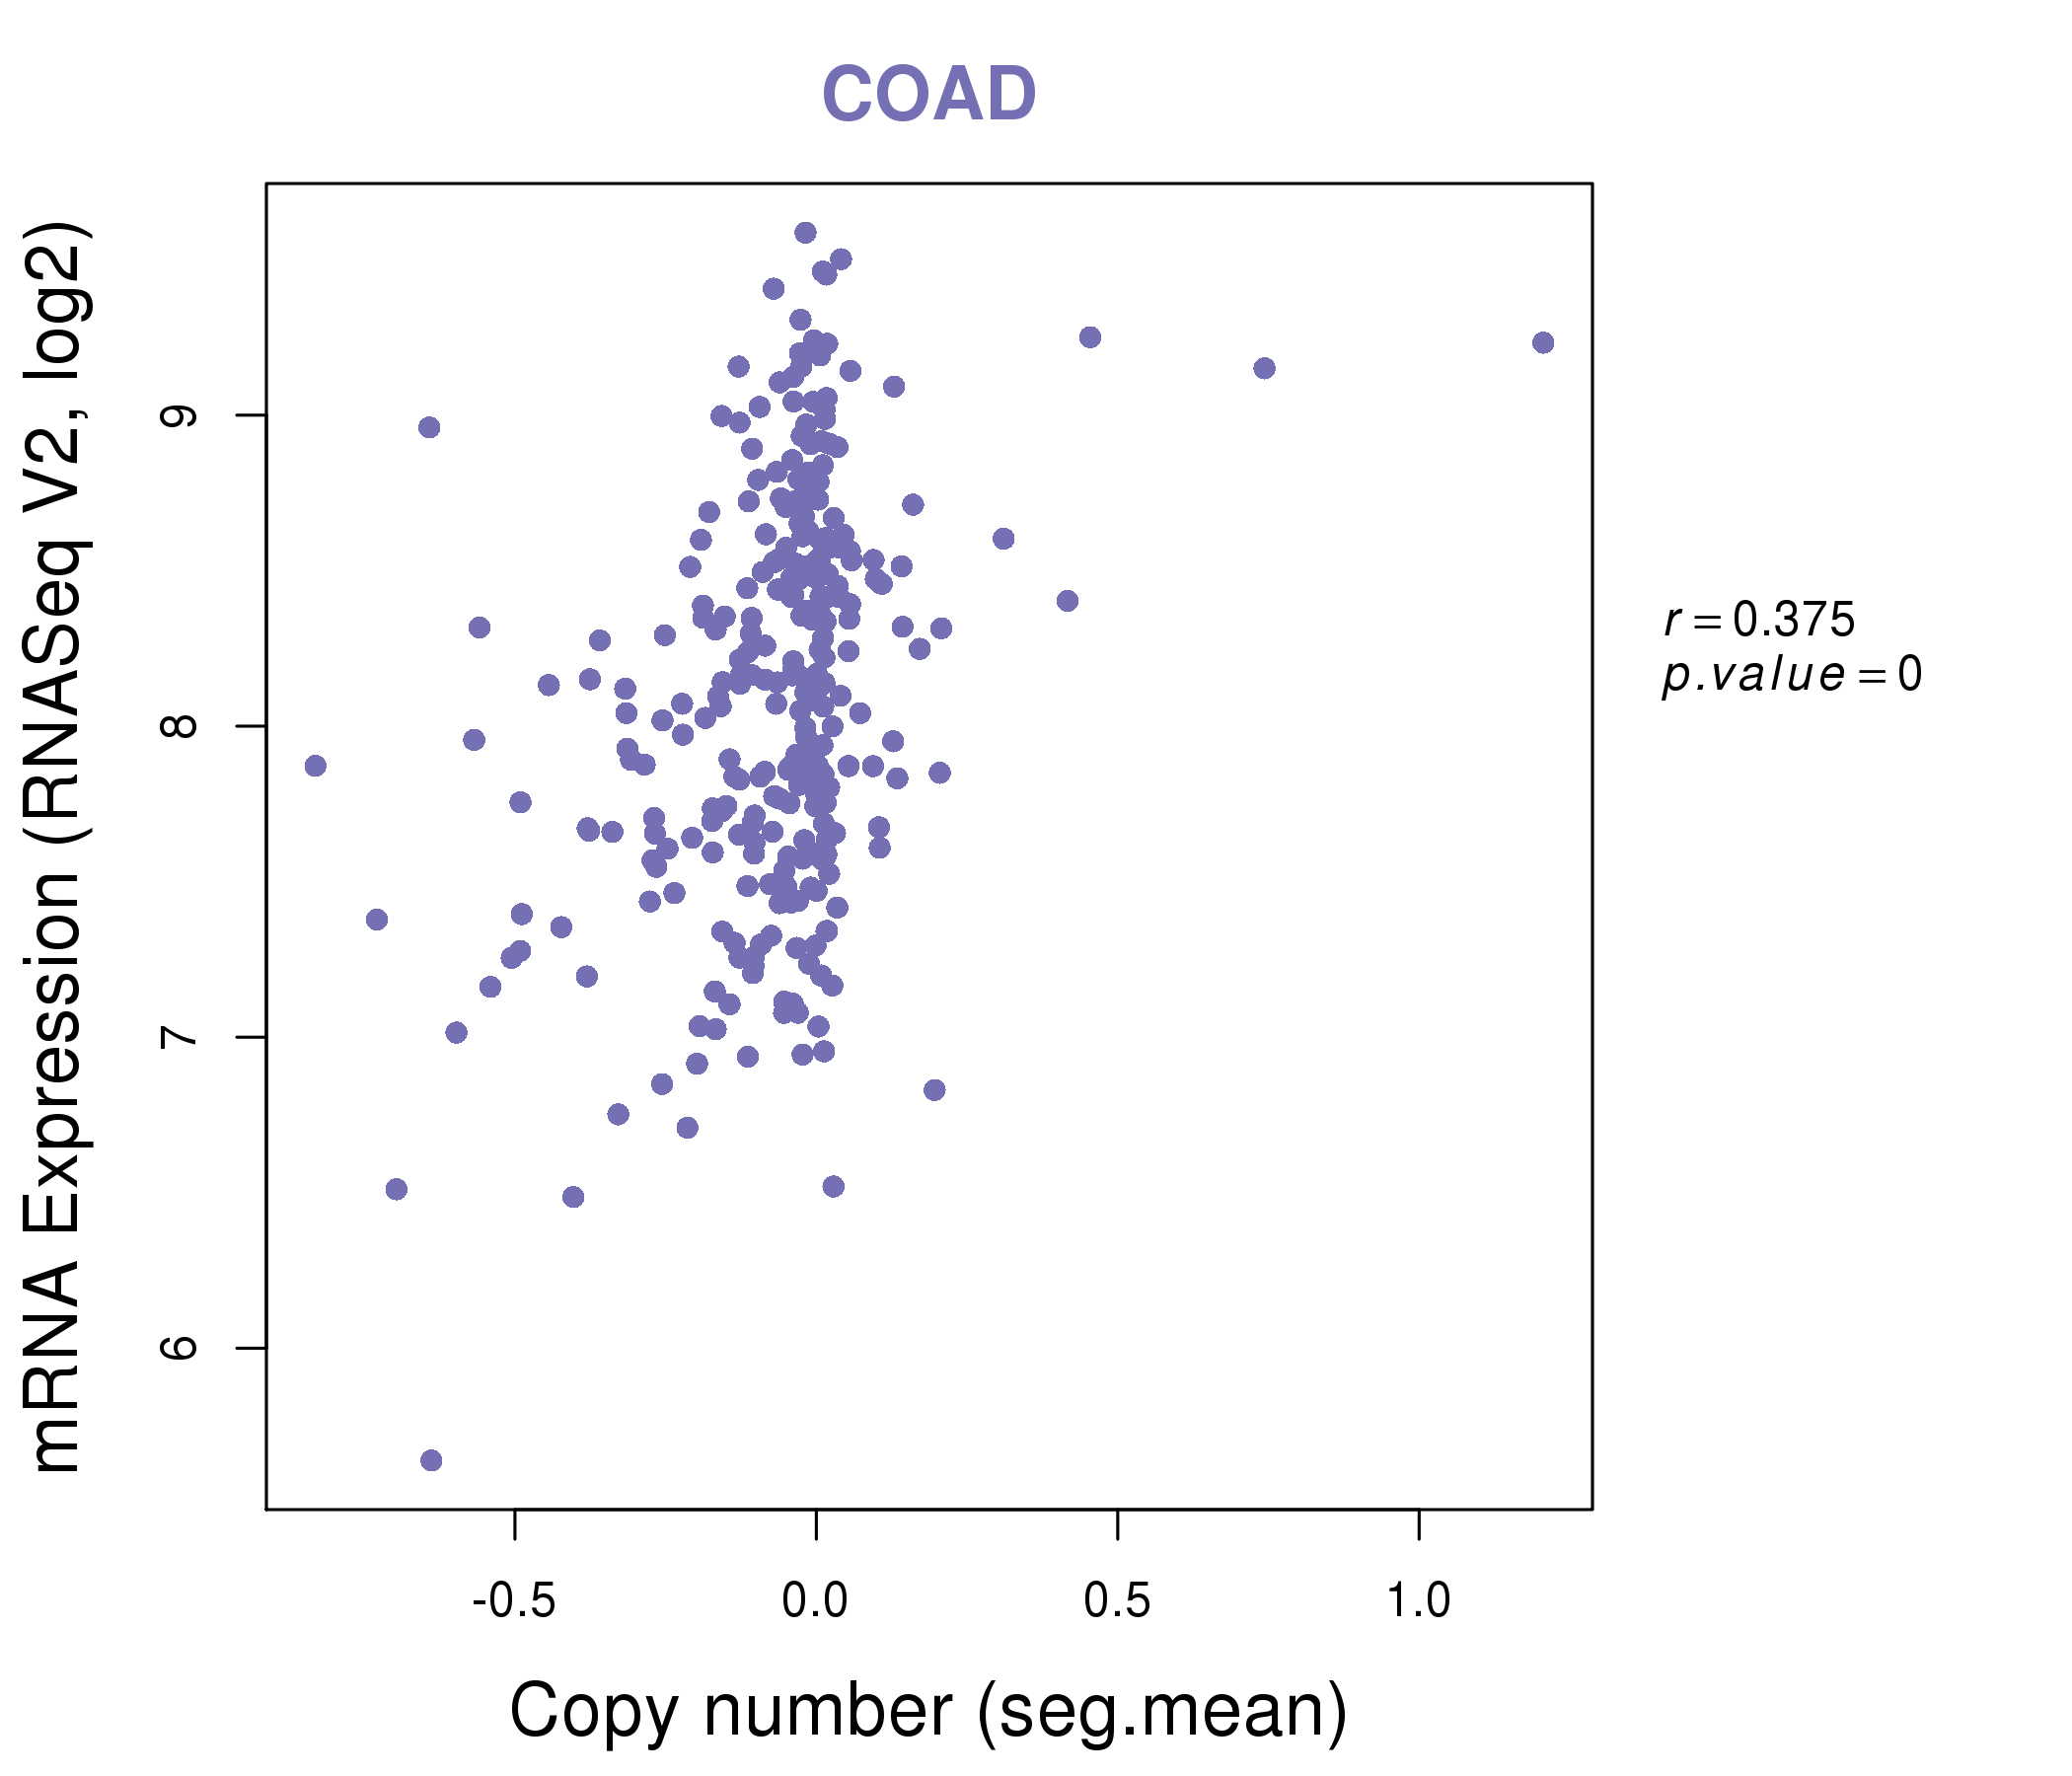
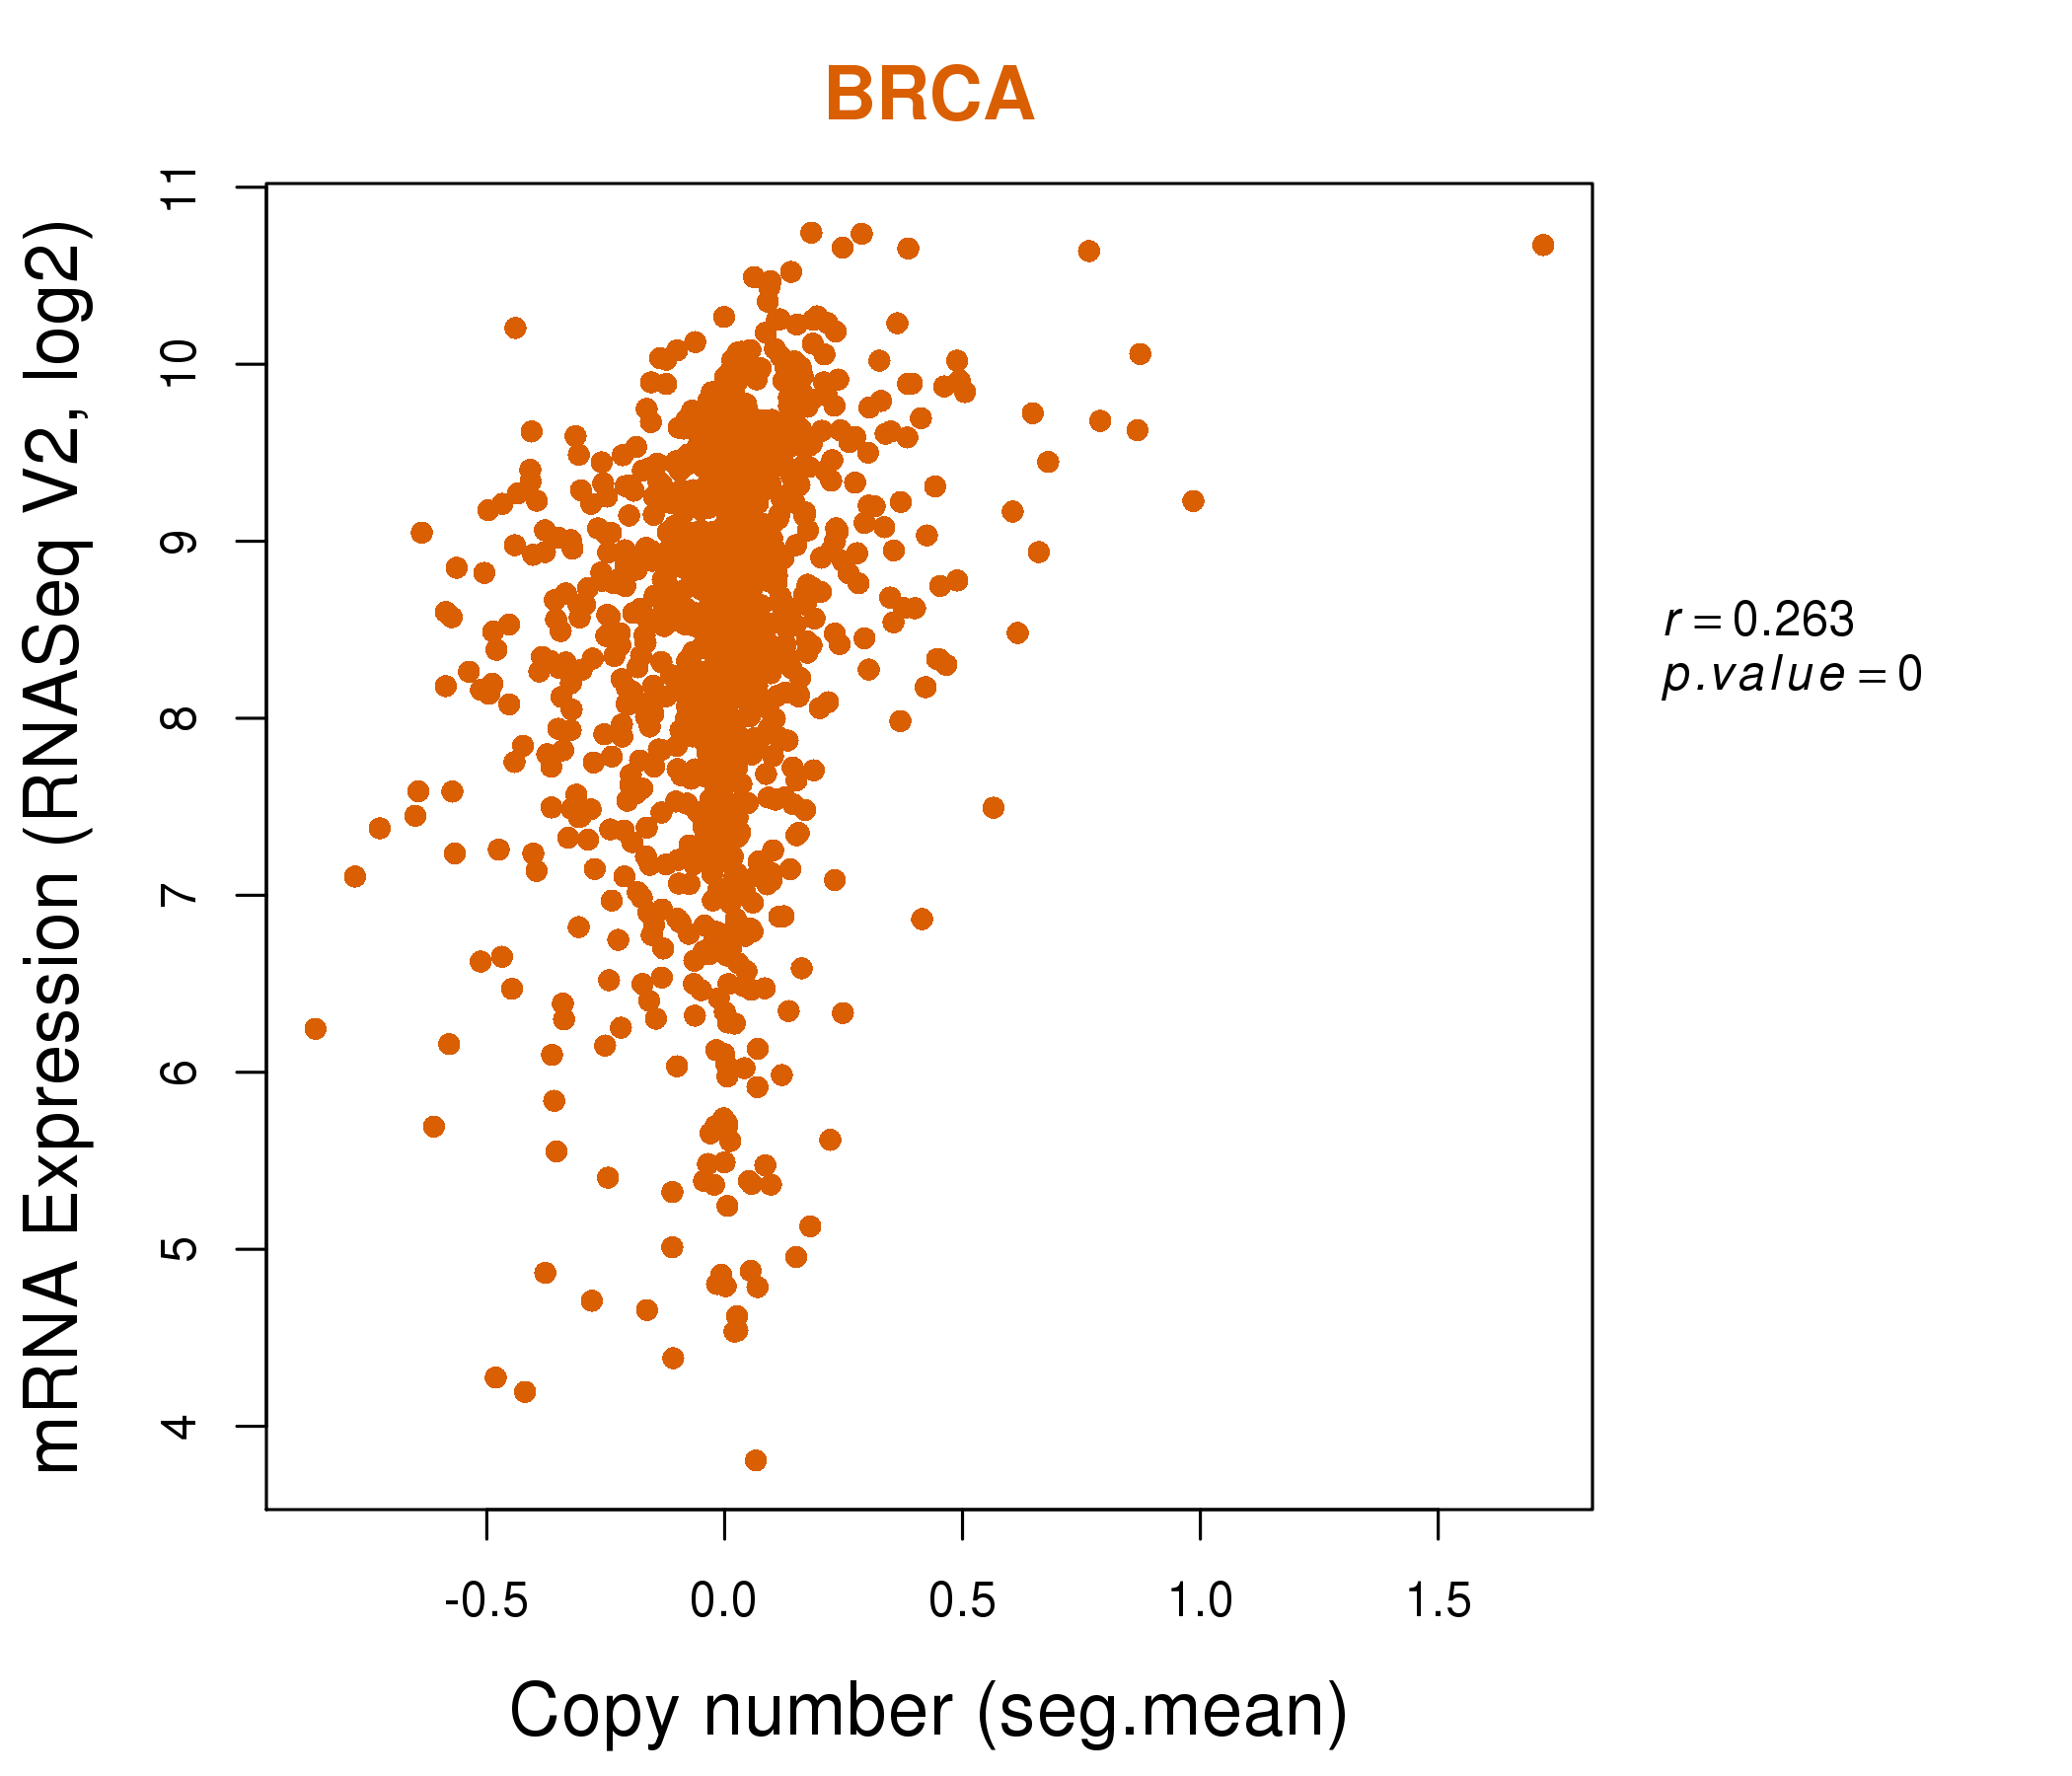
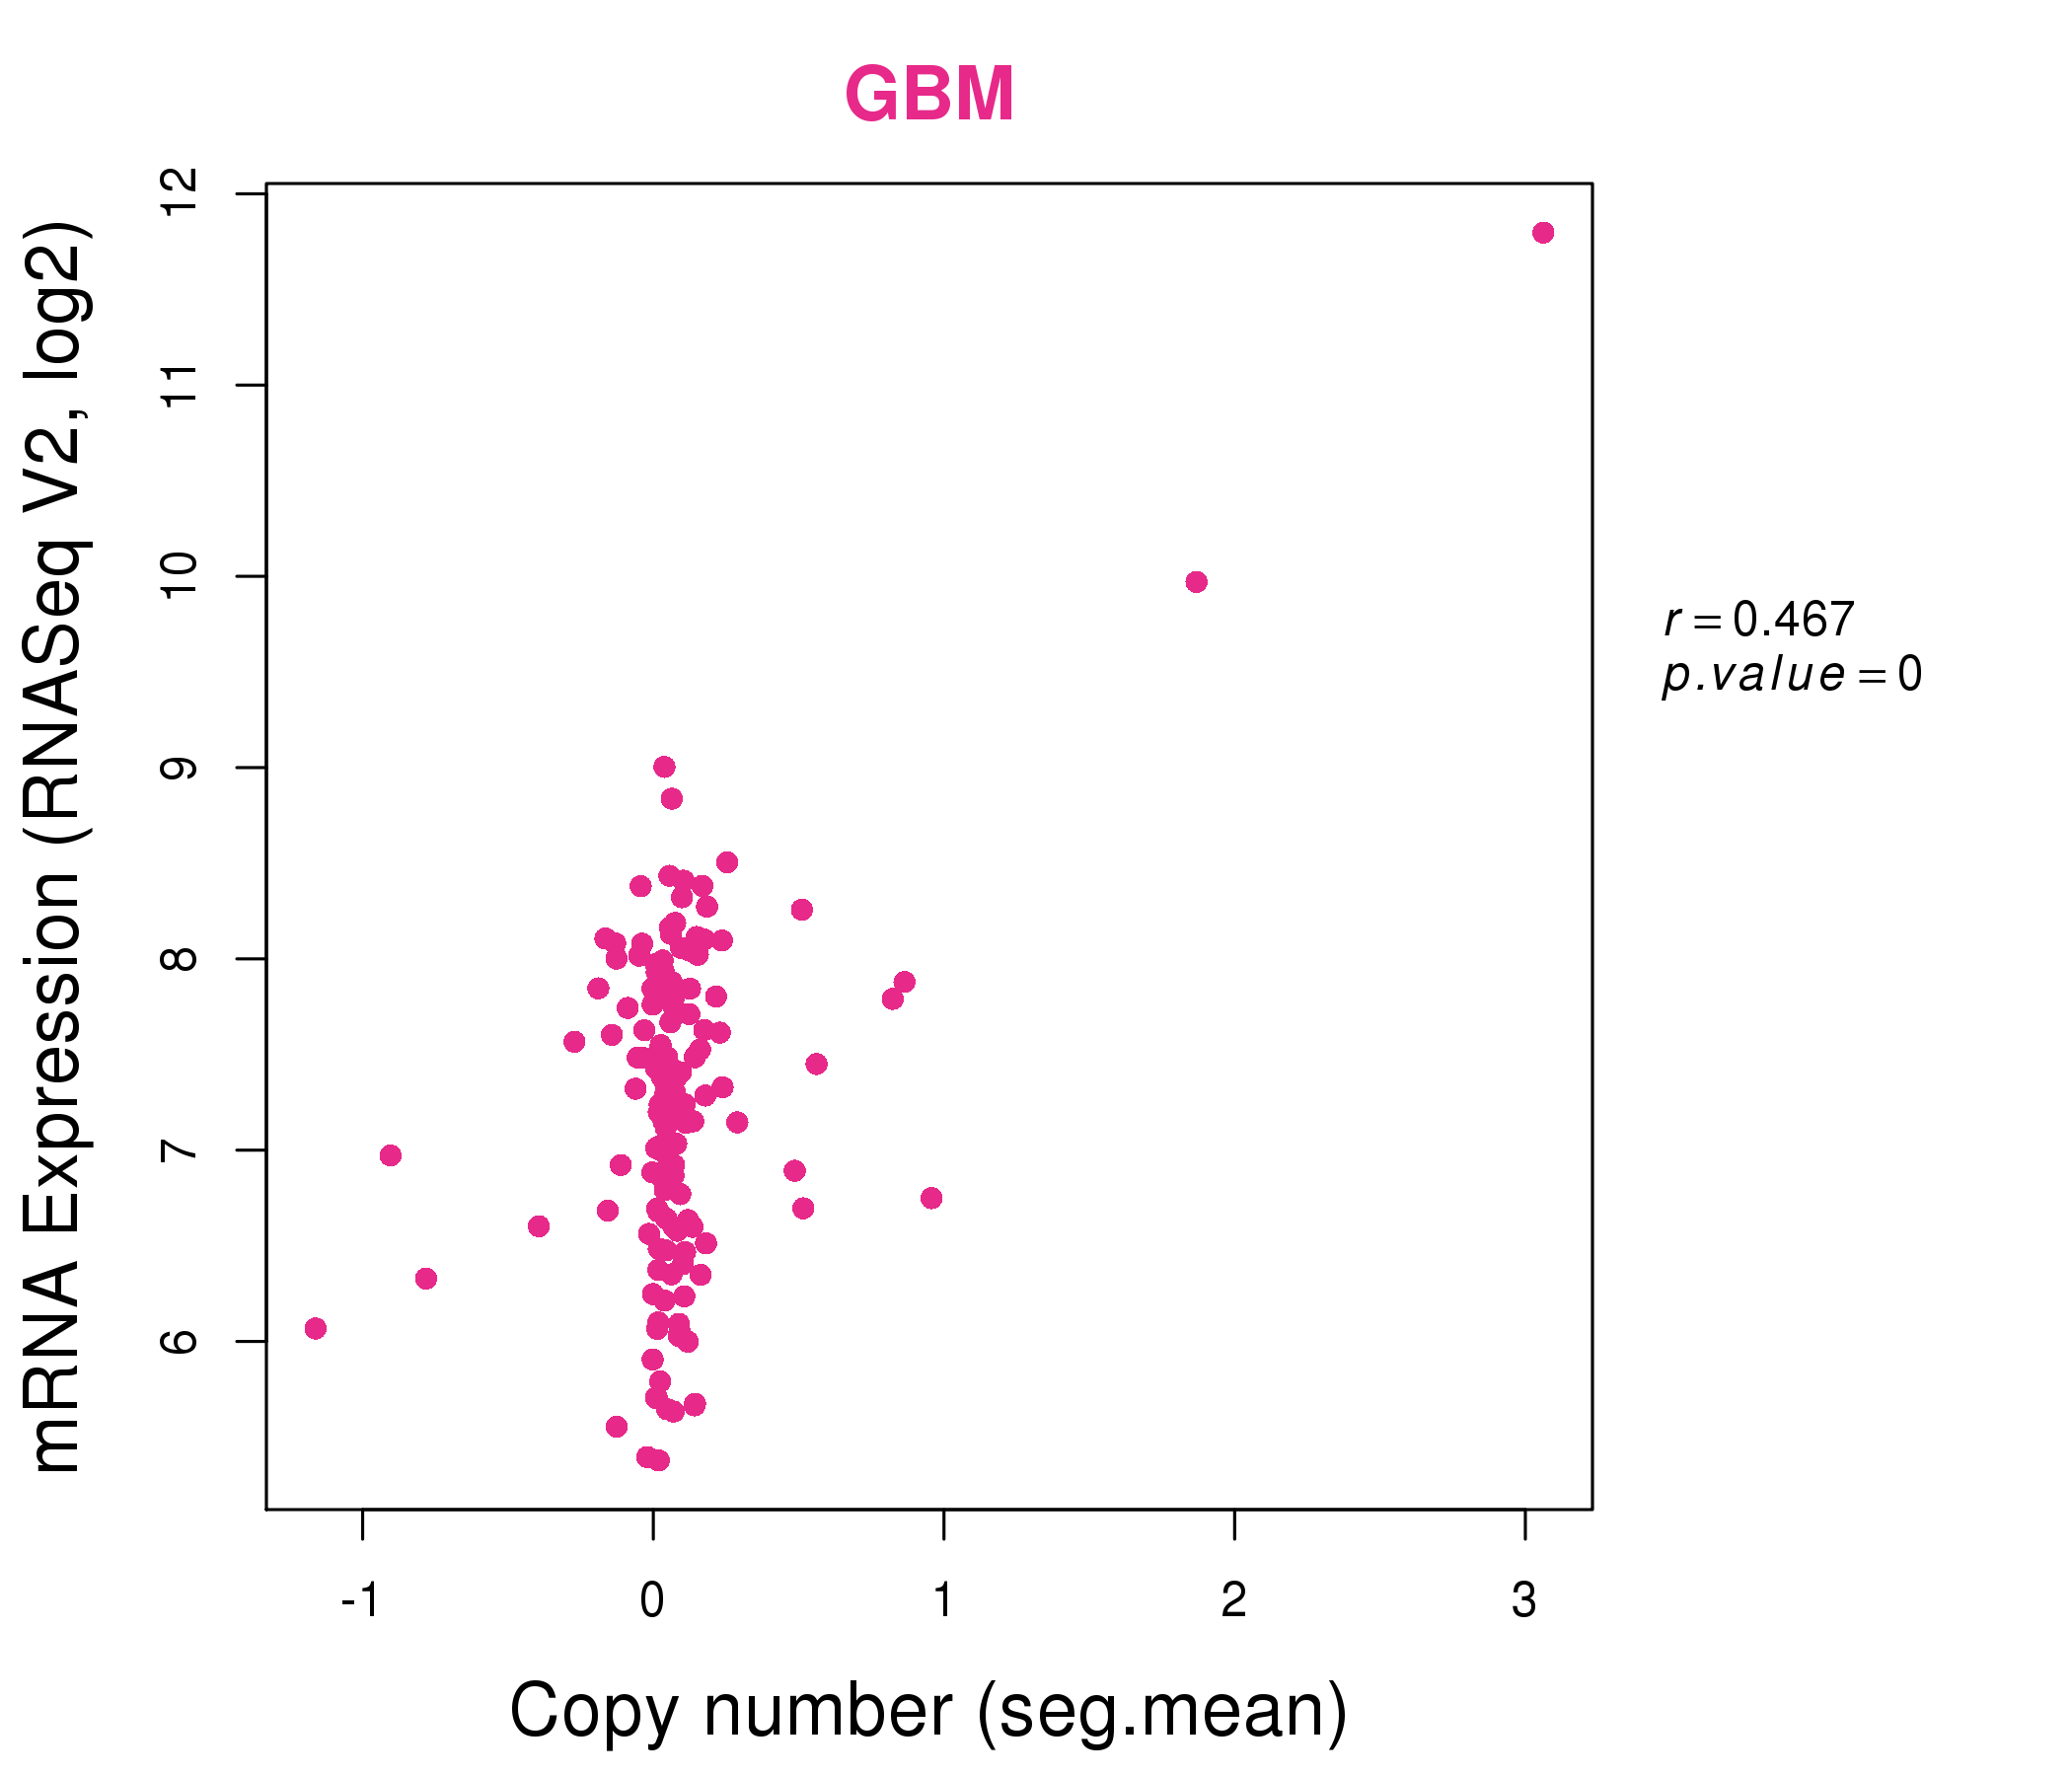
| * This plots show the correlation between CNV and gene expression. |
: Open all plots for all cancer types
 |
|
 |
|
| Top |
| Gene-Gene Network Information |
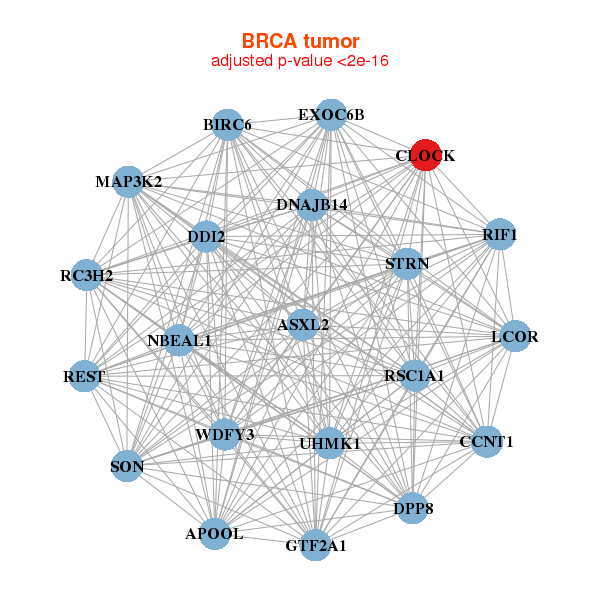
| * Co-Expression network figures were drawn using R package igraph. Only the top 20 genes with the highest correlations were shown. Red circle: input gene, orange circle: cell metabolism gene, sky circle: other gene |
: Open all plots for all cancer types
 |
|
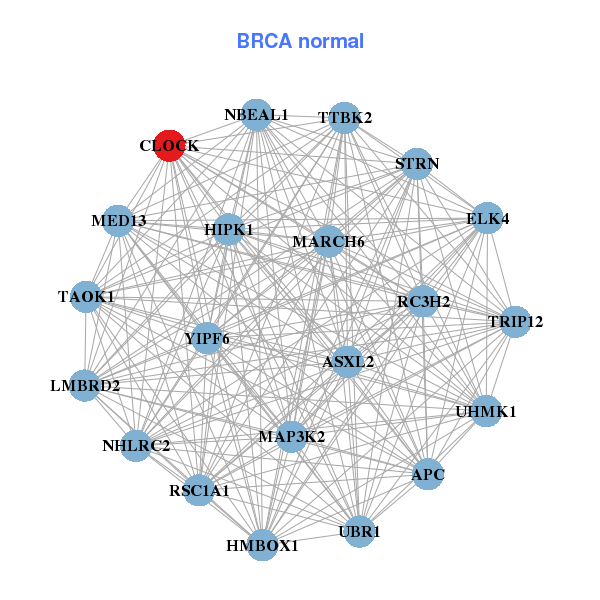
| APOOL,ASXL2,BIRC6,CCNT1,CLOCK,DDI2,DNAJB14, DPP8,EXOC6B,GTF2A1,LCOR,MAP3K2,NBEAL1,RC3H2, REST,RIF1,RSC1A1,SON,STRN,UHMK1,WDFY3 | APC,ASXL2,CLOCK,ELK4,HIPK1,HMBOX1,LMBRD2, MAP3K2,MARCH6,MED13,NBEAL1,NHLRC2,RC3H2,RSC1A1, STRN,TAOK1,TRIP12,TTBK2,UBR1,UHMK1,YIPF6 |
 |
|
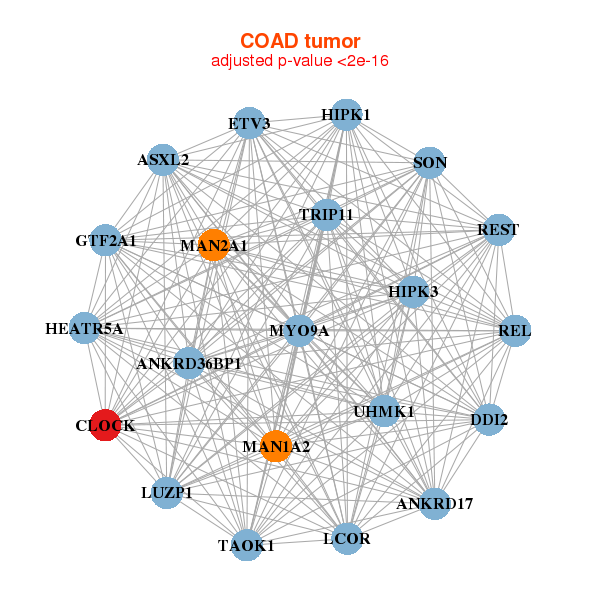
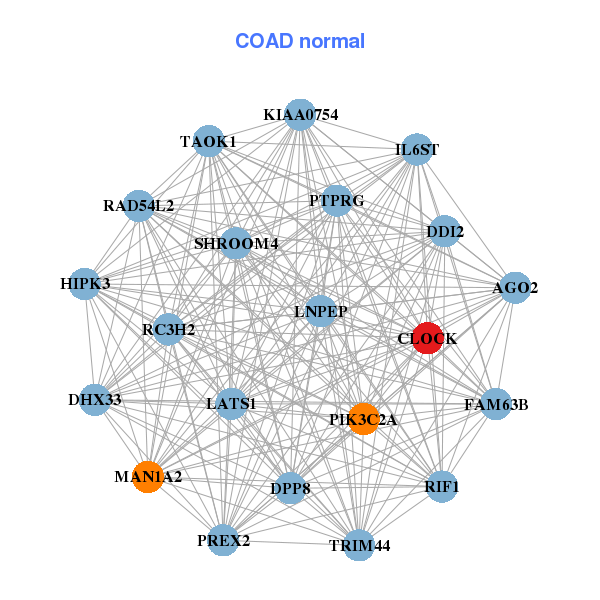
| ANKRD17,ANKRD36BP1,ASXL2,CLOCK,DDI2,ETV3,GTF2A1, HEATR5A,HIPK1,HIPK3,LCOR,LUZP1,MAN1A2,MAN2A1, MYO9A,REL,REST,SON,TAOK1,TRIP11,UHMK1 | CLOCK,DDI2,DHX33,DPP8,AGO2,FAM63B,HIPK3, IL6ST,KIAA0754,LATS1,LNPEP,MAN1A2,PIK3C2A,PREX2, PTPRG,RAD54L2,RC3H2,RIF1,SHROOM4,TAOK1,TRIM44 |
| * Co-Expression network figures were drawn using R package igraph. Only the top 20 genes with the highest correlations were shown. Red circle: input gene, orange circle: cell metabolism gene, sky circle: other gene |
: Open all plots for all cancer types
| Top |
: Open all interacting genes' information including KEGG pathway for all interacting genes from DAVID
| Top |
| Pharmacological Information for CLOCK |
| There's no related Drug. |
| Top |
| Cross referenced IDs for CLOCK |
| * We obtained these cross-references from Uniprot database. It covers 150 different DBs, 18 categories. http://www.uniprot.org/help/cross_references_section |
: Open all cross reference information
|
Copyright © 2016-Present - The Univsersity of Texas Health Science Center at Houston @ |