|
mutLBSgeneDB |
| |
| |
| |
| |
| |
| |
|

| Gene summary for FRS2 |
 Gene summary Gene summary |
| Basic gene Info. | Gene symbol | FRS2 |
| Gene name | fibroblast growth factor receptor substrate 2 | |
| Synonyms | FRS2A|FRS2alpha|SNT|SNT-1|SNT1 | |
| Cytomap | UCSC genome browser: 12q15 | |
| Type of gene | protein-coding | |
| RefGenes | NM_001042555.2, NM_001278351.1,NM_001278353.1,NM_001278354.1,NM_001278355.1, NM_001278356.1,NM_001278357.1,NM_006654.4, | |
| Description | FGFR signalling adaptorFGFR substrate 2FGFR-signaling adaptor SNTsuc1-associated neurotrophic factor target 1 | |
| Modification date | 20141207 | |
| dbXrefs | MIM : 607743 | |
| HGNC : HGNC | ||
| Ensembl : ENSG00000166225 | ||
| HPRD : 06372 | ||
| Vega : OTTHUMG00000169373 | ||
| Protein | UniProt: Q8WU20 go to UniProt's Cross Reference DB Table | |
| Expression | CleanEX: HS_FRS2 | |
| BioGPS: 10818 | ||
| Pathway | NCI Pathway Interaction Database: FRS2 | |
| KEGG: FRS2 | ||
| REACTOME: FRS2 | ||
| Pathway Commons: FRS2 | ||
| Context | iHOP: FRS2 | |
| ligand binding site mutation search in PubMed: FRS2 | ||
| UCL Cancer Institute: FRS2 | ||
| Assigned class in mutLBSgeneDB | C: This gene just belongs to mutLBSgenes. | |
| Gene ontology having evidence of Inferred from Direct Assay (IDA) from Entrez |
| GO ID | GO Term | PubMed ID |
| Top |
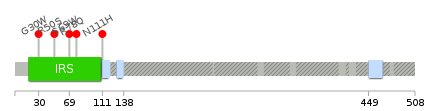
| Ligand binding site mutations for FRS2 |
| Lollipop-style diagram of mutations at LBS in amino-acid sequence. We represented ligand binding site mutations only. (You can see big image via clicking.) |
 |
| Cancer type specific mutLBS sorted by frequency |
| LBS | AAchange of nsSNV | Cancer type | # samples | R78 | R78Q | BLCA | 1 | S69 | S69W | BLCA | 1 | G30 | G30W | LUAD | 1 | R50 | R50S | SKCM | 1 | N111 | N111H | UCEC | 1 |
| cf) Cancer type abbreviation. BLCA: Bladder urothelial carcinoma, BRCA: Breast invasive carcinoma, CESC: Cervical squamous cell carcinoma and endocervical adenocarcinoma, COAD: Colon adenocarcinoma, GBM: Glioblastoma multiforme, LGG: Brain lower grade glioma, HNSC: Head and neck squamous cell carcinoma, KICH: Kidney chromophobe, KIRC: Kidney renal clear cell carcinoma, KIRP: Kidney renal papillary cell carcinoma, LAML: Acute myeloid leukemia, LUAD: Lung adenocarcinoma, LUSC: Lung squamous cell carcinoma, OV: Ovarian serous cystadenocarcinoma, PAAD: Pancreatic adenocarcinoma, PRAD: Prostate adenocarcinoma, SKCM: Skin cutaneous melanoma, STAD: Stomach adenocarcinoma, THCA: Thyroid carcinoma, UCEC: Uterine corpus endometrial carcinoma. |
| Top |
| Protein structure related information for FRS2 |
| Relative protein structure stability change (ΔΔE) using Mupro 1.1 Mupro score denotes assessment of the effect of mutations on thermodynamic stability. (ΔΔE<0: mutation decreases stability, ΔΔE>0: mutation increases stability) |
 : nsSNV at non-LBS : nsSNV at non-LBS : nsSNV at LBS : nsSNV at LBS |
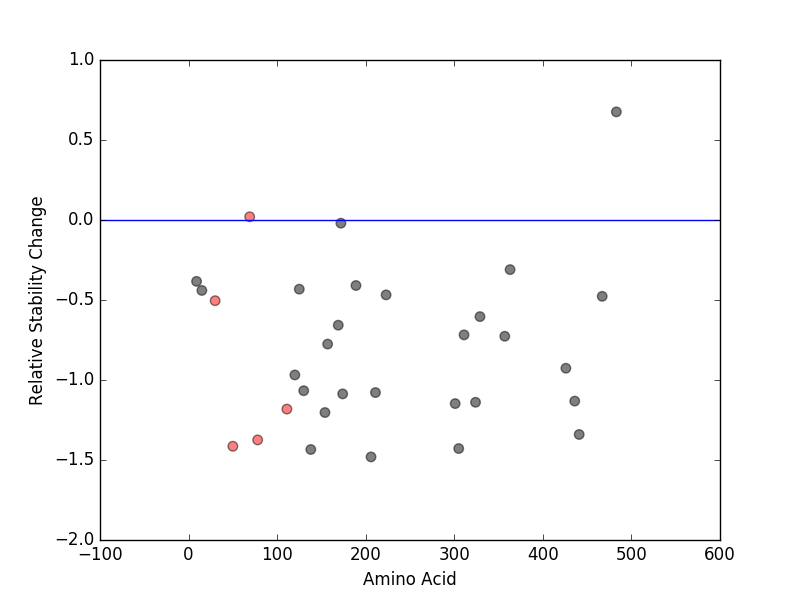 |
| nsSNVs sorted by the relative stability change of protein structure by each mutation Blue: mutations of positive stability change. and red : the most recurrent mutation for this gene. |
| LBS | AAchange of nsSNV | Relative stability change | S69 | S69W | 0.020124683 | R50 | R50S | -1.4141268 | R78 | R78Q | -1.3744309 | N111 | N111H | -1.1817733 | G30 | G30W | -0.50432722 |
| (MuPro1.1: Jianlin Cheng et al., Prediction of Protein Stability Changes for Single-Site Mutations Using Support Vector Machines, PROTEINS: Structure, Function, and Bioinformatics. 2006, 62:1125-1132) |
| Structure image for FRS2 from PDB |
| Top |
| Differential gene expression and gene-gene network for FRS2 |
| Differential gene expression between mutated and non-mutated LBS samples in all 16 major cancer types |
| Differential co-expressed gene network based on protein-protein interaction data (CePIN) |
| Top |
| Top |
| Phenotype information for FRS2 |
| Gene level disease information (DisGeNet) |
| Disease ID | Disease name | # PubMed | Association type |
| Mutation level pathogenic information (ClinVar annotation) |
| Allele ID | AA change | Clinical significance | Origin | Phenotype IDs |
| Top |
| Pharmacological information for FRS2 |
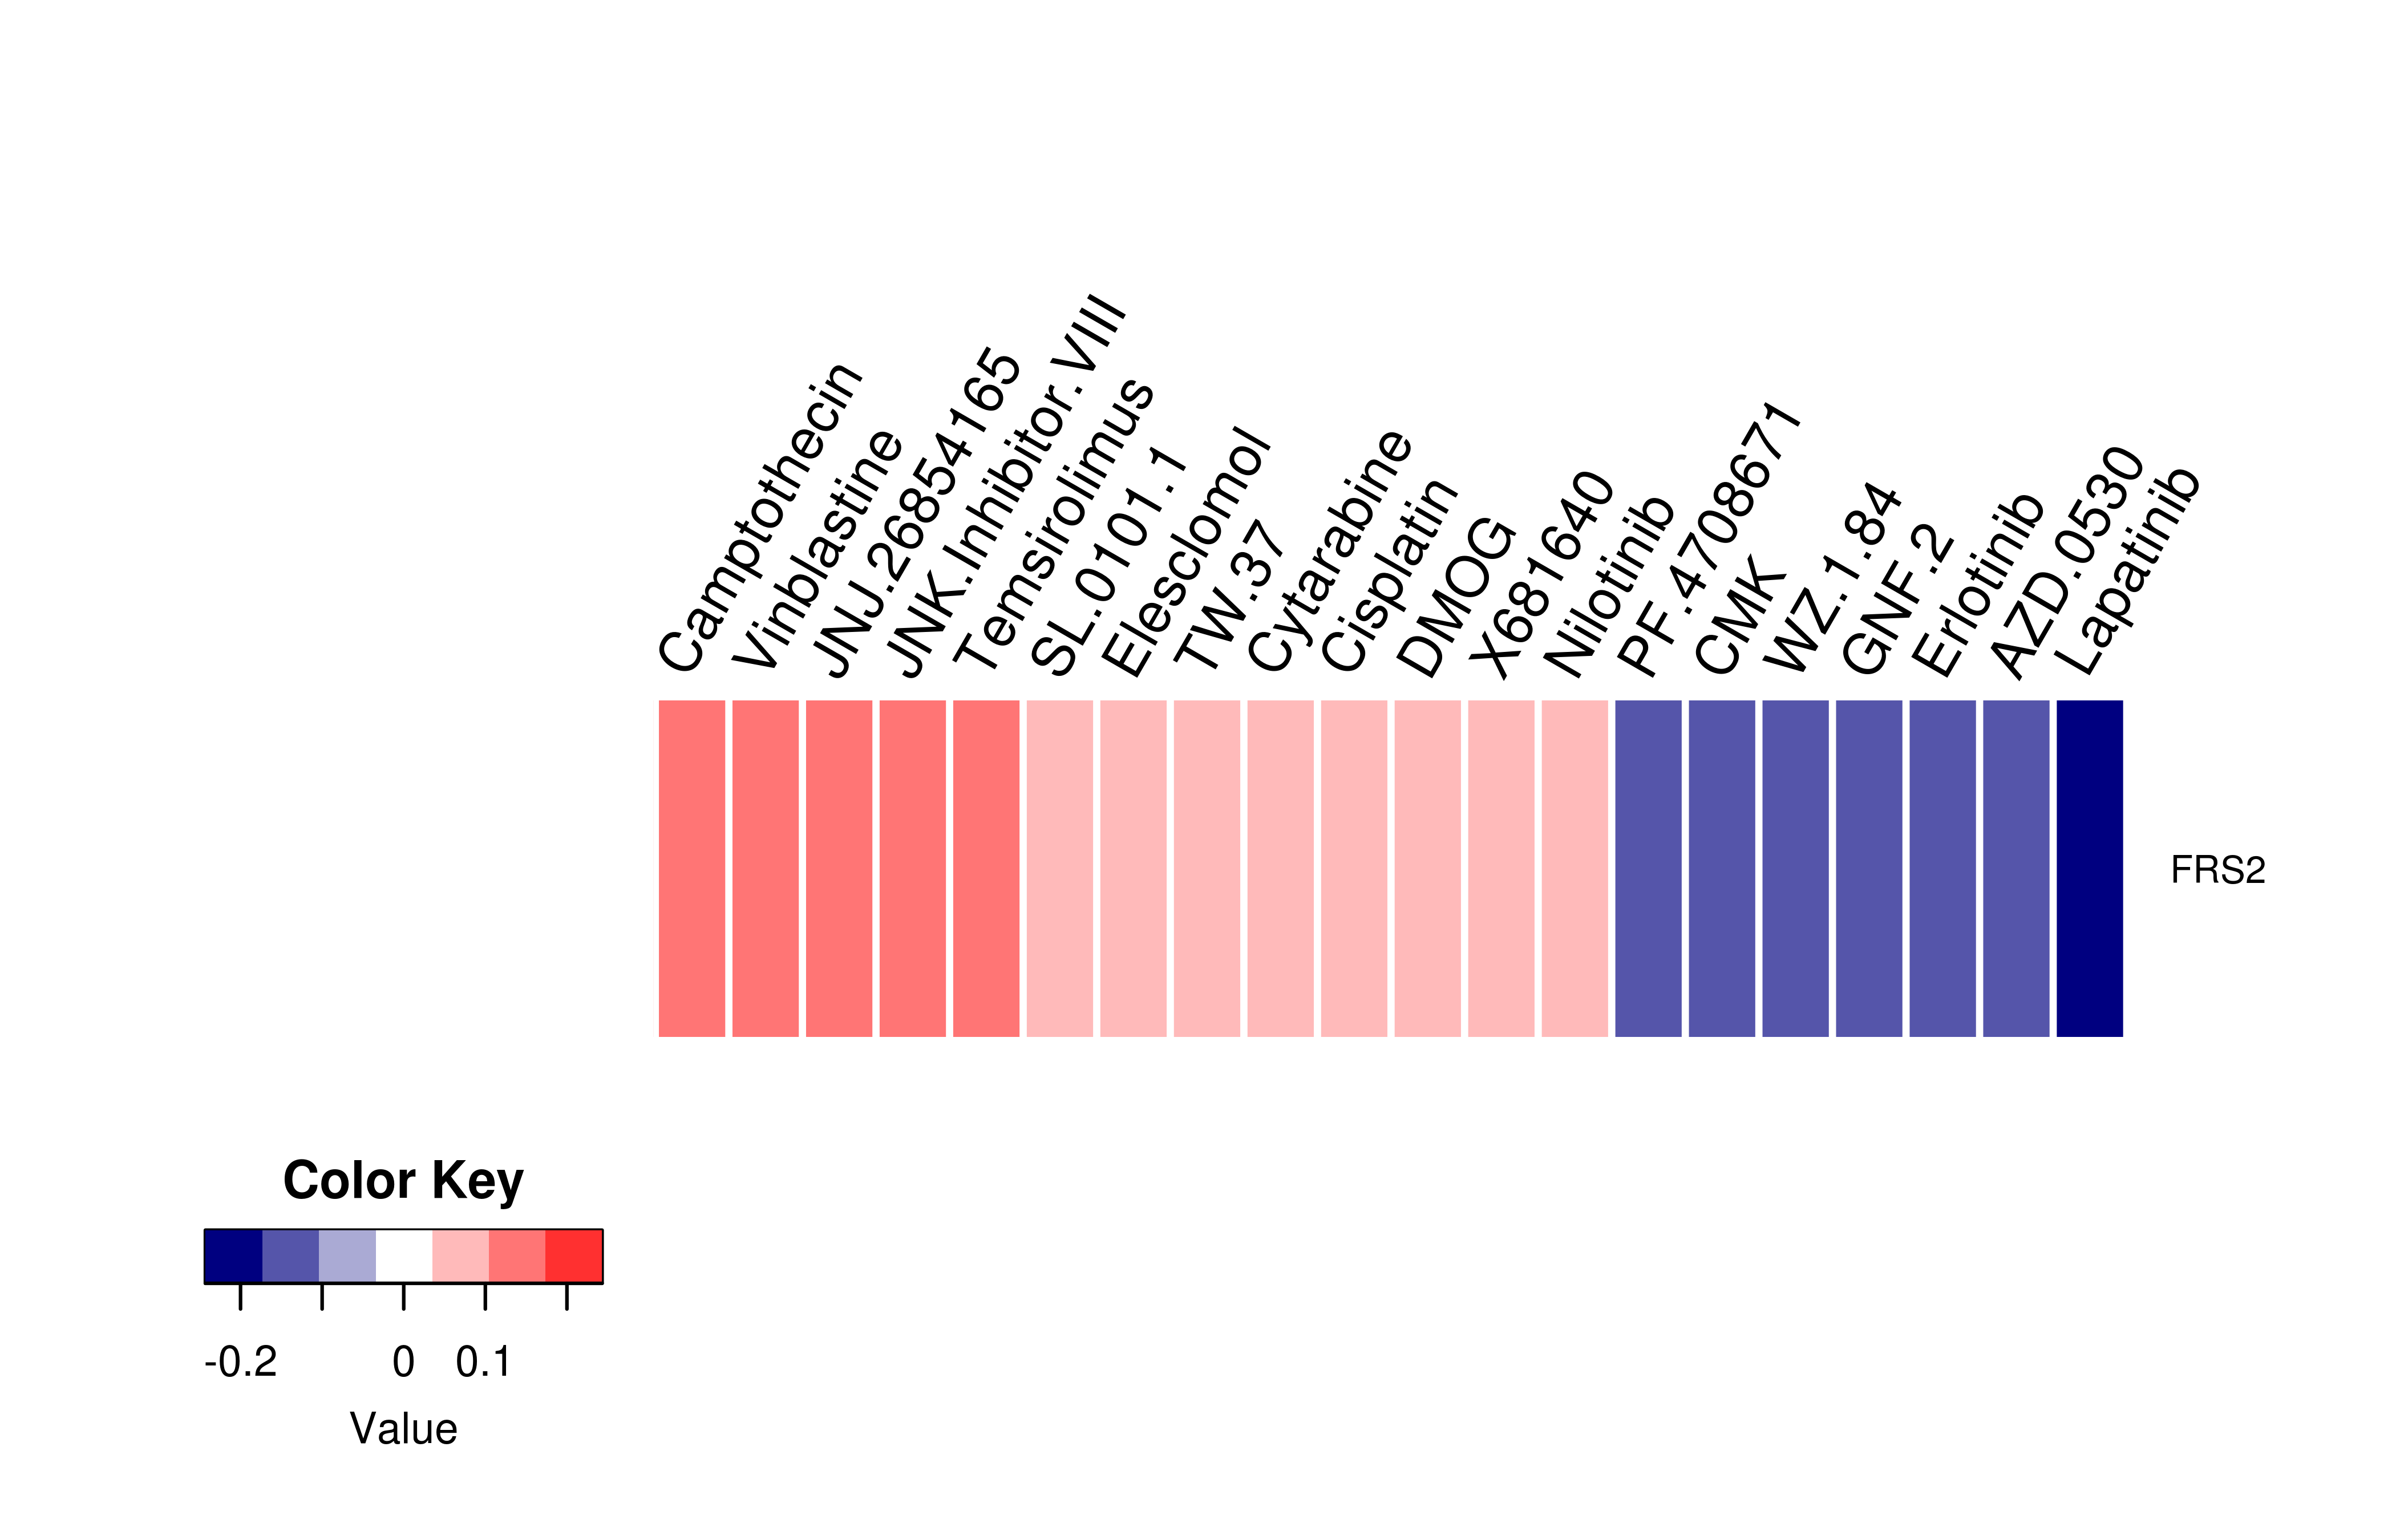
| Gene expression profile of anticancer drug treated cell-lines (CCLE) Heatmap showing the correlation between gene expression and drug response across all the cell-lines. We chose the top 20 among 138 drugs.We used Pearson's correlation coefficient. |
 |
| Drug information targeting mutLBSgene (Approved drugs only) |
| Drug status | DrugBank ID | Name | Type | Drug structure |
| Gene-centered ligand-gene interaction network |
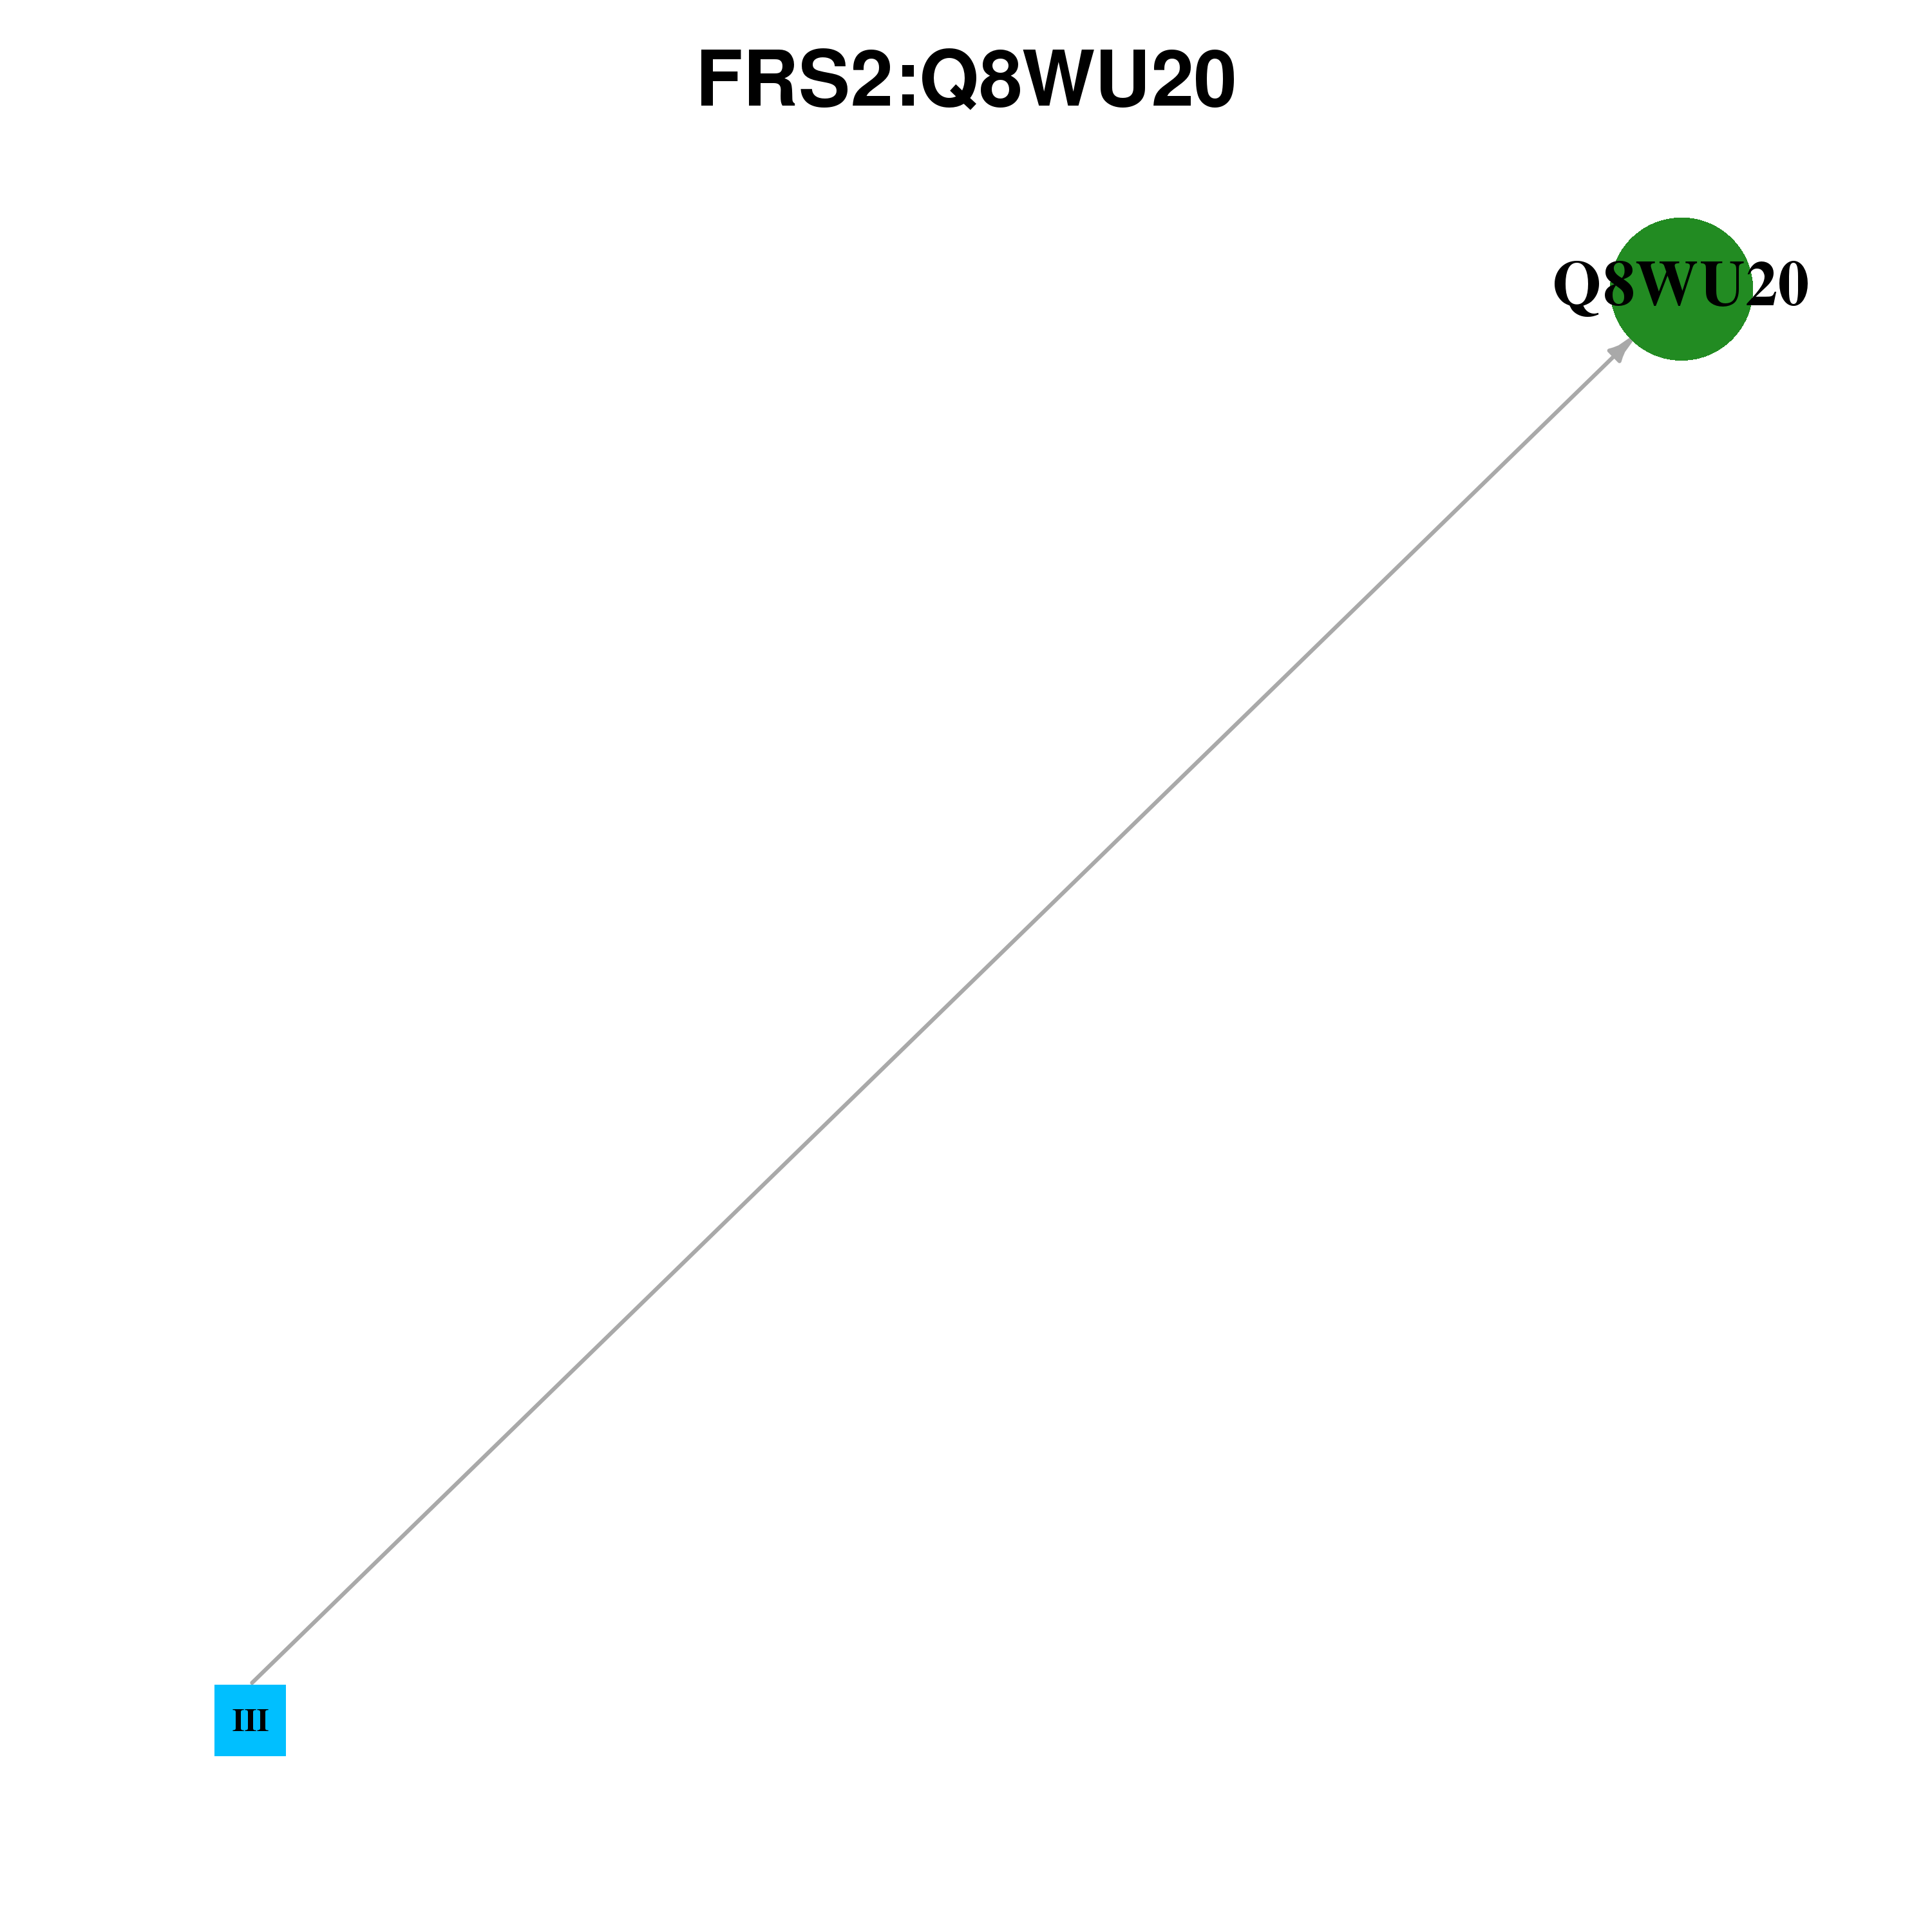 |
| Ligands binding to mutated ligand binding site of FRS2 go to BioLip |
| Ligand ID | Ligand short name | Ligand long name | PDB ID | PDB name | mutLBS | III | Peptide ligand (GLY,PRO,ASP,ALA,VAL,ILE,ILE,GLY,MET,THR,LYS,ILE,PRO,VAL,ILE,GLU,ASN,PRO,GLN,TYR,PHE,GLY,ILE) | 2mfq | A | G30 S69 R78 | III | Peptide ligand (HIS,SER,GLN,MET,ALA,VAL,HIS,LYS,LEU,ALA,LYS,SER,ILE,PRO,LEU,ARG,ARG,GLN,VAL,THR,VAL,SER) | 1xr0 | B | R50 S69 N111 |
| Top |
| Conservation information for LBS of FRS2 |
| Multiple alignments for Q8WU20 in multiple species |
| LBS | AA sequence | # species | Species |
 |
Copyright © 2016-Present - The University of Texas Health Science Center at Houston |