|
mutLBSgeneDB |
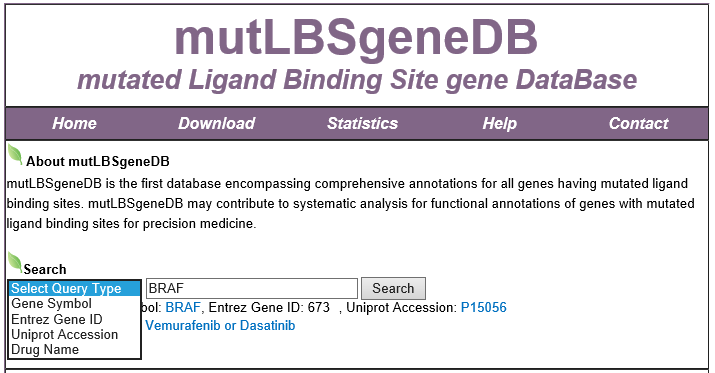
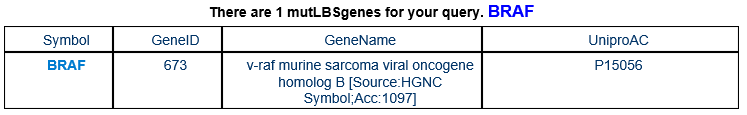
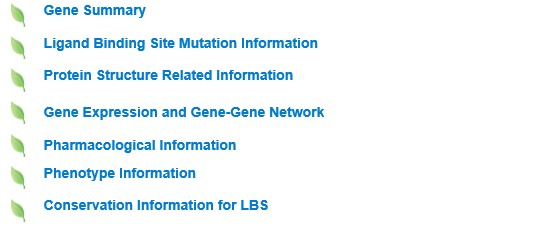
Search1. Data collection of mutLBSgeneDB2. Understanding of mutLBSgeneDB's annotation category Search page, example: BRAF mutLBSgene search result page mutLBSgene annotation result page 1) Gene summary category 2) Mutation information category 3) Protein structure related information category 4) Gene expression and gene-gene network category 5) Phenotype information category 6) Pharmacological information category 7) Conservation information category 3. Download and contact us |
|
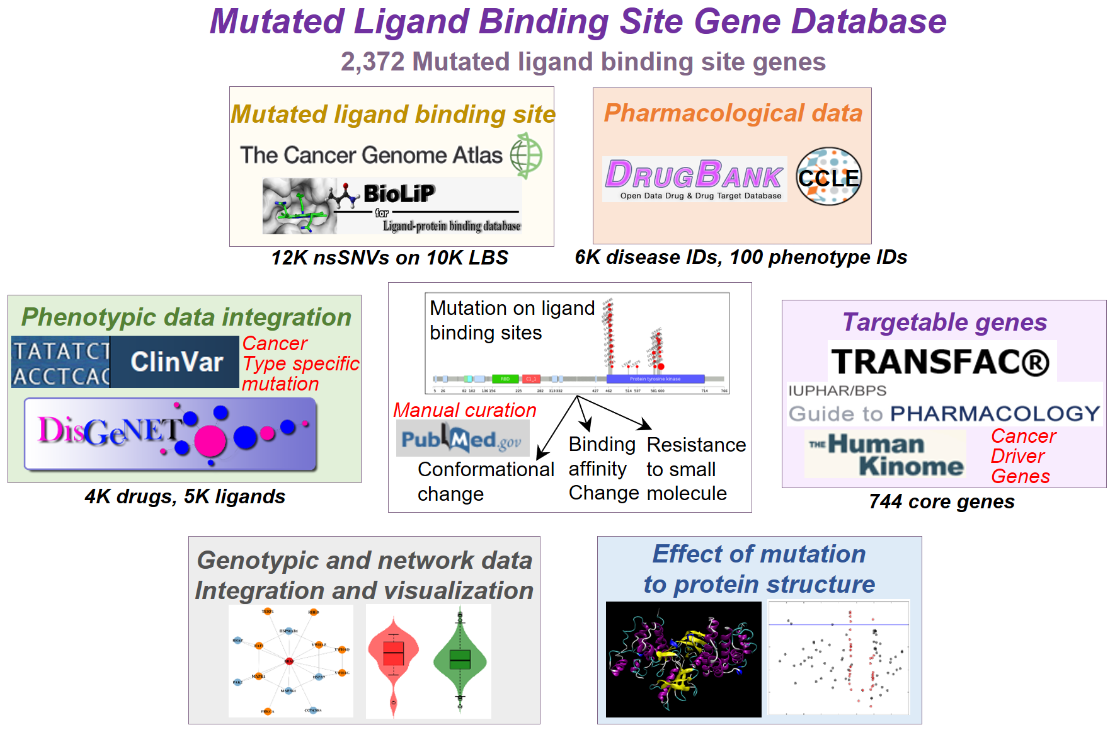
1. Data collection of mutLBSgeneDB
|
|
2. Understanding mutLBSgeneDB's annotation categories
mutLBSgene annotation result page
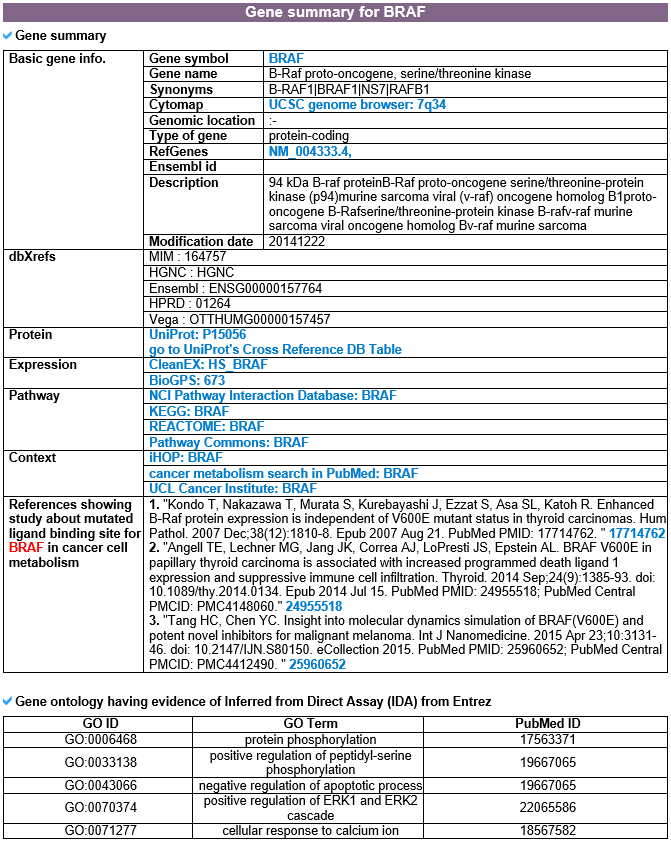
This category shows the gene's overall information from basic information such as symbol, alias, and locations to expression, pathway, regulation, and context. Words in blue font are linked to their respective databases.
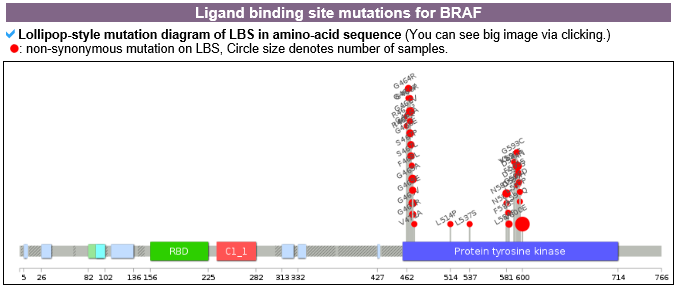
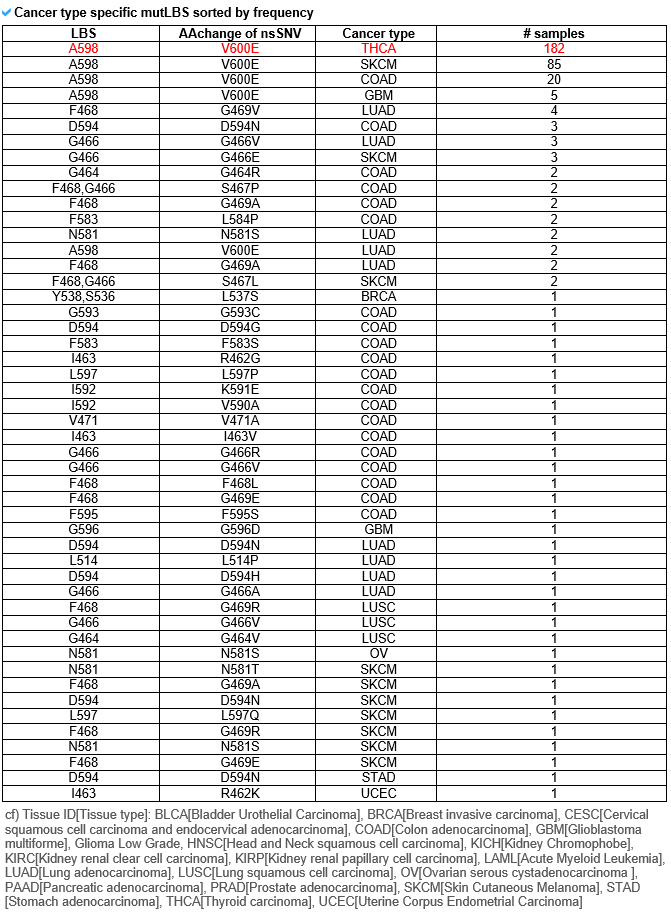
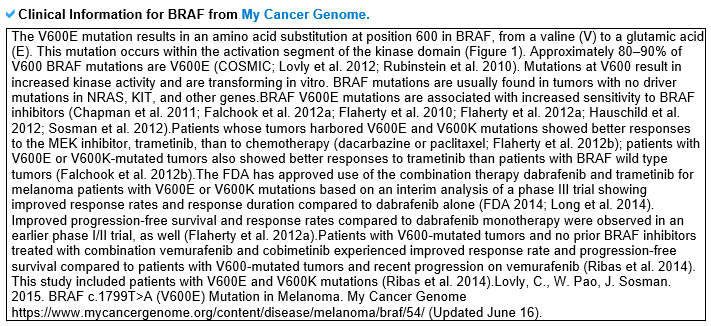
2) Mutation information category mutLBSgeneDB offers various somatic point mutation annotations. --- This image shows the non-synonymous SNVs only in the ligand binding sites on the amino acid sequence with a lollipop plot. --- This table shows the non-synonymous SNVs that are only in the ligand binding sites of their respective cancer type, and is sorted by frequency. --- Significant clinical information, which were obtained from MyCancerGenome, for the most recurrent lignad binding site mutation on the gene of interest is shown here.
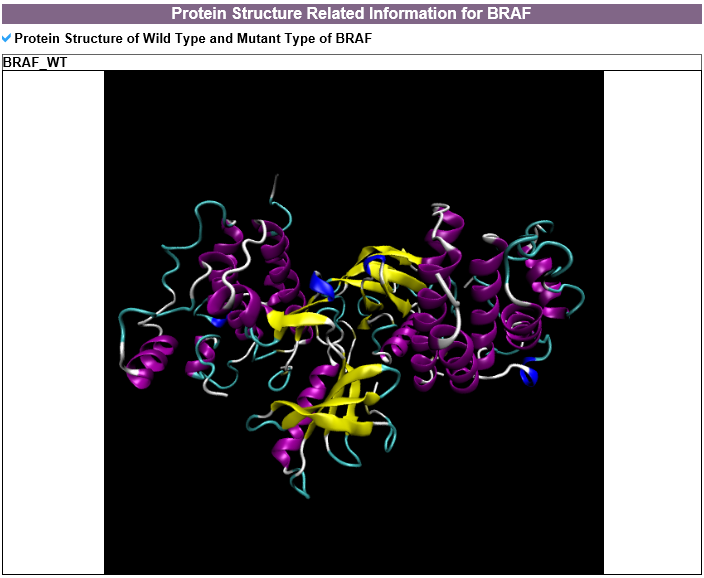
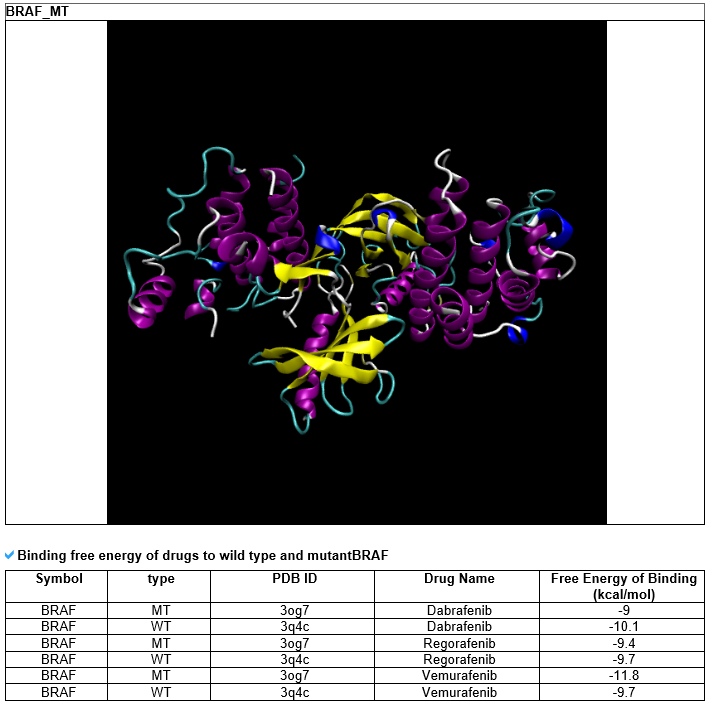
3) Protein structure related information category
--- For the 35 genes which have recurrent samples, have FDA-approved drugs, and are included in the top 200 genes that have the most number of mutated ligand binding sites, we calculated the protein-drug binding affinity for both the wild type and mutant. Protein-ligand docking software (AutoDock Vina) was used to perform this task.
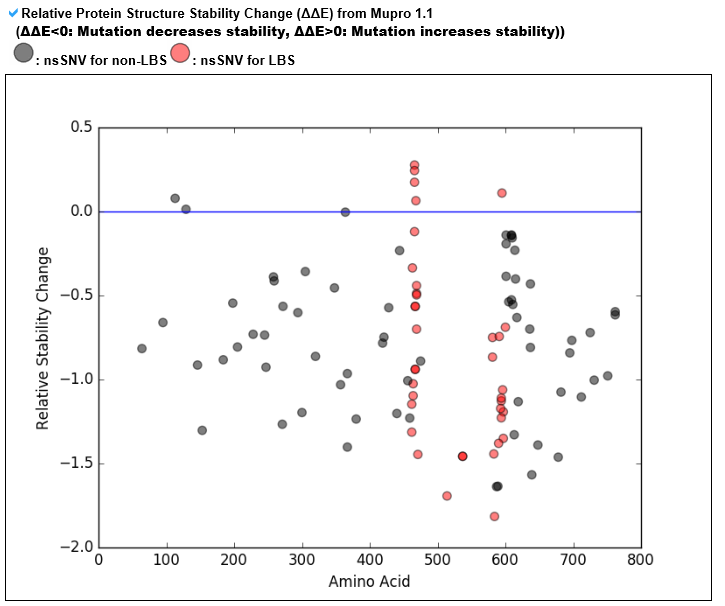
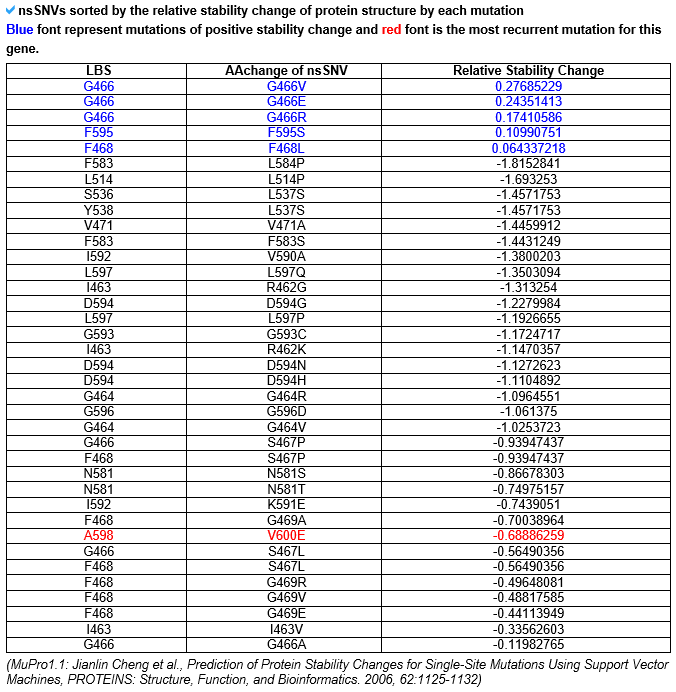
--- This category's information is based on the relative stability change prediction for each ligand binding site's point mutation from Mupro 1.1. --- The red dots represent the relative stability change for the ligand binding site mutations, and the black dots represent the other mutations. Positive value indicates that the protein structure's stability has been increased after the occurrence of this point mutation. Negative value indicates that the protein structure's stability has been decreased due to this mutation. --- This table shows the relative stability change value for each ligand binding site mutation. The blue font represents all positive stability changes and the red font represent the most recurrent mutation.
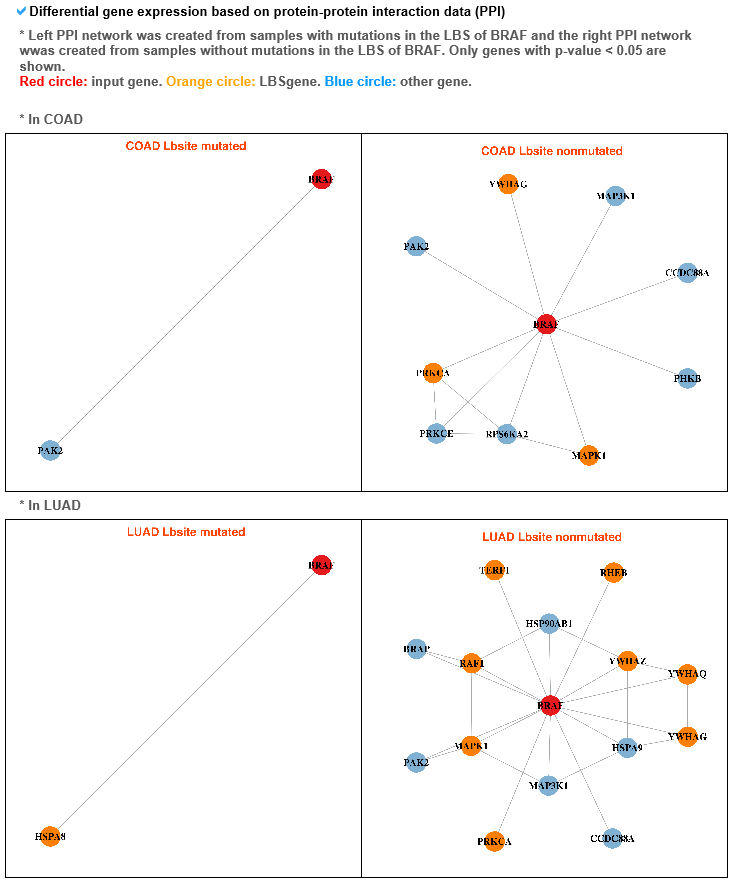
--- For the genes that have recurrent mutations among the targetable_mutLBSgenes, this table shows the PDB ID, description, and structure image for that gene with SNV. 4) Gene expression and gene-gene network category --- To compare the active genes between ligand binding site mutation samples and the other samples, we analyzed their expressions using co-expressed genes with protein-protein interaction network (PPI network).
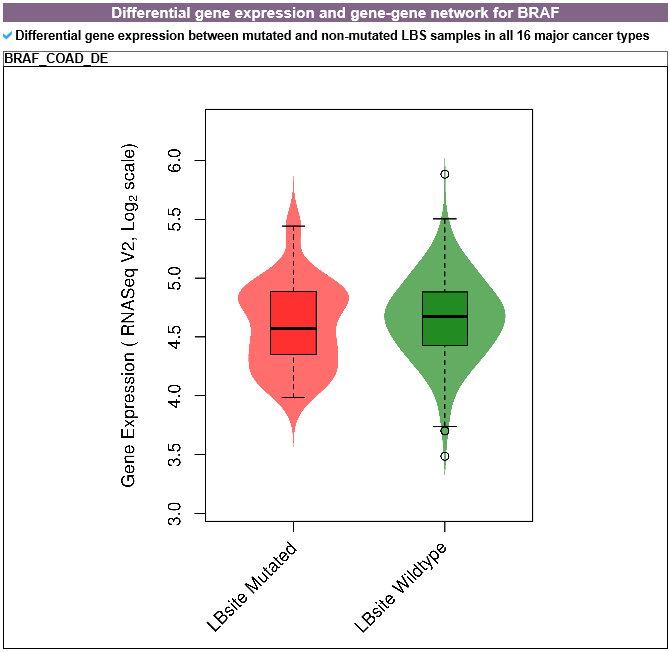
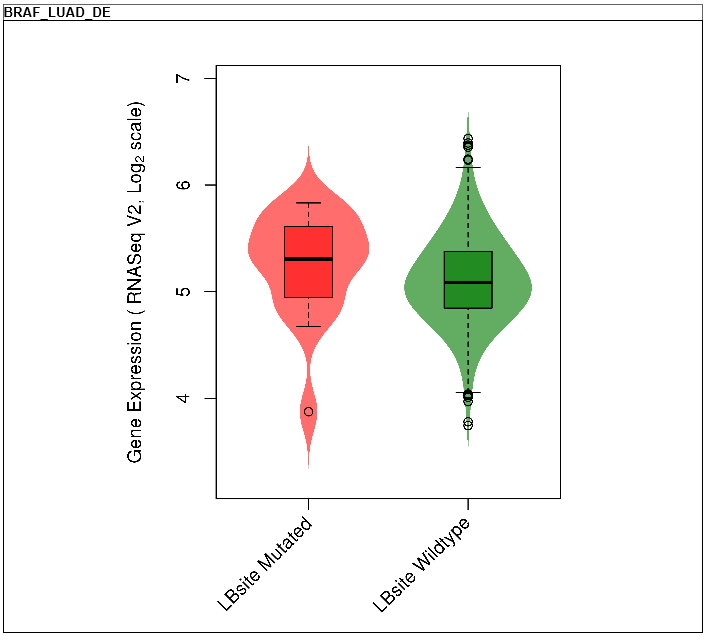
--- These plots show the differential gene expressions between mutated and non-mutated ligand binding site samples for this gene.
--- These gene-gene networks show significant differences between networks of genes with mutated (left) and non-mutated (right) ligand binding sites.
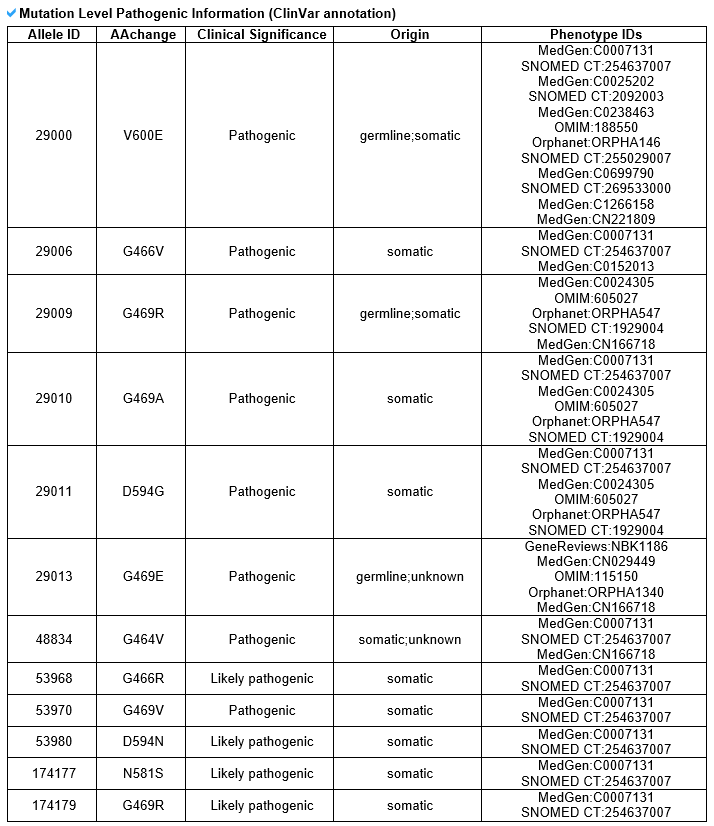
5) Phenotype information category This category includes gene-level disease information from DisGeNet and mutation-level pathogenic information from ClinVar. 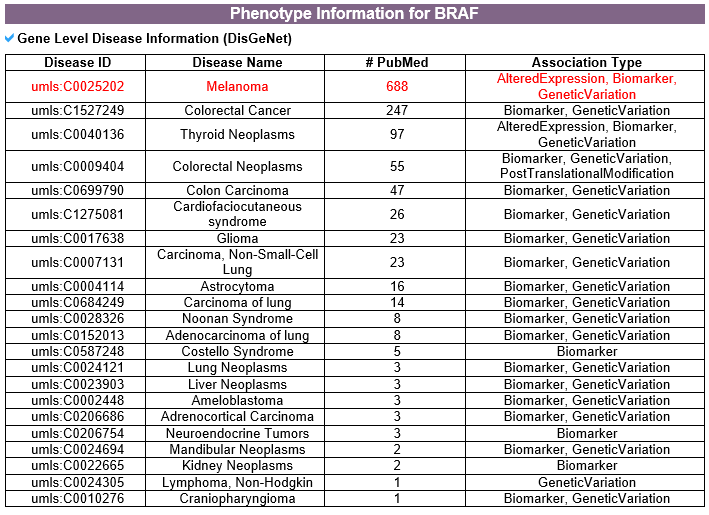
--- This table shows all disease related to this gene from DisGeNet. --- This table shows all pathogenic information related to each ligand binding site mutation from ClinVar.
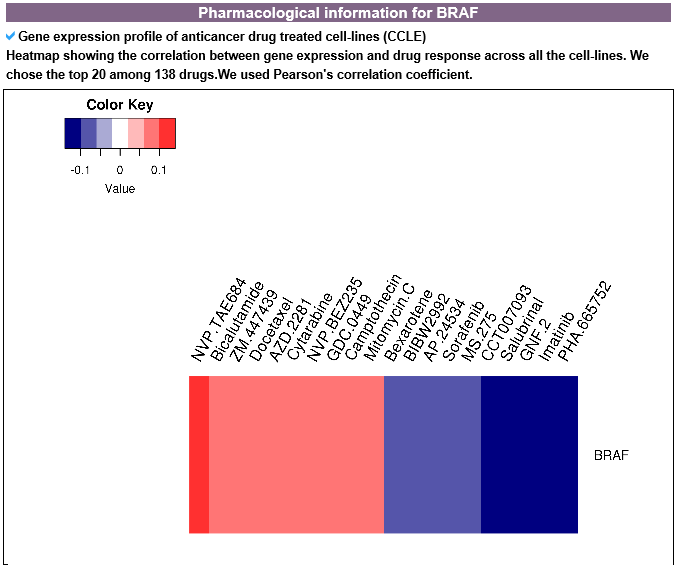
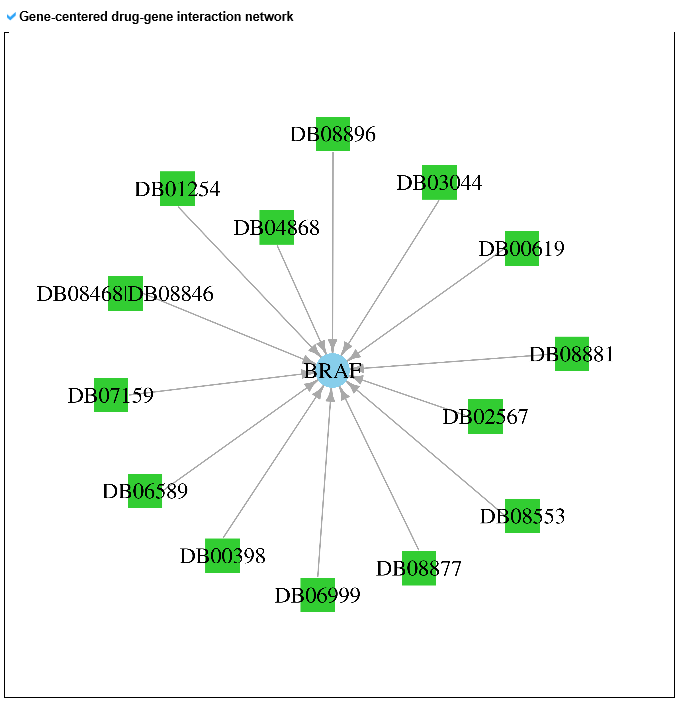
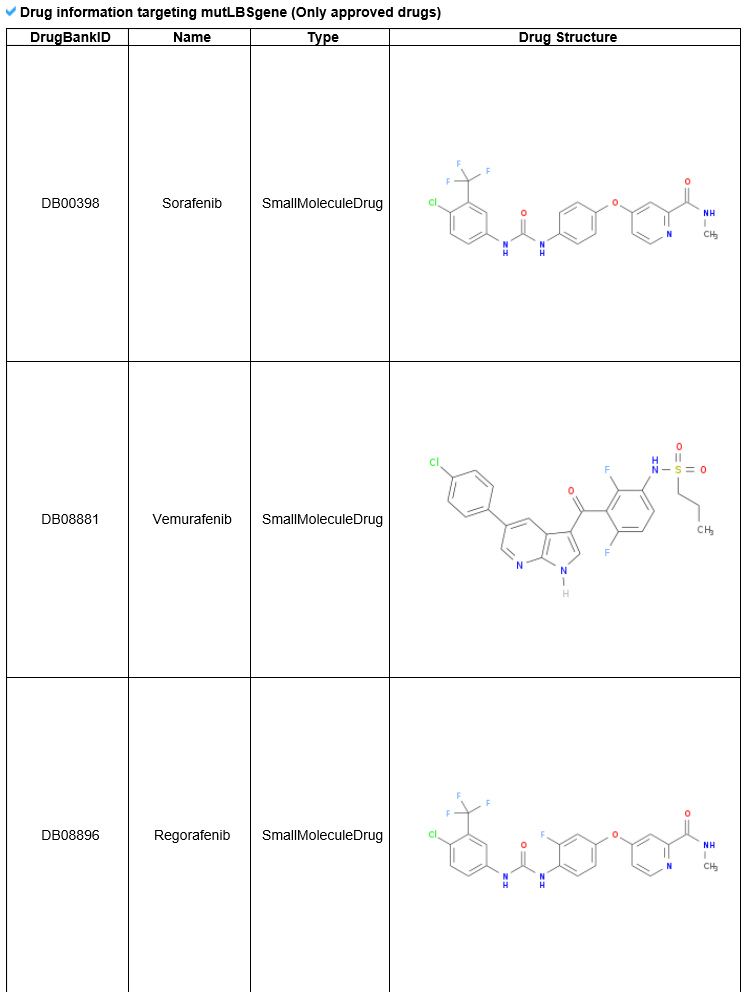
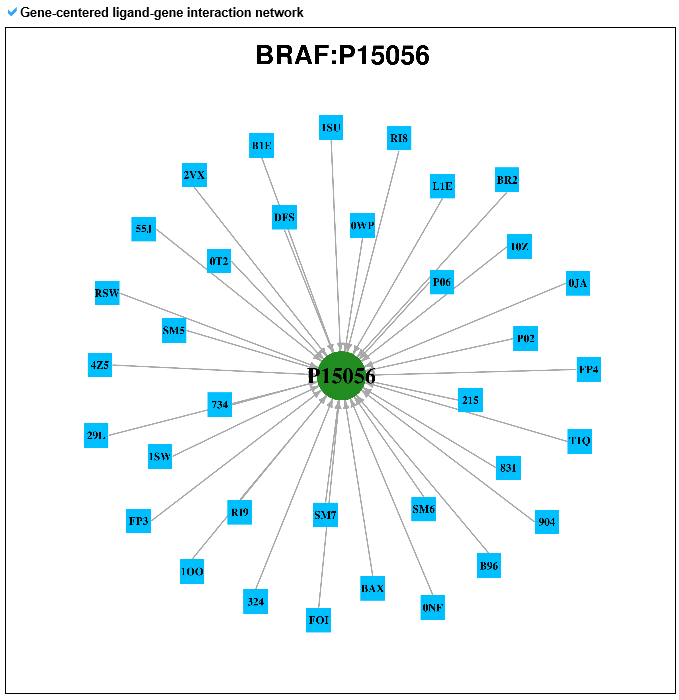
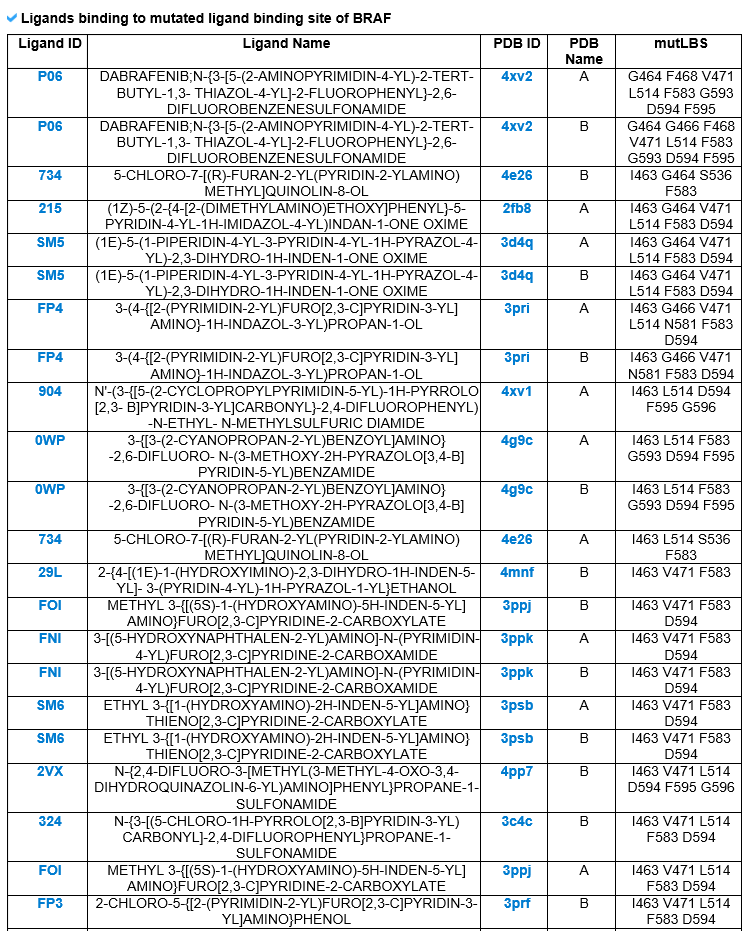
6) Pharmacological information category This category shows all small molecule information for the mutLBSgene. --- This heatmap shows the correlation of gene expression and drug response for each gene. A greater red intensity means that there is a positive correlation between this gene expression and drug response. --- This is a gene-centered drug-gene network image. --- Drug information including drug structure is displayed here. --- This is a gene-centered ligand-gene network image. --- User can see the detailed ligand information.
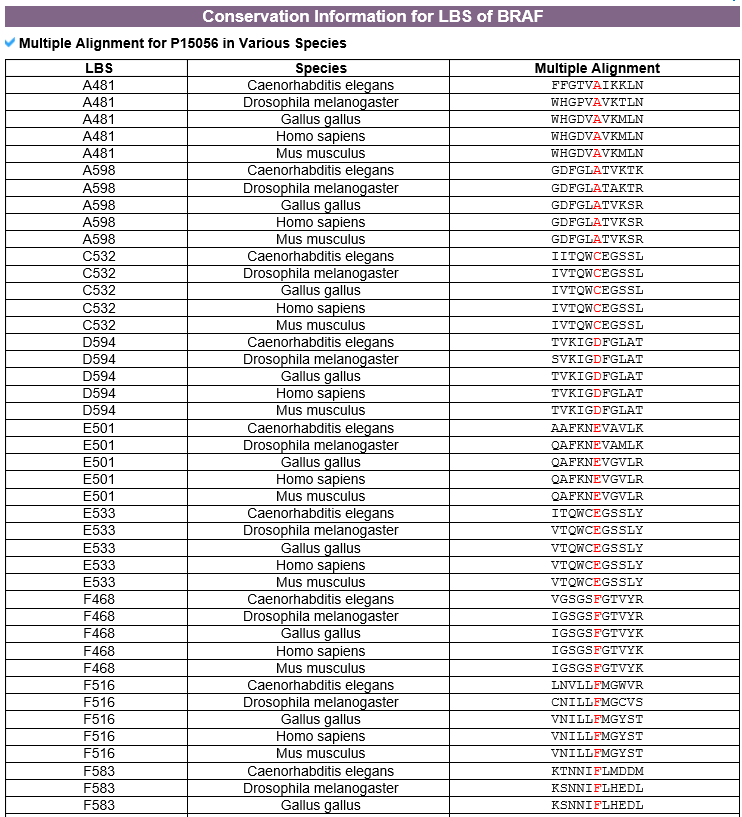
7) Conservation information category This category shows information related to ligand binding site conservation predicted across 8 species using MUSCLE tool. |
|
Please go to download page and contact page. |

Copyright 2008-Present - The University of Texas Health Science Center at Houston (UTHealth)
Web File Viewing | How to Report, Fraud, Waste and Abuse | State of Texas | Statewide Search | Texas Homeland Security | Site Policies