|
mutLBSgeneDB |
| |
| |
| |
| |
| |
| |
|

| Gene summary for ETS2 |
 Gene summary Gene summary |
| Basic gene Info. | Gene symbol | ETS2 |
| Gene name | v-ets avian erythroblastosis virus E26 oncogene homolog 2 | |
| Synonyms | ETS2IT1 | |
| Cytomap | UCSC genome browser: 21q22.2 | |
| Type of gene | protein-coding | |
| RefGenes | NM_001256295.1, NM_005239.5, | |
| Description | oncogene ETS-2protein C-ets-2v-ets avian erythroblastosis virus E2 oncogene homolog 2v-ets erythroblastosis virus E26 oncogene homolog 2 | |
| Modification date | 20141207 | |
| dbXrefs | MIM : 164740 | |
| HGNC : HGNC | ||
| Ensembl : ENSG00000157557 | ||
| HPRD : 01263 | ||
| Vega : OTTHUMG00000090769 | ||
| Protein | UniProt: P15036 go to UniProt's Cross Reference DB Table | |
| Expression | CleanEX: HS_ETS2 | |
| BioGPS: 2114 | ||
| Pathway | NCI Pathway Interaction Database: ETS2 | |
| KEGG: ETS2 | ||
| REACTOME: ETS2 | ||
| Pathway Commons: ETS2 | ||
| Context | iHOP: ETS2 | |
| ligand binding site mutation search in PubMed: ETS2 | ||
| UCL Cancer Institute: ETS2 | ||
| Assigned class in mutLBSgeneDB | B: This gene belongs to targetable_mutLBSgenes. | |
| Gene ontology having evidence of Inferred from Direct Assay (IDA) from Entrez |
| GO ID | GO Term | PubMed ID | GO:0000122 | negative regulation of transcription from RNA polymerase II promoter | 12637547 | GO:0045893 | positive regulation of transcription, DNA-templated | 11909962 |
| Top |
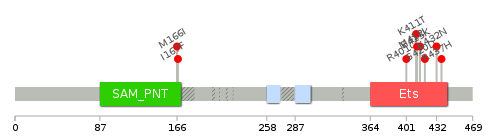
| Ligand binding site mutations for ETS2 |
| Lollipop-style diagram of mutations at LBS in amino-acid sequence. We represented ligand binding site mutations only. (You can see big image via clicking.) |
 |
| Cancer type specific mutLBS sorted by frequency |
| LBS | AAchange of nsSNV | Cancer type | # samples | M412 | M412I | BRCA | 1 | I167 | I167F | BRCA | 1 | R437 | R437H | COAD | 1 | W403 | R401C | COAD | 1 | K416,Y414 | E415K | HNSC | 1 | I167 | M166I | LUAD | 1 | K432 | K432N | LUAD | 1 | M412 | K411T | LUAD | 1 | R419 | G420D | SKCM | 1 |
| cf) Cancer type abbreviation. BLCA: Bladder urothelial carcinoma, BRCA: Breast invasive carcinoma, CESC: Cervical squamous cell carcinoma and endocervical adenocarcinoma, COAD: Colon adenocarcinoma, GBM: Glioblastoma multiforme, LGG: Brain lower grade glioma, HNSC: Head and neck squamous cell carcinoma, KICH: Kidney chromophobe, KIRC: Kidney renal clear cell carcinoma, KIRP: Kidney renal papillary cell carcinoma, LAML: Acute myeloid leukemia, LUAD: Lung adenocarcinoma, LUSC: Lung squamous cell carcinoma, OV: Ovarian serous cystadenocarcinoma, PAAD: Pancreatic adenocarcinoma, PRAD: Prostate adenocarcinoma, SKCM: Skin cutaneous melanoma, STAD: Stomach adenocarcinoma, THCA: Thyroid carcinoma, UCEC: Uterine corpus endometrial carcinoma. |
| Top |
| Protein structure related information for ETS2 |
| Relative protein structure stability change (ΔΔE) using Mupro 1.1 Mupro score denotes assessment of the effect of mutations on thermodynamic stability. (ΔΔE<0: mutation decreases stability, ΔΔE>0: mutation increases stability) |
 : nsSNV at non-LBS : nsSNV at non-LBS : nsSNV at LBS : nsSNV at LBS |
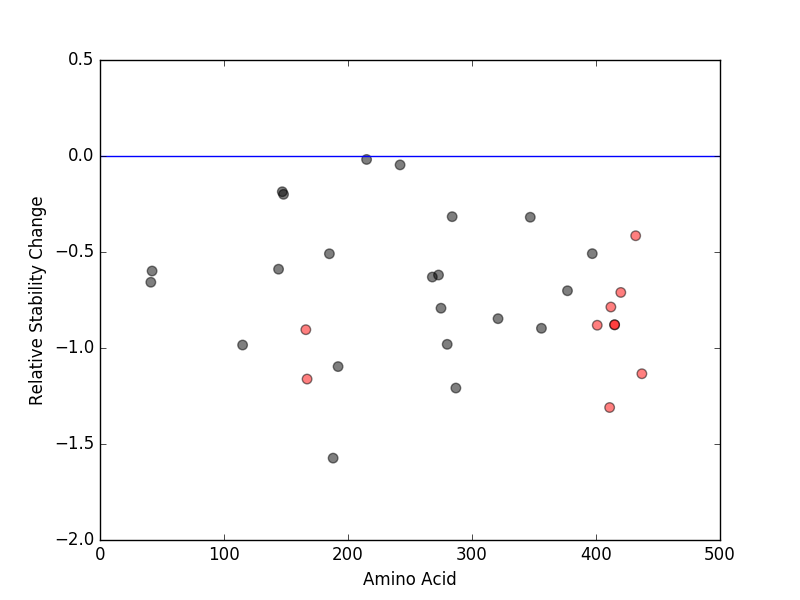 |
| nsSNVs sorted by the relative stability change of protein structure by each mutation Blue: mutations of positive stability change. and red : the most recurrent mutation for this gene. |
| LBS | AAchange of nsSNV | Relative stability change | M412 | K411T | -1.3099355 | I167 | I167F | -1.1617421 | R437 | R437H | -1.1341114 | I167 | M166I | -0.9046649 | W403 | R401C | -0.8813818 | Y414 | E415K | -0.87907859 | K416 | E415K | -0.87907859 | M412 | M412I | -0.78657986 | R419 | G420D | -0.710634 | K432 | K432N | -0.41534978 |
| (MuPro1.1: Jianlin Cheng et al., Prediction of Protein Stability Changes for Single-Site Mutations Using Support Vector Machines, PROTEINS: Structure, Function, and Bioinformatics. 2006, 62:1125-1132) |
| Structure image for ETS2 from PDB |
| Top |
| Differential gene expression and gene-gene network for ETS2 |
| Differential gene expression between mutated and non-mutated LBS samples in all 16 major cancer types |
| Differential co-expressed gene network based on protein-protein interaction data (CePIN) |
| Top |
| Top |
| Phenotype information for ETS2 |
| Gene level disease information (DisGeNet) |
| Disease ID | Disease name | # PubMed | Association type |
| umls:C1458155 | Breast Neoplasms | 8 | AlteredExpression, Biomarker |
| umls:C0376634 | Craniofacial Abnormalities | 1 | Biomarker |
| umls:C0162820 | Dermatitis, Allergic Contact | 1 | Biomarker |
| umls:C0027746 | Nerve Degeneration | 1 | Biomarker |
| Mutation level pathogenic information (ClinVar annotation) |
| Allele ID | AA change | Clinical significance | Origin | Phenotype IDs |
| Top |
| Pharmacological information for ETS2 |
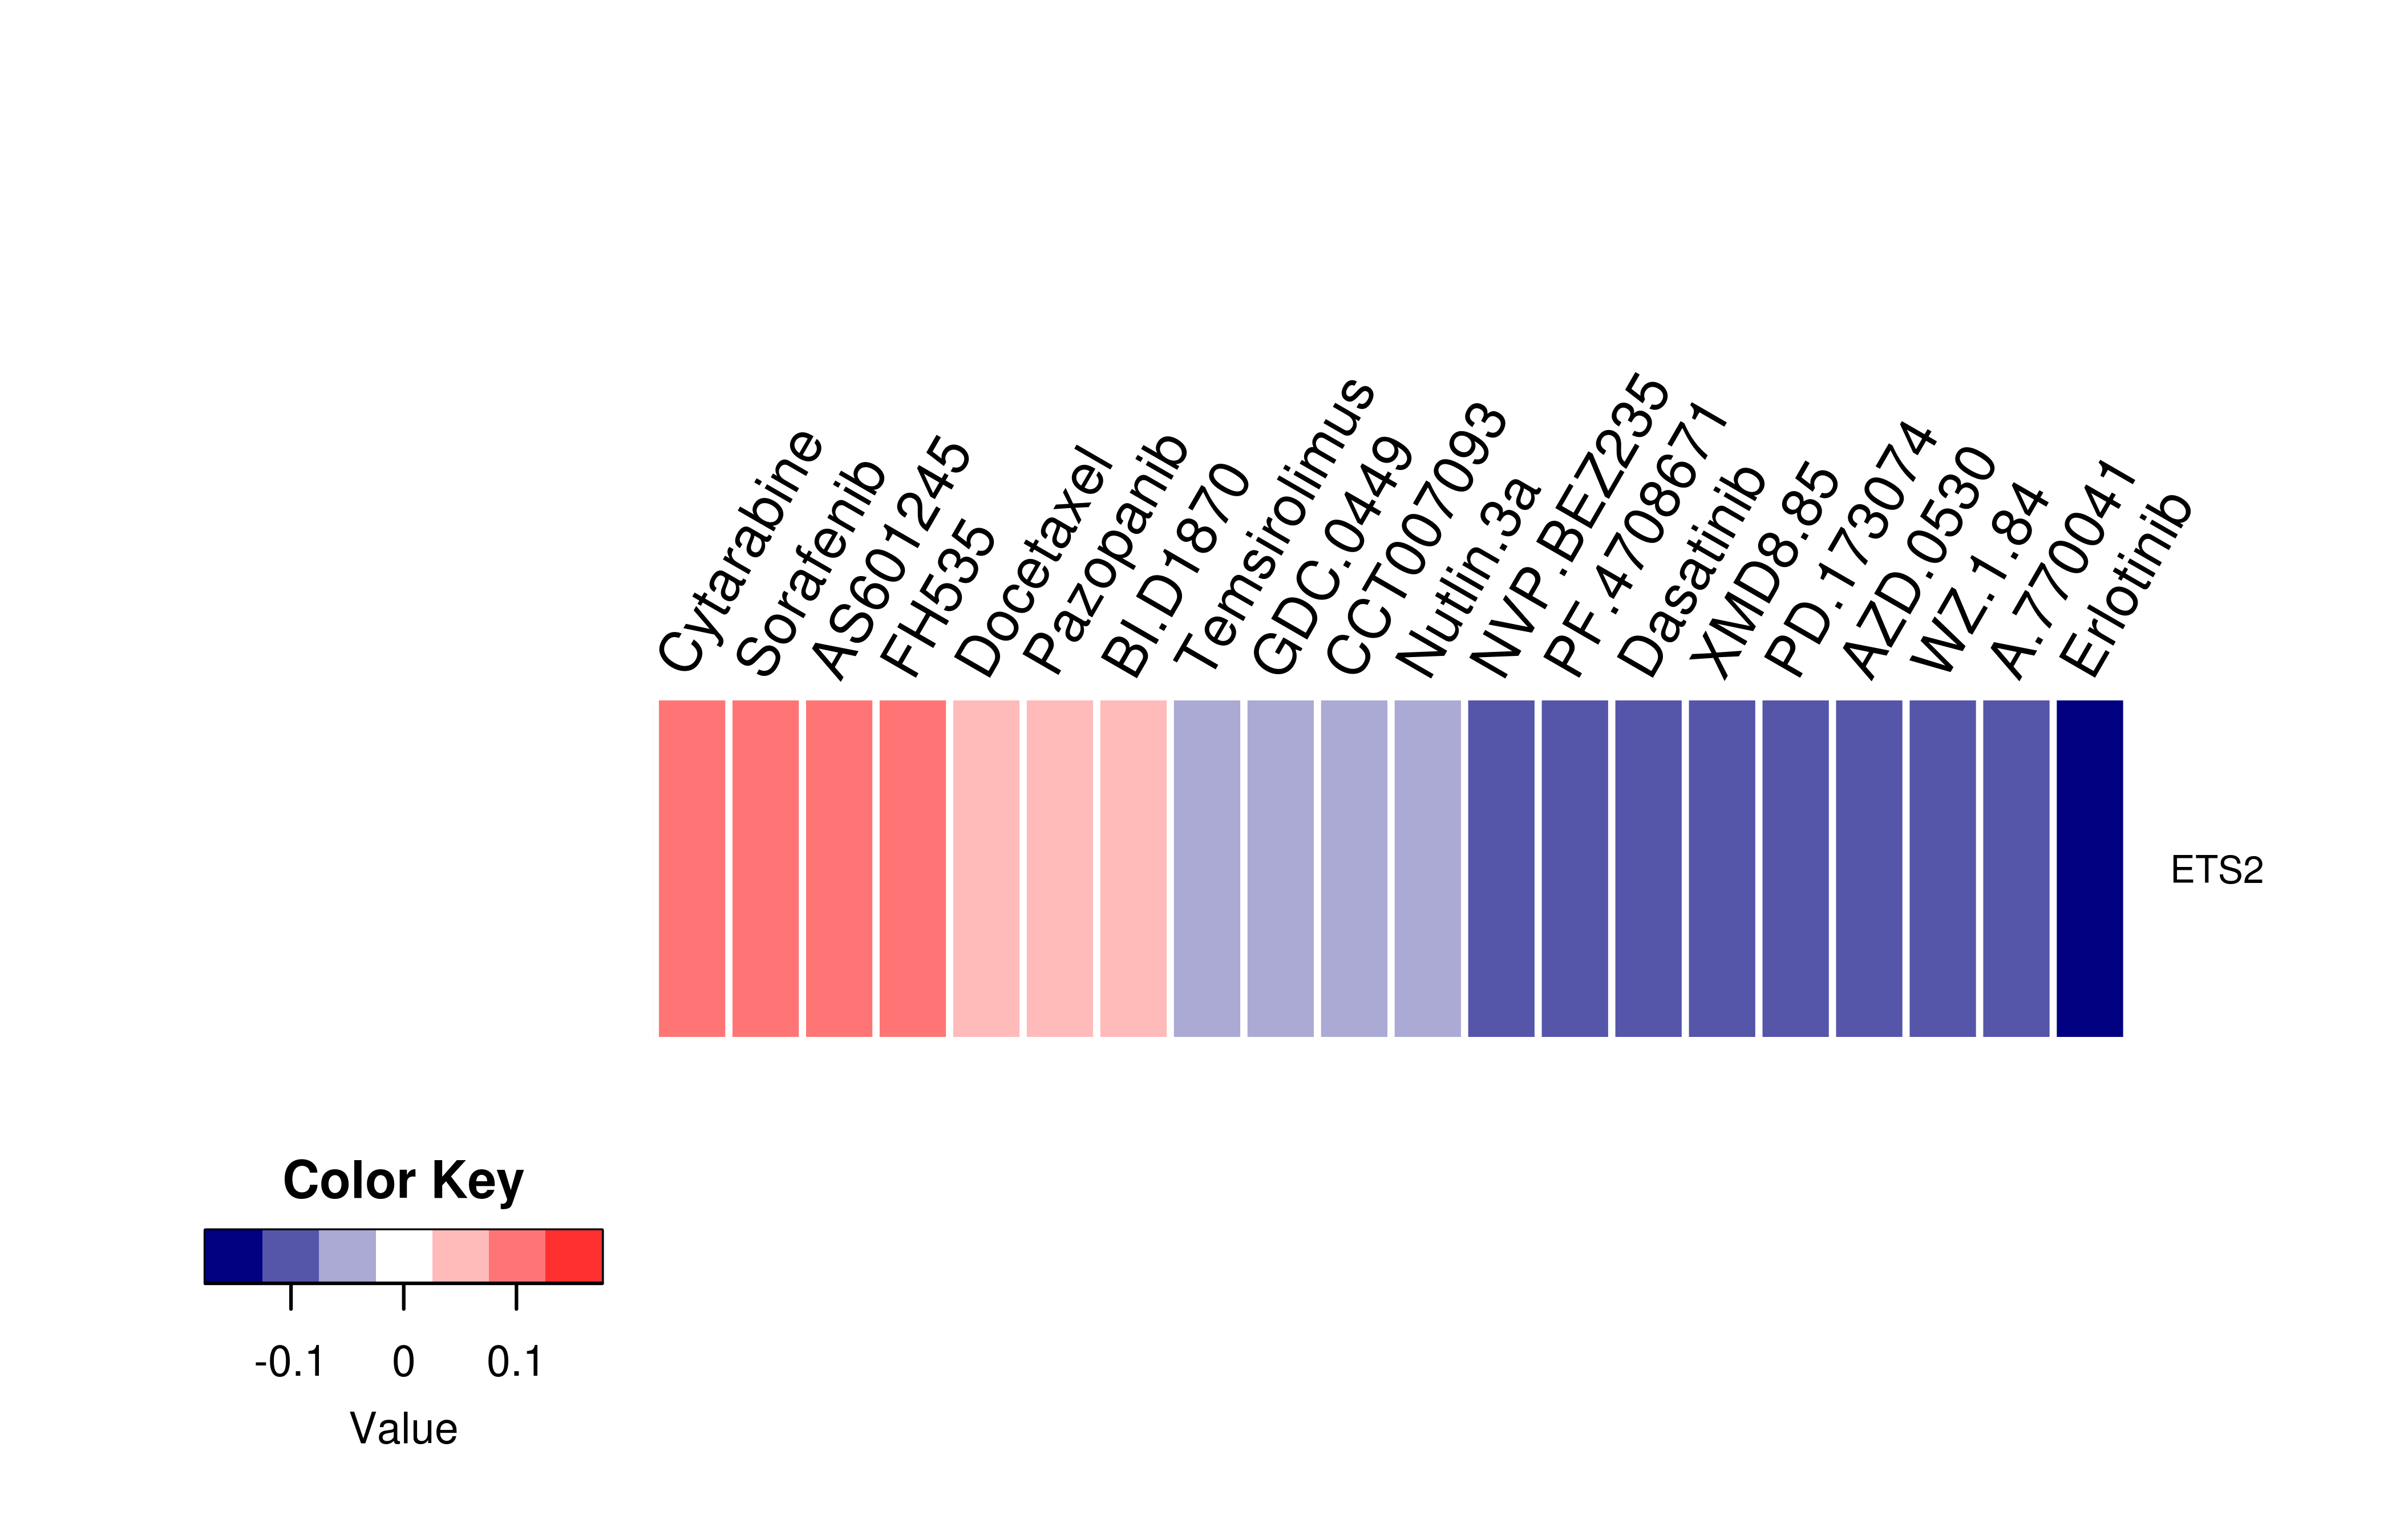
| Gene expression profile of anticancer drug treated cell-lines (CCLE) Heatmap showing the correlation between gene expression and drug response across all the cell-lines. We chose the top 20 among 138 drugs.We used Pearson's correlation coefficient. |
 |
| Drug information targeting mutLBSgene (Approved drugs only) |
| Drug status | DrugBank ID | Name | Type | Drug structure |
| Gene-centered ligand-gene interaction network |
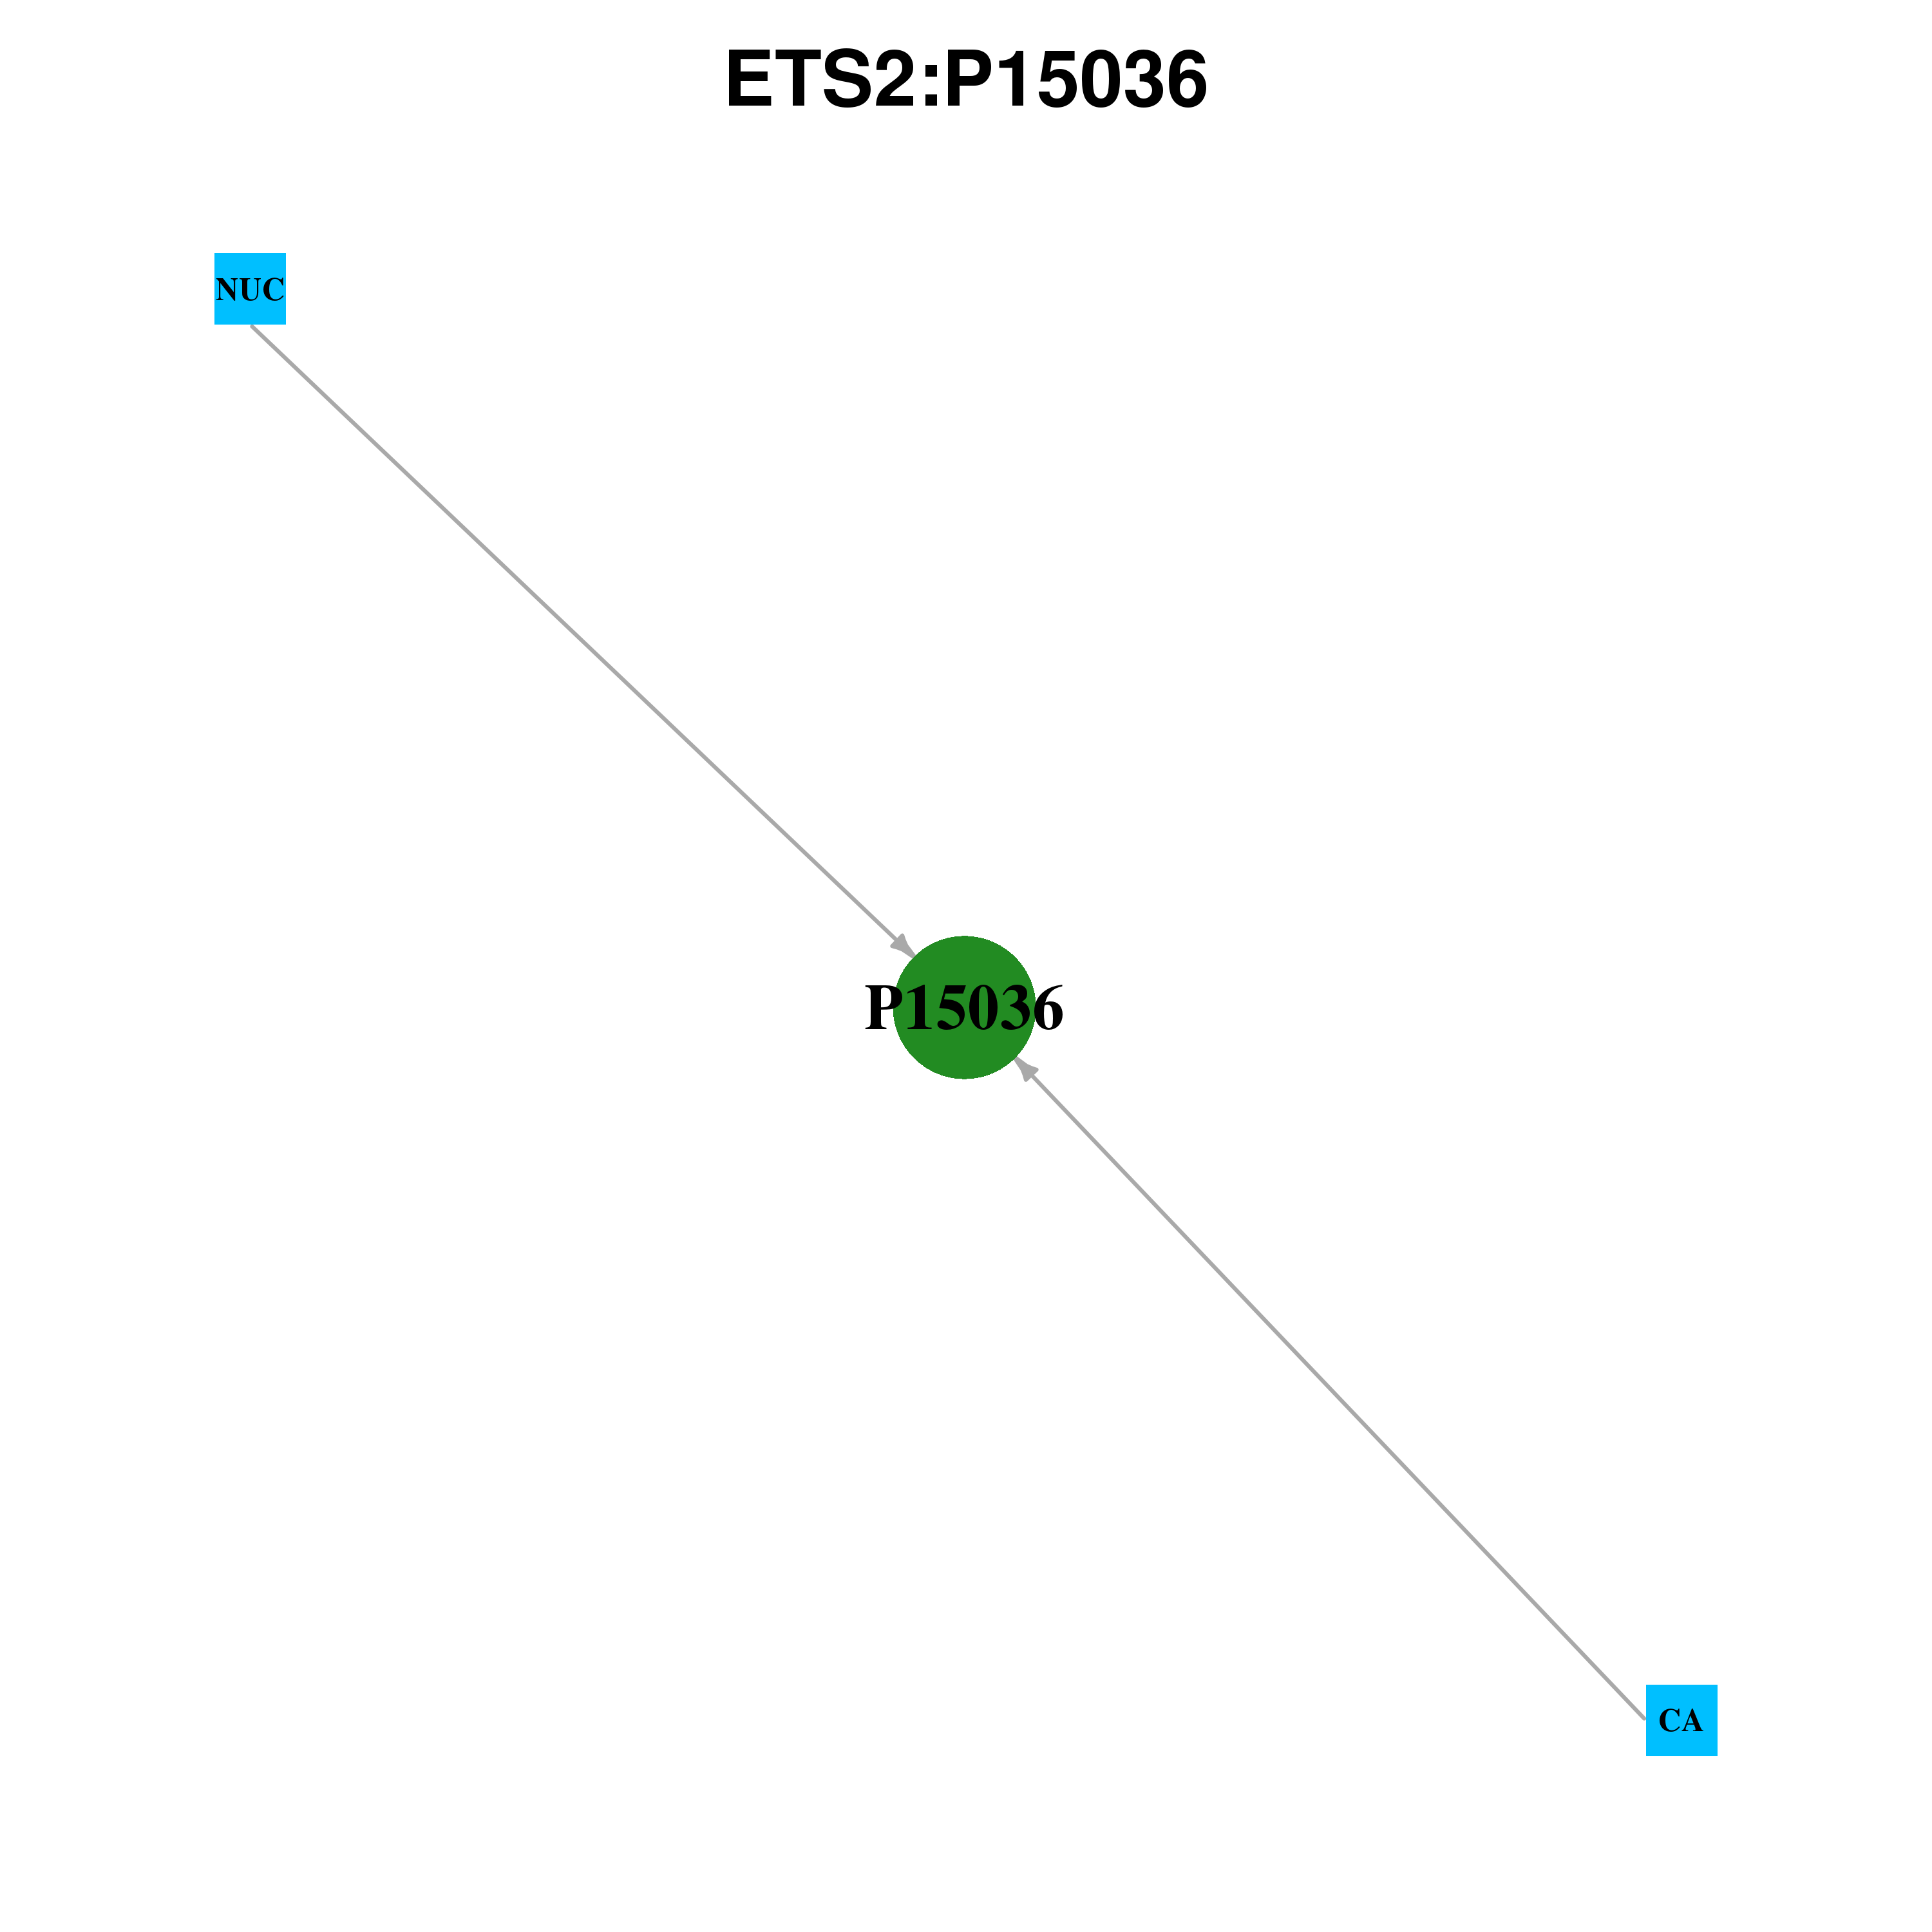 |
| Ligands binding to mutated ligand binding site of ETS2 go to BioLip |
| Ligand ID | Ligand short name | Ligand long name | PDB ID | PDB name | mutLBS | NUC | Nucleic Acids | 4bqa | A | W403 M412 K416 R419 | NUC | Nucleic Acids | 4bqa | D | W403 M412 K416 R419 | NUC | Nucleic Acids | 4bqa | G | W403 M412 R419 | NUC | Nucleic Acids | 4bqa | A | Y414 R419 K432 R437 | NUC | Nucleic Acids | 4bqa | D | Y414 R419 K432 R437 | NUC | Nucleic Acids | 4bqa | G | Y414 R419 K432 R437 |
| Top |
| Conservation information for LBS of ETS2 |
| Multiple alignments for P15036 in multiple species |
| LBS | AA sequence | # species | Species |
 |
Copyright © 2016-Present - The University of Texas Health Science Center at Houston |