|
mutLBSgeneDB |
| |
| |
| |
| |
| |
| |
|

| Gene summary for FCN2 |
 Gene summary Gene summary |
| Basic gene Info. | Gene symbol | FCN2 |
| Gene name | ficolin (collagen/fibrinogen domain containing lectin) 2 | |
| Synonyms | EBP-37|FCNL|P35|ficolin-2 | |
| Cytomap | UCSC genome browser: 9q34.3 | |
| Type of gene | protein-coding | |
| RefGenes | NM_004108.2, NM_015837.2,NM_015838.1,NM_015839.1, | |
| Description | 37 kDa elastin-binding proteinL-ficolincollagen/fibrinogen domain-containing protein 2ficolin (collagen/fibrinogen domain containing lectin) 2 (hucolin)ficolin Bficolin-2ficolin-Bficolin-betaserum lectin p35 | |
| Modification date | 20141207 | |
| dbXrefs | MIM : 601624 | |
| HGNC : HGNC | ||
| Ensembl : ENSG00000160339 | ||
| HPRD : 03376 | ||
| Vega : OTTHUMG00000020892 | ||
| Protein | UniProt: Q15485 go to UniProt's Cross Reference DB Table | |
| Expression | CleanEX: HS_FCN2 | |
| BioGPS: 2220 | ||
| Pathway | NCI Pathway Interaction Database: FCN2 | |
| KEGG: FCN2 | ||
| REACTOME: FCN2 | ||
| Pathway Commons: FCN2 | ||
| Context | iHOP: FCN2 | |
| ligand binding site mutation search in PubMed: FCN2 | ||
| UCL Cancer Institute: FCN2 | ||
| Assigned class in mutLBSgeneDB | C: This gene just belongs to mutLBSgenes. | |
| Gene ontology having evidence of Inferred from Direct Assay (IDA) from Entrez |
| GO ID | GO Term | PubMed ID |
| Top |
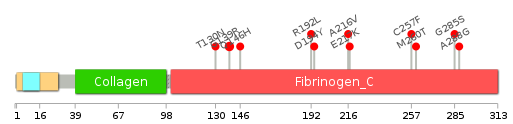
| Ligand binding site mutations for FCN2 |
| Lollipop-style diagram of mutations at LBS in amino-acid sequence. We represented ligand binding site mutations only. (You can see big image via clicking.) |
 |
| Cancer type specific mutLBS sorted by frequency |
| LBS | AAchange of nsSNV | Cancer type | # samples | G139 | G139R | SKCM | 2 | D194 | D194Y | COAD | 1 | F261 | M260T | COAD | 1 | R147 | Q146H | LUAD | 1 | D194 | R192L | LUAD | 1 | F287 | A288G | LUAD | 1 | E215 | E217K | SKCM | 1 | F287 | G285S | SKCM | 1 | N256 | C257F | STAD | 1 | E215 | A216V | STAD | 1 | L132 | T130N | UCEC | 1 |
| cf) Cancer type abbreviation. BLCA: Bladder urothelial carcinoma, BRCA: Breast invasive carcinoma, CESC: Cervical squamous cell carcinoma and endocervical adenocarcinoma, COAD: Colon adenocarcinoma, GBM: Glioblastoma multiforme, LGG: Brain lower grade glioma, HNSC: Head and neck squamous cell carcinoma, KICH: Kidney chromophobe, KIRC: Kidney renal clear cell carcinoma, KIRP: Kidney renal papillary cell carcinoma, LAML: Acute myeloid leukemia, LUAD: Lung adenocarcinoma, LUSC: Lung squamous cell carcinoma, OV: Ovarian serous cystadenocarcinoma, PAAD: Pancreatic adenocarcinoma, PRAD: Prostate adenocarcinoma, SKCM: Skin cutaneous melanoma, STAD: Stomach adenocarcinoma, THCA: Thyroid carcinoma, UCEC: Uterine corpus endometrial carcinoma. |
| Top |
| Protein structure related information for FCN2 |
| Relative protein structure stability change (ΔΔE) using Mupro 1.1 Mupro score denotes assessment of the effect of mutations on thermodynamic stability. (ΔΔE<0: mutation decreases stability, ΔΔE>0: mutation increases stability) |
 : nsSNV at non-LBS : nsSNV at non-LBS : nsSNV at LBS : nsSNV at LBS |
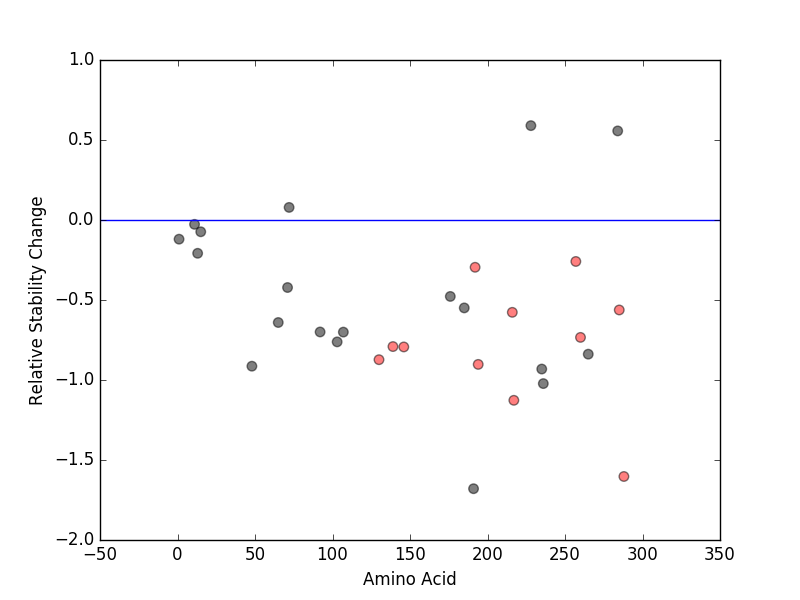 |
| nsSNVs sorted by the relative stability change of protein structure by each mutation Blue: mutations of positive stability change. and red : the most recurrent mutation for this gene. |
| LBS | AAchange of nsSNV | Relative stability change | F287 | A288G | -1.6030686 | E215 | E217K | -1.1269433 | D194 | D194Y | -0.90246231 | L132 | T130N | -0.87304099 | R147 | Q146H | -0.79335223 | G139 | G139R | -0.79100796 | F261 | M260T | -0.7336814 | E215 | A216V | -0.5770472 | F287 | G285S | -0.5623178 | D194 | R192L | -0.29555225 | N256 | C257F | -0.25918426 |
| (MuPro1.1: Jianlin Cheng et al., Prediction of Protein Stability Changes for Single-Site Mutations Using Support Vector Machines, PROTEINS: Structure, Function, and Bioinformatics. 2006, 62:1125-1132) |
| Structure image for FCN2 from PDB |
| PDB ID | PDB title | PDB structure | 2J3G | L-FICOLIN | 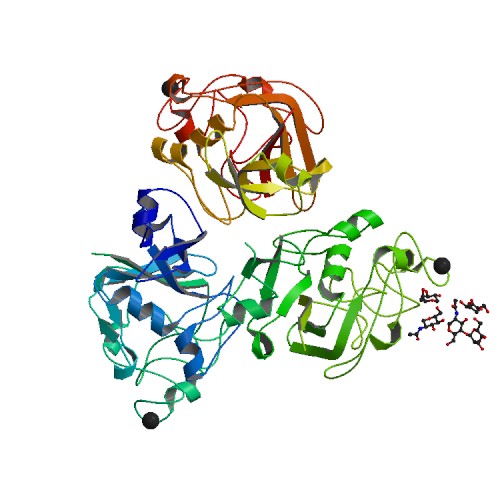 |
| Top |
| Differential gene expression and gene-gene network for FCN2 |
| Differential gene expression between mutated and non-mutated LBS samples in all 16 major cancer types |
| Differential co-expressed gene network based on protein-protein interaction data (CePIN) |
| Top |
| Top |
| Phenotype information for FCN2 |
| Gene level disease information (DisGeNet) |
| Disease ID | Disease name | # PubMed | Association type |
| Mutation level pathogenic information (ClinVar annotation) |
| Allele ID | AA change | Clinical significance | Origin | Phenotype IDs |
| Top |
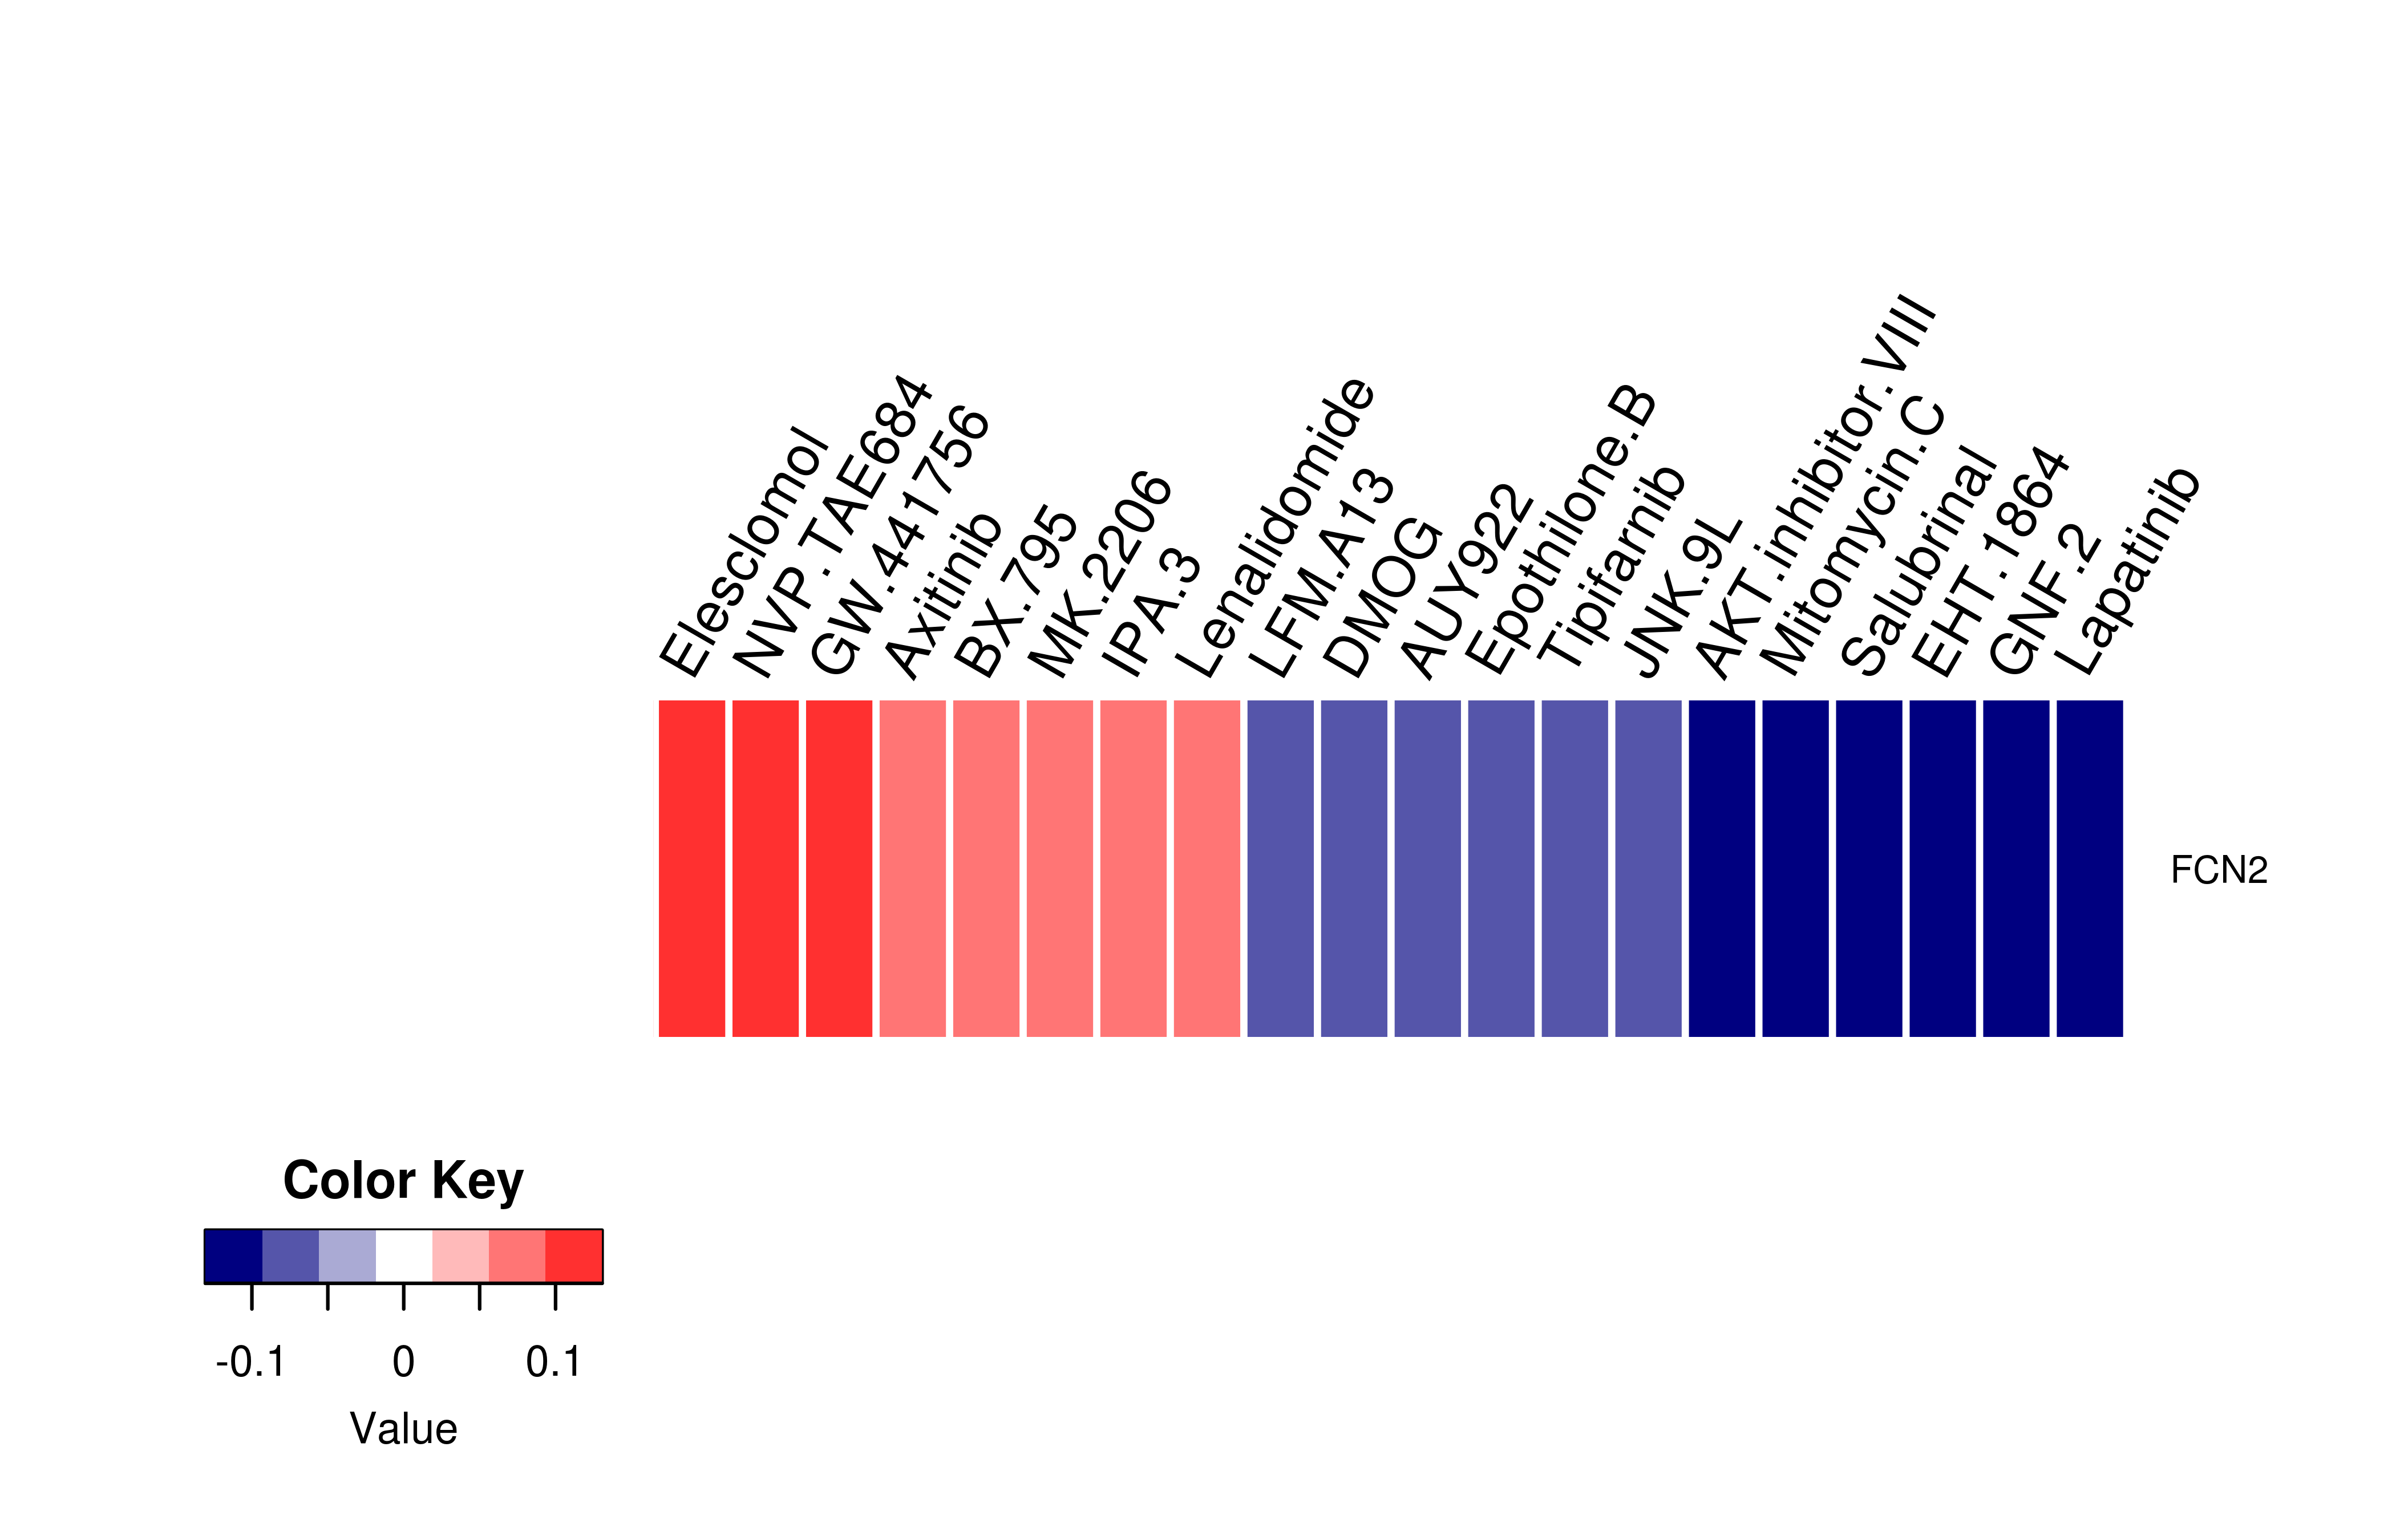
| Pharmacological information for FCN2 |
| Gene expression profile of anticancer drug treated cell-lines (CCLE) Heatmap showing the correlation between gene expression and drug response across all the cell-lines. We chose the top 20 among 138 drugs.We used Pearson's correlation coefficient. |
 |
| Drug information targeting mutLBSgene (Approved drugs only) |
| Drug status | DrugBank ID | Name | Type | Drug structure |
| Gene-centered ligand-gene interaction network |
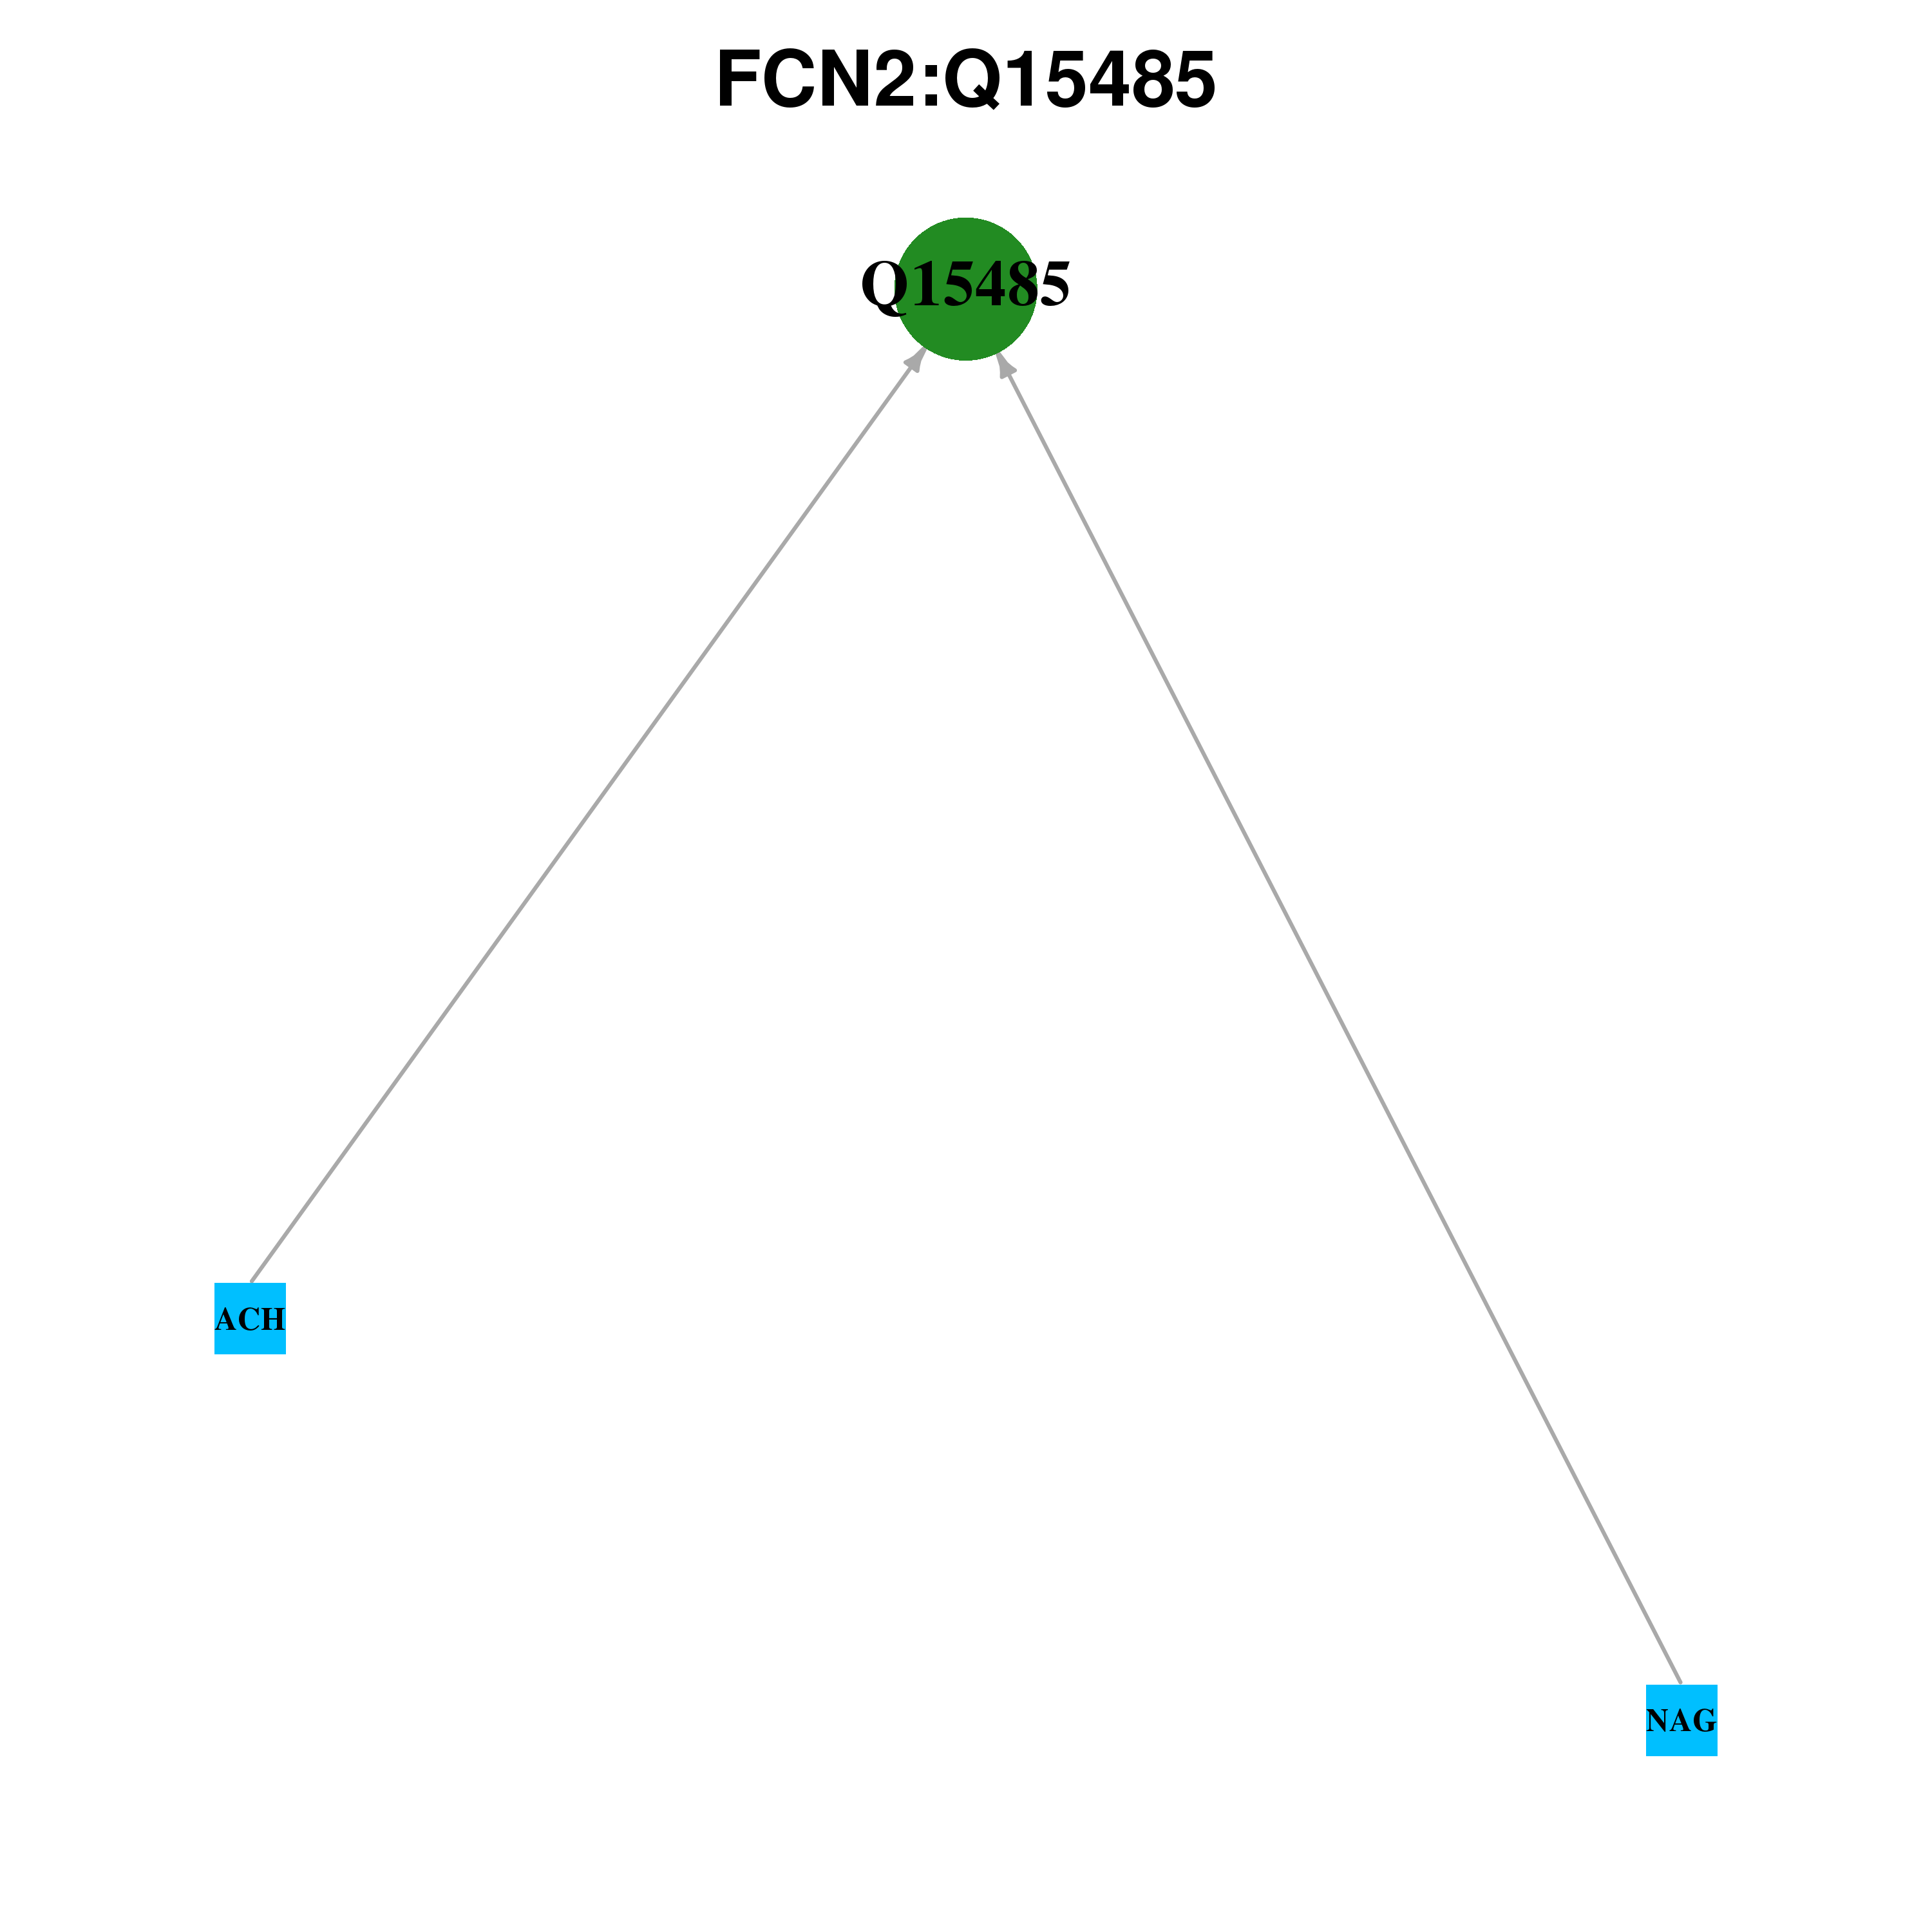 |
| Ligands binding to mutated ligand binding site of FCN2 go to BioLip |
| Ligand ID | Ligand short name | Ligand long name | PDB ID | PDB name | mutLBS |
| Top |
| Conservation information for LBS of FCN2 |
| Multiple alignments for Q15485 in multiple species |
| LBS | AA sequence | # species | Species |
 |
Copyright © 2016-Present - The University of Texas Health Science Center at Houston |