|
mutLBSgeneDB |
| |
| |
| |
| |
| |
| |
|

| Gene summary for AGO1 |
 Gene summary Gene summary |
| Basic gene Info. | Gene symbol | AGO1 |
| Gene name | argonaute RISC catalytic component 1 | |
| Synonyms | EIF2C|EIF2C1|GERP95|Q99 | |
| Cytomap | UCSC genome browser: 1p34.3 | |
| Type of gene | protein-coding | |
| RefGenes | NM_012199.2, | |
| Description | Golgi Endoplasmic Reticulum protein 95 kDaargonaute 1argonaute1eIF-2C 1eIF2C 1eukaryotic translation initiation factor 2C, 1hAgo1protein argonaute-1putative RNA-binding protein Q99 | |
| Modification date | 20141207 | |
| dbXrefs | MIM : 606228 | |
| HGNC : HGNC | ||
| HPRD : 06942 | ||
| Protein | UniProt: Q9UL18 go to UniProt's Cross Reference DB Table | |
| Expression | CleanEX: HS_AGO1 | |
| BioGPS: 26523 | ||
| Pathway | NCI Pathway Interaction Database: AGO1 | |
| KEGG: AGO1 | ||
| REACTOME: AGO1 | ||
| Pathway Commons: AGO1 | ||
| Context | iHOP: AGO1 | |
| ligand binding site mutation search in PubMed: AGO1 | ||
| UCL Cancer Institute: AGO1 | ||
| Assigned class in mutLBSgeneDB | C: This gene just belongs to mutLBSgenes. | |
| Gene ontology having evidence of Inferred from Direct Assay (IDA) from Entrez |
| GO ID | GO Term | PubMed ID | GO:0000956 | nuclear-transcribed mRNA catabolic process | 18771919 | GO:0035278 | negative regulation of translation involved in gene silencing by miRNA | 18771919 |
| Top |
| Ligand binding site mutations for AGO1 |
| Lollipop-style diagram of mutations at LBS in amino-acid sequence. We represented ligand binding site mutations only. (You can see big image via clicking.) |
 |
| Cancer type specific mutLBS sorted by frequency |
| LBS | AAchange of nsSNV | Cancer type | # samples | R278 | R278C | COAD | 2 | S218 | D216G | COAD | 1 | R790 | R790L | HNSC | 1 | K564 | L563F | HNSC | 1 | T524 | T524P | KIRC | 1 | Y527 | A528S | LUAD | 1 | R712 | R712S | LUAD | 1 | T359 | S360L | SKCM | 1 | L337 | P338S | SKCM | 1 | R712 | R712H | STAD | 1 | R759 | R759Q | STAD | 1 | H751 | S750I | UCEC | 1 |
| cf) Cancer type abbreviation. BLCA: Bladder urothelial carcinoma, BRCA: Breast invasive carcinoma, CESC: Cervical squamous cell carcinoma and endocervical adenocarcinoma, COAD: Colon adenocarcinoma, GBM: Glioblastoma multiforme, LGG: Brain lower grade glioma, HNSC: Head and neck squamous cell carcinoma, KICH: Kidney chromophobe, KIRC: Kidney renal clear cell carcinoma, KIRP: Kidney renal papillary cell carcinoma, LAML: Acute myeloid leukemia, LUAD: Lung adenocarcinoma, LUSC: Lung squamous cell carcinoma, OV: Ovarian serous cystadenocarcinoma, PAAD: Pancreatic adenocarcinoma, PRAD: Prostate adenocarcinoma, SKCM: Skin cutaneous melanoma, STAD: Stomach adenocarcinoma, THCA: Thyroid carcinoma, UCEC: Uterine corpus endometrial carcinoma. |
| Top |
| Protein structure related information for AGO1 |
| Relative protein structure stability change (ΔΔE) using Mupro 1.1 Mupro score denotes assessment of the effect of mutations on thermodynamic stability. (ΔΔE<0: mutation decreases stability, ΔΔE>0: mutation increases stability) |
 : nsSNV at non-LBS : nsSNV at non-LBS : nsSNV at LBS : nsSNV at LBS |
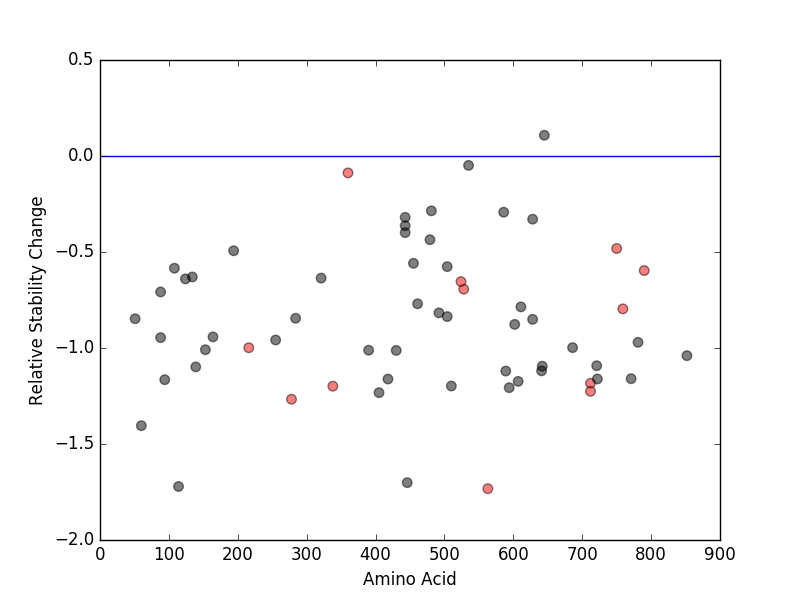 |
| nsSNVs sorted by the relative stability change of protein structure by each mutation Blue: mutations of positive stability change. and red : the most recurrent mutation for this gene. |
| LBS | AAchange of nsSNV | Relative stability change | K564 | L563F | -1.7326704 | R278 | R278C | -1.2668831 | R712 | R712H | -1.2256804 | L337 | P338S | -1.1988489 | R712 | R712S | -1.1837457 | S218 | D216G | -0.99866047 | R759 | R759Q | -0.79620053 | Y527 | A528S | -0.69347478 | T524 | T524P | -0.65421951 | R790 | R790L | -0.59662758 | H751 | S750I | -0.48155841 | T359 | S360L | -0.088127121 |
| (MuPro1.1: Jianlin Cheng et al., Prediction of Protein Stability Changes for Single-Site Mutations Using Support Vector Machines, PROTEINS: Structure, Function, and Bioinformatics. 2006, 62:1125-1132) |
| Structure image for AGO1 from PDB |
| PDB ID | PDB title | PDB structure | 4KXT | Structure of human ARGONAUTE1 in complex with guide RNA |  |
| Top |
| Differential gene expression and gene-gene network for AGO1 |
| Differential gene expression between mutated and non-mutated LBS samples in all 16 major cancer types |
| Differential co-expressed gene network based on protein-protein interaction data (CePIN) |
| Top |
| Top |
| Phenotype information for AGO1 |
| Gene level disease information (DisGeNet) |
| Disease ID | Disease name | # PubMed | Association type |
| Mutation level pathogenic information (ClinVar annotation) |
| Allele ID | AA change | Clinical significance | Origin | Phenotype IDs |
| Top |
| Pharmacological information for AGO1 |
| Gene expression profile of anticancer drug treated cell-lines (CCLE) Heatmap showing the correlation between gene expression and drug response across all the cell-lines. We chose the top 20 among 138 drugs.We used Pearson's correlation coefficient. |
 |
| Drug information targeting mutLBSgene (Approved drugs only) |
| Drug status | DrugBank ID | Name | Type | Drug structure |
| Gene-centered ligand-gene interaction network |
 |
| Ligands binding to mutated ligand binding site of AGO1 go to BioLip |
| Ligand ID | Ligand short name | Ligand long name | PDB ID | PDB name | mutLBS | NUC | Nucleic Acids | 1si2 | A | R278 L337 | NUC | Nucleic Acids | 1si3 | A | R278 L337 | NUC | Nucleic Acids | 4kxt | A | S218 L337 T359 T524 Y527 K564 R712 H751 R759 R790 | NUC | Nucleic Acids | 4kre | A | S218 L337 T359 Y527 K564 R712 H751 R759 R790 | NUC | Nucleic Acids | 4krf | A | S218 L337 T524 Y527 K564 R712 H751 R759 R790 |
| Top |
| Conservation information for LBS of AGO1 |
| Multiple alignments for Q9UL18 in multiple species |
| LBS | AA sequence | # species | Species |
 |
Copyright © 2016-Present - The University of Texas Health Science Center at Houston |