|
mutLBSgeneDB |
| |
| |
| |
| |
| |
| |
|

| Gene summary for GDF2 |
 Gene summary Gene summary |
| Basic gene Info. | Gene symbol | GDF2 |
| Gene name | growth differentiation factor 2 | |
| Synonyms | BMP-9|BMP9|HHT5 | |
| Cytomap | UCSC genome browser: 10q11.22 | |
| Type of gene | protein-coding | |
| RefGenes | NM_016204.2, | |
| Description | GDF-2bone morphogenetic protein 9growth/differentiation factor 2 | |
| Modification date | 20141219 | |
| dbXrefs | MIM : 605120 | |
| HGNC : HGNC | ||
| Ensembl : ENSG00000263761 | ||
| HPRD : 05492 | ||
| Vega : OTTHUMG00000188320 | ||
| Protein | UniProt: Q9UK05 go to UniProt's Cross Reference DB Table | |
| Expression | CleanEX: HS_GDF2 | |
| BioGPS: 2658 | ||
| Pathway | NCI Pathway Interaction Database: GDF2 | |
| KEGG: GDF2 | ||
| REACTOME: GDF2 | ||
| Pathway Commons: GDF2 | ||
| Context | iHOP: GDF2 | |
| ligand binding site mutation search in PubMed: GDF2 | ||
| UCL Cancer Institute: GDF2 | ||
| Assigned class in mutLBSgeneDB | C: This gene just belongs to mutLBSgenes. | |
| Gene ontology having evidence of Inferred from Direct Assay (IDA) from Entrez |
| GO ID | GO Term | PubMed ID | GO:0001569 | patterning of blood vessels | 20406889 | GO:0001937 | negative regulation of endothelial cell proliferation | 20406889 | GO:0001938 | positive regulation of endothelial cell proliferation | 20406889 | GO:0010596 | negative regulation of endothelial cell migration | 17068149 | GO:0010862 | positive regulation of pathway-restricted SMAD protein phosphorylation | 17068149 | GO:0030308 | negative regulation of cell growth | 17068149 | GO:0030509 | BMP signaling pathway | 17068149 | GO:0032757 | positive regulation of interleukin-8 production | 19366699 | GO:0032924 | activin receptor signaling pathway | 17068149 | GO:0045766 | positive regulation of angiogenesis | 20406889 | GO:0045893 | positive regulation of transcription, DNA-templated | 17068149 | GO:0045944 | positive regulation of transcription from RNA polymerase II promoter | 19366699 | GO:0048514 | blood vessel morphogenesis | 20406889 | GO:0060389 | pathway-restricted SMAD protein phosphorylation | 17068149 | GO:0071773 | cellular response to BMP stimulus | 19366699 | GO:2000279 | negative regulation of DNA biosynthetic process | 19366699 |
| Top |
| Ligand binding site mutations for GDF2 |
| Lollipop-style diagram of mutations at LBS in amino-acid sequence. We represented ligand binding site mutations only. (You can see big image via clicking.) |
 |
| Cancer type specific mutLBS sorted by frequency |
| LBS | AAchange of nsSNV | Cancer type | # samples | H381 | K383N | BRCA | 1 |
| cf) Cancer type abbreviation. BLCA: Bladder urothelial carcinoma, BRCA: Breast invasive carcinoma, CESC: Cervical squamous cell carcinoma and endocervical adenocarcinoma, COAD: Colon adenocarcinoma, GBM: Glioblastoma multiforme, LGG: Brain lower grade glioma, HNSC: Head and neck squamous cell carcinoma, KICH: Kidney chromophobe, KIRC: Kidney renal clear cell carcinoma, KIRP: Kidney renal papillary cell carcinoma, LAML: Acute myeloid leukemia, LUAD: Lung adenocarcinoma, LUSC: Lung squamous cell carcinoma, OV: Ovarian serous cystadenocarcinoma, PAAD: Pancreatic adenocarcinoma, PRAD: Prostate adenocarcinoma, SKCM: Skin cutaneous melanoma, STAD: Stomach adenocarcinoma, THCA: Thyroid carcinoma, UCEC: Uterine corpus endometrial carcinoma. |
| Top |
| Protein structure related information for GDF2 |
| Relative protein structure stability change (ΔΔE) using Mupro 1.1 Mupro score denotes assessment of the effect of mutations on thermodynamic stability. (ΔΔE<0: mutation decreases stability, ΔΔE>0: mutation increases stability) |
 : nsSNV at non-LBS : nsSNV at non-LBS : nsSNV at LBS : nsSNV at LBS |
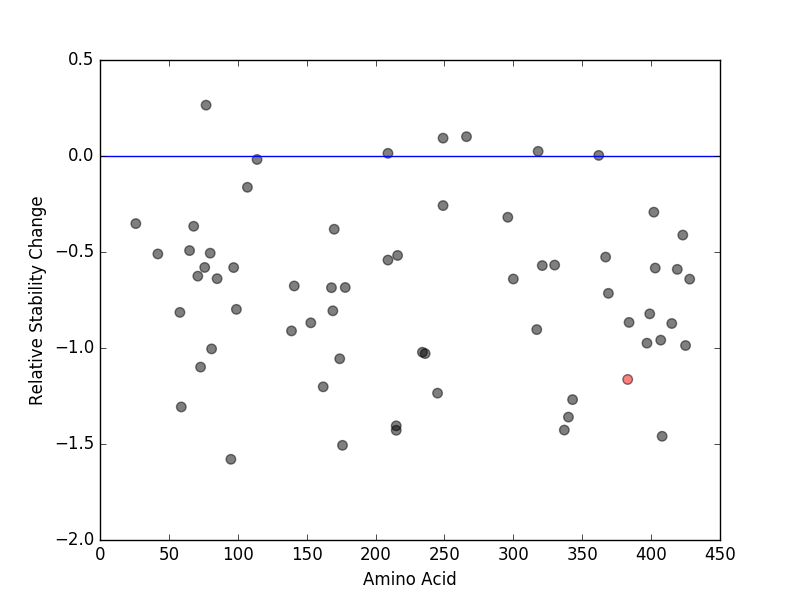 |
| nsSNVs sorted by the relative stability change of protein structure by each mutation Blue: mutations of positive stability change. and red : the most recurrent mutation for this gene. |
| LBS | AAchange of nsSNV | Relative stability change | H381 | K383N | -1.1637763 |
| (MuPro1.1: Jianlin Cheng et al., Prediction of Protein Stability Changes for Single-Site Mutations Using Support Vector Machines, PROTEINS: Structure, Function, and Bioinformatics. 2006, 62:1125-1132) |
| Structure image for GDF2 from PDB |
| Top |
| Differential gene expression and gene-gene network for GDF2 |
| Differential gene expression between mutated and non-mutated LBS samples in all 16 major cancer types |
| Differential co-expressed gene network based on protein-protein interaction data (CePIN) |
| Top |
| Top |
| Phenotype information for GDF2 |
| Gene level disease information (DisGeNet) |
| Disease ID | Disease name | # PubMed | Association type |
| umls:C2239176 | Carcinoma, Hepatocellular | 2 | Biomarker |
| umls:C3809710 | TELANGIECTASIA, HEREDITARY HEMORRHAGIC, TYPE 5 | 1 | GeneticVariation |
| Mutation level pathogenic information (ClinVar annotation) |
| Allele ID | AA change | Clinical significance | Origin | Phenotype IDs |
| Top |
| Pharmacological information for GDF2 |
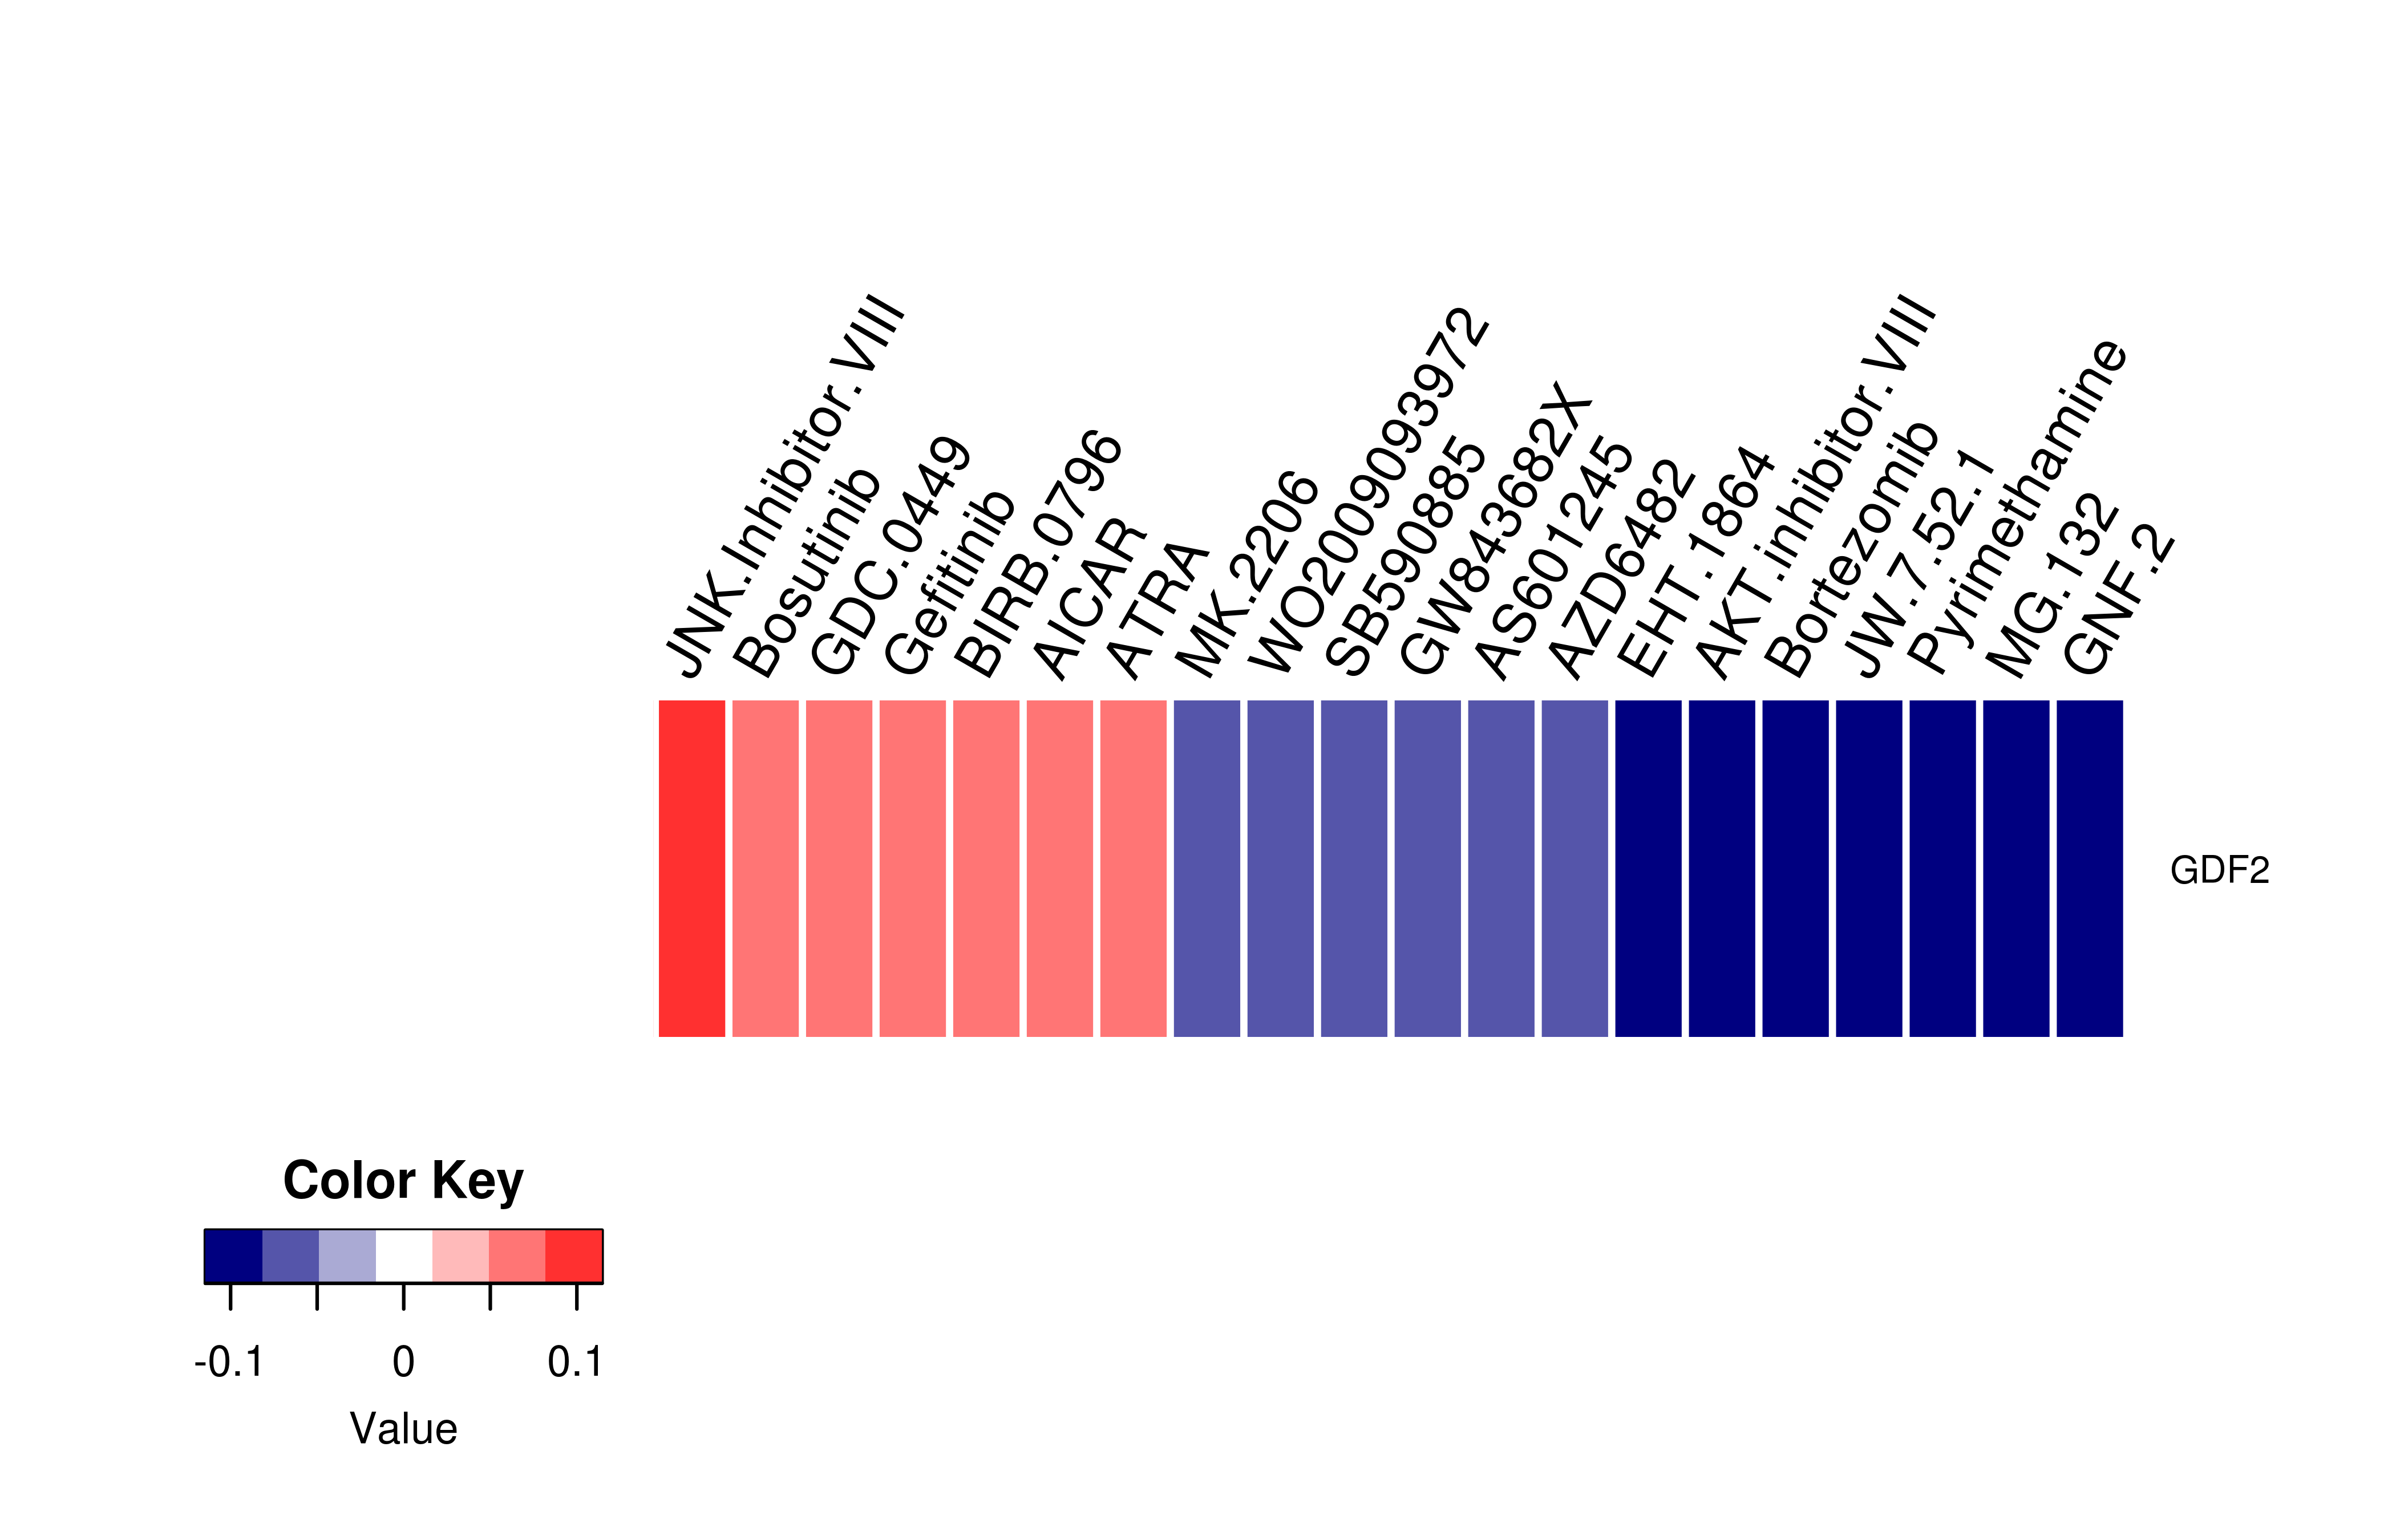
| Gene expression profile of anticancer drug treated cell-lines (CCLE) Heatmap showing the correlation between gene expression and drug response across all the cell-lines. We chose the top 20 among 138 drugs.We used Pearson's correlation coefficient. |
 |
| Drug information targeting mutLBSgene (Approved drugs only) |
| Drug status | DrugBank ID | Name | Type | Drug structure |
| Gene-centered ligand-gene interaction network |
 |
| Ligands binding to mutated ligand binding site of GDF2 go to BioLip |
| Ligand ID | Ligand short name | Ligand long name | PDB ID | PDB name | mutLBS |
| Top |
| Conservation information for LBS of GDF2 |
| Multiple alignments for Q9UK05 in multiple species |
| LBS | AA sequence | # species | Species | H381 | VQTLVHLKFPT | 2 | Homo sapiens, Mus musculus | H381 | VQTLVHLQNPK | 1 | Gallus gallus | K390 | PTKVGKACCVP | 2 | Homo sapiens, Mus musculus | K390 | PKKASKACCVP | 1 | Gallus gallus |
 |
Copyright © 2016-Present - The University of Texas Health Science Center at Houston |