|
mutLBSgeneDB |
| |
| |
| |
| |
| |
| |
|

| Gene summary for INSR |
 Gene summary Gene summary |
| Basic gene Info. | Gene symbol | INSR |
| Gene name | insulin receptor | |
| Synonyms | CD220|HHF5 | |
| Cytomap | UCSC genome browser: 19p13.3-p13.2 | |
| Type of gene | protein-coding | |
| RefGenes | NM_000208.2, NM_001079817.1, | |
| Description | IR | |
| Modification date | 20141207 | |
| dbXrefs | MIM : 147670 | |
| HGNC : HGNC | ||
| Ensembl : ENSG00000171105 | ||
| HPRD : 00975 | ||
| Vega : OTTHUMG00000181992 | ||
| Protein | UniProt: P06213 go to UniProt's Cross Reference DB Table | |
| Expression | CleanEX: HS_INSR | |
| BioGPS: 3643 | ||
| Pathway | NCI Pathway Interaction Database: INSR | |
| KEGG: INSR | ||
| REACTOME: INSR | ||
| Pathway Commons: INSR | ||
| Context | iHOP: INSR | |
| ligand binding site mutation search in PubMed: INSR | ||
| UCL Cancer Institute: INSR | ||
| Assigned class in mutLBSgeneDB | A: This gene has a literature evidence and it belongs to targetable_mutLBSgenes. | |
| References showing study about ligand binding site mutation for INSR. | 1. Alzahrani, A. S., Zou, M., Baitei, E. Y., Parhar, R. S., Al‐Kahtani, N., Raef, H., ... & Meyer, B. F. (2012). Molecular characterization of a novel p. R118C mutation in the insulin receptor gene from patients with severe insulin resistance. Clinical endocrinology, 76(4), 540-547. 22017372 2. Yin, Y., Hua, H., Li, M., Liu, S., Kong, Q., Shao, T., ... & Jiang, Y. (2015). mTORC2 promotes type I insulin-like growth factor receptor and insulin receptor activation through the tyrosine kinase activity of mTOR. Cell Research. 26584640 | |
| Gene ontology having evidence of Inferred from Direct Assay (IDA) from Entrez |
| GO ID | GO Term | PubMed ID | GO:0001934 | positive regulation of protein phosphorylation | 7556070 | GO:0007186 | G-protein coupled receptor signaling pathway | 9092559 | GO:0008284 | positive regulation of cell proliferation | 17925406 | GO:0008286 | insulin receptor signaling pathway | 6849137 | GO:0018108 | peptidyl-tyrosine phosphorylation | 8496180 | GO:0023014 | signal transduction by phosphorylation | 6849137 | GO:0032148 | activation of protein kinase B activity | 7556070 | GO:0032869 | cellular response to insulin stimulus | 8440175 | GO:0045725 | positive regulation of glycogen biosynthetic process | 17925406 | GO:0046326 | positive regulation of glucose import | 3518947 | GO:0046777 | protein autophosphorylation | 6849137 | GO:0051290 | protein heterotetramerization | 1898103 | GO:0060267 | positive regulation of respiratory burst | 9092559 |
| Top |
| Ligand binding site mutations for INSR |
| Lollipop-style diagram of mutations at LBS in amino-acid sequence. We represented ligand binding site mutations only. (You can see big image via clicking.) |
 |
| Cancer type specific mutLBS sorted by frequency |
| LBS | AAchange of nsSNV | Cancer type | # samples | R279 | D277N | GBM | 1 | G1211 | G1211V | HNSC | 1 | Y272 | Y272H | KIRC | 1 | N738 | V739L | OV | 1 | W1202 | A1204T | SKCM | 1 | H737 | L736M | SKCM | 1 | V1086 | V1086M | UCEC | 1 | E147 | E147K | UCEC | 1 | E1067 | R1068W | UCEC | 1 |
| cf) Cancer type abbreviation. BLCA: Bladder urothelial carcinoma, BRCA: Breast invasive carcinoma, CESC: Cervical squamous cell carcinoma and endocervical adenocarcinoma, COAD: Colon adenocarcinoma, GBM: Glioblastoma multiforme, LGG: Brain lower grade glioma, HNSC: Head and neck squamous cell carcinoma, KICH: Kidney chromophobe, KIRC: Kidney renal clear cell carcinoma, KIRP: Kidney renal papillary cell carcinoma, LAML: Acute myeloid leukemia, LUAD: Lung adenocarcinoma, LUSC: Lung squamous cell carcinoma, OV: Ovarian serous cystadenocarcinoma, PAAD: Pancreatic adenocarcinoma, PRAD: Prostate adenocarcinoma, SKCM: Skin cutaneous melanoma, STAD: Stomach adenocarcinoma, THCA: Thyroid carcinoma, UCEC: Uterine corpus endometrial carcinoma. |
| Top |
| Protein structure related information for INSR |
| Relative protein structure stability change (ΔΔE) using Mupro 1.1 Mupro score denotes assessment of the effect of mutations on thermodynamic stability. (ΔΔE<0: mutation decreases stability, ΔΔE>0: mutation increases stability) |
 : nsSNV at non-LBS : nsSNV at non-LBS : nsSNV at LBS : nsSNV at LBS |
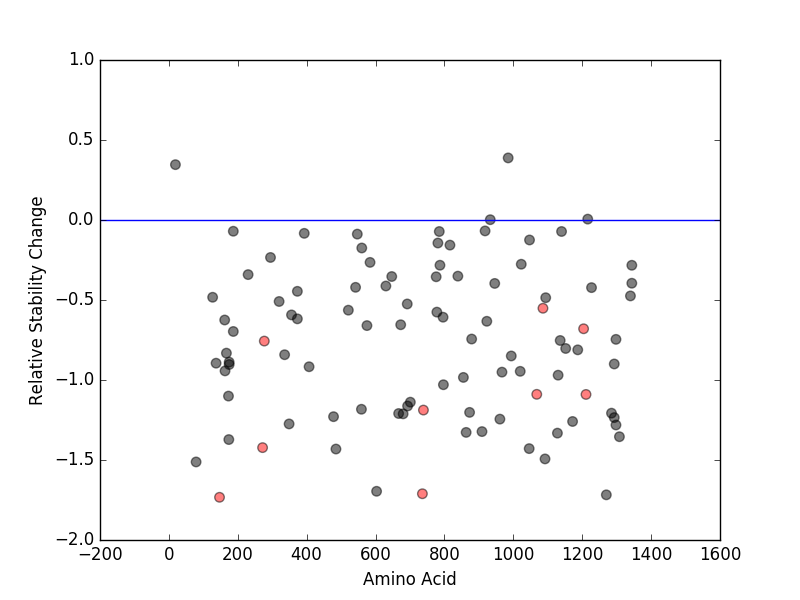 |
| nsSNVs sorted by the relative stability change of protein structure by each mutation Blue: mutations of positive stability change. and red : the most recurrent mutation for this gene. |
| LBS | AAchange of nsSNV | Relative stability change | E147 | E147K | -1.7330412 | H737 | L736M | -1.710896 | Y272 | Y272H | -1.4226692 | N738 | V739L | -1.1879648 | G1211 | G1211V | -1.090279 | E1067 | R1068W | -1.0895111 | R279 | D277N | -0.75675659 | W1202 | A1204T | -0.67979904 | V1086 | V1086M | -0.55162408 |
| (MuPro1.1: Jianlin Cheng et al., Prediction of Protein Stability Changes for Single-Site Mutations Using Support Vector Machines, PROTEINS: Structure, Function, and Bioinformatics. 2006, 62:1125-1132) |
| Structure image for INSR from PDB |
| Top |
| Differential gene expression and gene-gene network for INSR |
| Differential gene expression between mutated and non-mutated LBS samples in all 16 major cancer types |
| Differential co-expressed gene network based on protein-protein interaction data (CePIN) |
| Top |
| Top |
| Phenotype information for INSR |
| Gene level disease information (DisGeNet) |
| Disease ID | Disease name | # PubMed | Association type |
| umls:C0011860 | Diabetes Mellitus, Type 2 | 106 | Biomarker, GeneticVariation |
| umls:C0265344 | Donohue Syndrome | 41 | Biomarker, GeneticVariation |
| umls:C0020459 | Hyperinsulinism | 27 | AlteredExpression, Biomarker |
| umls:C0271695 | Rabson-Mendenhall syndrome | 15 | Biomarker, GeneticVariation |
| umls:C0020456 | Hyperglycemia | 14 | Biomarker |
| umls:C0271650 | Glucose Intolerance | 9 | Biomarker, GeneticVariation |
| umls:C0021655 | Insulin Resistance | 8 | Biomarker, GeneticVariation |
| umls:C0011853 | Diabetes Mellitus, Experimental | 5 | Biomarker |
| umls:C0024115 | Lung Diseases | 2 | Biomarker |
| umls:C0011882 | Diabetic Neuropathies | 1 | Biomarker |
| umls:C0235833 | Hernias, Diaphragmatic, Congenital | 1 | Biomarker |
| umls:C0020429 | Hyperalgesia | 1 | Biomarker |
| umls:C0752347 | Lewy Body Disease | 1 | Biomarker |
| umls:C0030567 | Parkinson Disease | 1 | Biomarker |
| umls:C0236969 | Substance-Related Disorders | 1 | Biomarker |
| Mutation level pathogenic information (ClinVar annotation) |
| Allele ID | AA change | Clinical significance | Origin | Phenotype IDs |
| Top |
| Pharmacological information for INSR |
| Gene expression profile of anticancer drug treated cell-lines (CCLE) Heatmap showing the correlation between gene expression and drug response across all the cell-lines. We chose the top 20 among 138 drugs.We used Pearson's correlation coefficient. |
 |
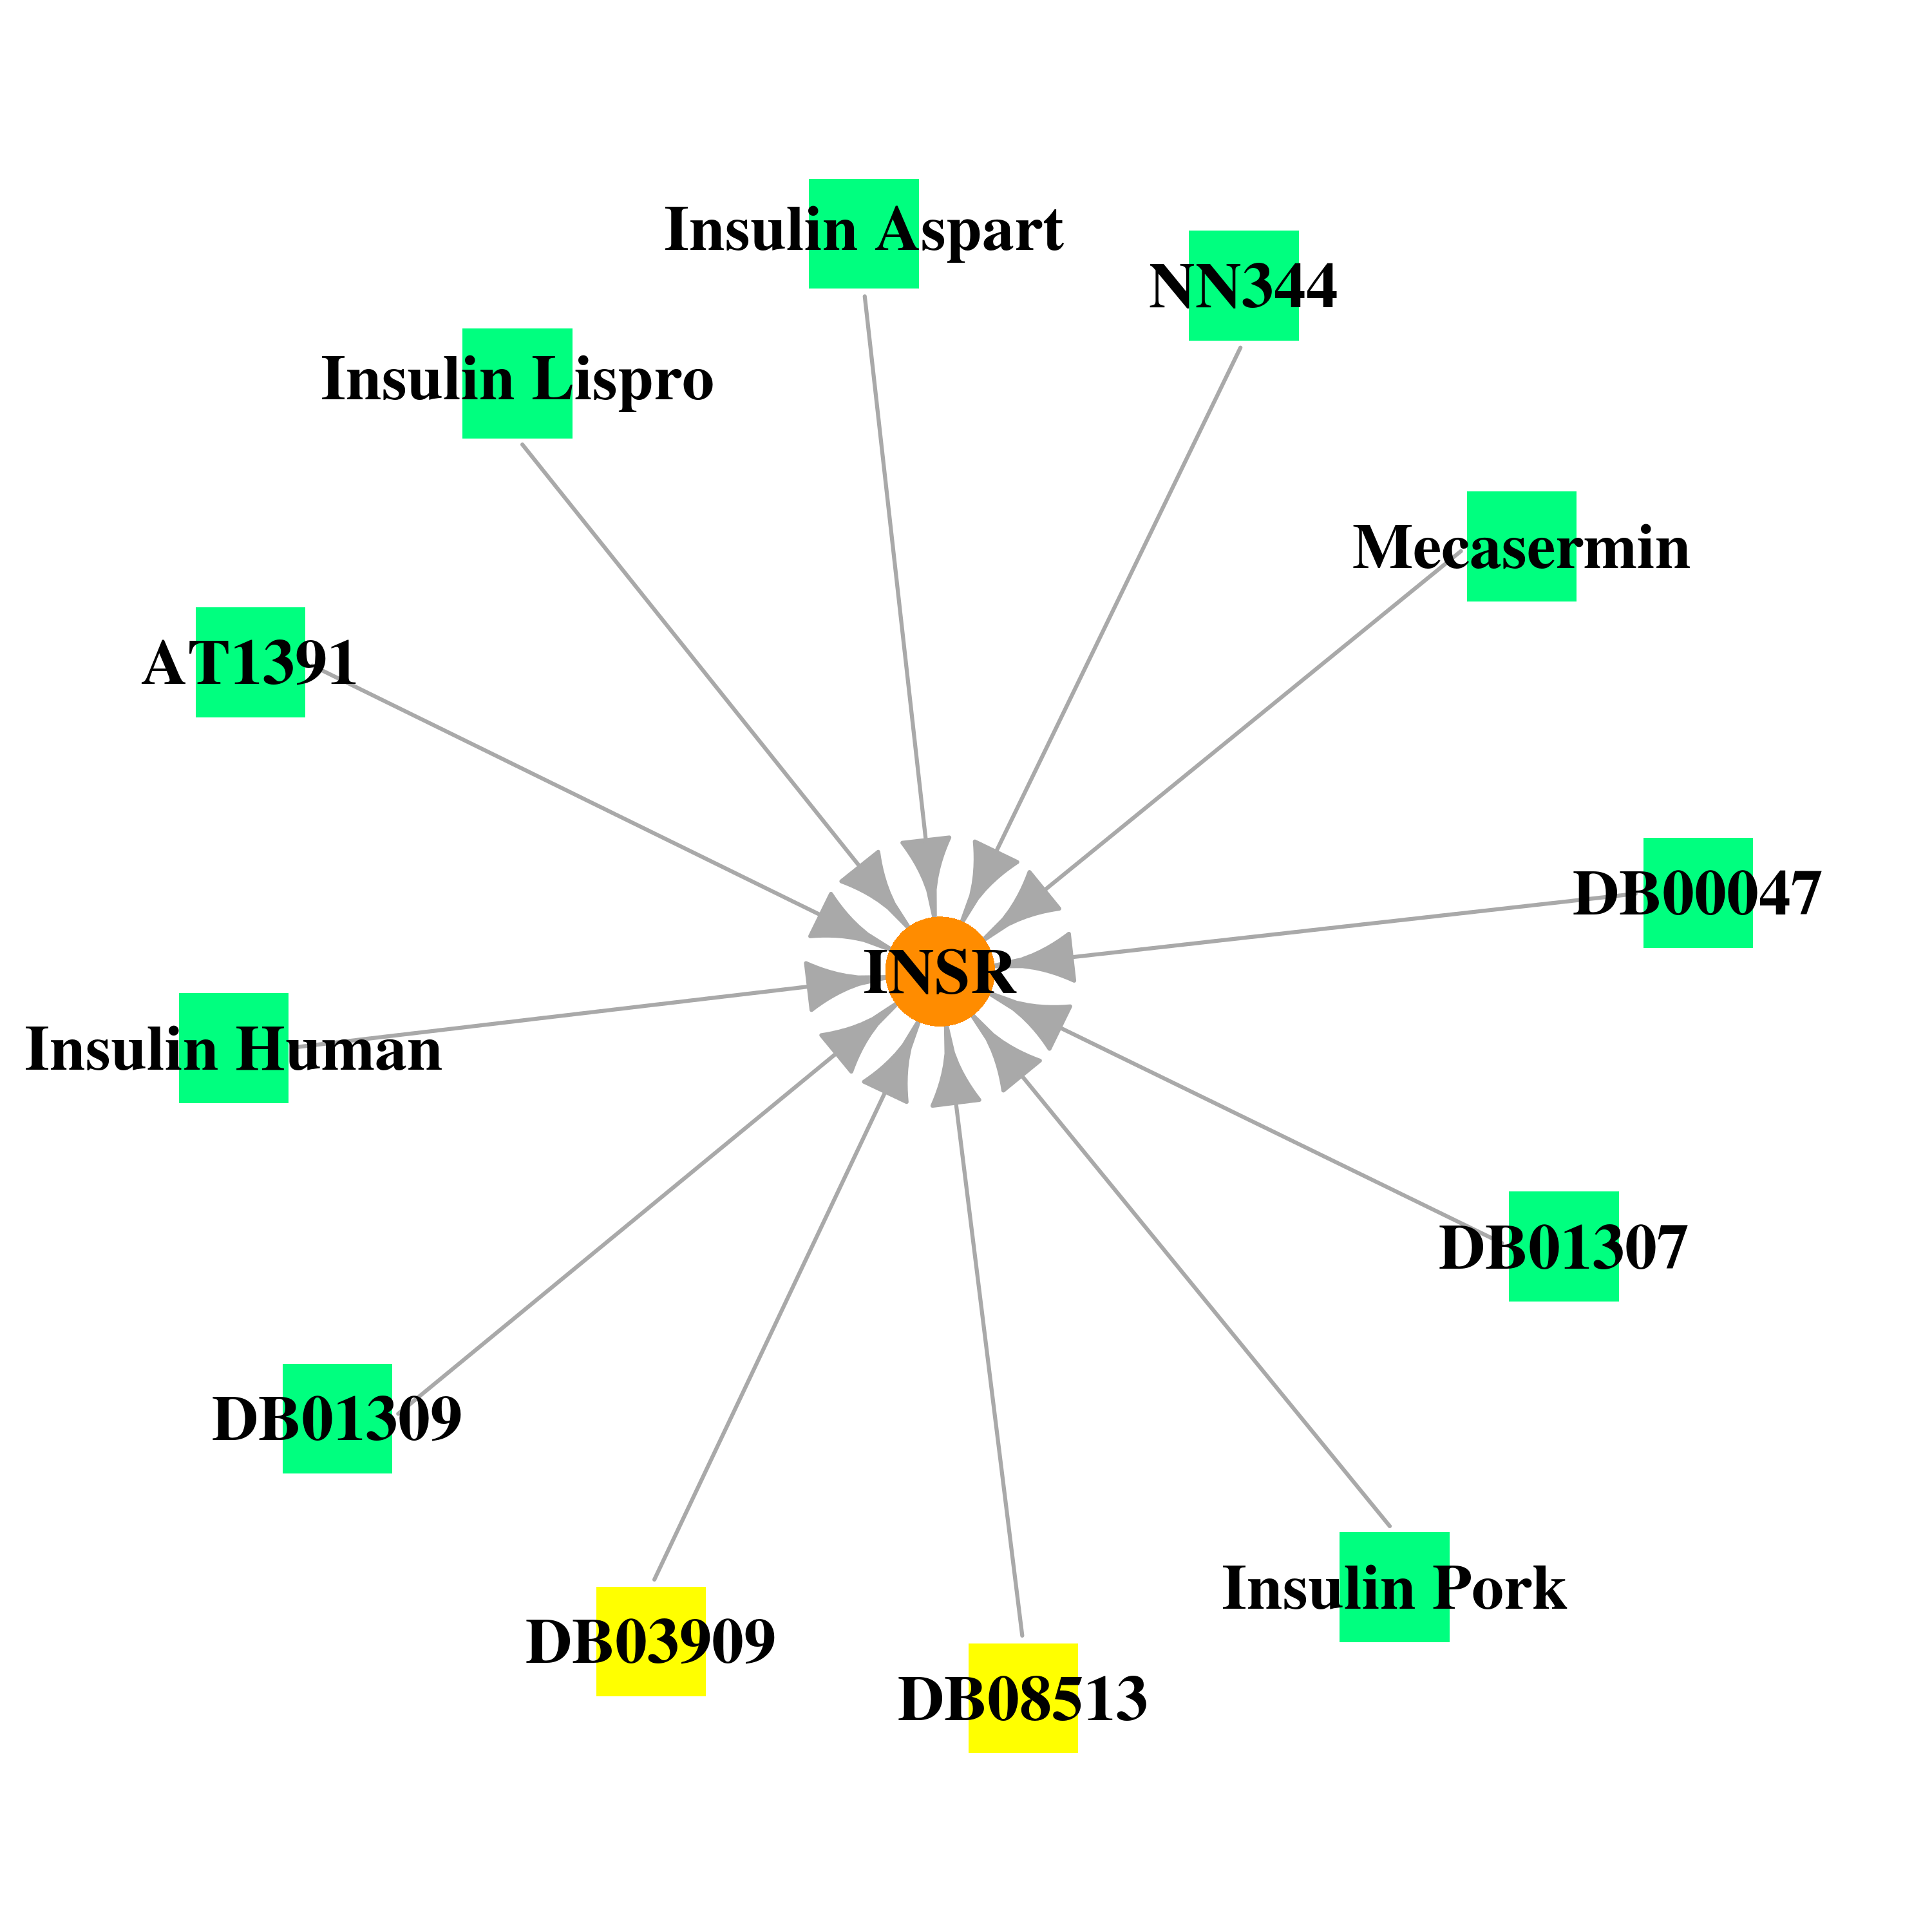
| Gene-centered drug-gene interaction network |
 |
| Drug information targeting mutLBSgene (Approved drugs only) |
| Drug status | DrugBank ID | Name | Type | Drug structure |
| Approved|investigational | DB00030 | Insulin Human | Biotech |  |
| Approved | DB00046 | Insulin Lispro | Biotech |  |
| Approved | DB00047 | Insulin Glargine | Biotech |  |
| Approved | DB00071 | Insulin Pork | Biotech |  |
| Approved|investigational | DB01277 | Mecasermin | Biotech |  |
| Approved | DB01306 | Insulin Aspart | Biotech |  |
| Approved | DB01307 | Insulin Detemir | Biotech |  |
| Approved | DB01309 | Insulin Glulisine | Biotech |  |
| Experimental | DB03909 | Adenosine-5'-[Beta, Gamma-Methylene]Triphosphate | Small molecule |  |
| Investigational | DB05115 | NN344 | Small molecule |  |
| Investigational | DB05120 | AT1391 | Small molecule |  |
| Experimental | DB08513 | [4-({5-(AMINOCARBONYL)-4-[(3-METHYLPHENYL)AMINO]PYRIMIDIN-2-YL}AMINO)PHENYL]ACETIC ACID | Small molecule | 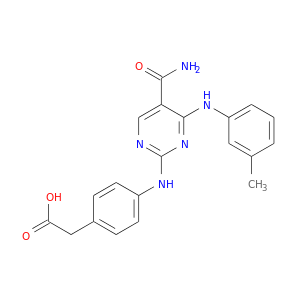 |
| Gene-centered ligand-gene interaction network |
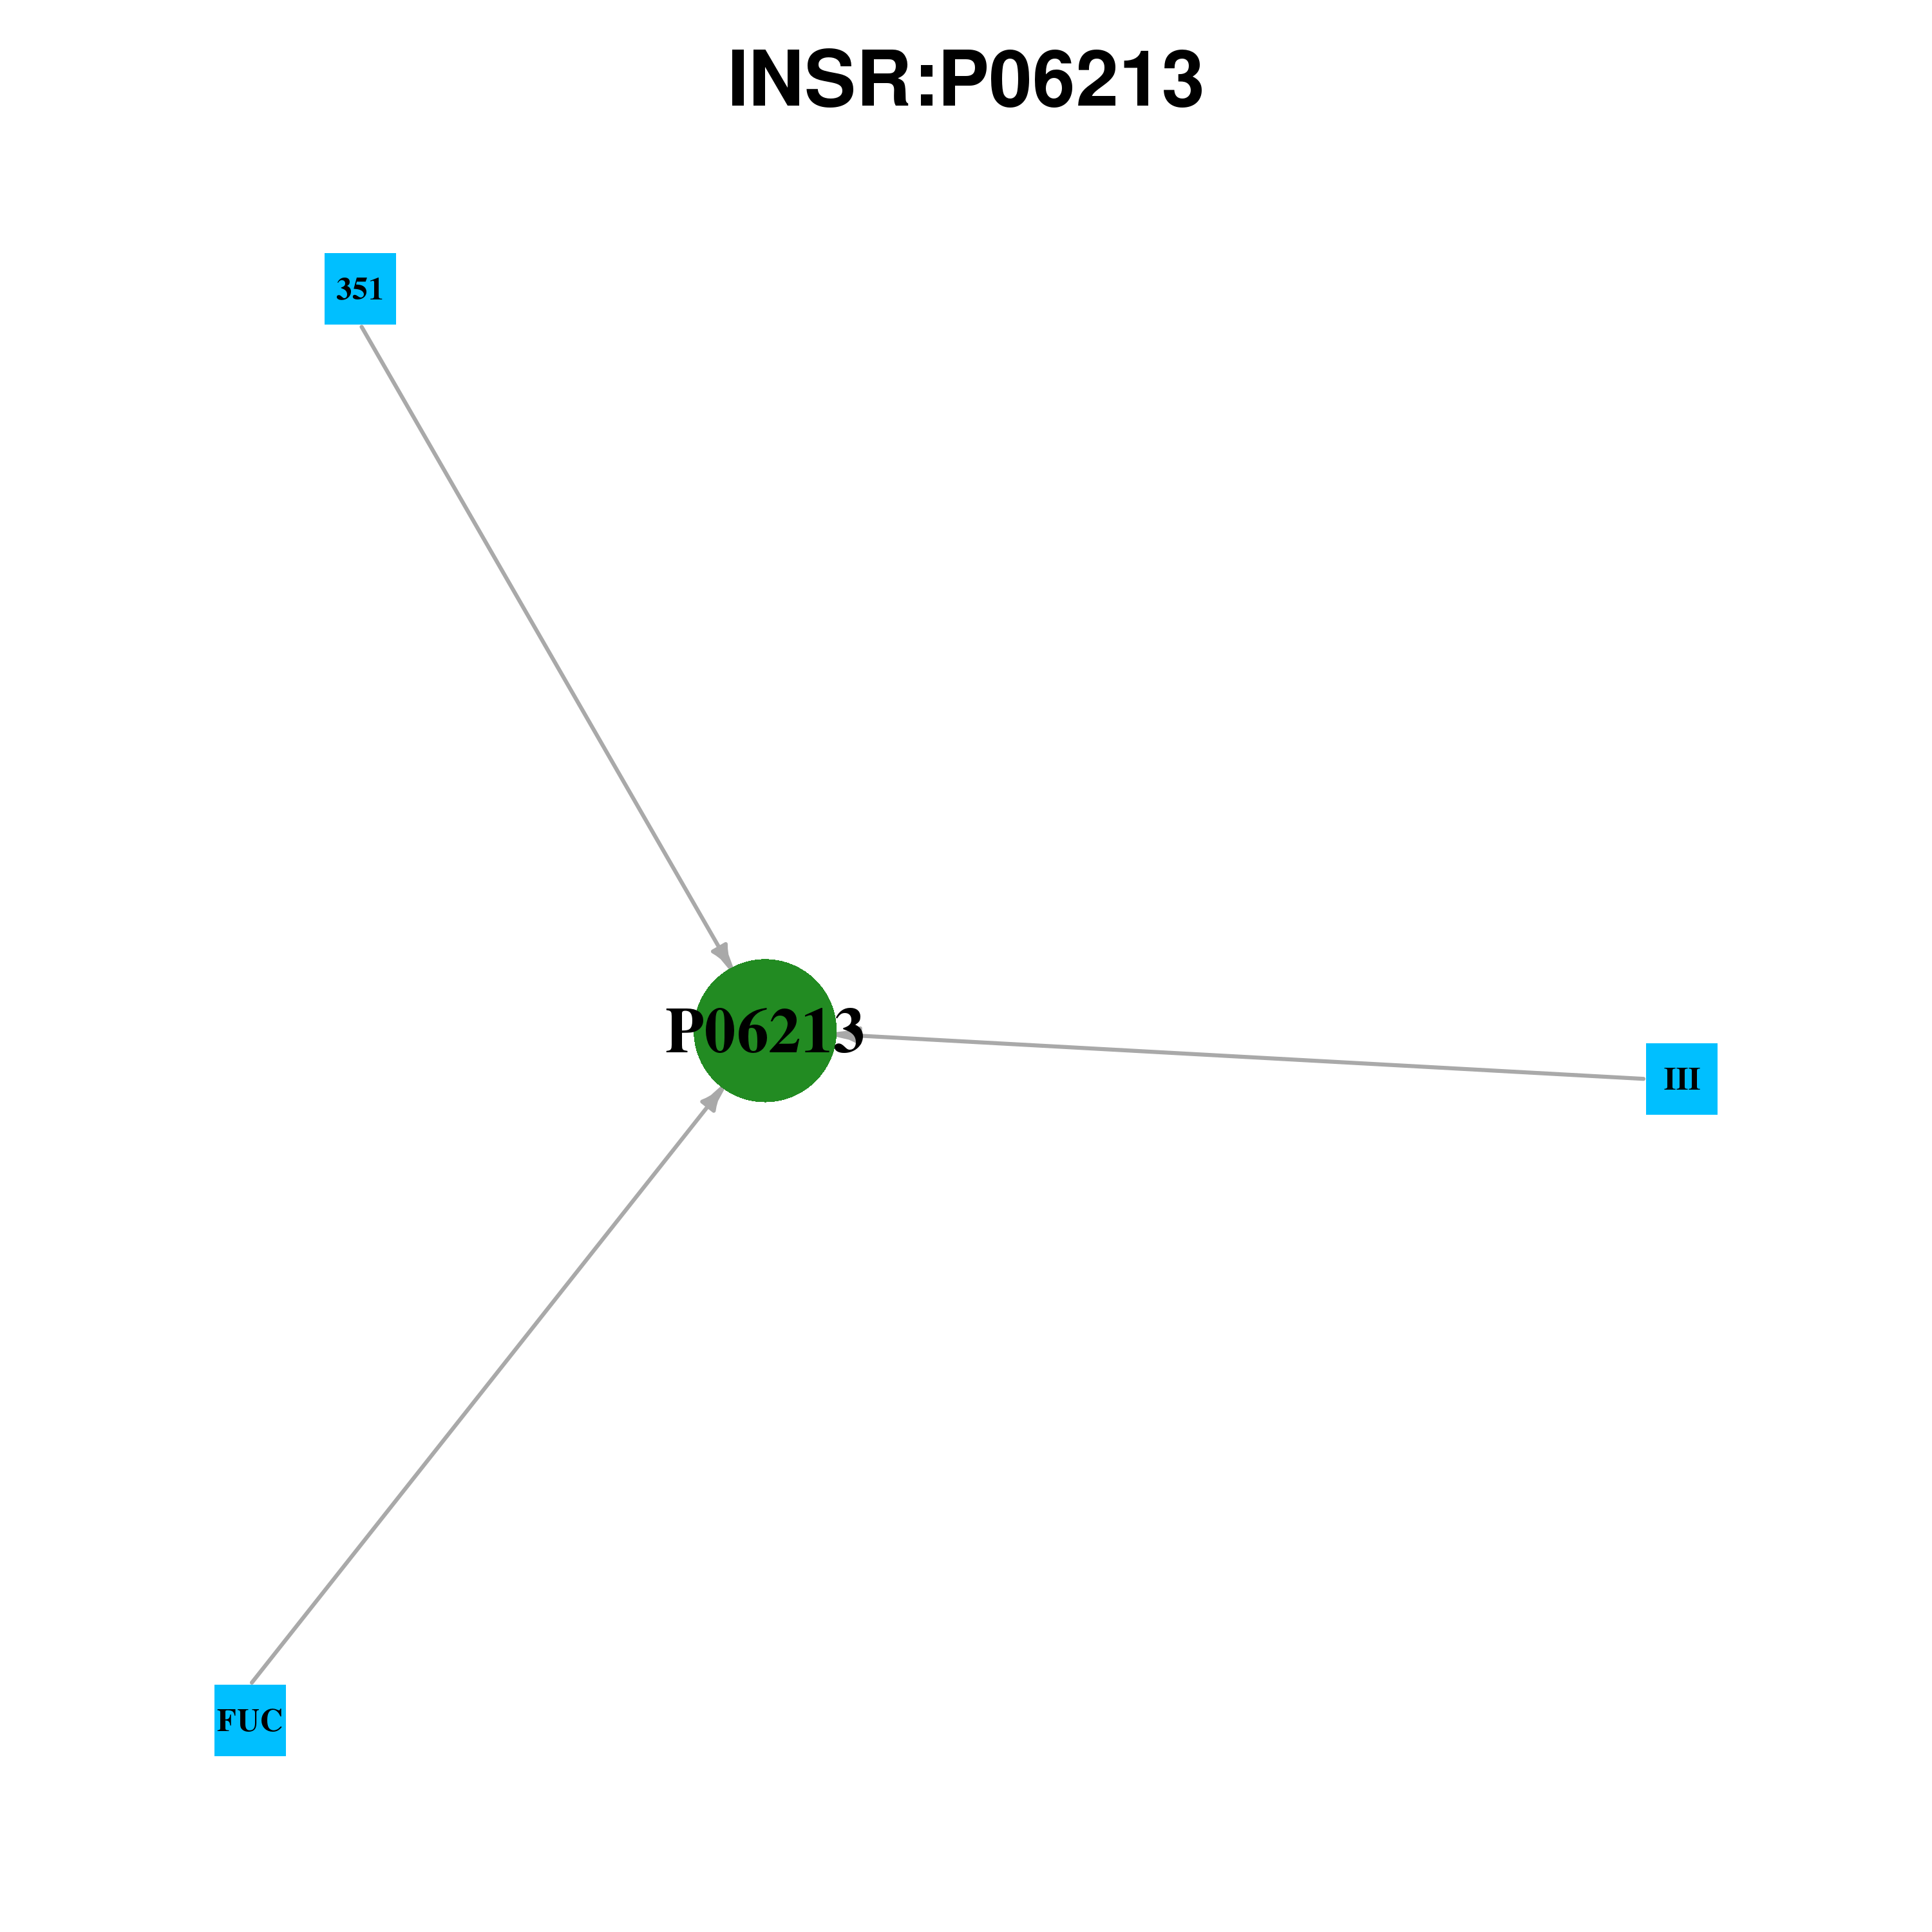 |
| Ligands binding to mutated ligand binding site of INSR go to BioLip |
| Ligand ID | Ligand short name | Ligand long name | PDB ID | PDB name | mutLBS |
| Top |
| Conservation information for LBS of INSR |
| Multiple alignments for P06213 in multiple species |
| LBS | AA sequence | # species | Species |
 |
Copyright © 2016-Present - The University of Texas Health Science Center at Houston |