|
mutLBSgeneDB |
| |
| |
| |
| |
| |
| |
|

| Gene summary for MAX |
 Gene summary Gene summary |
| Basic gene Info. | Gene symbol | MAX |
| Gene name | MYC associated factor X | |
| Synonyms | bHLHd4 | |
| Cytomap | UCSC genome browser: 14q23 | |
| Type of gene | protein-coding | |
| RefGenes | NM_001271068.1, NM_001271069.1,NM_002382.4,NM_145112.2,NM_145113.2, NM_145114.2,NM_197957.3,NR_073137.1,NR_073138.1, NM_145116.1, | |
| Description | class D basic helix-loop-helix protein 4protein max | |
| Modification date | 20141219 | |
| dbXrefs | MIM : 154950 | |
| HGNC : HGNC | ||
| Ensembl : ENSG00000125952 | ||
| HPRD : 01113 | ||
| Vega : OTTHUMG00000142809 | ||
| Protein | UniProt: P61244 go to UniProt's Cross Reference DB Table | |
| Expression | CleanEX: HS_MAX | |
| BioGPS: 4149 | ||
| Pathway | NCI Pathway Interaction Database: MAX | |
| KEGG: MAX | ||
| REACTOME: MAX | ||
| Pathway Commons: MAX | ||
| Context | iHOP: MAX | |
| ligand binding site mutation search in PubMed: MAX | ||
| UCL Cancer Institute: MAX | ||
| Assigned class in mutLBSgeneDB | B: This gene belongs to targetable_mutLBSgenes. | |
| Gene ontology having evidence of Inferred from Direct Assay (IDA) from Entrez |
| GO ID | GO Term | PubMed ID |
| Top |
| Ligand binding site mutations for MAX |
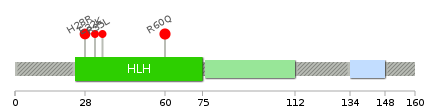
| Lollipop-style diagram of mutations at LBS in amino-acid sequence. We represented ligand binding site mutations only. (You can see big image via clicking.) |
 |
| Cancer type specific mutLBS sorted by frequency |
| LBS | AAchange of nsSNV | Cancer type | # samples | H28 | H28R | UCEC | 4 | R60 | R60Q | UCEC | 3 | E32 | E32K | COAD | 1 | R60 | R60Q | LAML | 1 | R35 | R35L | LUAD | 1 | R60 | R60Q | STAD | 1 |
| cf) Cancer type abbreviation. BLCA: Bladder urothelial carcinoma, BRCA: Breast invasive carcinoma, CESC: Cervical squamous cell carcinoma and endocervical adenocarcinoma, COAD: Colon adenocarcinoma, GBM: Glioblastoma multiforme, LGG: Brain lower grade glioma, HNSC: Head and neck squamous cell carcinoma, KICH: Kidney chromophobe, KIRC: Kidney renal clear cell carcinoma, KIRP: Kidney renal papillary cell carcinoma, LAML: Acute myeloid leukemia, LUAD: Lung adenocarcinoma, LUSC: Lung squamous cell carcinoma, OV: Ovarian serous cystadenocarcinoma, PAAD: Pancreatic adenocarcinoma, PRAD: Prostate adenocarcinoma, SKCM: Skin cutaneous melanoma, STAD: Stomach adenocarcinoma, THCA: Thyroid carcinoma, UCEC: Uterine corpus endometrial carcinoma. |
| Top |
| Protein structure related information for MAX |
| Relative protein structure stability change (ΔΔE) using Mupro 1.1 Mupro score denotes assessment of the effect of mutations on thermodynamic stability. (ΔΔE<0: mutation decreases stability, ΔΔE>0: mutation increases stability) |
 : nsSNV at non-LBS : nsSNV at non-LBS : nsSNV at LBS : nsSNV at LBS |
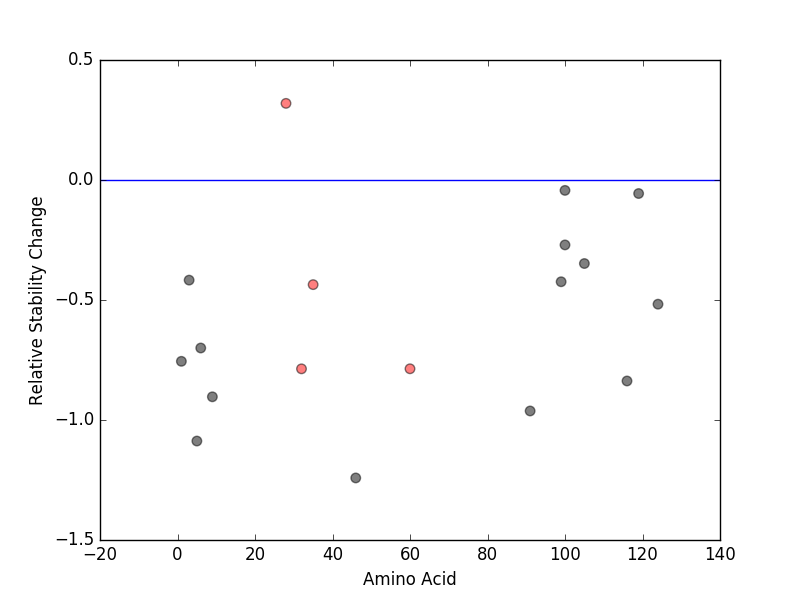 |
| nsSNVs sorted by the relative stability change of protein structure by each mutation Blue: mutations of positive stability change. and red : the most recurrent mutation for this gene. |
| LBS | AAchange of nsSNV | Relative stability change | H28 | H28R | 0.31931916 | E32 | E32K | -0.78680892 | R60 | R60Q | -0.78659386 | R35 | R35L | -0.43592858 |
| (MuPro1.1: Jianlin Cheng et al., Prediction of Protein Stability Changes for Single-Site Mutations Using Support Vector Machines, PROTEINS: Structure, Function, and Bioinformatics. 2006, 62:1125-1132) |
| Structure image for MAX from PDB |
| PDB ID | PDB title | PDB structure | 1R05 | Solution Structure of Max B-HLH-LZ | 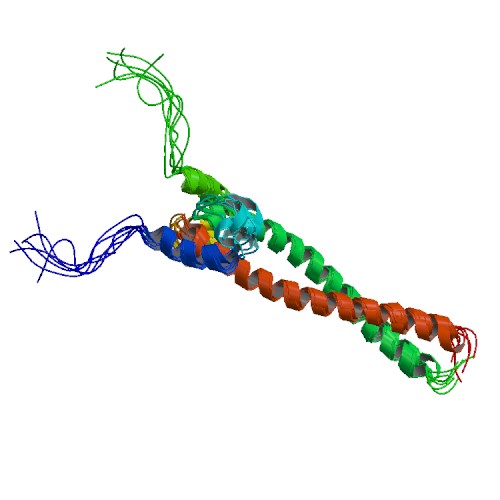 |
| Top |
| Differential gene expression and gene-gene network for MAX |
| Differential gene expression between mutated and non-mutated LBS samples in all 16 major cancer types |
| Differential co-expressed gene network based on protein-protein interaction data (CePIN) |
| Top |
| Top |
| Phenotype information for MAX |
| Gene level disease information (DisGeNet) |
| Disease ID | Disease name | # PubMed | Association type |
| umls:C0031511 | Pheochromocytoma | 7 | Biomarker |
| Mutation level pathogenic information (ClinVar annotation) |
| Allele ID | AA change | Clinical significance | Origin | Phenotype IDs |
| Top |
| Pharmacological information for MAX |
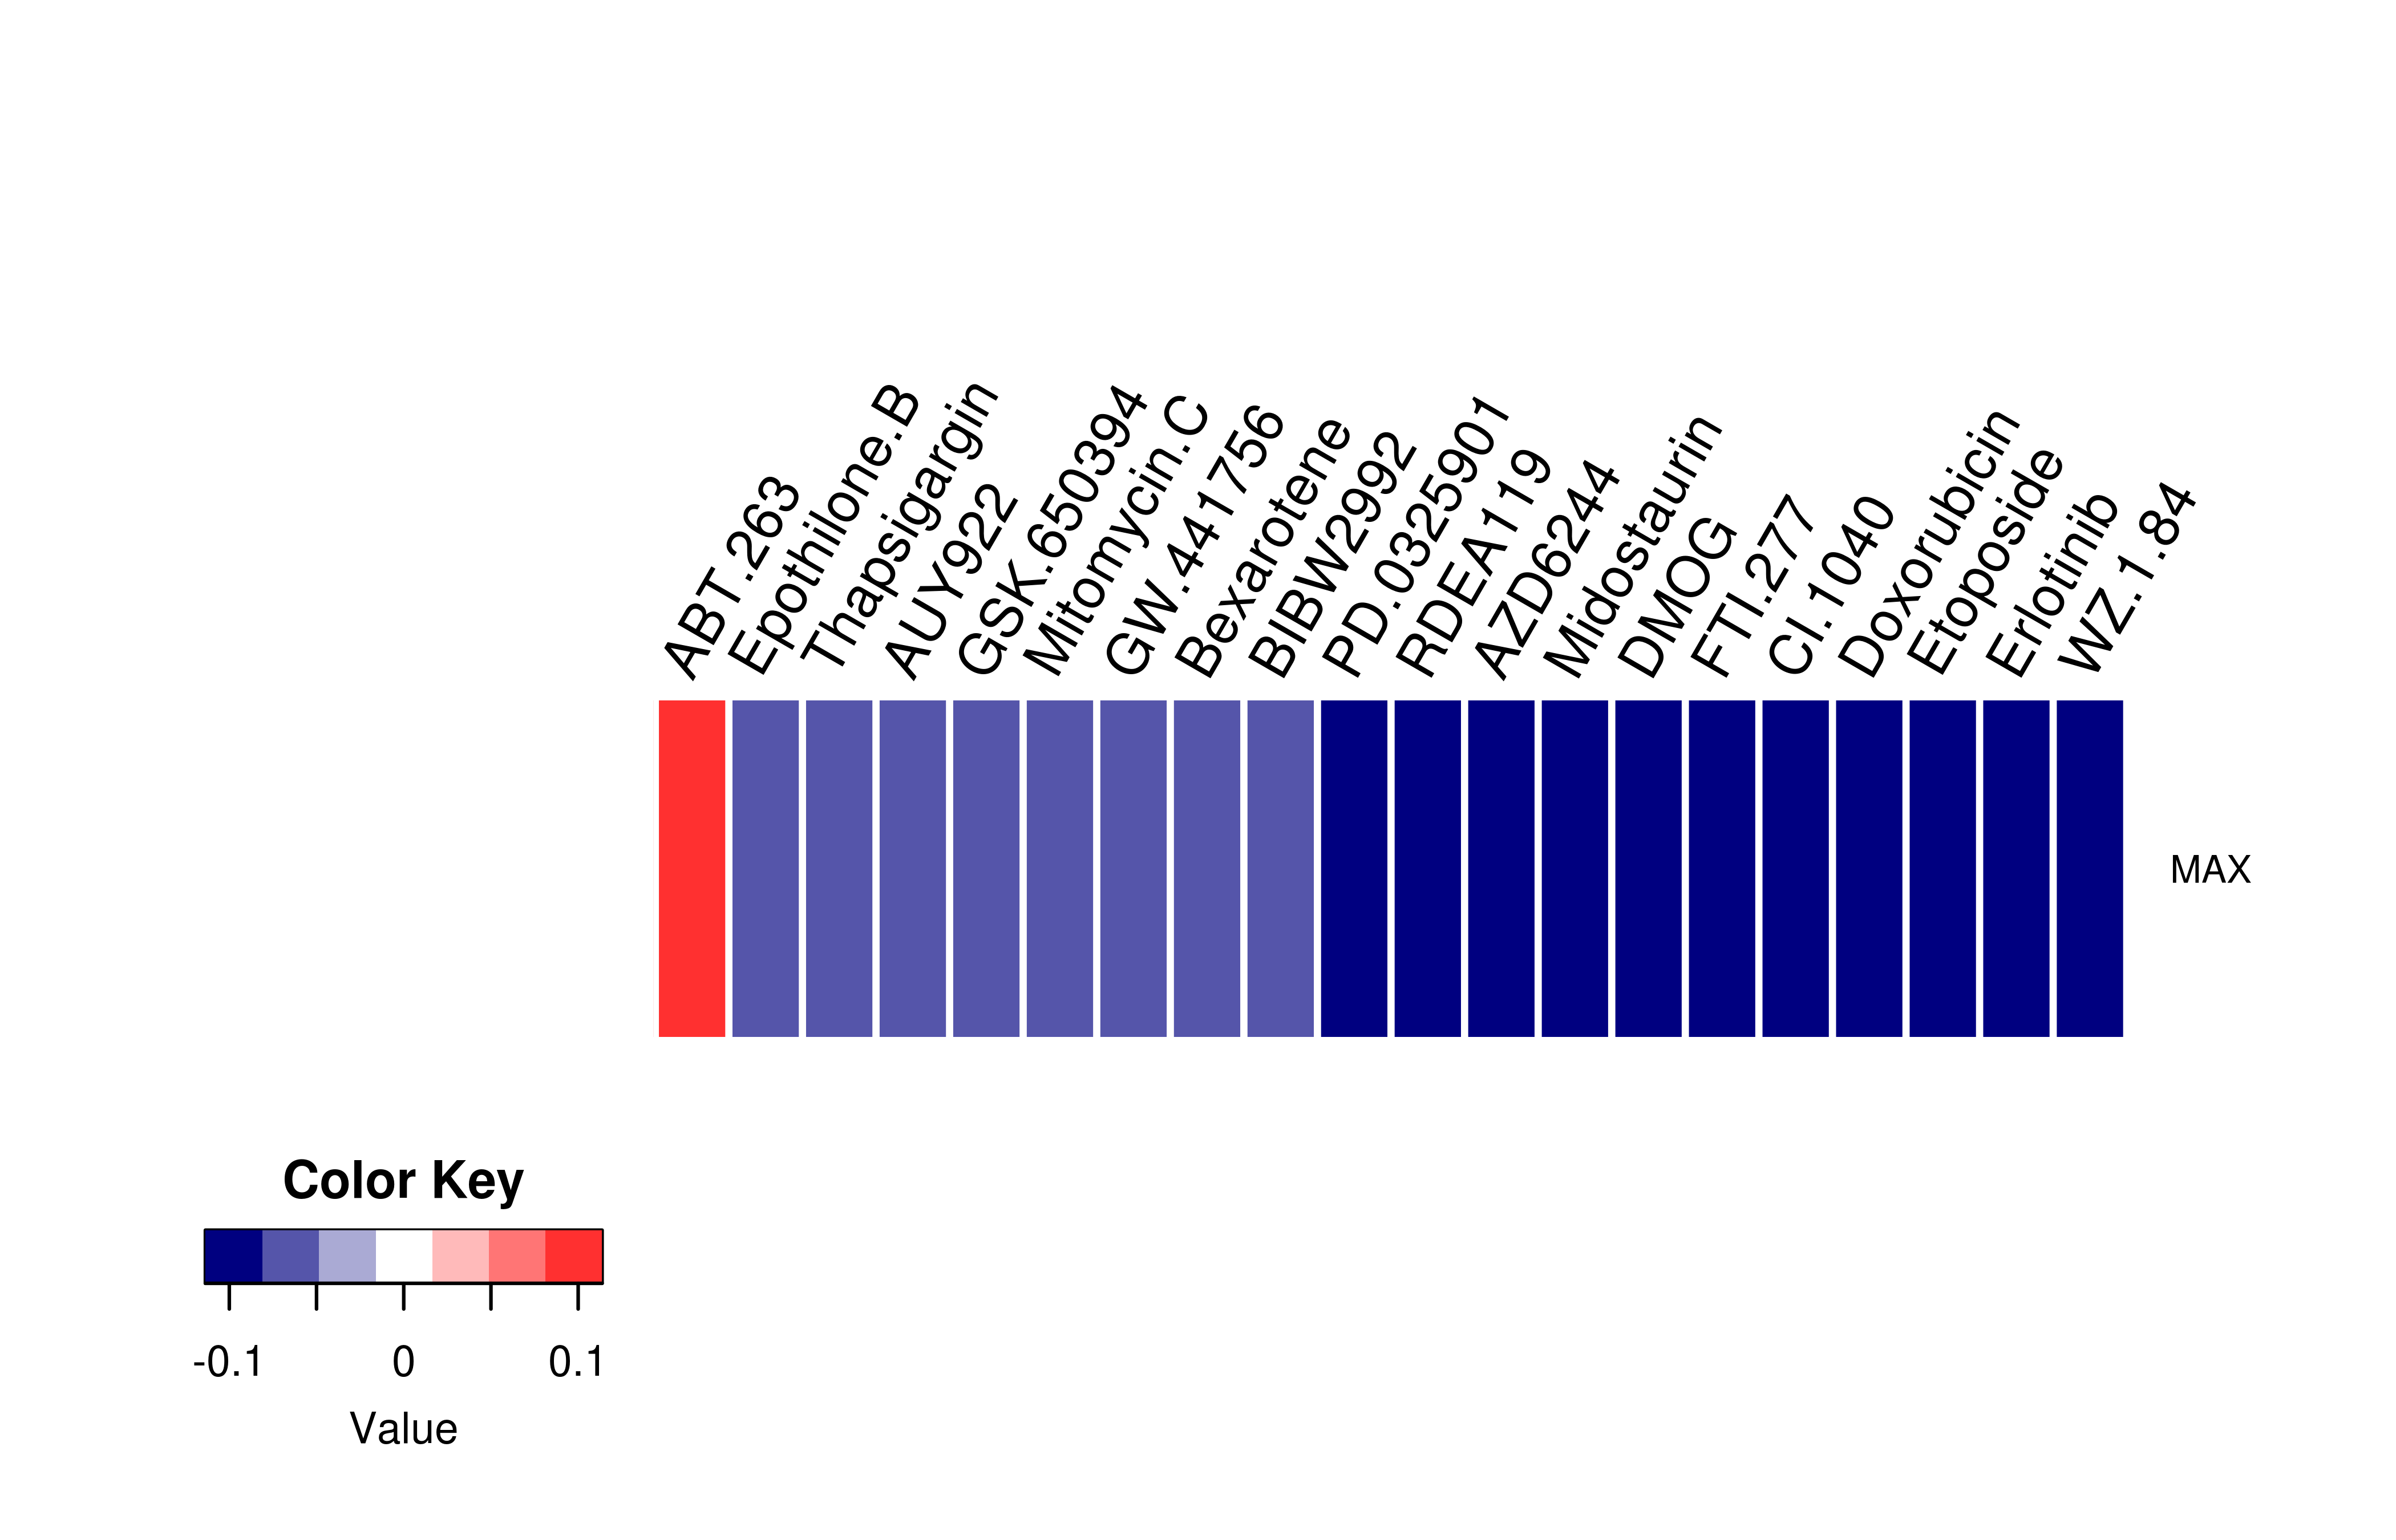
| Gene expression profile of anticancer drug treated cell-lines (CCLE) Heatmap showing the correlation between gene expression and drug response across all the cell-lines. We chose the top 20 among 138 drugs.We used Pearson's correlation coefficient. |
 |
| Drug information targeting mutLBSgene (Approved drugs only) |
| Drug status | DrugBank ID | Name | Type | Drug structure |
| Gene-centered ligand-gene interaction network |
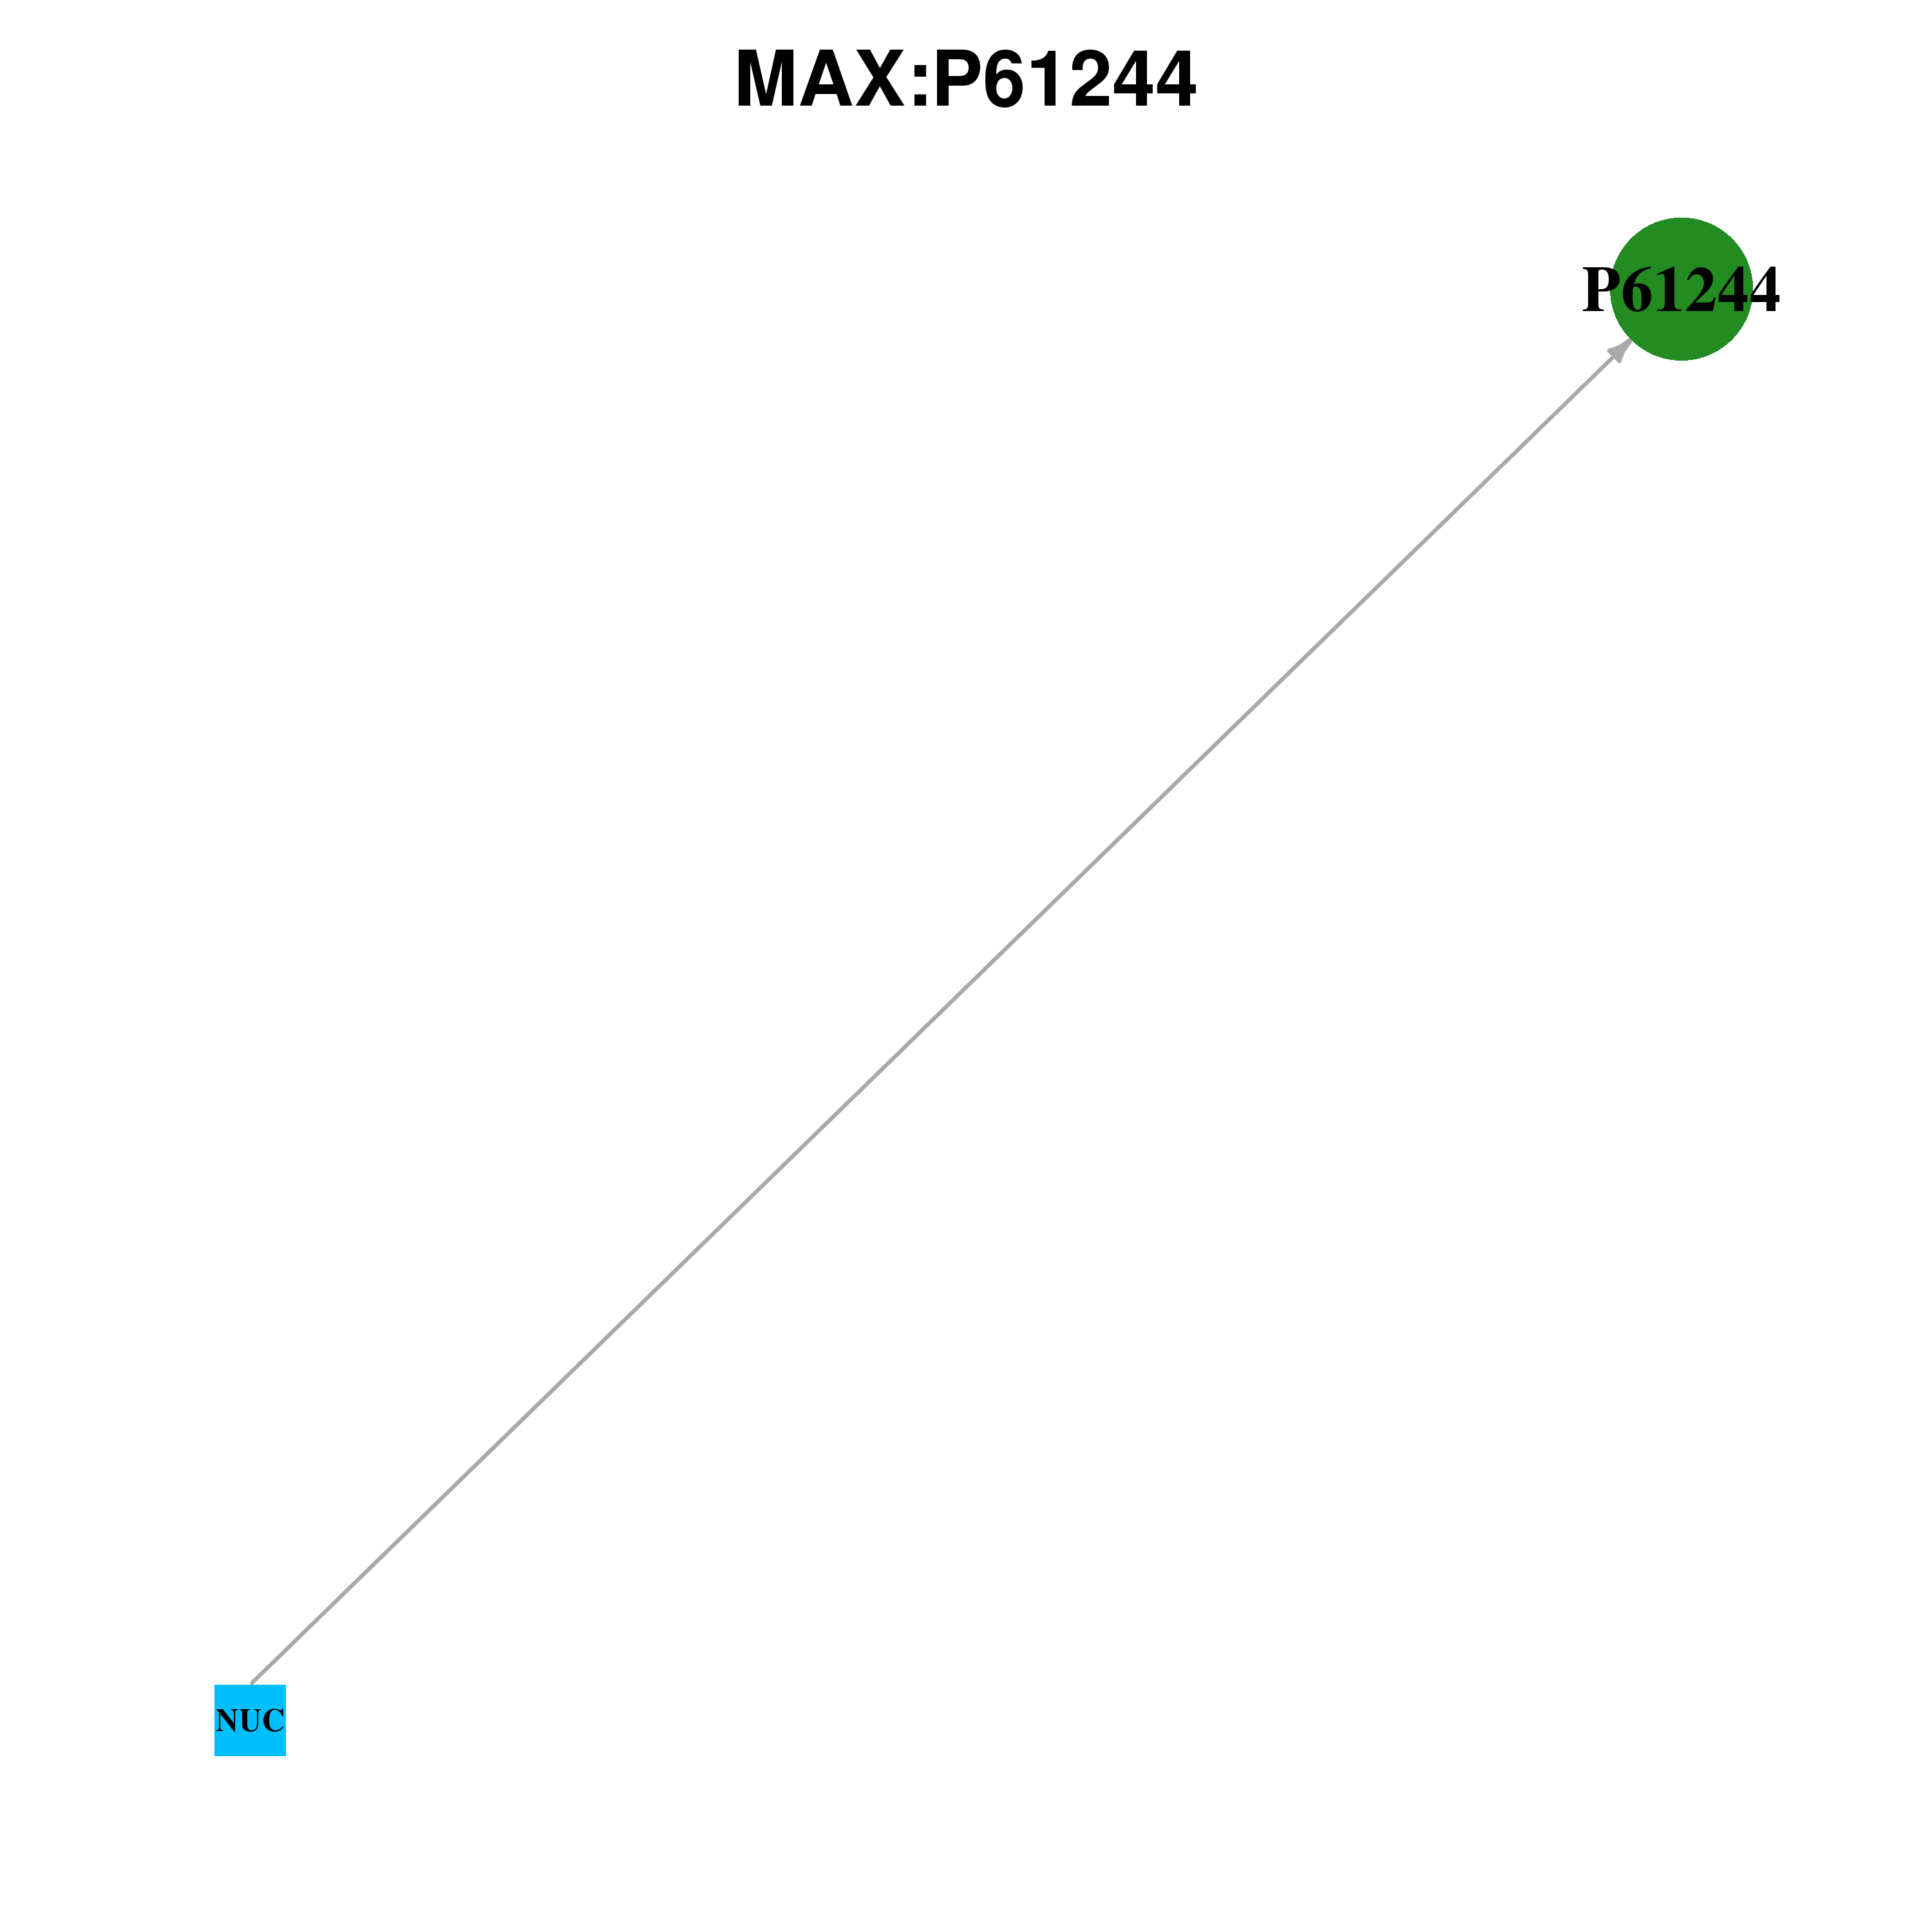 |
| Ligands binding to mutated ligand binding site of MAX go to BioLip |
| Ligand ID | Ligand short name | Ligand long name | PDB ID | PDB name | mutLBS | NUC | Nucleic Acids | 1an2 | A | E32 R60 |
| Top |
| Conservation information for LBS of MAX |
| Multiple alignments for P61244 in multiple species |
| LBS | AA sequence | # species | Species |
 |
Copyright © 2016-Present - The University of Texas Health Science Center at Houston |