|
mutLBSgeneDB |
| |
| |
| |
| |
| |
| |
|

| Gene summary for DIRAS2 |
 Gene summary Gene summary |
| Basic gene Info. | Gene symbol | DIRAS2 |
| Gene name | DIRAS family, GTP-binding RAS-like 2 | |
| Synonyms | Di-Ras2 | |
| Cytomap | UCSC genome browser: 9q22.2 | |
| Type of gene | protein-coding | |
| RefGenes | NM_017594.3, | |
| Description | GTP-binding protein Di-Ras2distinct subgroup of the Ras family member 2 | |
| Modification date | 20141207 | |
| dbXrefs | MIM : 607863 | |
| HGNC : HGNC | ||
| Ensembl : ENSG00000165023 | ||
| HPRD : 09711 | ||
| Vega : OTTHUMG00000020196 | ||
| Protein | UniProt: Q96HU8 go to UniProt's Cross Reference DB Table | |
| Expression | CleanEX: HS_DIRAS2 | |
| BioGPS: 54769 | ||
| Pathway | NCI Pathway Interaction Database: DIRAS2 | |
| KEGG: DIRAS2 | ||
| REACTOME: DIRAS2 | ||
| Pathway Commons: DIRAS2 | ||
| Context | iHOP: DIRAS2 | |
| ligand binding site mutation search in PubMed: DIRAS2 | ||
| UCL Cancer Institute: DIRAS2 | ||
| Assigned class in mutLBSgeneDB | C: This gene just belongs to mutLBSgenes. | |
| Gene ontology having evidence of Inferred from Direct Assay (IDA) from Entrez |
| GO ID | GO Term | PubMed ID | GO:0043406 | positive regulation of MAP kinase activity | 12194967 |
| Top |
| Ligand binding site mutations for DIRAS2 |
| Cancer type specific mutLBS sorted by frequency |
| LBS | AAchange of nsSNV | Cancer type | # samples | T39 | T39M | BRCA | 1 | R33 | R33W | COAD | 1 | A152 | A152T | COAD | 1 | T39 | T39M | COAD | 1 | T39 | P38Q | LUAD | 1 | R33 | R33L | LUAD | 1 | T39 | P38L | SKCM | 1 | R33 | R33W | STAD | 1 |
| cf) Cancer type abbreviation. BLCA: Bladder urothelial carcinoma, BRCA: Breast invasive carcinoma, CESC: Cervical squamous cell carcinoma and endocervical adenocarcinoma, COAD: Colon adenocarcinoma, GBM: Glioblastoma multiforme, LGG: Brain lower grade glioma, HNSC: Head and neck squamous cell carcinoma, KICH: Kidney chromophobe, KIRC: Kidney renal clear cell carcinoma, KIRP: Kidney renal papillary cell carcinoma, LAML: Acute myeloid leukemia, LUAD: Lung adenocarcinoma, LUSC: Lung squamous cell carcinoma, OV: Ovarian serous cystadenocarcinoma, PAAD: Pancreatic adenocarcinoma, PRAD: Prostate adenocarcinoma, SKCM: Skin cutaneous melanoma, STAD: Stomach adenocarcinoma, THCA: Thyroid carcinoma, UCEC: Uterine corpus endometrial carcinoma. |
| Top |
| Protein structure related information for DIRAS2 |
| Relative protein structure stability change (ΔΔE) using Mupro 1.1 Mupro score denotes assessment of the effect of mutations on thermodynamic stability. (ΔΔE<0: mutation decreases stability, ΔΔE>0: mutation increases stability) |
 : nsSNV at non-LBS : nsSNV at non-LBS : nsSNV at LBS : nsSNV at LBS |
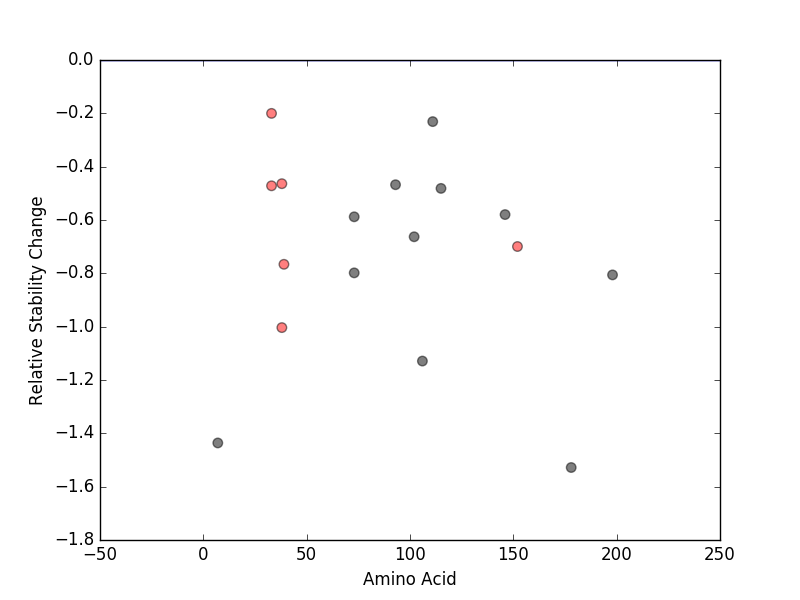 |
| nsSNVs sorted by the relative stability change of protein structure by each mutation Blue: mutations of positive stability change. and red : the most recurrent mutation for this gene. |
| LBS | AAchange of nsSNV | Relative stability change | T39 | P38Q | -1.0034887 | T39 | T39M | -0.76613844 | A152 | A152T | -0.69944977 | R33 | R33W | -0.4717569 | T39 | P38L | -0.46381808 | R33 | R33L | -0.20018816 |
| (MuPro1.1: Jianlin Cheng et al., Prediction of Protein Stability Changes for Single-Site Mutations Using Support Vector Machines, PROTEINS: Structure, Function, and Bioinformatics. 2006, 62:1125-1132) |
| Structure image for DIRAS2 from PDB |
| Top |
| Differential gene expression and gene-gene network for DIRAS2 |
| Differential gene expression between mutated and non-mutated LBS samples in all 16 major cancer types |
| Differential co-expressed gene network based on protein-protein interaction data (CePIN) |
| Top |
| Top |
| Phenotype information for DIRAS2 |
| Gene level disease information (DisGeNet) |
| Disease ID | Disease name | # PubMed | Association type |
| Mutation level pathogenic information (ClinVar annotation) |
| Allele ID | AA change | Clinical significance | Origin | Phenotype IDs |
| Top |
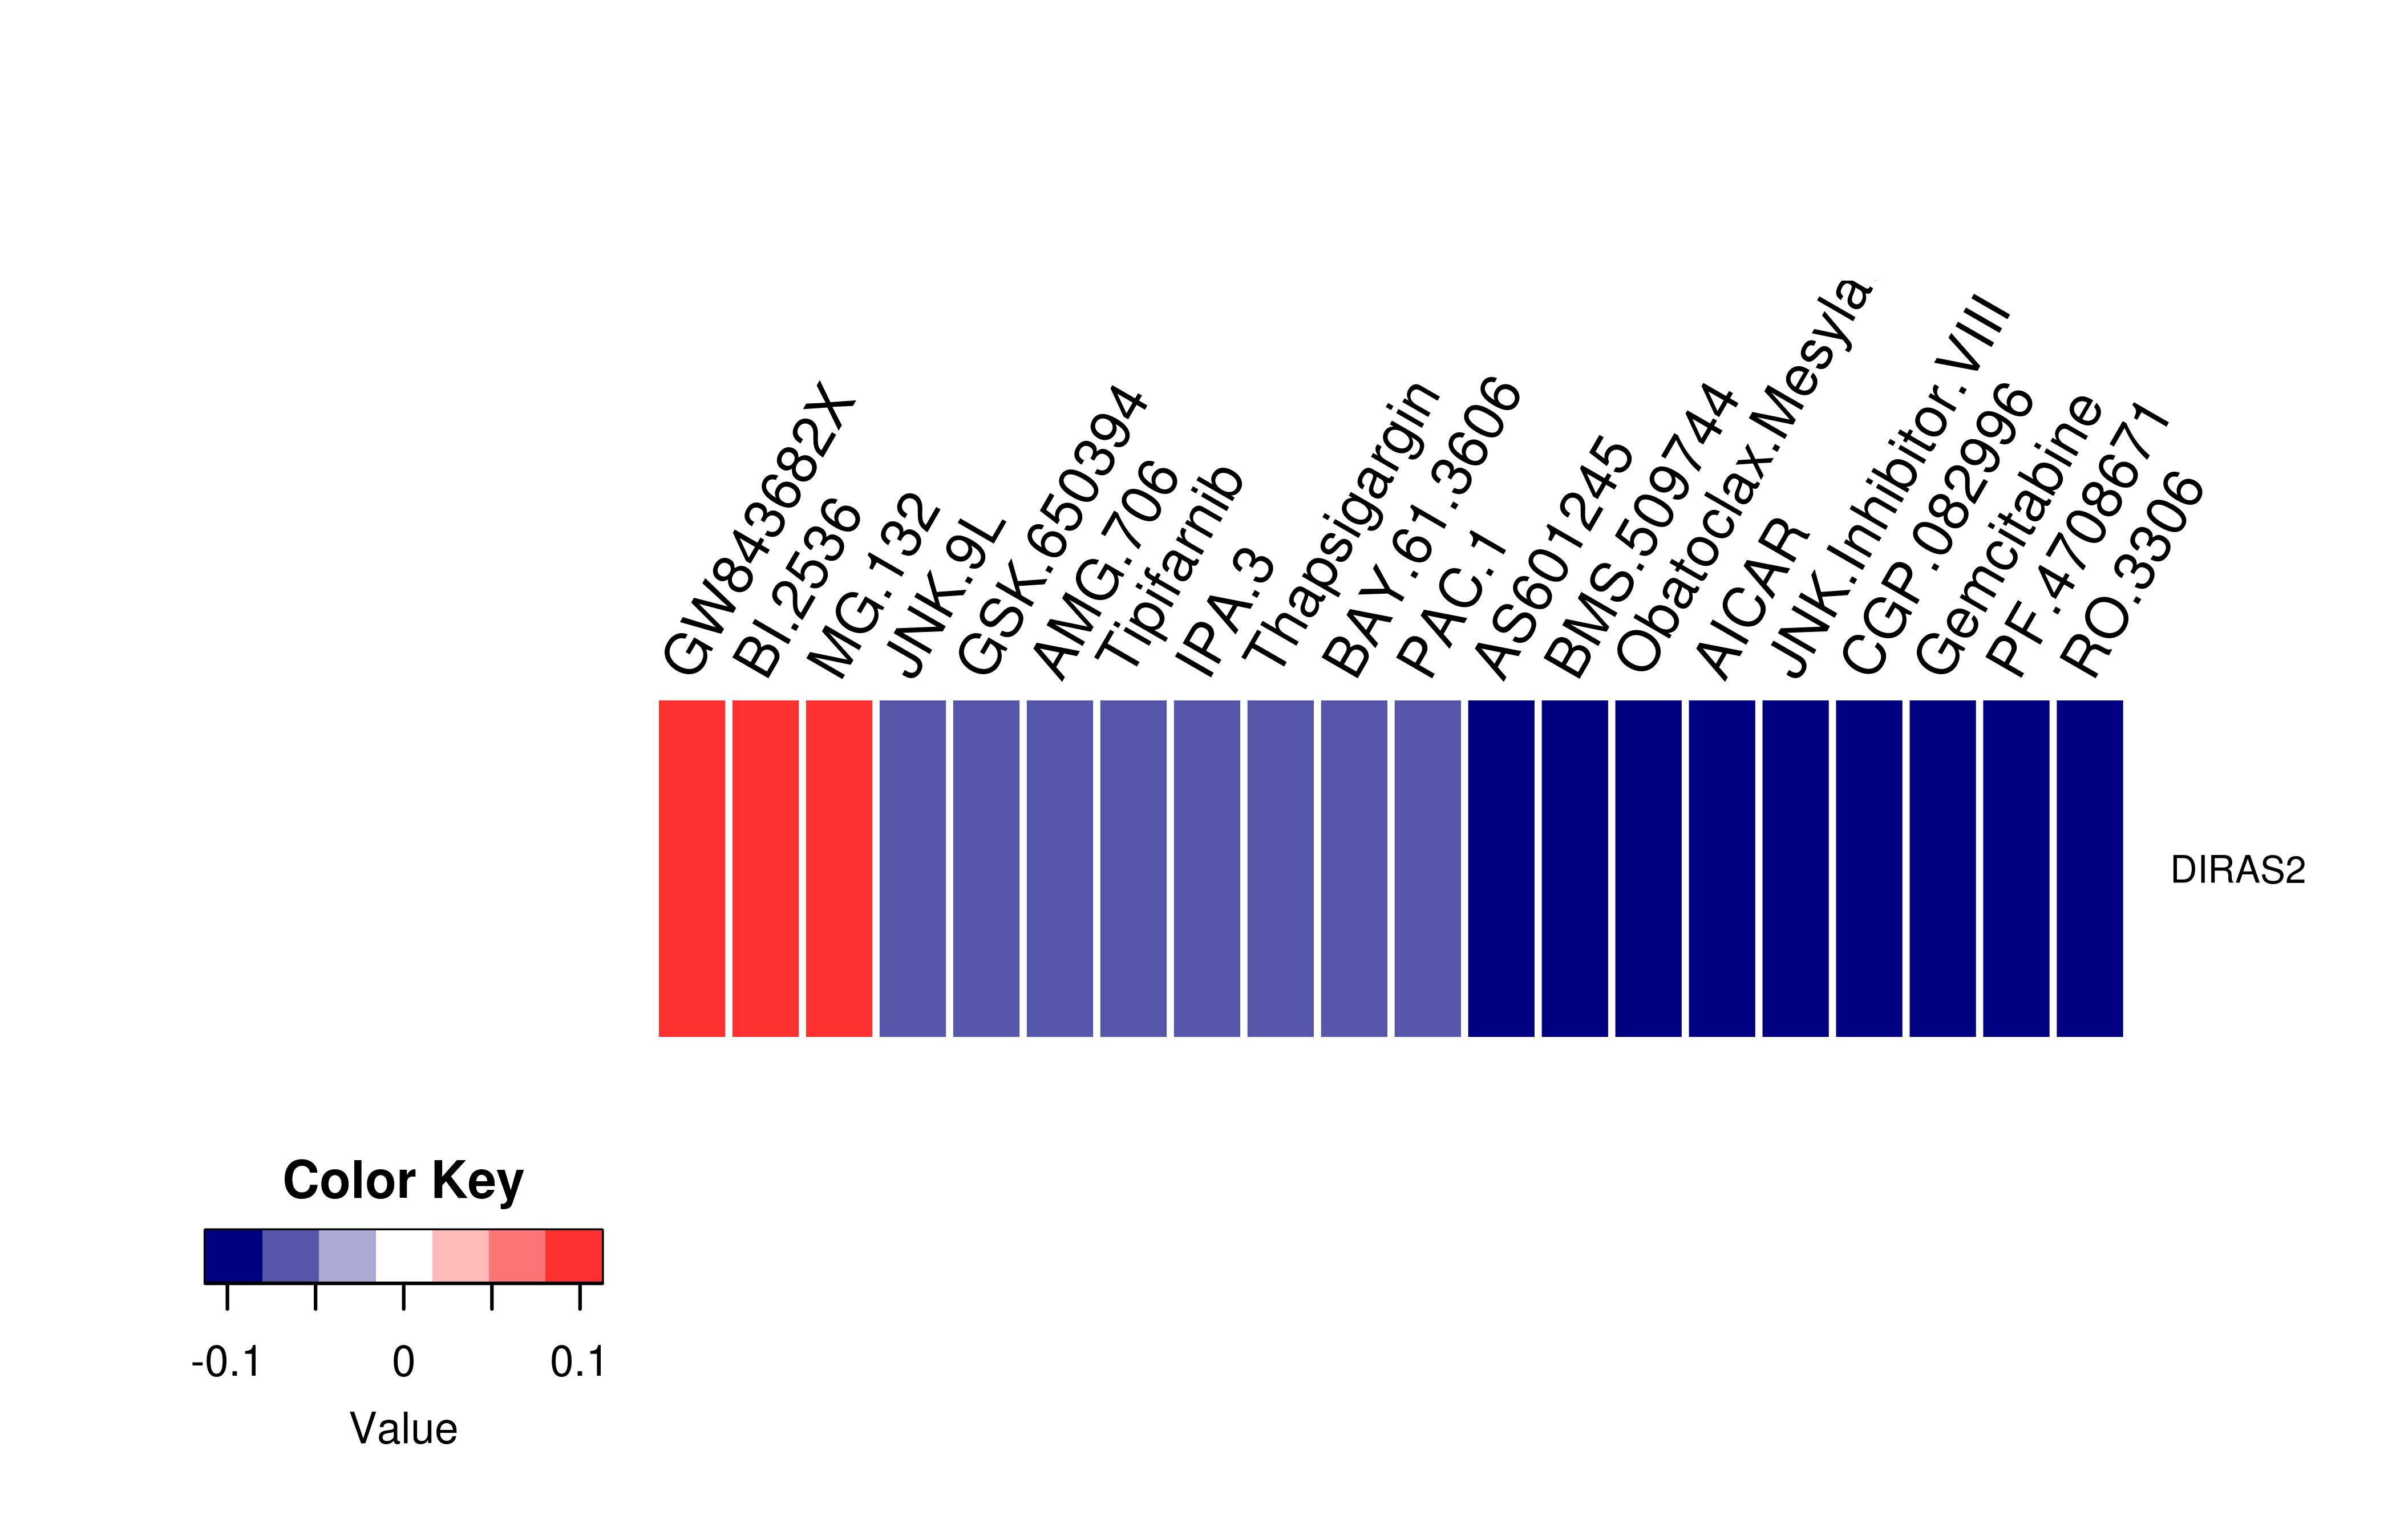
| Pharmacological information for DIRAS2 |
| Gene expression profile of anticancer drug treated cell-lines (CCLE) Heatmap showing the correlation between gene expression and drug response across all the cell-lines. We chose the top 20 among 138 drugs.We used Pearson's correlation coefficient. |
 |
| Drug information targeting mutLBSgene (Approved drugs only) |
| Drug status | DrugBank ID | Name | Type | Drug structure |
| Gene-centered ligand-gene interaction network |
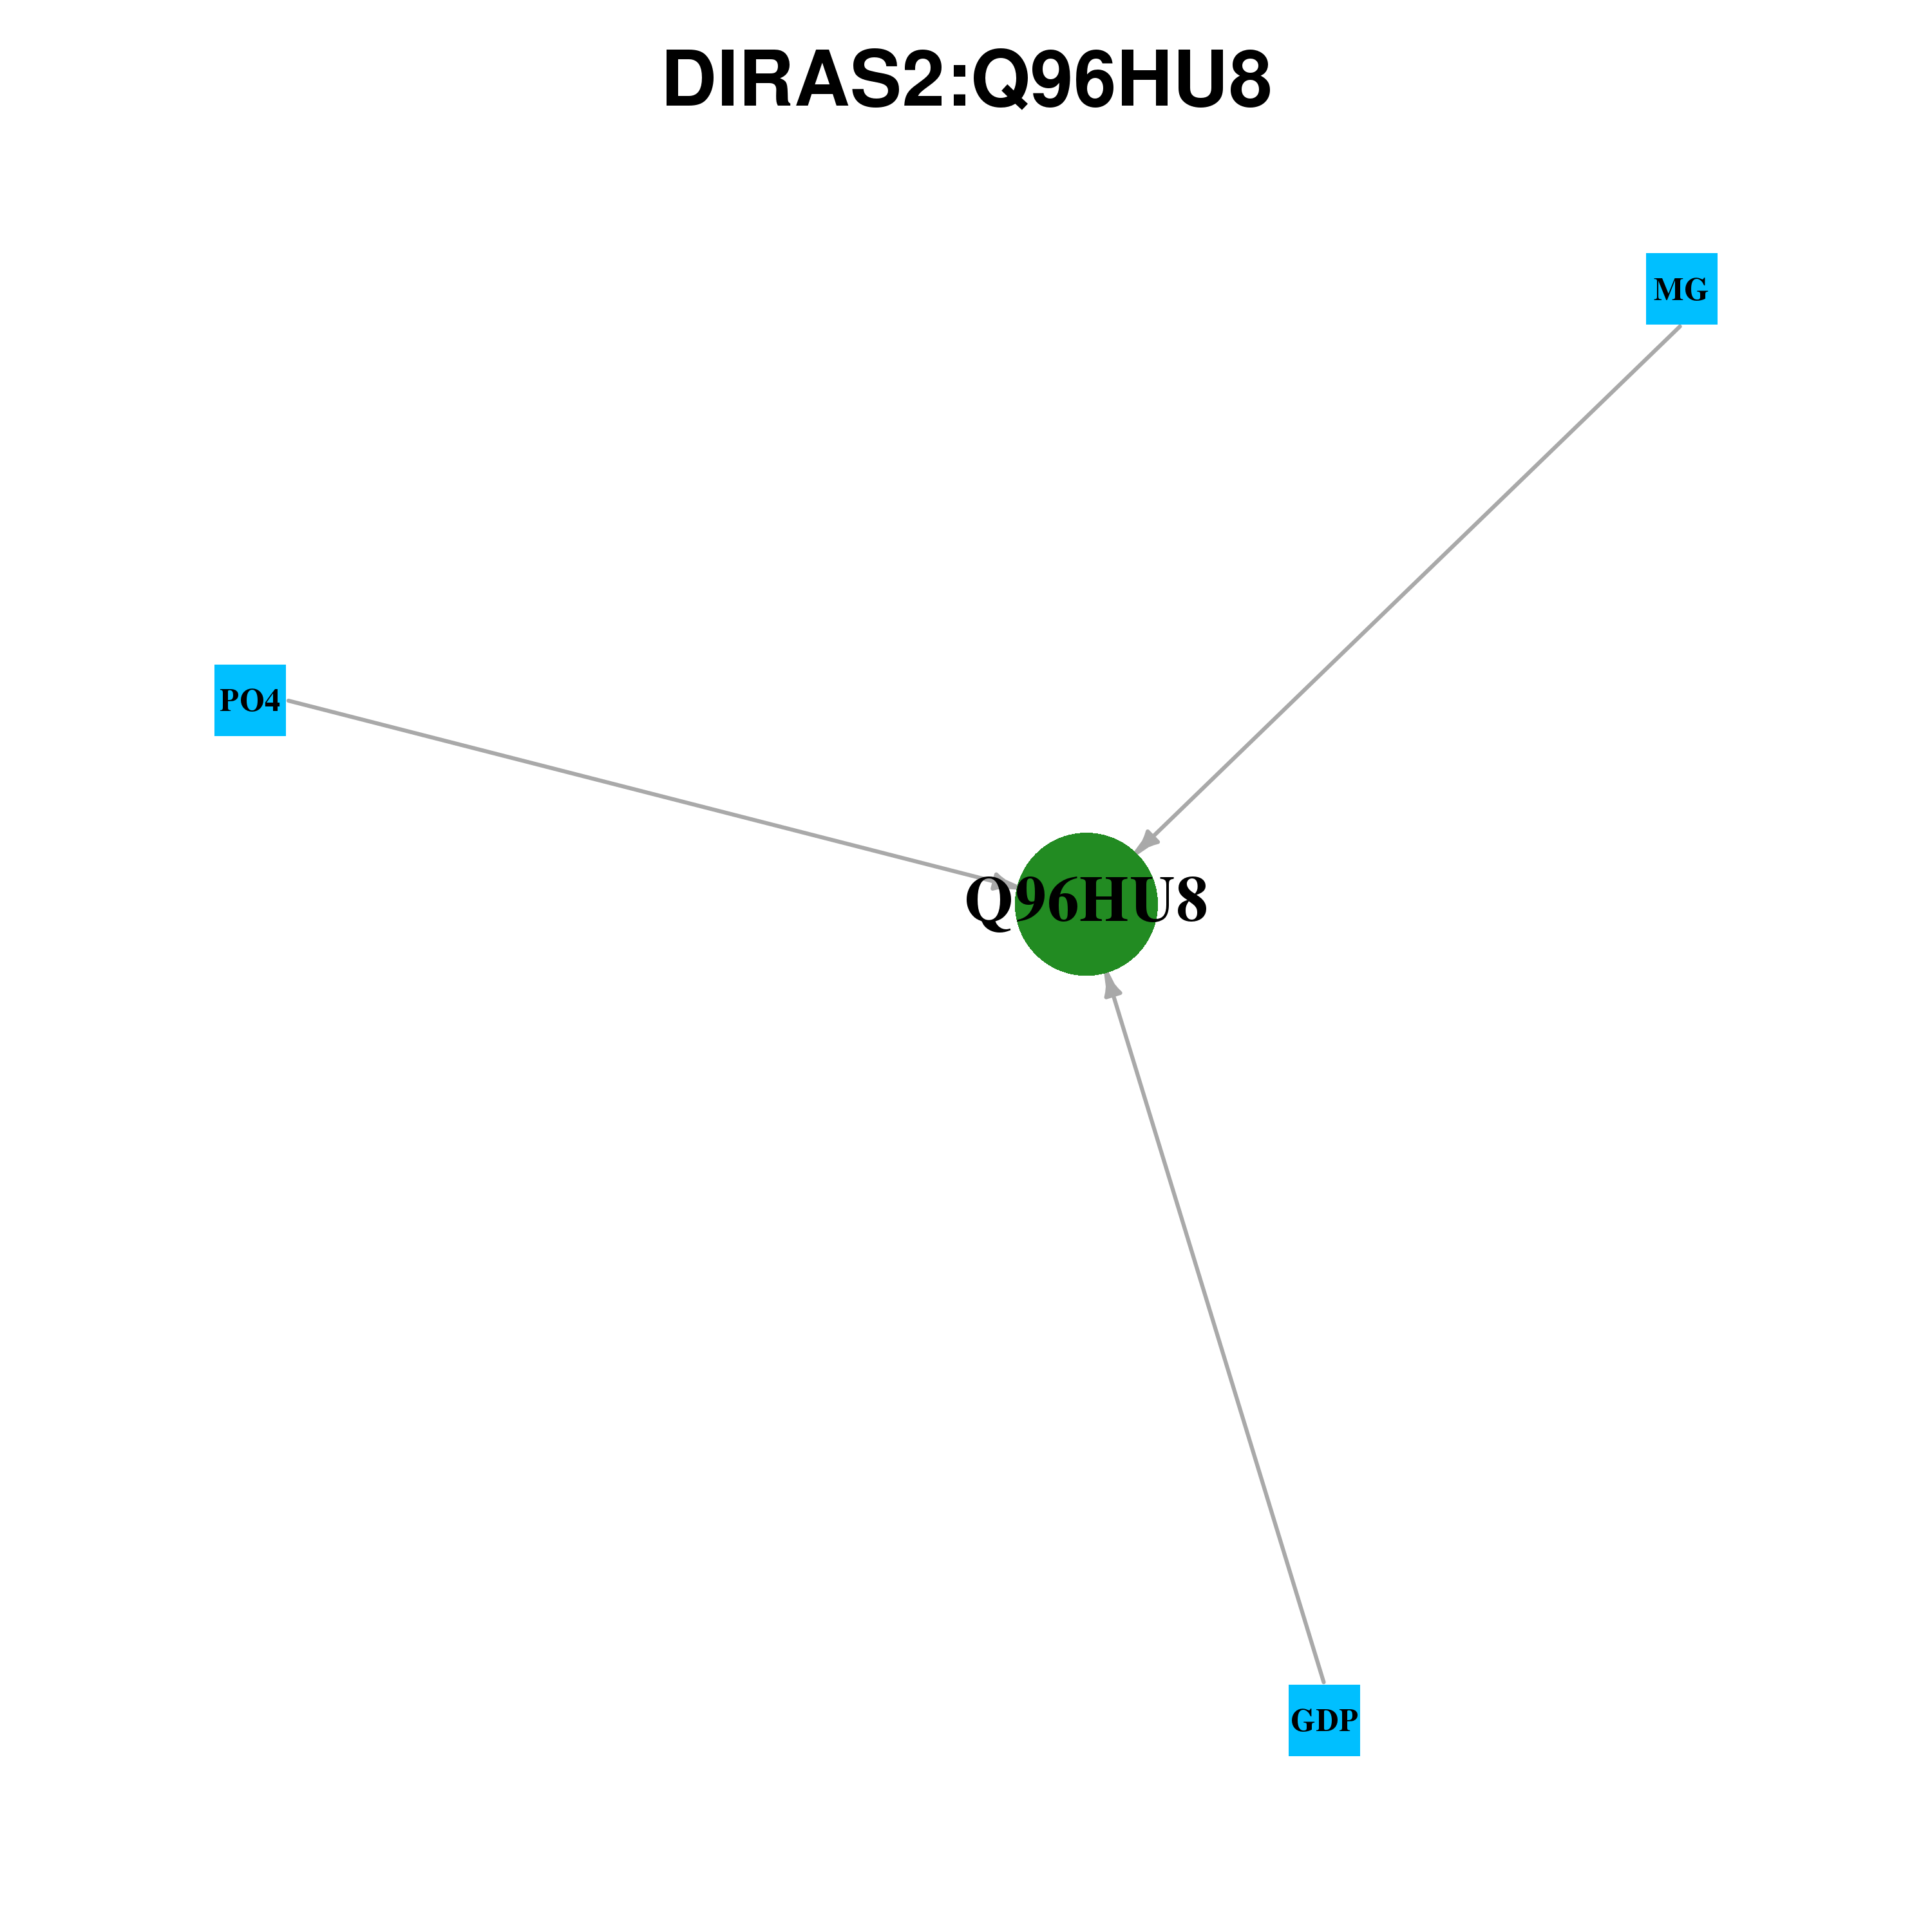 |
| Ligands binding to mutated ligand binding site of DIRAS2 go to BioLip |
| Ligand ID | Ligand short name | Ligand long name | PDB ID | PDB name | mutLBS | GDP | GUANOSINE-5'-DIPHOSPHATE | 2erx | A | R33 A152 | GDP | GUANOSINE-5'-DIPHOSPHATE | 2erx | B | R33 A152 | PO4 | PHOSPHATE ION | 2erx | A | T39 | MG | MAGNESIUM(2+) | 2erx | A | T39 | PO4 | PHOSPHATE ION | 2erx | B | T39 | MG | MAGNESIUM(2+) | 2erx | B | T39 |
| Top |
| Conservation information for LBS of DIRAS2 |
| Multiple alignments for Q96HU8 in multiple species |
| LBS | AA sequence | # species | Species |
 |
Copyright © 2016-Present - The University of Texas Health Science Center at Houston |