|
mutLBSgeneDB |
| |
| |
| |
| |
| |
| |
|

| Gene summary for BLM |
 Gene summary Gene summary |
| Basic gene Info. | Gene symbol | BLM |
| Gene name | Bloom syndrome, RecQ helicase-like | |
| Synonyms | BS|RECQ2|RECQL2|RECQL3 | |
| Cytomap | UCSC genome browser: 15q26.1 | |
| Type of gene | protein-coding | |
| RefGenes | NM_000057.3, NM_001287246.1,NM_001287247.1,NM_001287248.1, | |
| Description | Bloom syndrome proteinDNA helicase, RecQ-like type 2recQ protein-like 3 | |
| Modification date | 20141221 | |
| dbXrefs | MIM : 604610 | |
| HGNC : HGNC | ||
| Ensembl : ENSG00000197299 | ||
| HPRD : 05211 | ||
| Vega : OTTHUMG00000149834 | ||
| Protein | UniProt: P54132 go to UniProt's Cross Reference DB Table | |
| Expression | CleanEX: HS_BLM | |
| BioGPS: 641 | ||
| Pathway | NCI Pathway Interaction Database: BLM | |
| KEGG: BLM | ||
| REACTOME: BLM | ||
| Pathway Commons: BLM | ||
| Context | iHOP: BLM | |
| ligand binding site mutation search in PubMed: BLM | ||
| UCL Cancer Institute: BLM | ||
| Assigned class in mutLBSgeneDB | C: This gene just belongs to mutLBSgenes. | |
| Gene ontology having evidence of Inferred from Direct Assay (IDA) from Entrez |
| GO ID | GO Term | PubMed ID | GO:0000729 | DNA double-strand break processing | 21325134 | GO:0000733 | DNA strand renaturation | 17878217 | GO:0006200 | ATP catabolic process | 12818200 | GO:0006974 | cellular response to DNA damage stimulus | 23509288 | GO:0007095 | mitotic G2 DNA damage checkpoint | 11309417 | GO:0010165 | response to X-ray | 11309417 | GO:0031297 | replication fork processing | 17115688 | GO:0032508 | DNA duplex unwinding | 11433031 | GO:0045893 | positive regulation of transcription, DNA-templated | 11781842 | GO:0051259 | protein oligomerization | 10359700 | GO:0071479 | cellular response to ionizing radiation | 23509288 | GO:0072711 | cellular response to hydroxyurea | 23509288 | GO:0072757 | cellular response to camptothecin | 23509288 |
| Top |
| Ligand binding site mutations for BLM |
| Lollipop-style diagram of mutations at LBS in amino-acid sequence. We represented ligand binding site mutations only. (You can see big image via clicking.) |
 |
| Cancer type specific mutLBS sorted by frequency |
| LBS | AAchange of nsSNV | Cancer type | # samples | K1125 | Q1127H | BRCA | 1 | R1139 | H1140Q | KIRC | 1 | R982 | G984V | LUAD | 1 |
| cf) Cancer type abbreviation. BLCA: Bladder urothelial carcinoma, BRCA: Breast invasive carcinoma, CESC: Cervical squamous cell carcinoma and endocervical adenocarcinoma, COAD: Colon adenocarcinoma, GBM: Glioblastoma multiforme, LGG: Brain lower grade glioma, HNSC: Head and neck squamous cell carcinoma, KICH: Kidney chromophobe, KIRC: Kidney renal clear cell carcinoma, KIRP: Kidney renal papillary cell carcinoma, LAML: Acute myeloid leukemia, LUAD: Lung adenocarcinoma, LUSC: Lung squamous cell carcinoma, OV: Ovarian serous cystadenocarcinoma, PAAD: Pancreatic adenocarcinoma, PRAD: Prostate adenocarcinoma, SKCM: Skin cutaneous melanoma, STAD: Stomach adenocarcinoma, THCA: Thyroid carcinoma, UCEC: Uterine corpus endometrial carcinoma. |
| Top |
| Protein structure related information for BLM |
| Relative protein structure stability change (ΔΔE) using Mupro 1.1 Mupro score denotes assessment of the effect of mutations on thermodynamic stability. (ΔΔE<0: mutation decreases stability, ΔΔE>0: mutation increases stability) |
 : nsSNV at non-LBS : nsSNV at non-LBS : nsSNV at LBS : nsSNV at LBS |
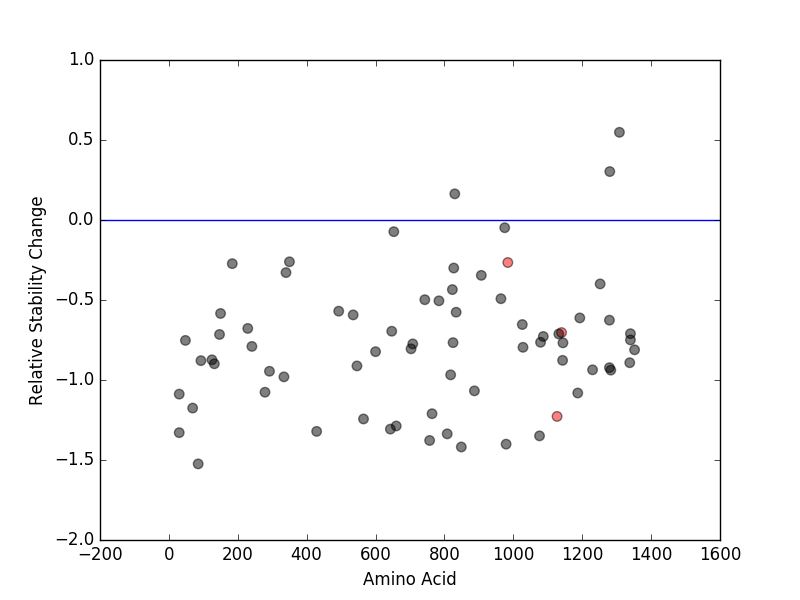 |
| nsSNVs sorted by the relative stability change of protein structure by each mutation Blue: mutations of positive stability change. and red : the most recurrent mutation for this gene. |
| LBS | AAchange of nsSNV | Relative stability change | K1125 | Q1127H | -1.2276826 | R1139 | H1140Q | -0.70358282 | R982 | G984V | -0.26561394 |
| (MuPro1.1: Jianlin Cheng et al., Prediction of Protein Stability Changes for Single-Site Mutations Using Support Vector Machines, PROTEINS: Structure, Function, and Bioinformatics. 2006, 62:1125-1132) |
| Structure image for BLM from PDB |
| Top |
| Differential gene expression and gene-gene network for BLM |
| Differential gene expression between mutated and non-mutated LBS samples in all 16 major cancer types |
| Differential co-expressed gene network based on protein-protein interaction data (CePIN) |
| Top |
| Top |
| Phenotype information for BLM |
| Gene level disease information (DisGeNet) |
| Disease ID | Disease name | # PubMed | Association type |
| umls:C0005859 | Bloom Syndrome | 64 | AlteredExpression, Biomarker, GeneticVariation |
| Mutation level pathogenic information (ClinVar annotation) |
| Allele ID | AA change | Clinical significance | Origin | Phenotype IDs |
| Top |
| Pharmacological information for BLM |
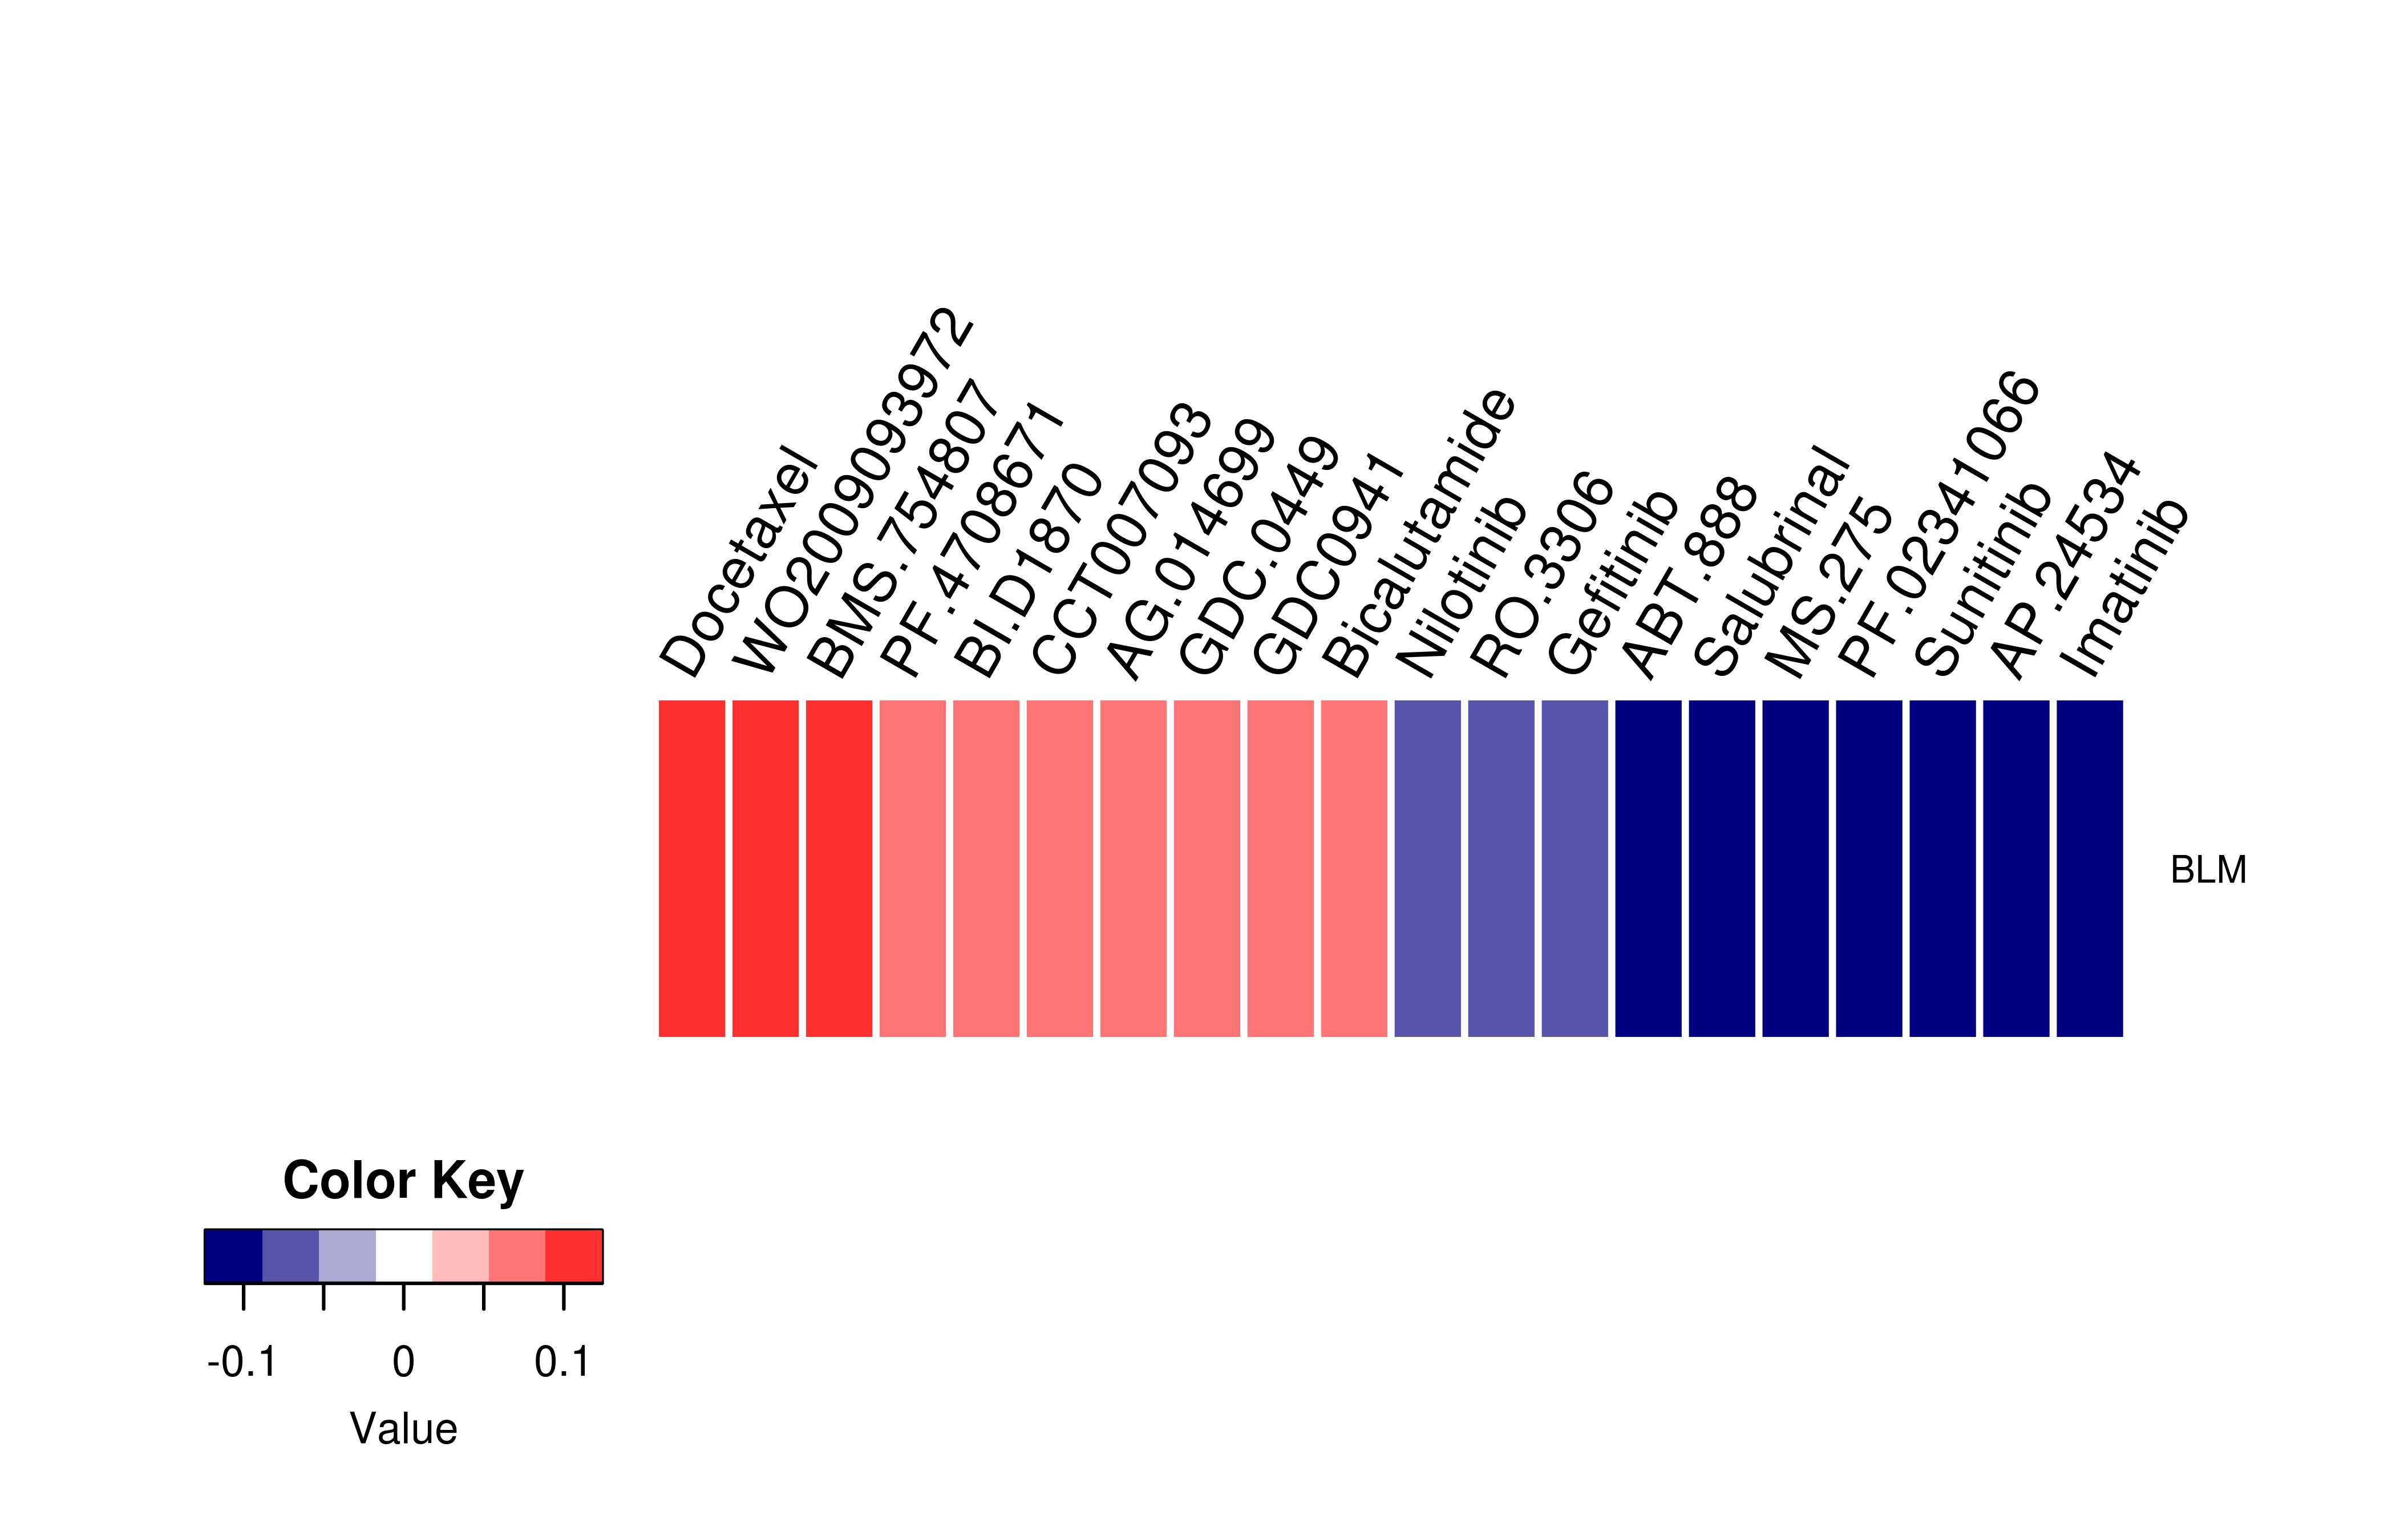
| Gene expression profile of anticancer drug treated cell-lines (CCLE) Heatmap showing the correlation between gene expression and drug response across all the cell-lines. We chose the top 20 among 138 drugs.We used Pearson's correlation coefficient. |
 |
| Drug information targeting mutLBSgene (Approved drugs only) |
| Drug status | DrugBank ID | Name | Type | Drug structure |
| Gene-centered ligand-gene interaction network |
 |
| Ligands binding to mutated ligand binding site of BLM go to BioLip |
| Ligand ID | Ligand short name | Ligand long name | PDB ID | PDB name | mutLBS | NUC | Nucleic Acids | 4cgz | A | K1125 | ART | ARSENATE ION | 3we3 | A | R1139 | NUC | Nucleic Acids | 4cgz | A | R1139 | ADP | ADP | 4cdg | A | R982 | ADP | ADP | 4cdg | B | R982 | ADP | ADP | 4cgz | A | R982 |
| Top |
| Conservation information for LBS of BLM |
| Multiple alignments for P54132 in multiple species |
| LBS | AA sequence | # species | Species |
 |
Copyright © 2016-Present - The University of Texas Health Science Center at Houston |