|
mutLBSgeneDB |
| |
| |
| |
| |
| |
| |
|

| Gene summary for STAT1 |
 Gene summary Gene summary |
| Basic gene Info. | Gene symbol | STAT1 |
| Gene name | signal transducer and activator of transcription 1, 91kDa | |
| Synonyms | CANDF7|IMD31A|IMD31B|IMD31C|ISGF-3|STAT91 | |
| Cytomap | UCSC genome browser: 2q32.2 | |
| Type of gene | protein-coding | |
| RefGenes | NM_007315.3, NM_139266.2, | |
| Description | signal transducer and activator of transcription 1, 91kDsignal transducer and activator of transcription 1-alpha/betasignal transducer and activator of transcription-1transcription factor ISGF-3 components p91/p84 | |
| Modification date | 20141221 | |
| dbXrefs | MIM : 600555 | |
| HGNC : HGNC | ||
| Ensembl : ENSG00000115415 | ||
| HPRD : 02777 | ||
| Vega : OTTHUMG00000132699 | ||
| Protein | UniProt: P42224 go to UniProt's Cross Reference DB Table | |
| Expression | CleanEX: HS_STAT1 | |
| BioGPS: 6772 | ||
| Pathway | NCI Pathway Interaction Database: STAT1 | |
| KEGG: STAT1 | ||
| REACTOME: STAT1 | ||
| Pathway Commons: STAT1 | ||
| Context | iHOP: STAT1 | |
| ligand binding site mutation search in PubMed: STAT1 | ||
| UCL Cancer Institute: STAT1 | ||
| Assigned class in mutLBSgeneDB | B: This gene belongs to targetable_mutLBSgenes. | |
| Gene ontology having evidence of Inferred from Direct Assay (IDA) from Entrez |
| GO ID | GO Term | PubMed ID | GO:0006357 | regulation of transcription from RNA polymerase II promoter | 10820245 | GO:0006366 | transcription from RNA polymerase II promoter | 21268089 | GO:0007259 | JAK-STAT cascade | 22002246 | GO:0033209 | tumor necrosis factor-mediated signaling pathway | 10848577 | GO:0045893 | positive regulation of transcription, DNA-templated | 10973496 | GO:0045944 | positive regulation of transcription from RNA polymerase II promoter | 10820245 | GO:0060333 | interferon-gamma-mediated signaling pathway | 21268089 |
| Top |
| Ligand binding site mutations for STAT1 |
| Lollipop-style diagram of mutations at LBS in amino-acid sequence. We represented ligand binding site mutations only. (You can see big image via clicking.) |
 |
| Cancer type specific mutLBS sorted by frequency |
| LBS | AAchange of nsSNV | Cancer type | # samples | A630 | A630V | UCEC | 2 | Y651 | R649H | COAD | 1 | S606 | R608W | COAD | 1 | V426 | L424V | KIRC | 1 | Q463 | Q463E | LUSC | 1 | E29 | E29Q | SKCM | 1 | P27 | P27T | SKCM | 1 | Y651 | R649C | STAD | 1 | T419 | T419M | STAD | 1 | Y651 | R649C | UCEC | 1 | V426 | V426I | UCEC | 1 |
| cf) Cancer type abbreviation. BLCA: Bladder urothelial carcinoma, BRCA: Breast invasive carcinoma, CESC: Cervical squamous cell carcinoma and endocervical adenocarcinoma, COAD: Colon adenocarcinoma, GBM: Glioblastoma multiforme, LGG: Brain lower grade glioma, HNSC: Head and neck squamous cell carcinoma, KICH: Kidney chromophobe, KIRC: Kidney renal clear cell carcinoma, KIRP: Kidney renal papillary cell carcinoma, LAML: Acute myeloid leukemia, LUAD: Lung adenocarcinoma, LUSC: Lung squamous cell carcinoma, OV: Ovarian serous cystadenocarcinoma, PAAD: Pancreatic adenocarcinoma, PRAD: Prostate adenocarcinoma, SKCM: Skin cutaneous melanoma, STAD: Stomach adenocarcinoma, THCA: Thyroid carcinoma, UCEC: Uterine corpus endometrial carcinoma. |
| Clinical information for STAT1 from My Cancer Genome. |
| Signal transducer and activator of transcription 1 (STAT1) is a gene that encodes a member of the STAT protein family that functions as a transcription activator when translocated to the nucleus of a cell. Missense mutations, nonsense mutations, silent mutations, frameshift deletions and insertions, and in-frame insertions are observed in cancers such as cervical cancer, endometrial cancer, and stomach cancer.Related Pathways:JAK/STAT signaling.Modified: December 7, 2015 |
| Top |
| Protein structure related information for STAT1 |
| Relative protein structure stability change (ΔΔE) using Mupro 1.1 Mupro score denotes assessment of the effect of mutations on thermodynamic stability. (ΔΔE<0: mutation decreases stability, ΔΔE>0: mutation increases stability) |
 : nsSNV at non-LBS : nsSNV at non-LBS : nsSNV at LBS : nsSNV at LBS |
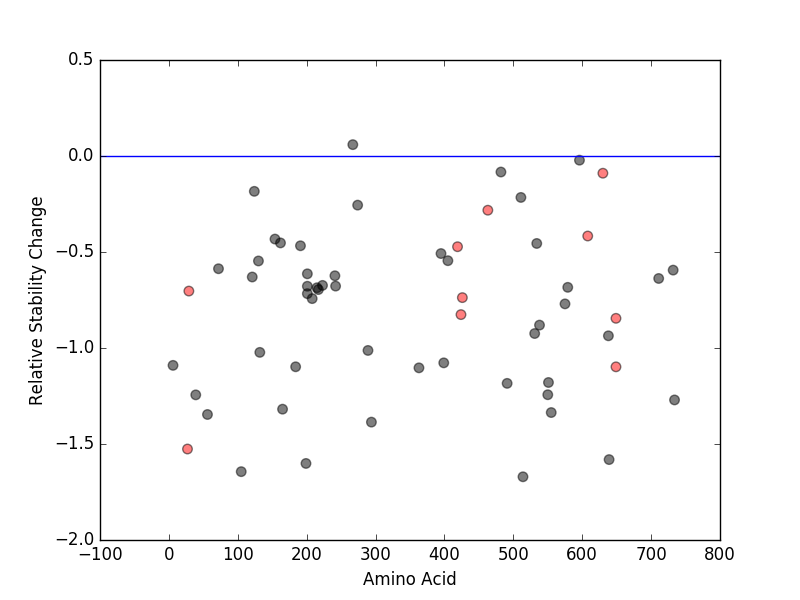 |
| nsSNVs sorted by the relative stability change of protein structure by each mutation Blue: mutations of positive stability change. and red : the most recurrent mutation for this gene. |
| LBS | AAchange of nsSNV | Relative stability change | P27 | P27T | -1.5261195 | Y651 | R649H | -1.0980935 | Y651 | R649C | -0.84540185 | V426 | L424V | -0.82605011 | V426 | V426I | -0.73762087 | E29 | E29Q | -0.70349477 | T419 | T419M | -0.47252022 | S606 | R608W | -0.41670949 | Q463 | Q463E | -0.28235384 | A630 | A630V | -0.089695234 |
| (MuPro1.1: Jianlin Cheng et al., Prediction of Protein Stability Changes for Single-Site Mutations Using Support Vector Machines, PROTEINS: Structure, Function, and Bioinformatics. 2006, 62:1125-1132) |
| Structure image for STAT1 from PDB |
| PDB ID | PDB title | PDB structure | 1YVL | Structure of Unphosphorylated STAT1 | 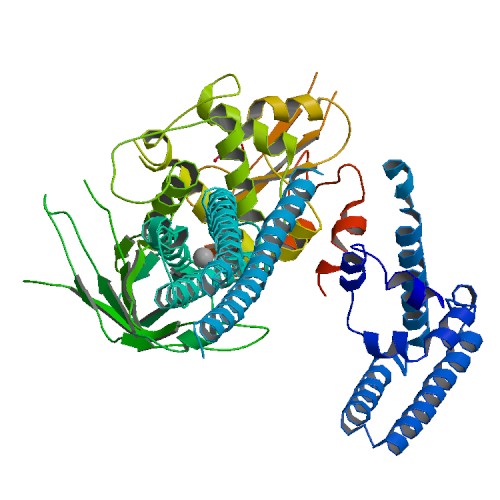 |
| Top |
| Differential gene expression and gene-gene network for STAT1 |
| Differential gene expression between mutated and non-mutated LBS samples in all 16 major cancer types |
| Differential co-expressed gene network based on protein-protein interaction data (CePIN) |
| Top |
| Top |
| Phenotype information for STAT1 |
| Gene level disease information (DisGeNet) |
| Disease ID | Disease name | # PubMed | Association type |
| umls:C2239176 | Carcinoma, Hepatocellular | 12 | Biomarker, GeneticVariation |
| umls:C0026918 | Mycobacterium Infections | 12 | Biomarker, GeneticVariation |
| umls:C0006845 | Candidiasis, Chronic Mucocutaneous | 11 | Biomarker, GeneticVariation |
| umls:C0003873 | Arthritis, Rheumatoid | 8 | Biomarker |
| umls:C0023890 | Liver Cirrhosis | 3 | Biomarker, GeneticVariation, Therapeutic |
| umls:C0993582 | Arthritis, Experimental | 2 | Biomarker |
| umls:C0010823 | Cytomegalovirus Infections | 1 | Biomarker |
| umls:C0242656 | Disease Progression | 1 | Biomarker |
| umls:C1384666 | Hearing Loss | 1 | Biomarker |
| umls:C0021400 | Influenza, Human | 1 | Biomarker |
| Mutation level pathogenic information (ClinVar annotation) |
| Allele ID | AA change | Clinical significance | Origin | Phenotype IDs |
| Top |
| Pharmacological information for STAT1 |
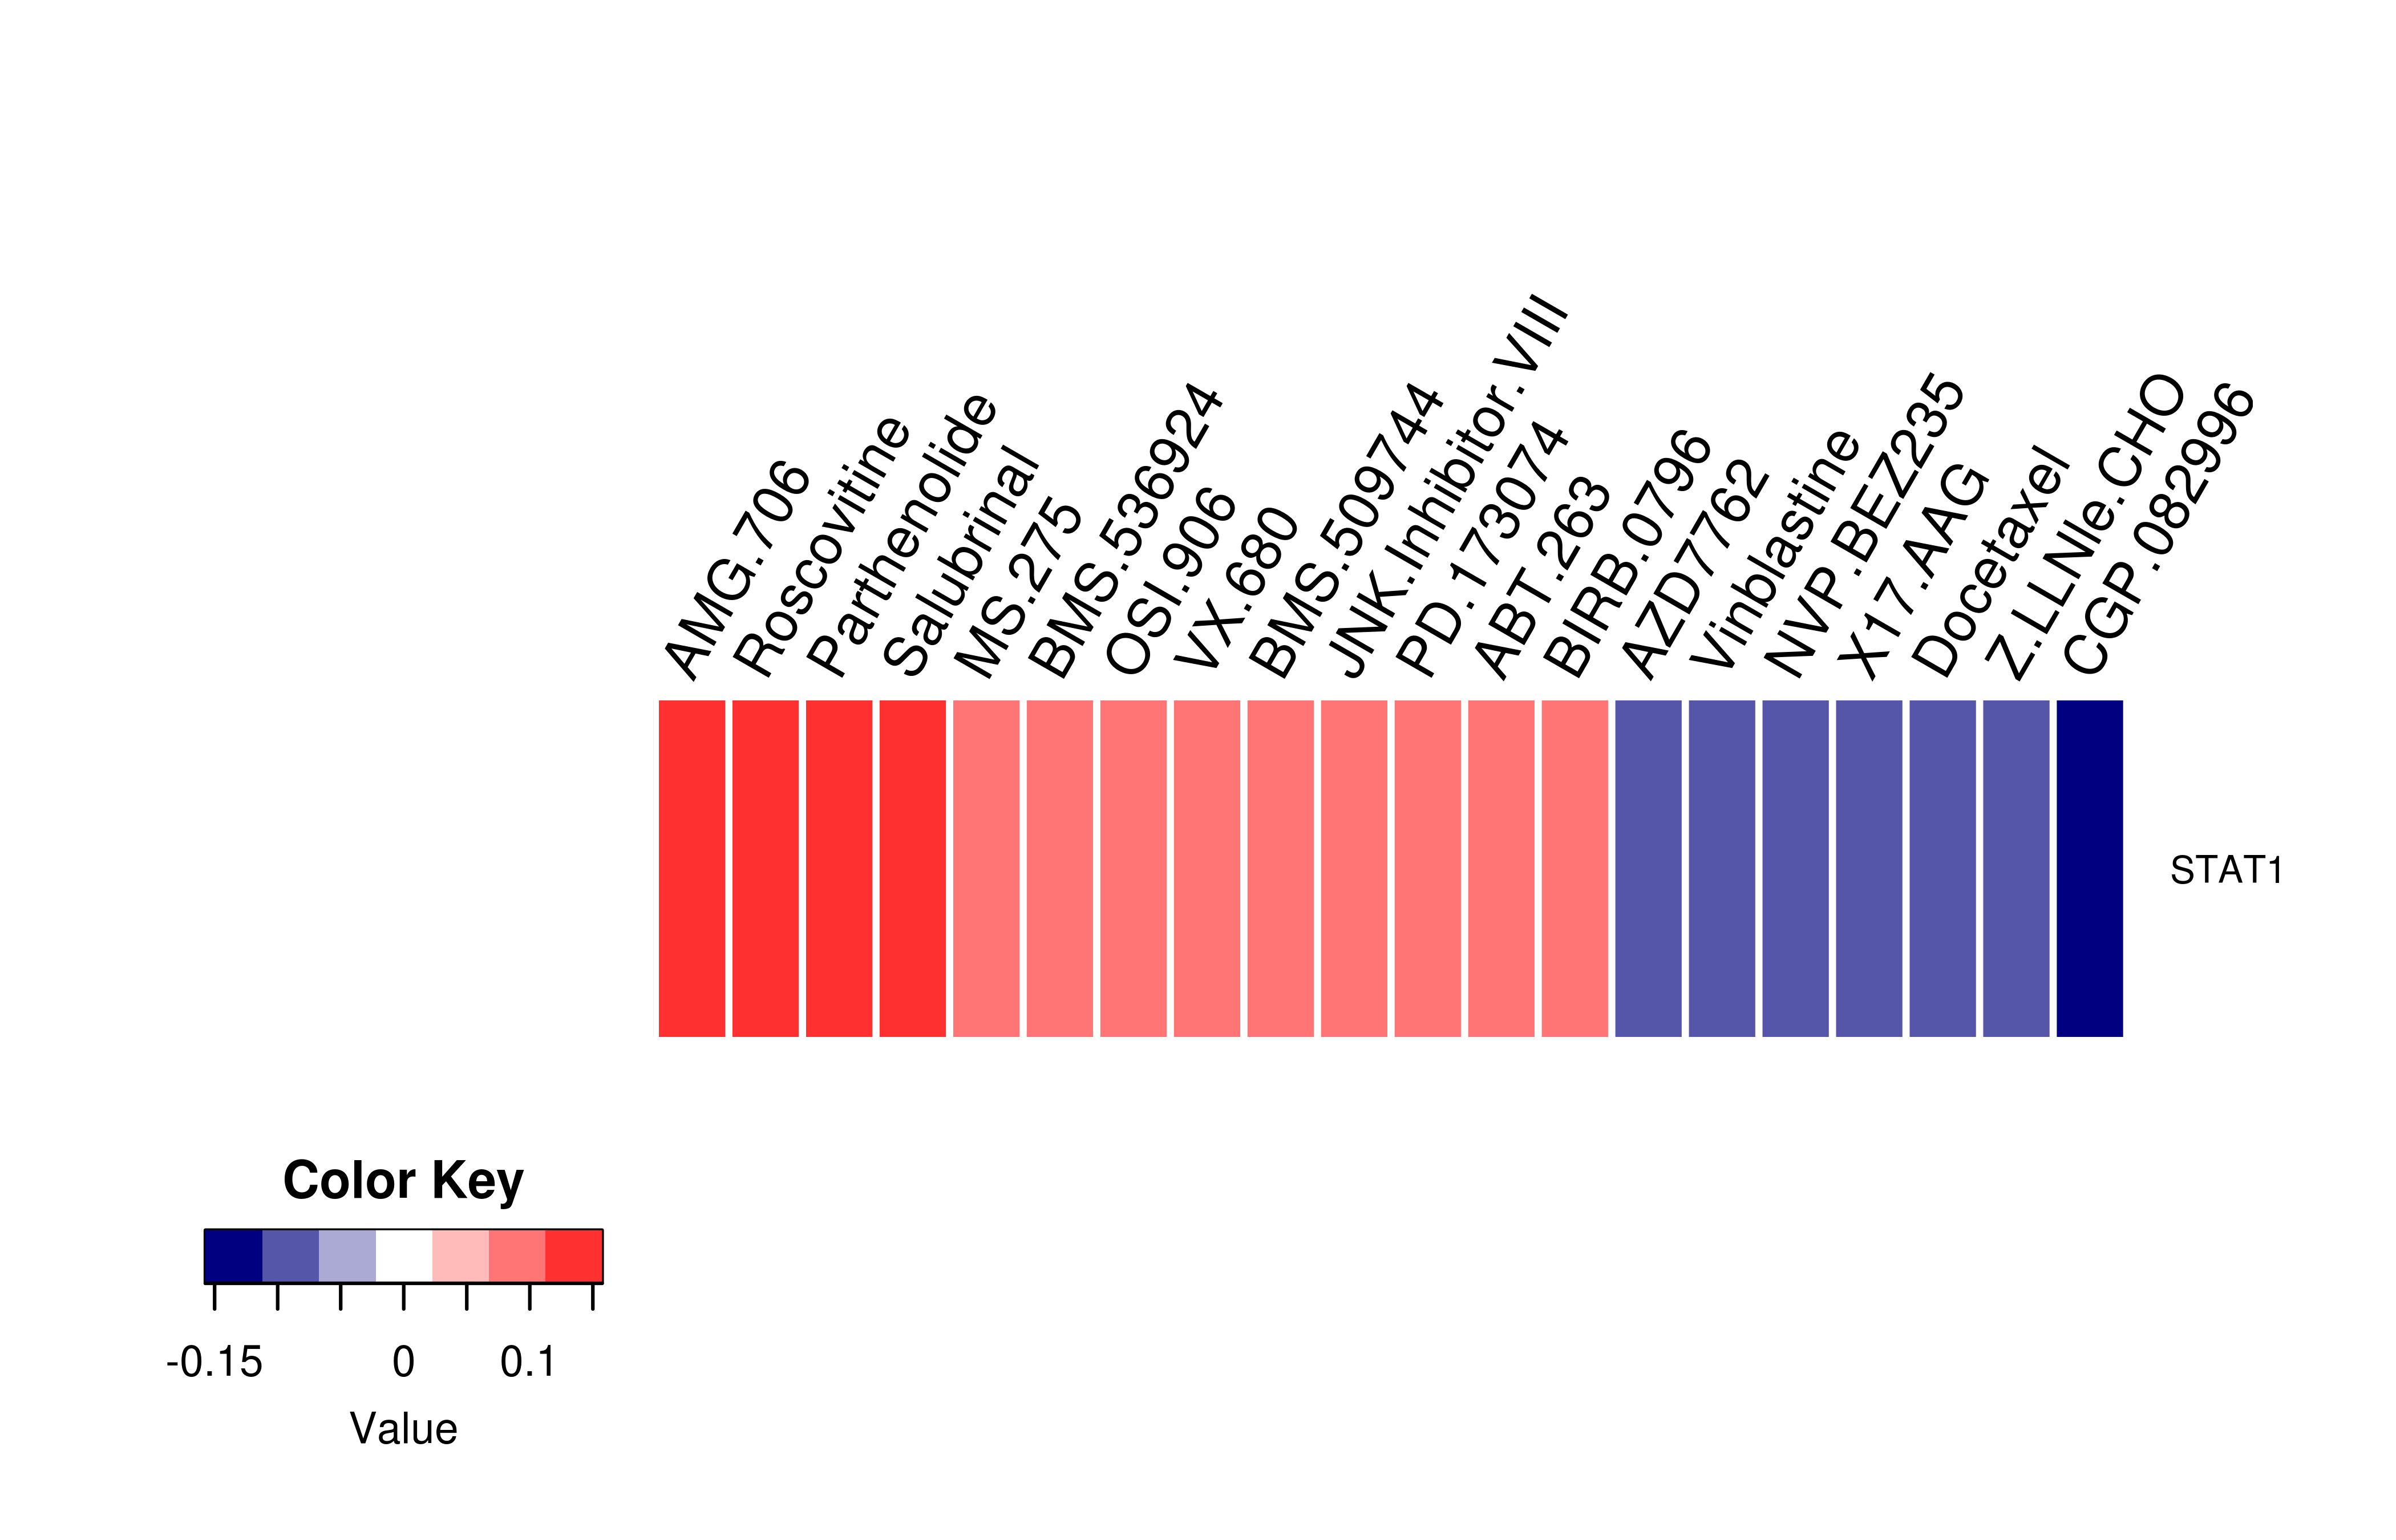
| Gene expression profile of anticancer drug treated cell-lines (CCLE) Heatmap showing the correlation between gene expression and drug response across all the cell-lines. We chose the top 20 among 138 drugs.We used Pearson's correlation coefficient. |
 |
| Drug information targeting mutLBSgene (Approved drugs only) |
| Drug status | DrugBank ID | Name | Type | Drug structure |
| Gene-centered ligand-gene interaction network |
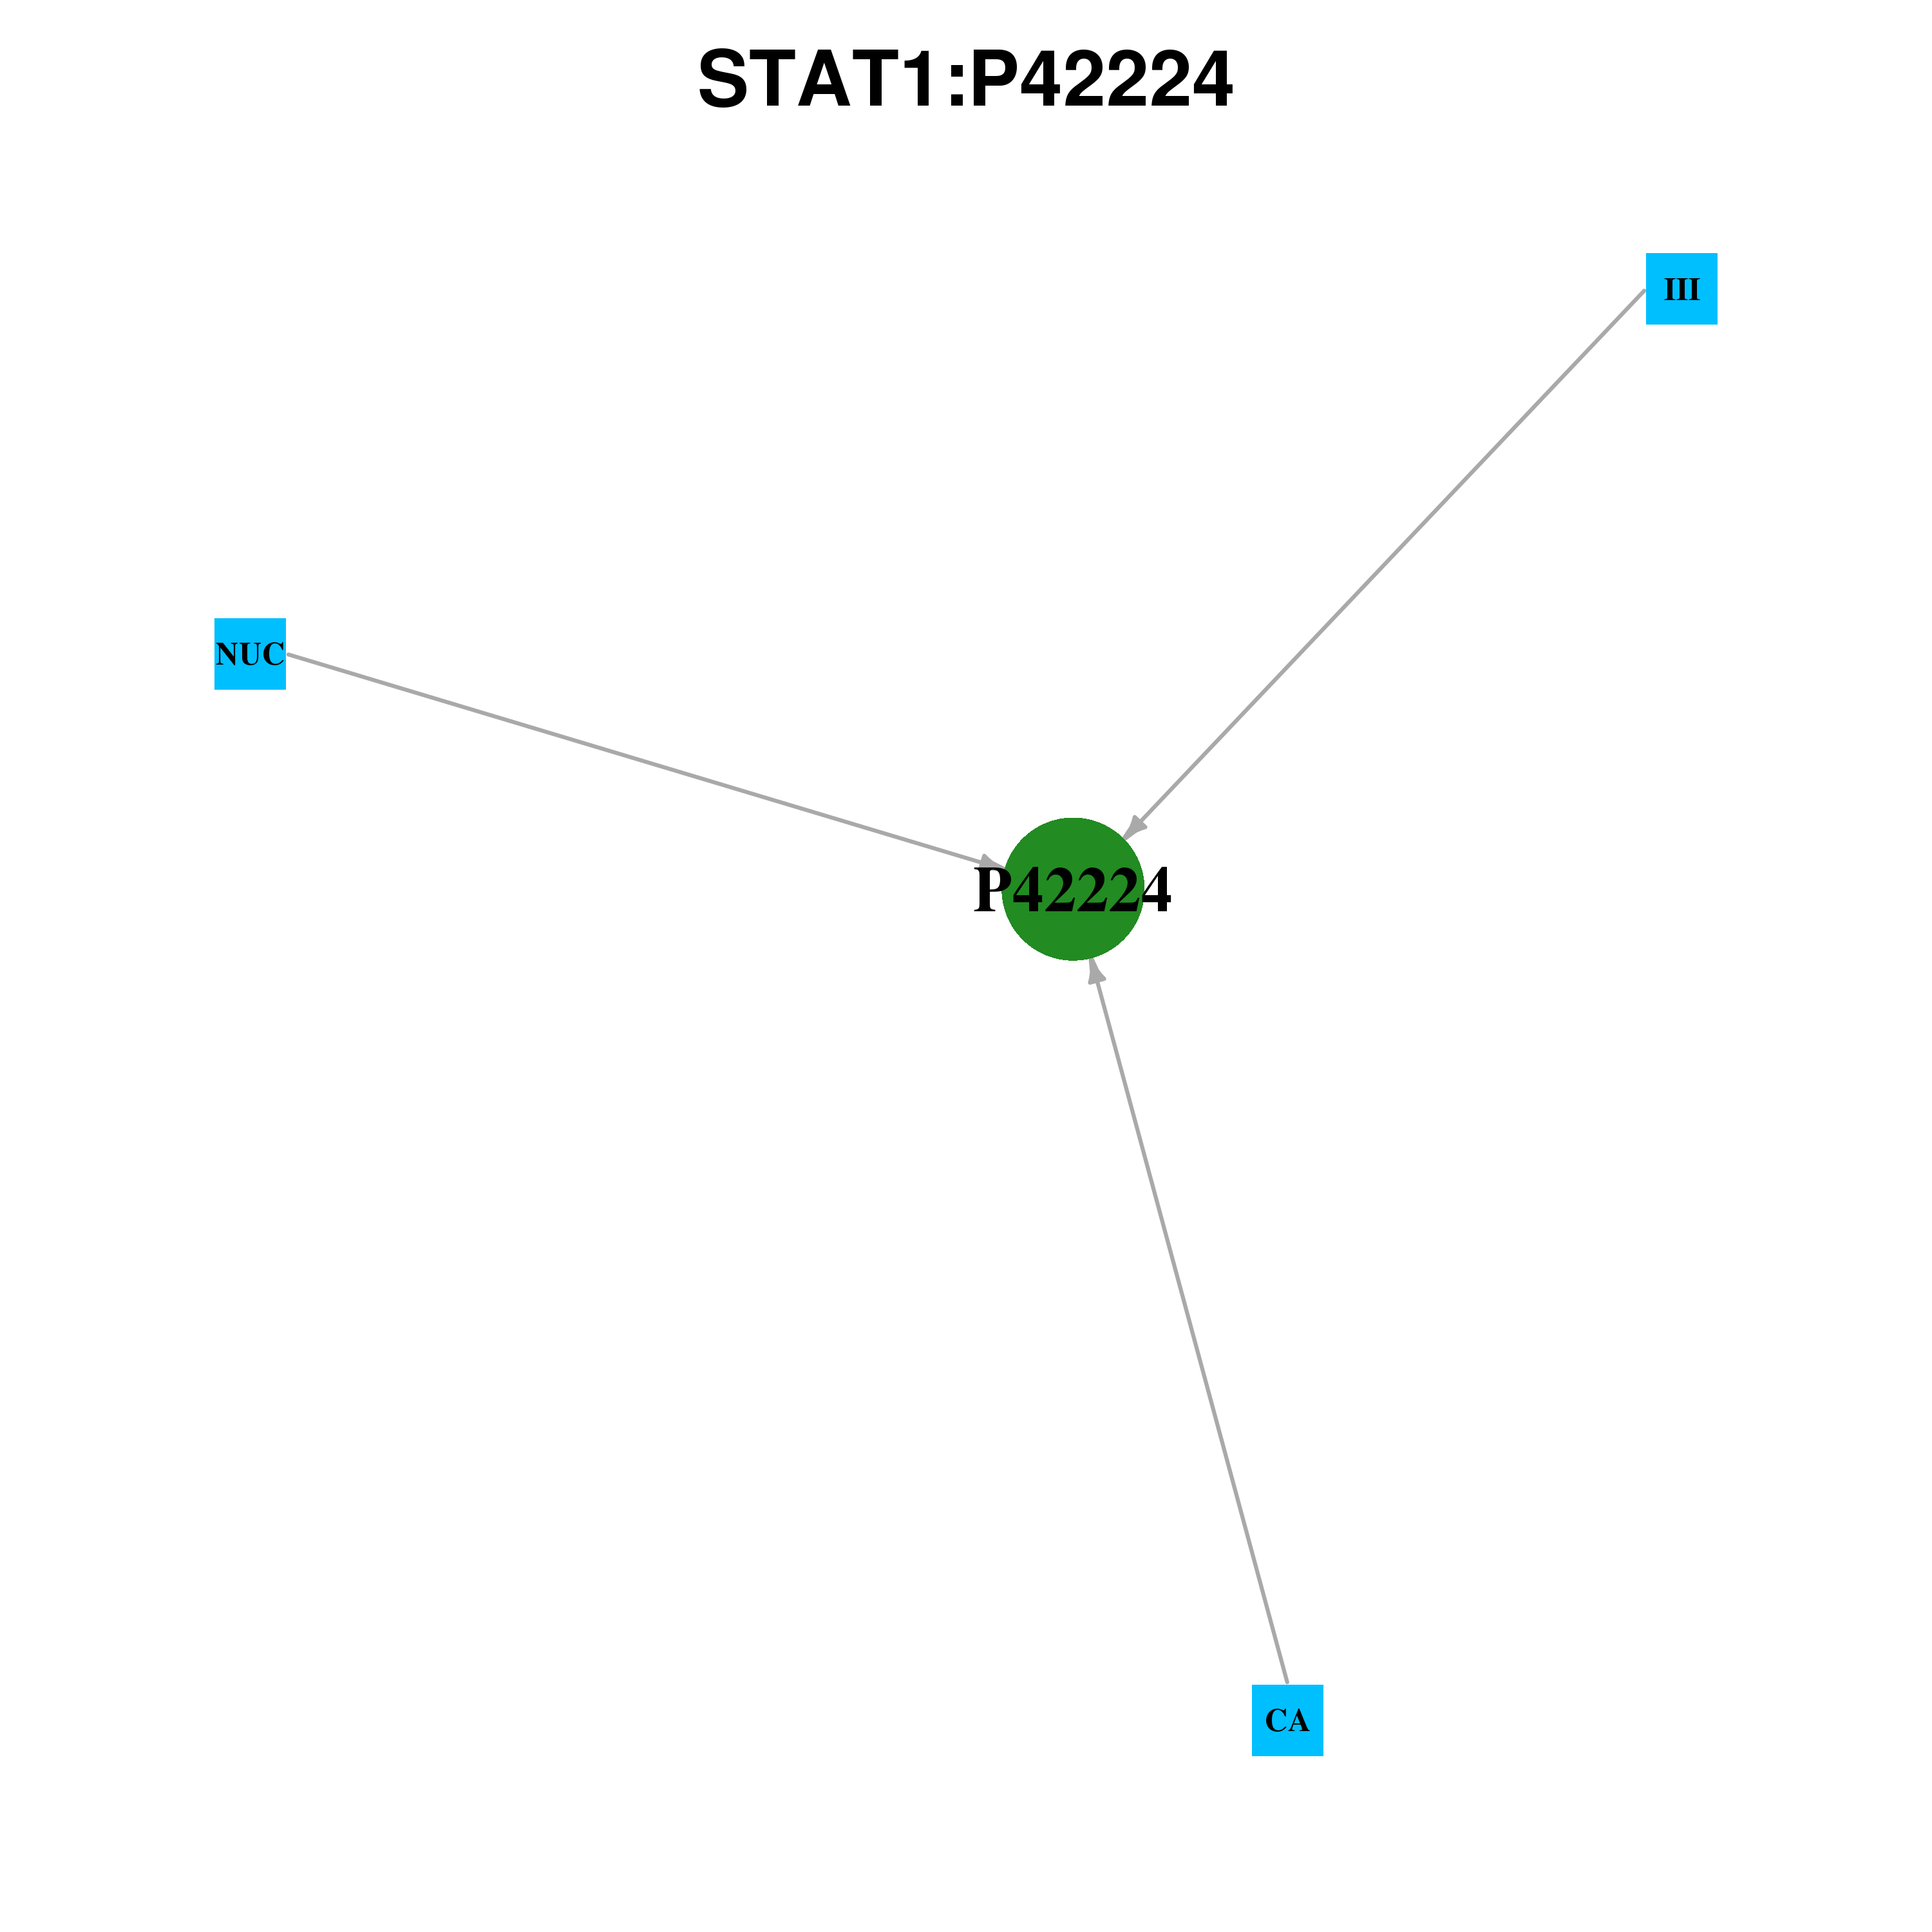 |
| Ligands binding to mutated ligand binding site of STAT1 go to BioLip |
| Ligand ID | Ligand short name | Ligand long name | PDB ID | PDB name | mutLBS | CA | CALCIUM(2+) | 3wwt | A | P27 E29 | III | Peptide ligand (TYR,ASP,LYS,PRO,HIS) | 1yvl | A | S606 A630 Y651 | NUC | Nucleic Acids | 1bf5 | A | T419 | NUC | Nucleic Acids | 1bf5 | A | V426 Q463 |
| Top |
| Conservation information for LBS of STAT1 |
| Multiple alignments for P42224 in multiple species |
| LBS | AA sequence | # species | Species |
 |
Copyright © 2016-Present - The University of Texas Health Science Center at Houston |