|
mutLBSgeneDB |
| |
| |
| |
| |
| |
| |
|

| Gene summary for TCF3 |
 Gene summary Gene summary |
| Basic gene Info. | Gene symbol | TCF3 |
| Gene name | transcription factor 3 | |
| Synonyms | E2A|E47|ITF1|TCF-3|VDIR|bHLHb21 | |
| Cytomap | UCSC genome browser: 19p13.3 | |
| Type of gene | protein-coding | |
| RefGenes | NM_001136139.2, NM_003200.3, | |
| Description | VDR interacting repressorclass B basic helix-loop-helix protein 21helix-loop-helix protein HE47immunoglobulin transcription factor 1kappa-E2-binding factornegative vitamin D response element-binding proteintranscription factor 3 (E2A immunoglobulin | |
| Modification date | 20141207 | |
| dbXrefs | MIM : 147141 | |
| HGNC : HGNC | ||
| Ensembl : ENSG00000071564 | ||
| HPRD : 00918 | ||
| Vega : OTTHUMG00000180031 | ||
| Protein | UniProt: P15923 go to UniProt's Cross Reference DB Table | |
| Expression | CleanEX: HS_TCF3 | |
| BioGPS: 6929 | ||
| Pathway | NCI Pathway Interaction Database: TCF3 | |
| KEGG: TCF3 | ||
| REACTOME: TCF3 | ||
| Pathway Commons: TCF3 | ||
| Context | iHOP: TCF3 | |
| ligand binding site mutation search in PubMed: TCF3 | ||
| UCL Cancer Institute: TCF3 | ||
| Assigned class in mutLBSgeneDB | B: This gene belongs to targetable_mutLBSgenes. | |
| Gene ontology having evidence of Inferred from Direct Assay (IDA) from Entrez |
| GO ID | GO Term | PubMed ID | GO:0000122 | negative regulation of transcription from RNA polymerase II promoter | 14576336 | GO:0002326 | B cell lineage commitment | 15030778 | GO:0006351 | transcription, DNA-templated | 10775504 | GO:0033152 | immunoglobulin V(D)J recombination | 16428437 | GO:0045787 | positive regulation of cell cycle | 11509675 | GO:0045893 | positive regulation of transcription, DNA-templated | 11509675 | GO:0045944 | positive regulation of transcription from RNA polymerase II promoter | 16043483 | GO:0051091 | positive regulation of sequence-specific DNA binding transcription factor activity | 14752053 | GO:2000045 | regulation of G1/S transition of mitotic cell cycle | 11509675 |
| Top |
| Ligand binding site mutations for TCF3 |
| Cancer type specific mutLBS sorted by frequency |
| LBS | AAchange of nsSNV | Cancer type | # samples | R561 | R561W | BRCA | 1 | N555 | R557W | COAD | 1 | R561 | R563C | STAD | 1 |
| cf) Cancer type abbreviation. BLCA: Bladder urothelial carcinoma, BRCA: Breast invasive carcinoma, CESC: Cervical squamous cell carcinoma and endocervical adenocarcinoma, COAD: Colon adenocarcinoma, GBM: Glioblastoma multiforme, LGG: Brain lower grade glioma, HNSC: Head and neck squamous cell carcinoma, KICH: Kidney chromophobe, KIRC: Kidney renal clear cell carcinoma, KIRP: Kidney renal papillary cell carcinoma, LAML: Acute myeloid leukemia, LUAD: Lung adenocarcinoma, LUSC: Lung squamous cell carcinoma, OV: Ovarian serous cystadenocarcinoma, PAAD: Pancreatic adenocarcinoma, PRAD: Prostate adenocarcinoma, SKCM: Skin cutaneous melanoma, STAD: Stomach adenocarcinoma, THCA: Thyroid carcinoma, UCEC: Uterine corpus endometrial carcinoma. |
| Top |
| Protein structure related information for TCF3 |
| Relative protein structure stability change (ΔΔE) using Mupro 1.1 Mupro score denotes assessment of the effect of mutations on thermodynamic stability. (ΔΔE<0: mutation decreases stability, ΔΔE>0: mutation increases stability) |
 : nsSNV at non-LBS : nsSNV at non-LBS : nsSNV at LBS : nsSNV at LBS |
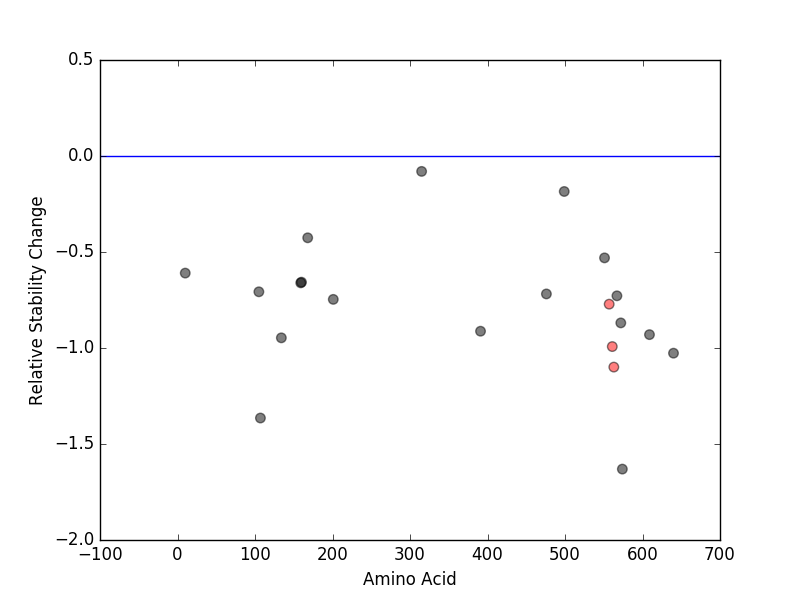 |
| nsSNVs sorted by the relative stability change of protein structure by each mutation Blue: mutations of positive stability change. and red : the most recurrent mutation for this gene. |
| LBS | AAchange of nsSNV | Relative stability change | R561 | R563C | -1.0994248 | R561 | R561W | -0.99253994 | N555 | R557W | -0.77164232 |
| (MuPro1.1: Jianlin Cheng et al., Prediction of Protein Stability Changes for Single-Site Mutations Using Support Vector Machines, PROTEINS: Structure, Function, and Bioinformatics. 2006, 62:1125-1132) |
| Structure image for TCF3 from PDB |
| Top |
| Differential gene expression and gene-gene network for TCF3 |
| Differential gene expression between mutated and non-mutated LBS samples in all 16 major cancer types |
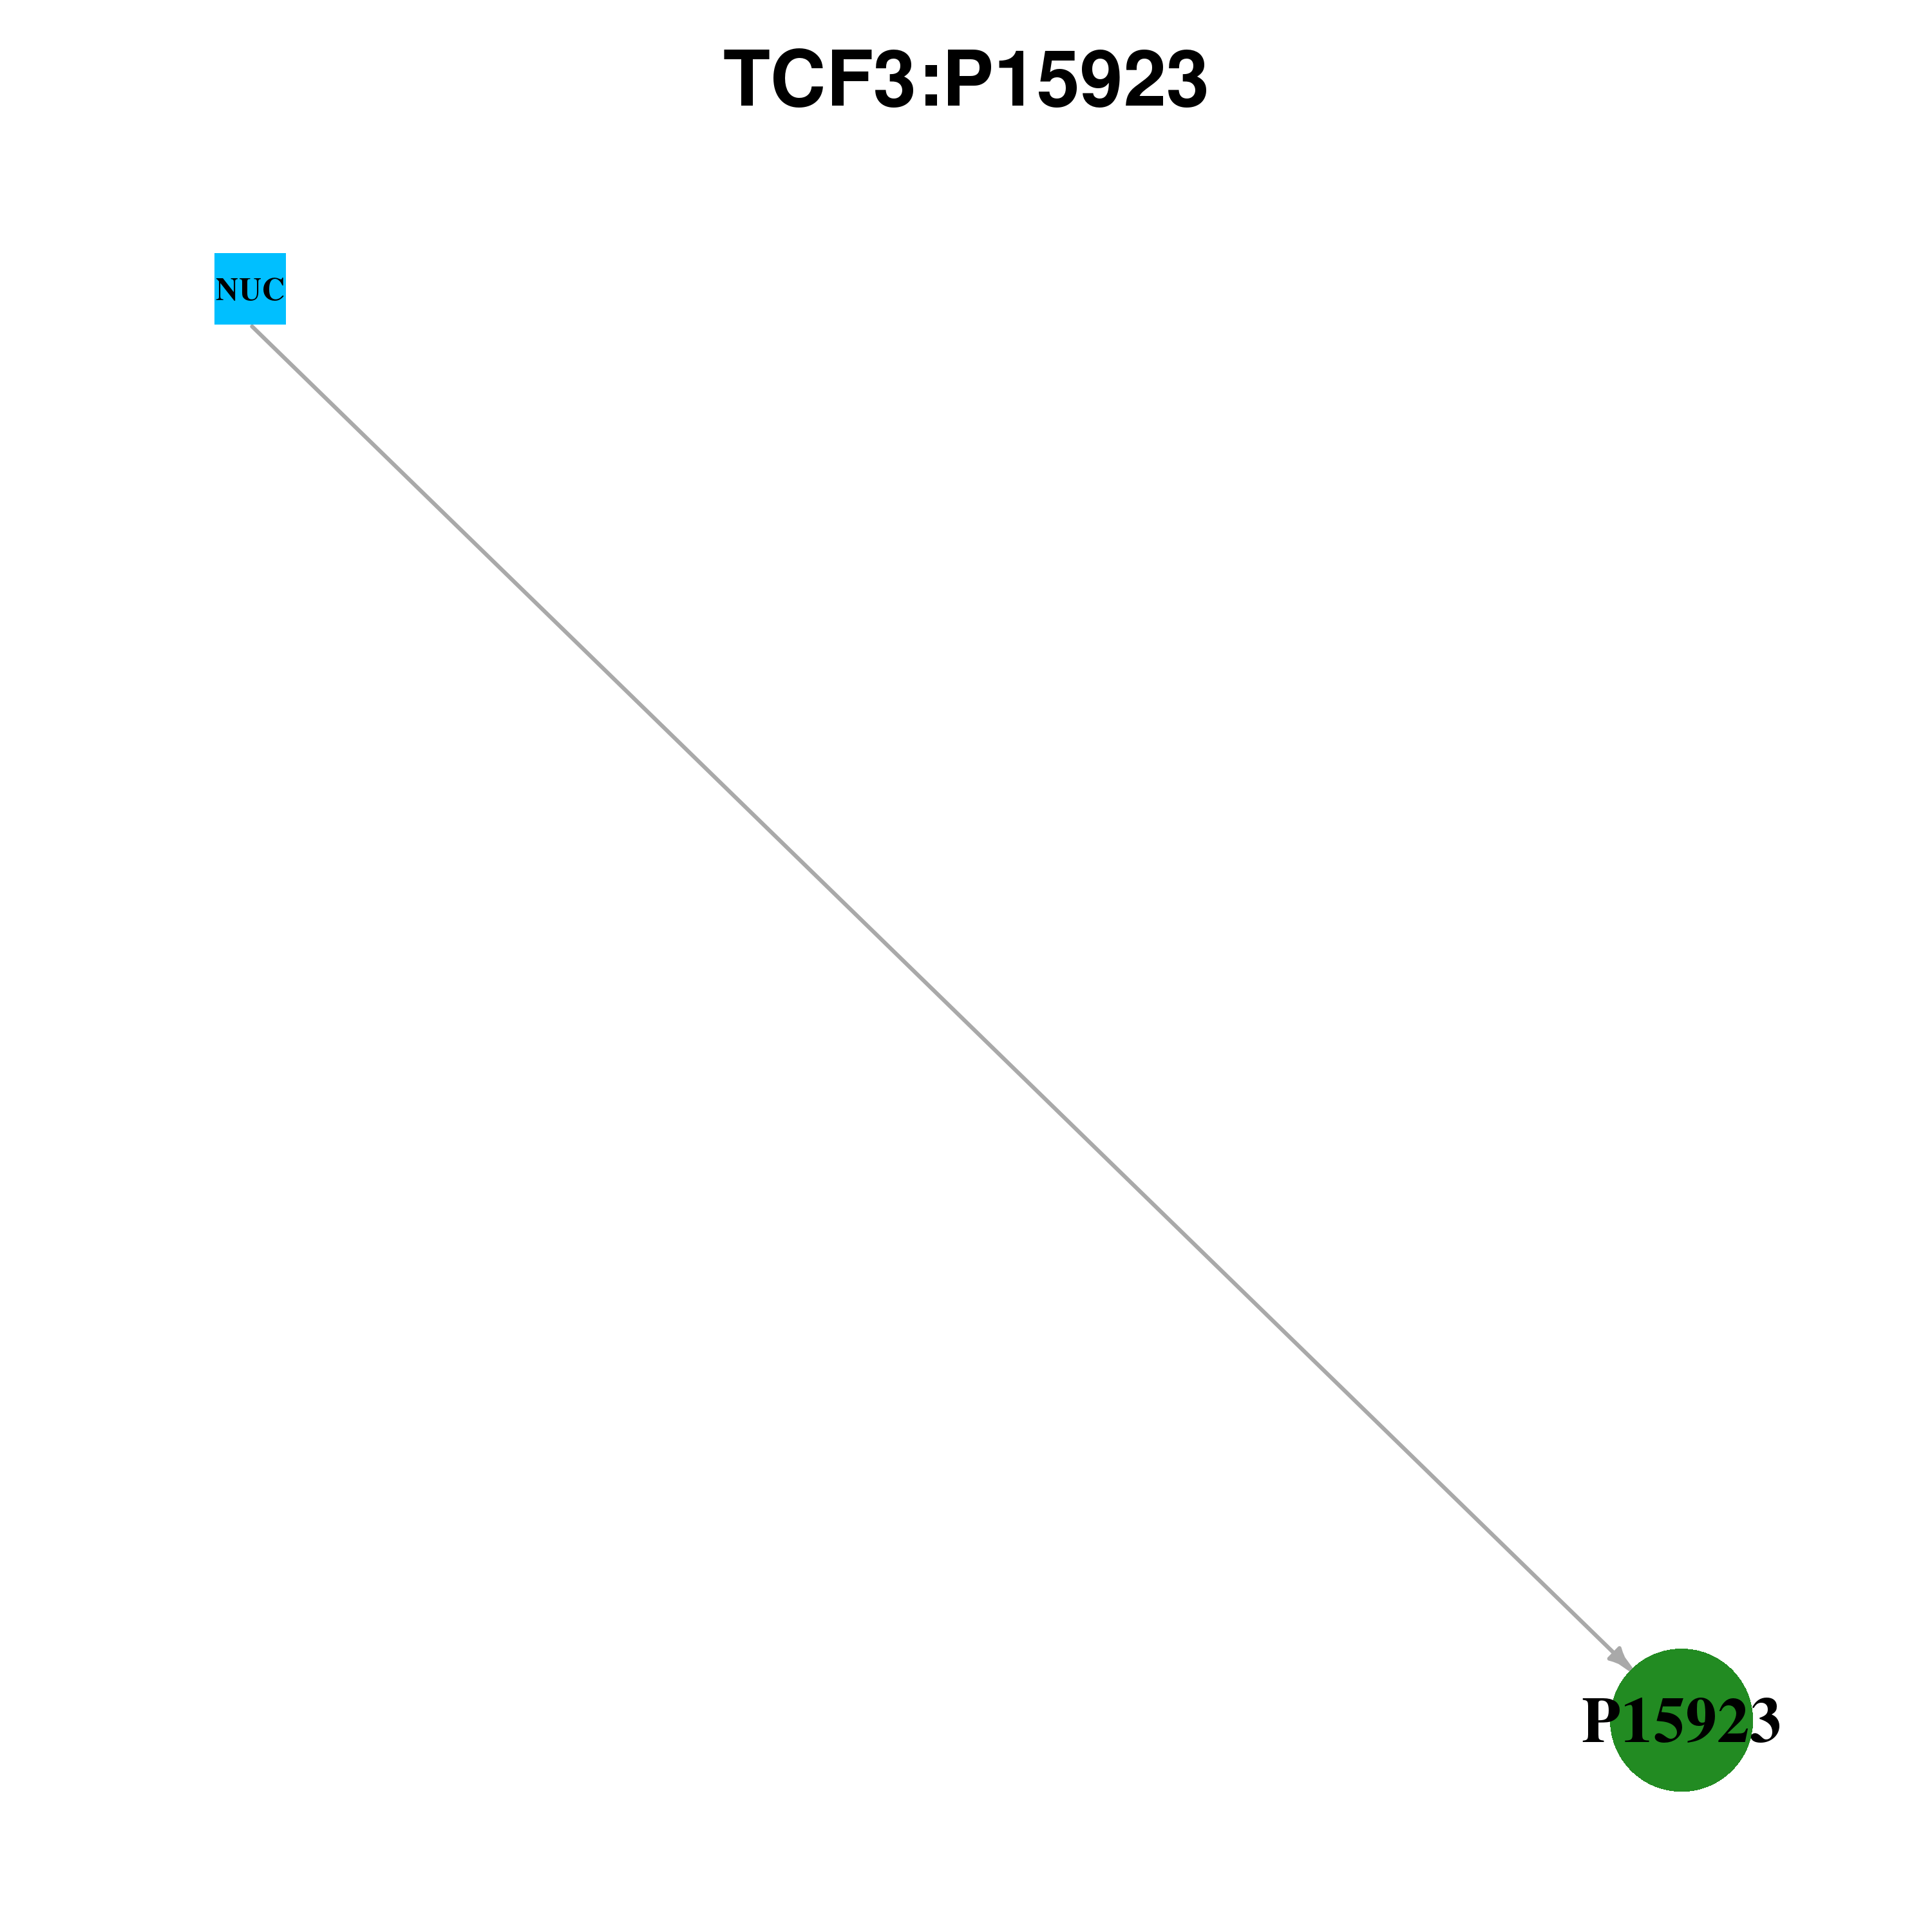
| Differential co-expressed gene network based on protein-protein interaction data (CePIN) |
| Top |
| Top |
| Phenotype information for TCF3 |
| Gene level disease information (DisGeNet) |
| Disease ID | Disease name | # PubMed | Association type |
| umls:C0023485 | Precursor B-Cell Lymphoblastic Leukemia-Lymphoma | 8 | Biomarker, GeneticVariation |
| umls:C0006413 | Burkitt Lymphoma | 5 | Biomarker |
| Mutation level pathogenic information (ClinVar annotation) |
| Allele ID | AA change | Clinical significance | Origin | Phenotype IDs |
| Top |
| Pharmacological information for TCF3 |
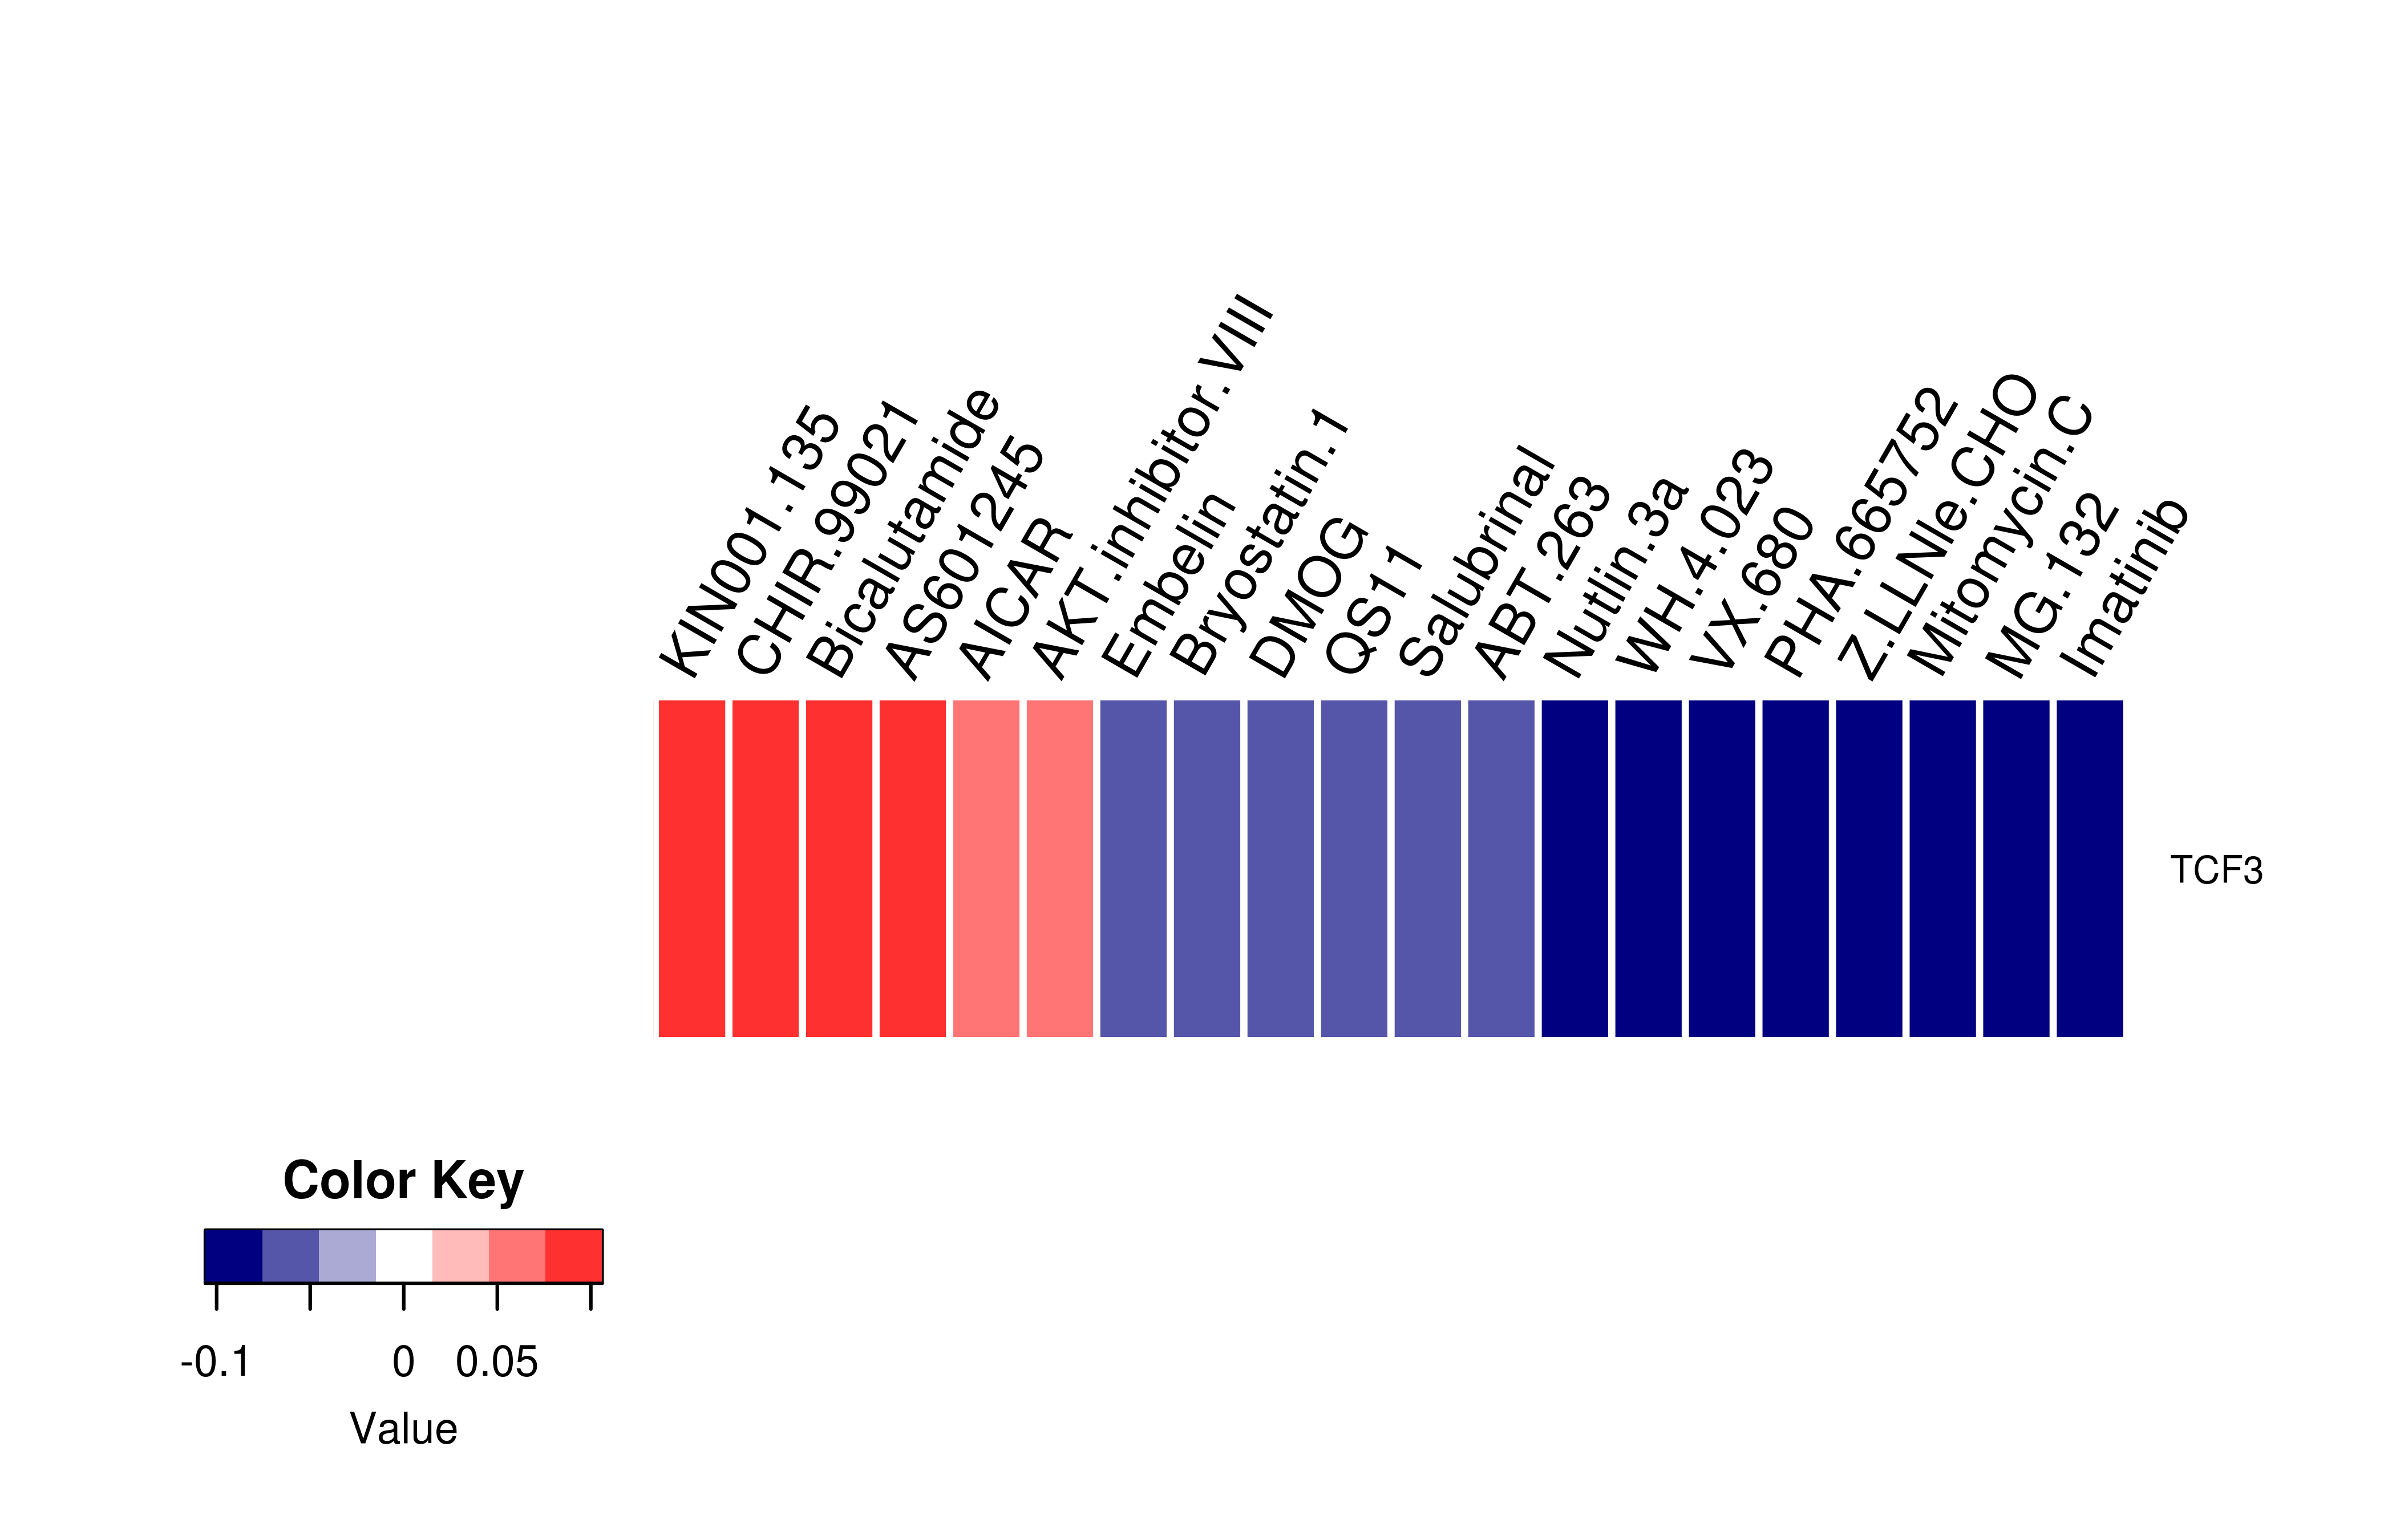
| Gene expression profile of anticancer drug treated cell-lines (CCLE) Heatmap showing the correlation between gene expression and drug response across all the cell-lines. We chose the top 20 among 138 drugs.We used Pearson's correlation coefficient. |
 |
| Drug information targeting mutLBSgene (Approved drugs only) |
| Drug status | DrugBank ID | Name | Type | Drug structure |
| Gene-centered ligand-gene interaction network |
 |
| Ligands binding to mutated ligand binding site of TCF3 go to BioLip |
| Ligand ID | Ligand short name | Ligand long name | PDB ID | PDB name | mutLBS |
| Top |
| Conservation information for LBS of TCF3 |
| Multiple alignments for P15923 in multiple species |
| LBS | AA sequence | # species | Species |
 |
Copyright © 2016-Present - The University of Texas Health Science Center at Houston |