|
mutLBSgeneDB |
| |
| |
| |
| |
| |
| |
|

| Gene summary for TCN1 |
 Gene summary Gene summary |
| Basic gene Info. | Gene symbol | TCN1 |
| Gene name | transcobalamin I (vitamin B12 binding protein, R binder family) | |
| Synonyms | HC|TC-1|TC1|TCI | |
| Cytomap | UCSC genome browser: 11q11-q12 | |
| Type of gene | protein-coding | |
| RefGenes | NM_001062.3, | |
| Description | haptocorinhaptocorrinprotein Rtranscobalamin-1 | |
| Modification date | 20141207 | |
| dbXrefs | MIM : 189905 | |
| HGNC : HGNC | ||
| Ensembl : ENSG00000134827 | ||
| HPRD : 01795 | ||
| Vega : OTTHUMG00000167400 | ||
| Protein | UniProt: P20061 go to UniProt's Cross Reference DB Table | |
| Expression | CleanEX: HS_TCN1 | |
| BioGPS: 6947 | ||
| Pathway | NCI Pathway Interaction Database: TCN1 | |
| KEGG: TCN1 | ||
| REACTOME: TCN1 | ||
| Pathway Commons: TCN1 | ||
| Context | iHOP: TCN1 | |
| ligand binding site mutation search in PubMed: TCN1 | ||
| UCL Cancer Institute: TCN1 | ||
| Assigned class in mutLBSgeneDB | C: This gene just belongs to mutLBSgenes. | |
| Gene ontology having evidence of Inferred from Direct Assay (IDA) from Entrez |
| GO ID | GO Term | PubMed ID |
| Top |
| Ligand binding site mutations for TCN1 |
| Cancer type specific mutLBS sorted by frequency |
| LBS | AAchange of nsSNV | Cancer type | # samples | E94 | E94Q | BLCA | 1 | T142 | P140T | LUSC | 1 | D186 | G188D | SKCM | 1 | D370 | T371A | STAD | 1 | G93 | S92L | UCEC | 1 |
| cf) Cancer type abbreviation. BLCA: Bladder urothelial carcinoma, BRCA: Breast invasive carcinoma, CESC: Cervical squamous cell carcinoma and endocervical adenocarcinoma, COAD: Colon adenocarcinoma, GBM: Glioblastoma multiforme, LGG: Brain lower grade glioma, HNSC: Head and neck squamous cell carcinoma, KICH: Kidney chromophobe, KIRC: Kidney renal clear cell carcinoma, KIRP: Kidney renal papillary cell carcinoma, LAML: Acute myeloid leukemia, LUAD: Lung adenocarcinoma, LUSC: Lung squamous cell carcinoma, OV: Ovarian serous cystadenocarcinoma, PAAD: Pancreatic adenocarcinoma, PRAD: Prostate adenocarcinoma, SKCM: Skin cutaneous melanoma, STAD: Stomach adenocarcinoma, THCA: Thyroid carcinoma, UCEC: Uterine corpus endometrial carcinoma. |
| Top |
| Protein structure related information for TCN1 |
| Relative protein structure stability change (ΔΔE) using Mupro 1.1 Mupro score denotes assessment of the effect of mutations on thermodynamic stability. (ΔΔE<0: mutation decreases stability, ΔΔE>0: mutation increases stability) |
 : nsSNV at non-LBS : nsSNV at non-LBS : nsSNV at LBS : nsSNV at LBS |
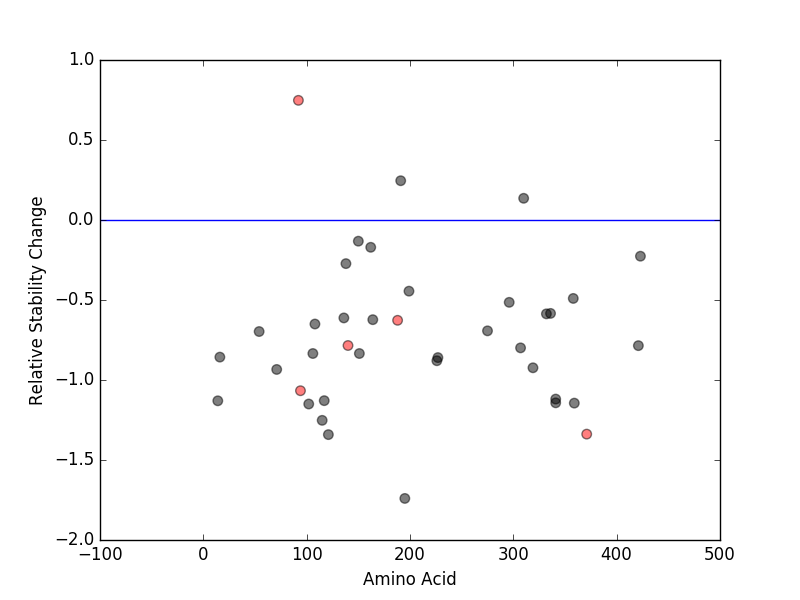 |
| nsSNVs sorted by the relative stability change of protein structure by each mutation Blue: mutations of positive stability change. and red : the most recurrent mutation for this gene. |
| LBS | AAchange of nsSNV | Relative stability change | G93 | S92L | 0.74788081 | D370 | T371A | -1.338272 | E94 | E94Q | -1.0670325 | T142 | P140T | -0.78440296 | D186 | G188D | -0.62690887 |
| (MuPro1.1: Jianlin Cheng et al., Prediction of Protein Stability Changes for Single-Site Mutations Using Support Vector Machines, PROTEINS: Structure, Function, and Bioinformatics. 2006, 62:1125-1132) |
| Structure image for TCN1 from PDB |
| Top |
| Differential gene expression and gene-gene network for TCN1 |
| Differential gene expression between mutated and non-mutated LBS samples in all 16 major cancer types |
| Differential co-expressed gene network based on protein-protein interaction data (CePIN) |
| Top |
| Top |
| Phenotype information for TCN1 |
| Gene level disease information (DisGeNet) |
| Disease ID | Disease name | # PubMed | Association type |
| umls:C0002888 | Anemia, Megaloblastic | 1 | Biomarker |
| Mutation level pathogenic information (ClinVar annotation) |
| Allele ID | AA change | Clinical significance | Origin | Phenotype IDs |
| Top |
| Pharmacological information for TCN1 |
| Gene expression profile of anticancer drug treated cell-lines (CCLE) Heatmap showing the correlation between gene expression and drug response across all the cell-lines. We chose the top 20 among 138 drugs.We used Pearson's correlation coefficient. |
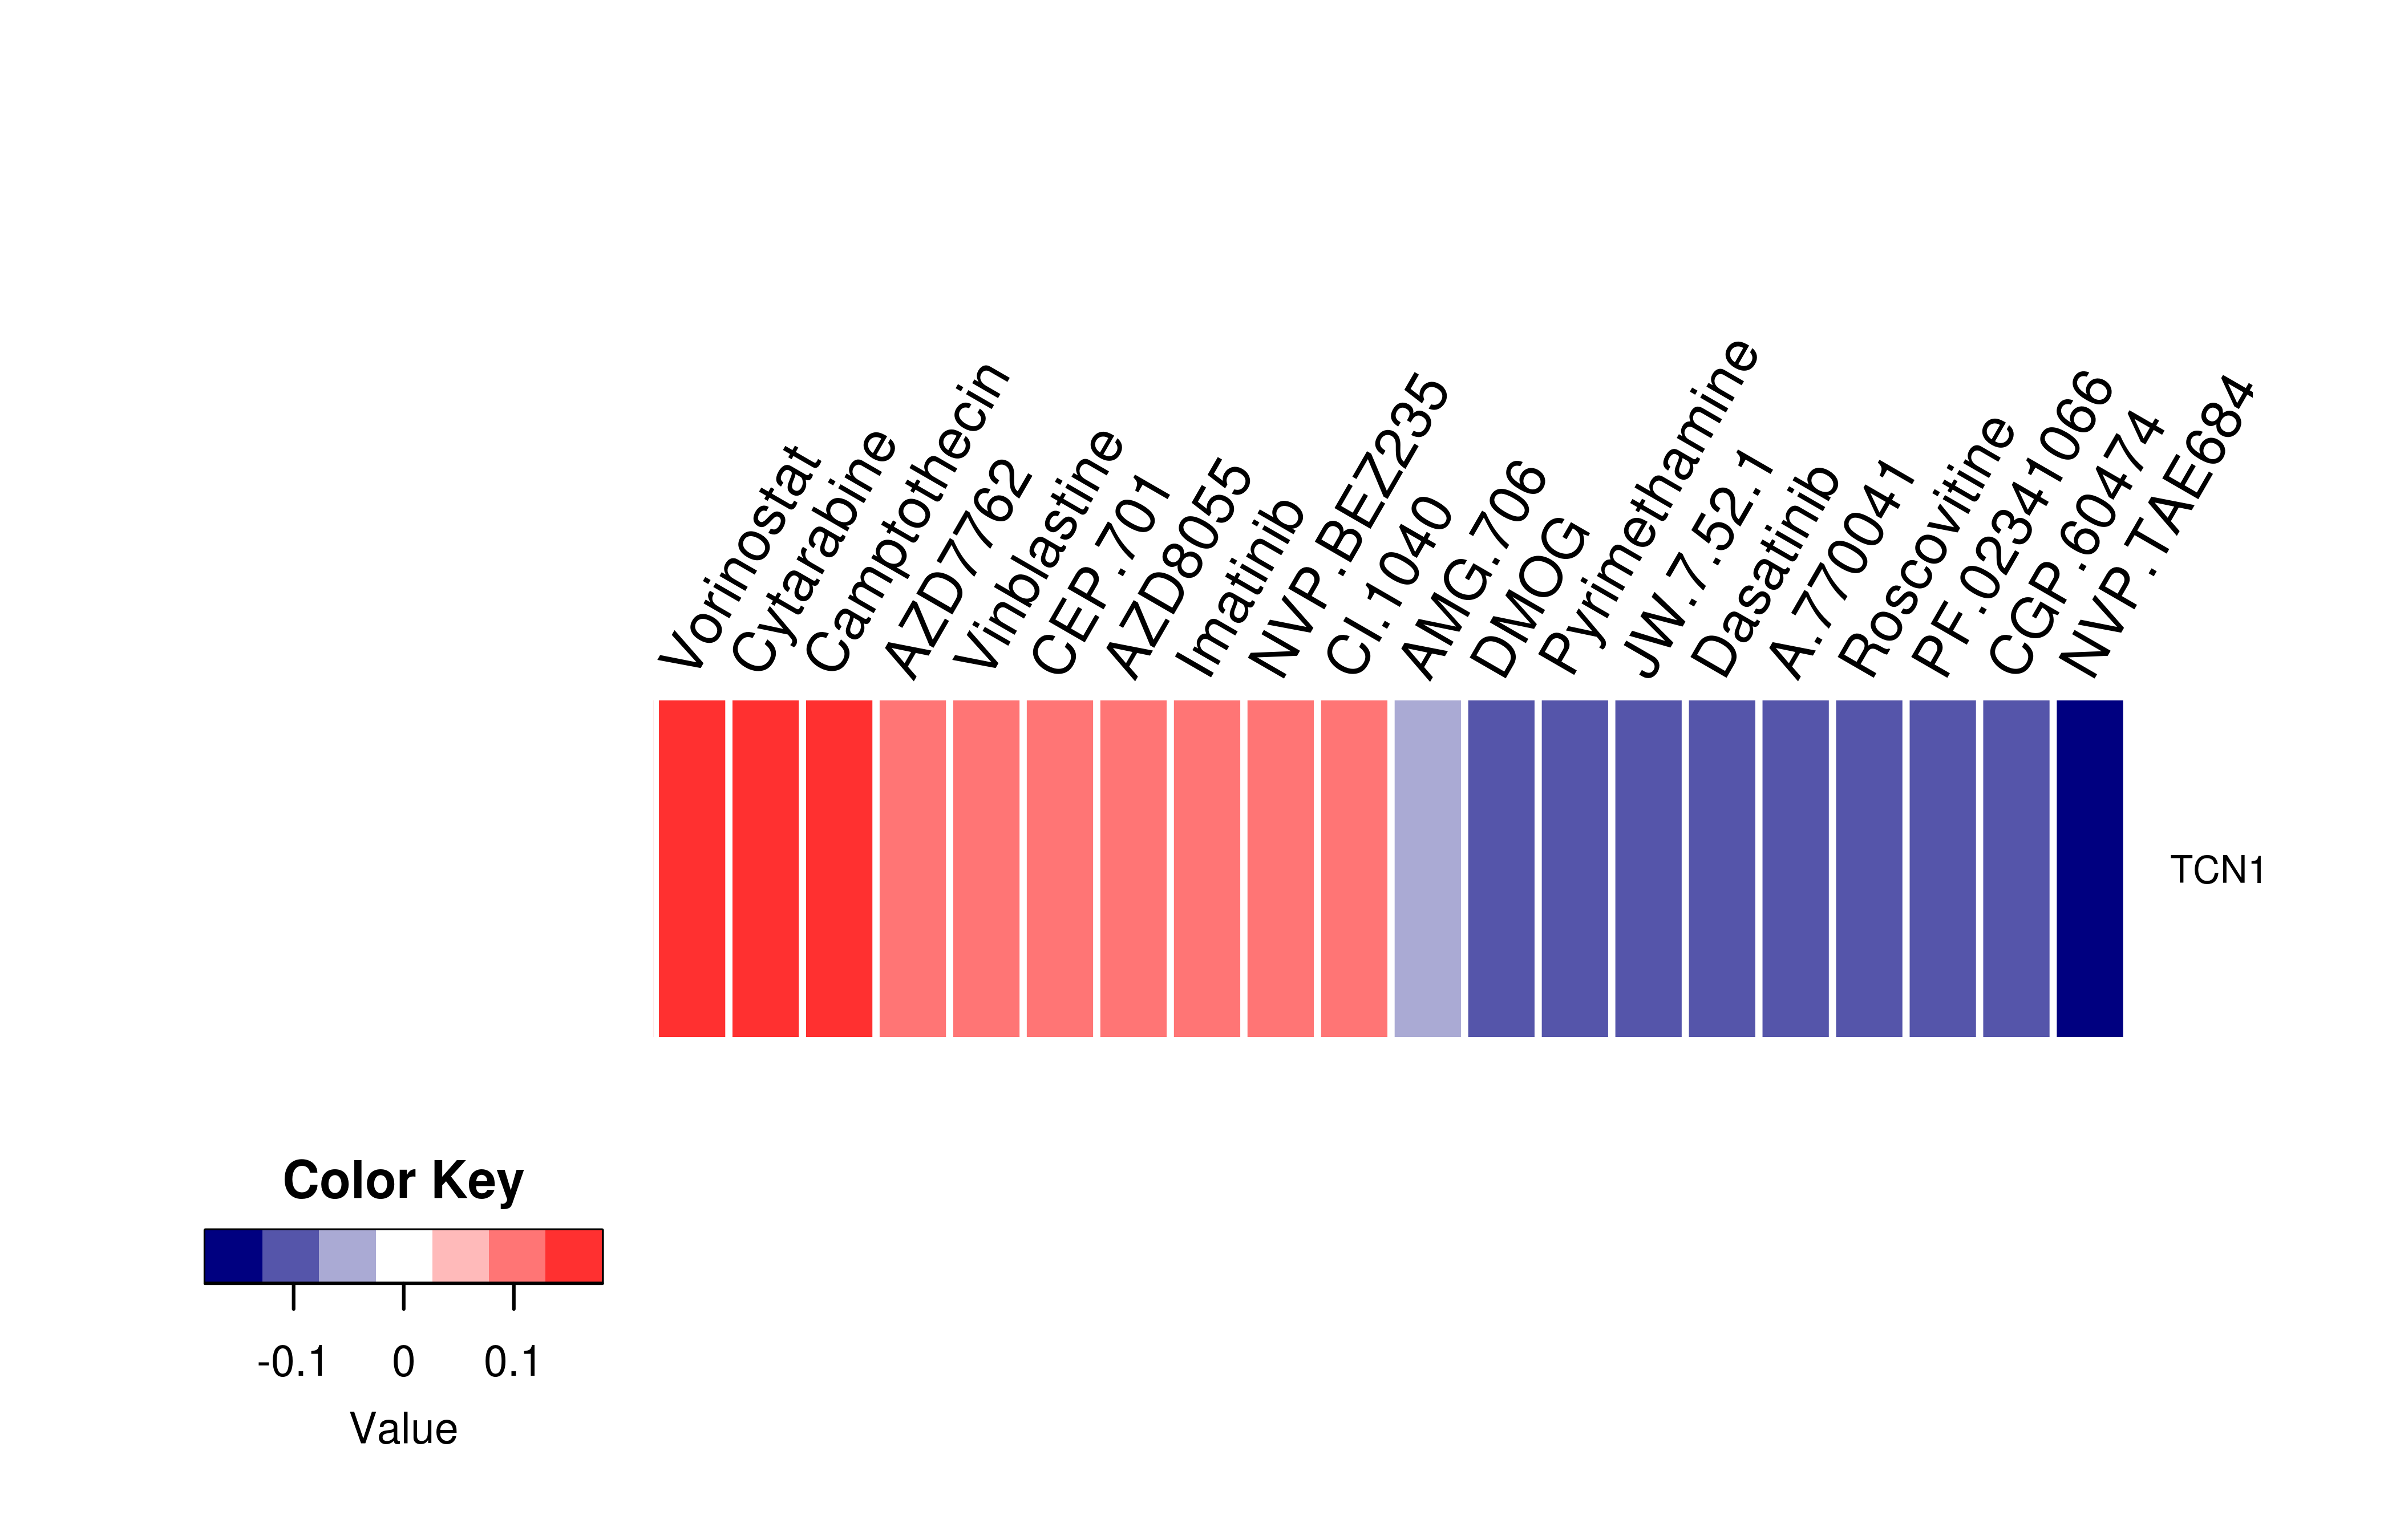 |
| Gene-centered drug-gene interaction network |
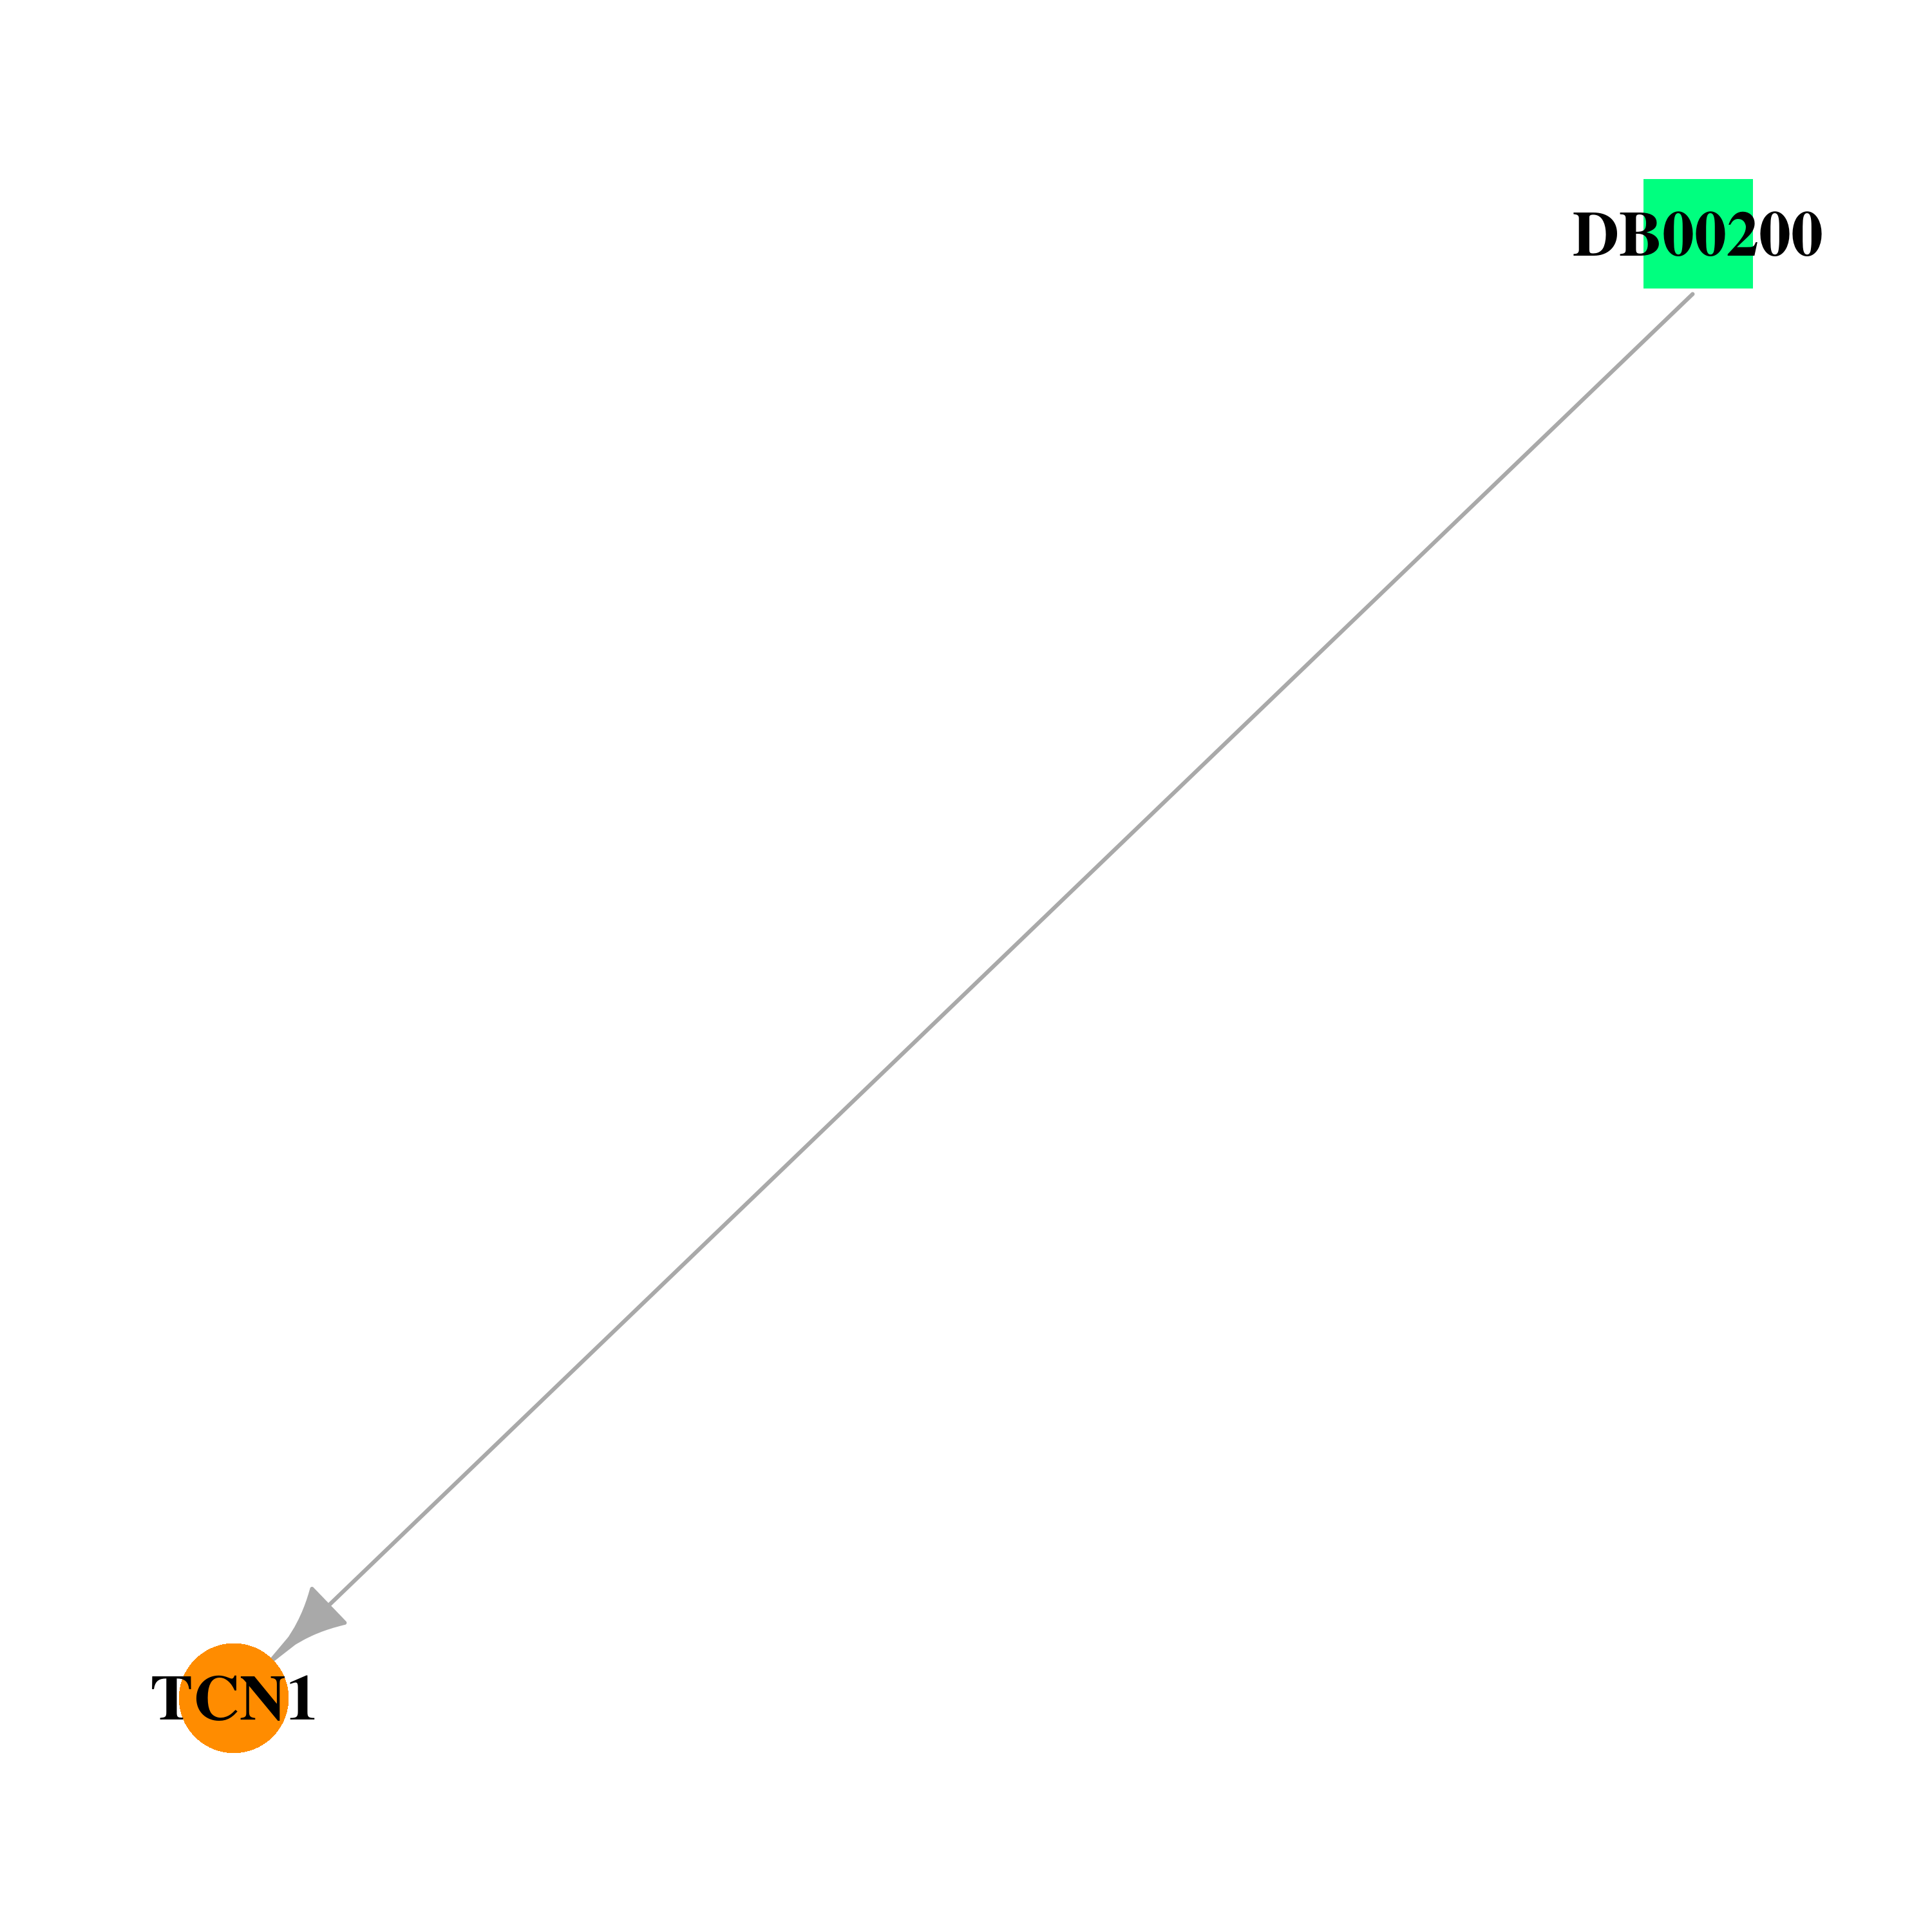 |
| Drug information targeting mutLBSgene (Approved drugs only) |
| Drug status | DrugBank ID | Name | Type | Drug structure |
| Approved | DB00200 | Hydroxocobalamin | Small molecule | 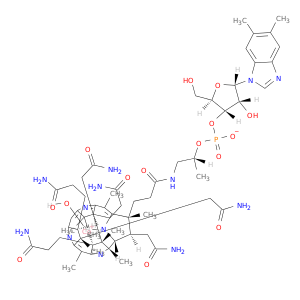 |
| Gene-centered ligand-gene interaction network |
 |
| Ligands binding to mutated ligand binding site of TCN1 go to BioLip |
| Ligand ID | Ligand short name | Ligand long name | PDB ID | PDB name | mutLBS |
| Top |
| Conservation information for LBS of TCN1 |
| Multiple alignments for P20061 in multiple species |
| LBS | AA sequence | # species | Species |
 |
Copyright © 2016-Present - The University of Texas Health Science Center at Houston |