|
mutLBSgeneDB |
| |
| |
| |
| |
| |
| |
|

| Gene summary for EHMT1 |
 Gene summary Gene summary |
| Basic gene Info. | Gene symbol | EHMT1 |
| Gene name | euchromatic histone-lysine N-methyltransferase 1 | |
| Synonyms | EUHMTASE1|Eu-HMTase1|FP13812|GLP|GLP1|KMT1D|bA188C12.1 | |
| Cytomap | UCSC genome browser: 9q34.3 | |
| Type of gene | protein-coding | |
| RefGenes | NM_001145527.1, NM_024757.4, | |
| Description | G9a-like protein 1H3-K9-HMTase 5histone H3-K9 methyltransferase 5histone-lysine N-methyltransferase EHMT1histone-lysine N-methyltransferase, H3 lysine-9 specific 5lysine N-methyltransferase 1D | |
| Modification date | 20141219 | |
| dbXrefs | MIM : 607001 | |
| HGNC : HGNC | ||
| Ensembl : ENSG00000181090 | ||
| HPRD : 07383 | ||
| Vega : OTTHUMG00000020995 | ||
| Protein | UniProt: Q9H9B1 go to UniProt's Cross Reference DB Table | |
| Expression | CleanEX: HS_EHMT1 | |
| BioGPS: 79813 | ||
| Pathway | NCI Pathway Interaction Database: EHMT1 | |
| KEGG: EHMT1 | ||
| REACTOME: EHMT1 | ||
| Pathway Commons: EHMT1 | ||
| Context | iHOP: EHMT1 | |
| ligand binding site mutation search in PubMed: EHMT1 | ||
| UCL Cancer Institute: EHMT1 | ||
| Assigned class in mutLBSgeneDB | B: This gene belongs to targetable_mutLBSgenes. | |
| Gene ontology having evidence of Inferred from Direct Assay (IDA) from Entrez |
| GO ID | GO Term | PubMed ID | GO:0016568 | chromatin modification | 12004135 | GO:0016571 | histone methylation | 12004135 | GO:0018027 | peptidyl-lysine dimethylation | 20118233 |
| Top |
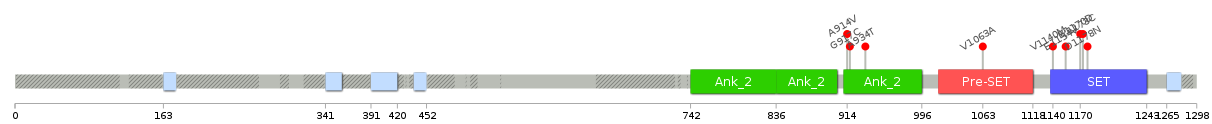
| Ligand binding site mutations for EHMT1 |
| Lollipop-style diagram of mutations at LBS in amino-acid sequence. We represented ligand binding site mutations only. (You can see big image via clicking.) |
 |
| Cancer type specific mutLBS sorted by frequency |
| LBS | AAchange of nsSNV | Cancer type | # samples | D1178 | D1178N | COAD | 1 | C1062 | V1063A | COAD | 1 | Y1173 | Y1173C | COAD | 1 | Y1155 | E1154V | COAD | 1 | F915 | G917C | LUSC | 1 | W1138 | V1140M | STAD | 1 | F915 | A914V | UCEC | 1 | N936 | A934T | UCEC | 1 | D1171,E1169 | E1170D | UCEC | 1 |
| cf) Cancer type abbreviation. BLCA: Bladder urothelial carcinoma, BRCA: Breast invasive carcinoma, CESC: Cervical squamous cell carcinoma and endocervical adenocarcinoma, COAD: Colon adenocarcinoma, GBM: Glioblastoma multiforme, LGG: Brain lower grade glioma, HNSC: Head and neck squamous cell carcinoma, KICH: Kidney chromophobe, KIRC: Kidney renal clear cell carcinoma, KIRP: Kidney renal papillary cell carcinoma, LAML: Acute myeloid leukemia, LUAD: Lung adenocarcinoma, LUSC: Lung squamous cell carcinoma, OV: Ovarian serous cystadenocarcinoma, PAAD: Pancreatic adenocarcinoma, PRAD: Prostate adenocarcinoma, SKCM: Skin cutaneous melanoma, STAD: Stomach adenocarcinoma, THCA: Thyroid carcinoma, UCEC: Uterine corpus endometrial carcinoma. |
| Top |
| Protein structure related information for EHMT1 |
| Relative protein structure stability change (ΔΔE) using Mupro 1.1 Mupro score denotes assessment of the effect of mutations on thermodynamic stability. (ΔΔE<0: mutation decreases stability, ΔΔE>0: mutation increases stability) |
 : nsSNV at non-LBS : nsSNV at non-LBS : nsSNV at LBS : nsSNV at LBS |
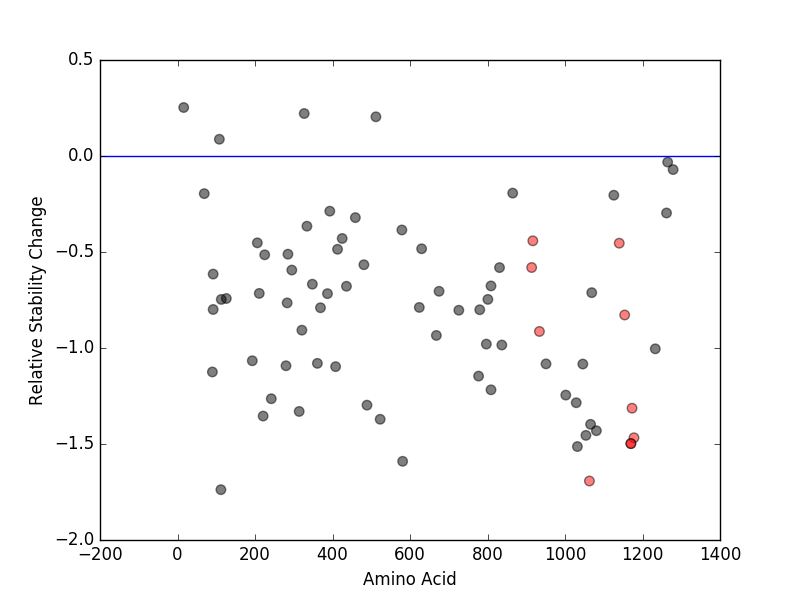 |
| nsSNVs sorted by the relative stability change of protein structure by each mutation Blue: mutations of positive stability change. and red : the most recurrent mutation for this gene. |
| LBS | AAchange of nsSNV | Relative stability change | C1062 | V1063A | -1.6927401 | E1169 | E1170D | -1.4978539 | D1171 | E1170D | -1.4978539 | D1178 | D1178N | -1.4675492 | Y1173 | Y1173C | -1.3135736 | N936 | A934T | -0.91383454 | Y1155 | E1154V | -0.82805077 | F915 | A914V | -0.58081429 | W1138 | V1140M | -0.45412568 | F915 | G917C | -0.44169811 |
| (MuPro1.1: Jianlin Cheng et al., Prediction of Protein Stability Changes for Single-Site Mutations Using Support Vector Machines, PROTEINS: Structure, Function, and Bioinformatics. 2006, 62:1125-1132) |
| Structure image for EHMT1 from PDB |
| Top |
| Differential gene expression and gene-gene network for EHMT1 |
| Differential gene expression between mutated and non-mutated LBS samples in all 16 major cancer types |
| Differential co-expressed gene network based on protein-protein interaction data (CePIN) |
| Top |
| Top |
| Phenotype information for EHMT1 |
| Gene level disease information (DisGeNet) |
| Disease ID | Disease name | # PubMed | Association type |
| umls:C0795833 | Kleefstra Syndrome | 8 | Biomarker, GeneticVariation |
| umls:C0025149 | Medulloblastoma | 1 | Biomarker |
| Mutation level pathogenic information (ClinVar annotation) |
| Allele ID | AA change | Clinical significance | Origin | Phenotype IDs |
| Top |
| Pharmacological information for EHMT1 |
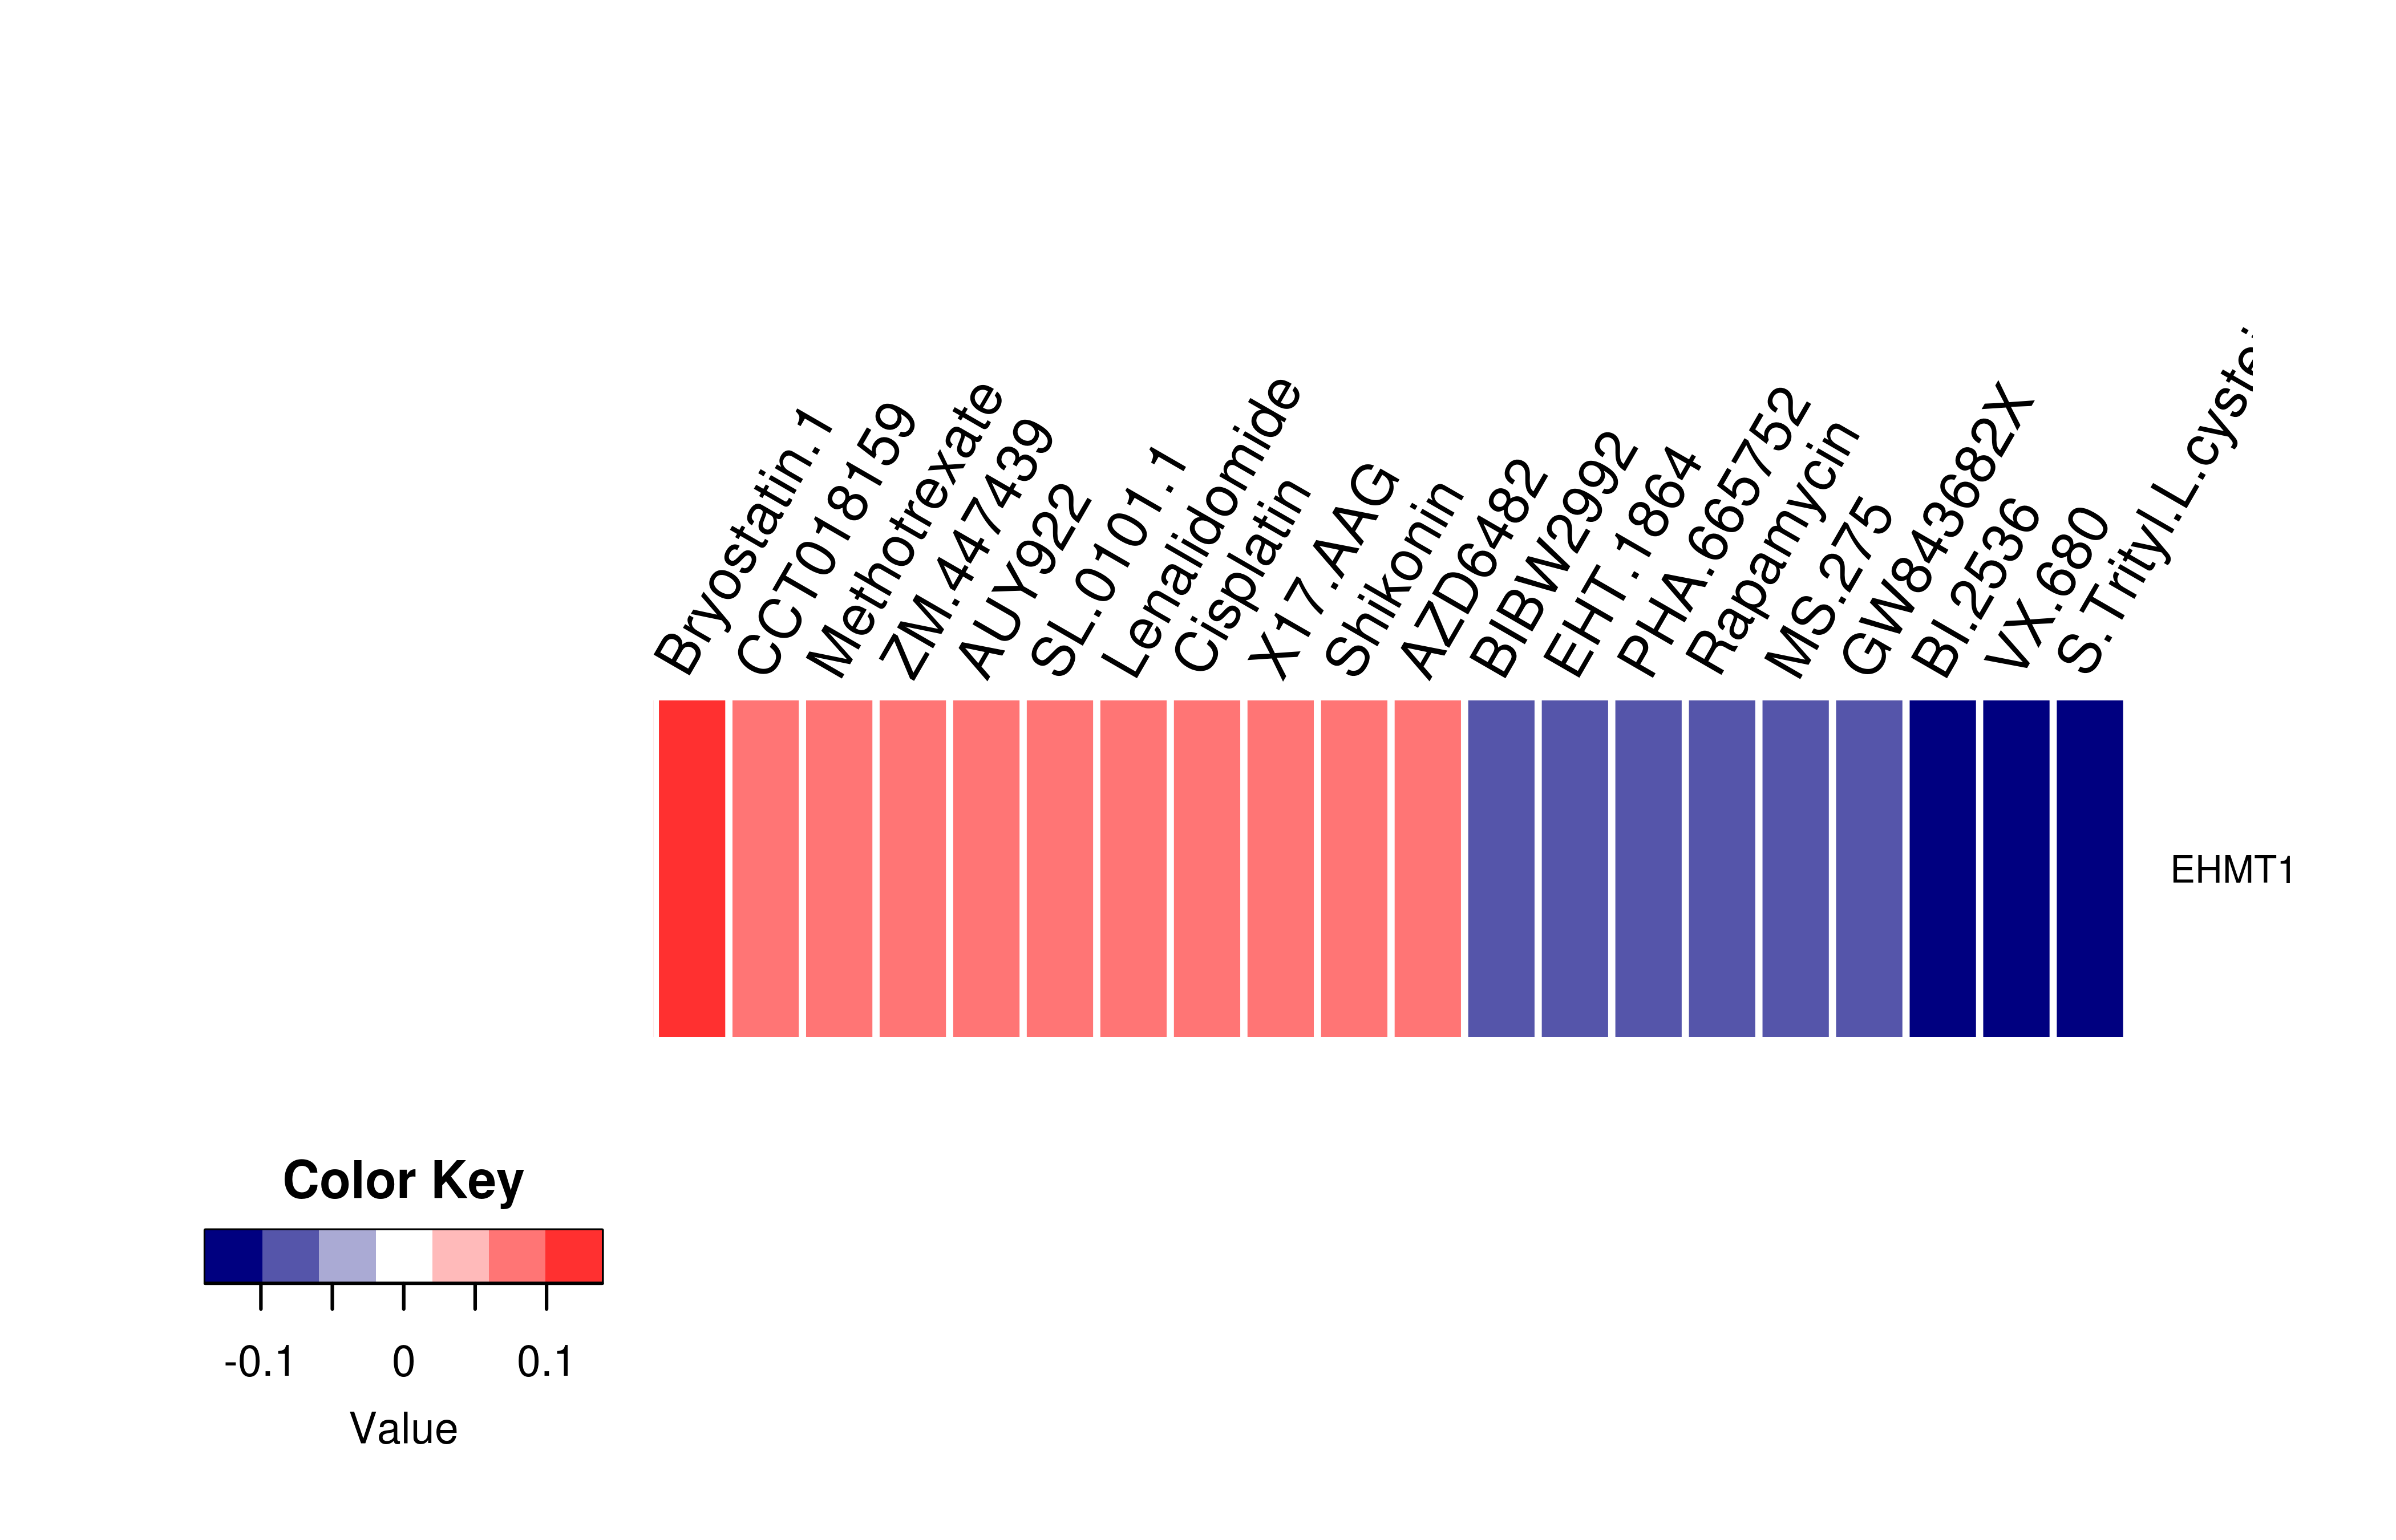
| Gene expression profile of anticancer drug treated cell-lines (CCLE) Heatmap showing the correlation between gene expression and drug response across all the cell-lines. We chose the top 20 among 138 drugs.We used Pearson's correlation coefficient. |
 |
| Drug information targeting mutLBSgene (Approved drugs only) |
| Drug status | DrugBank ID | Name | Type | Drug structure |
| Gene-centered ligand-gene interaction network |
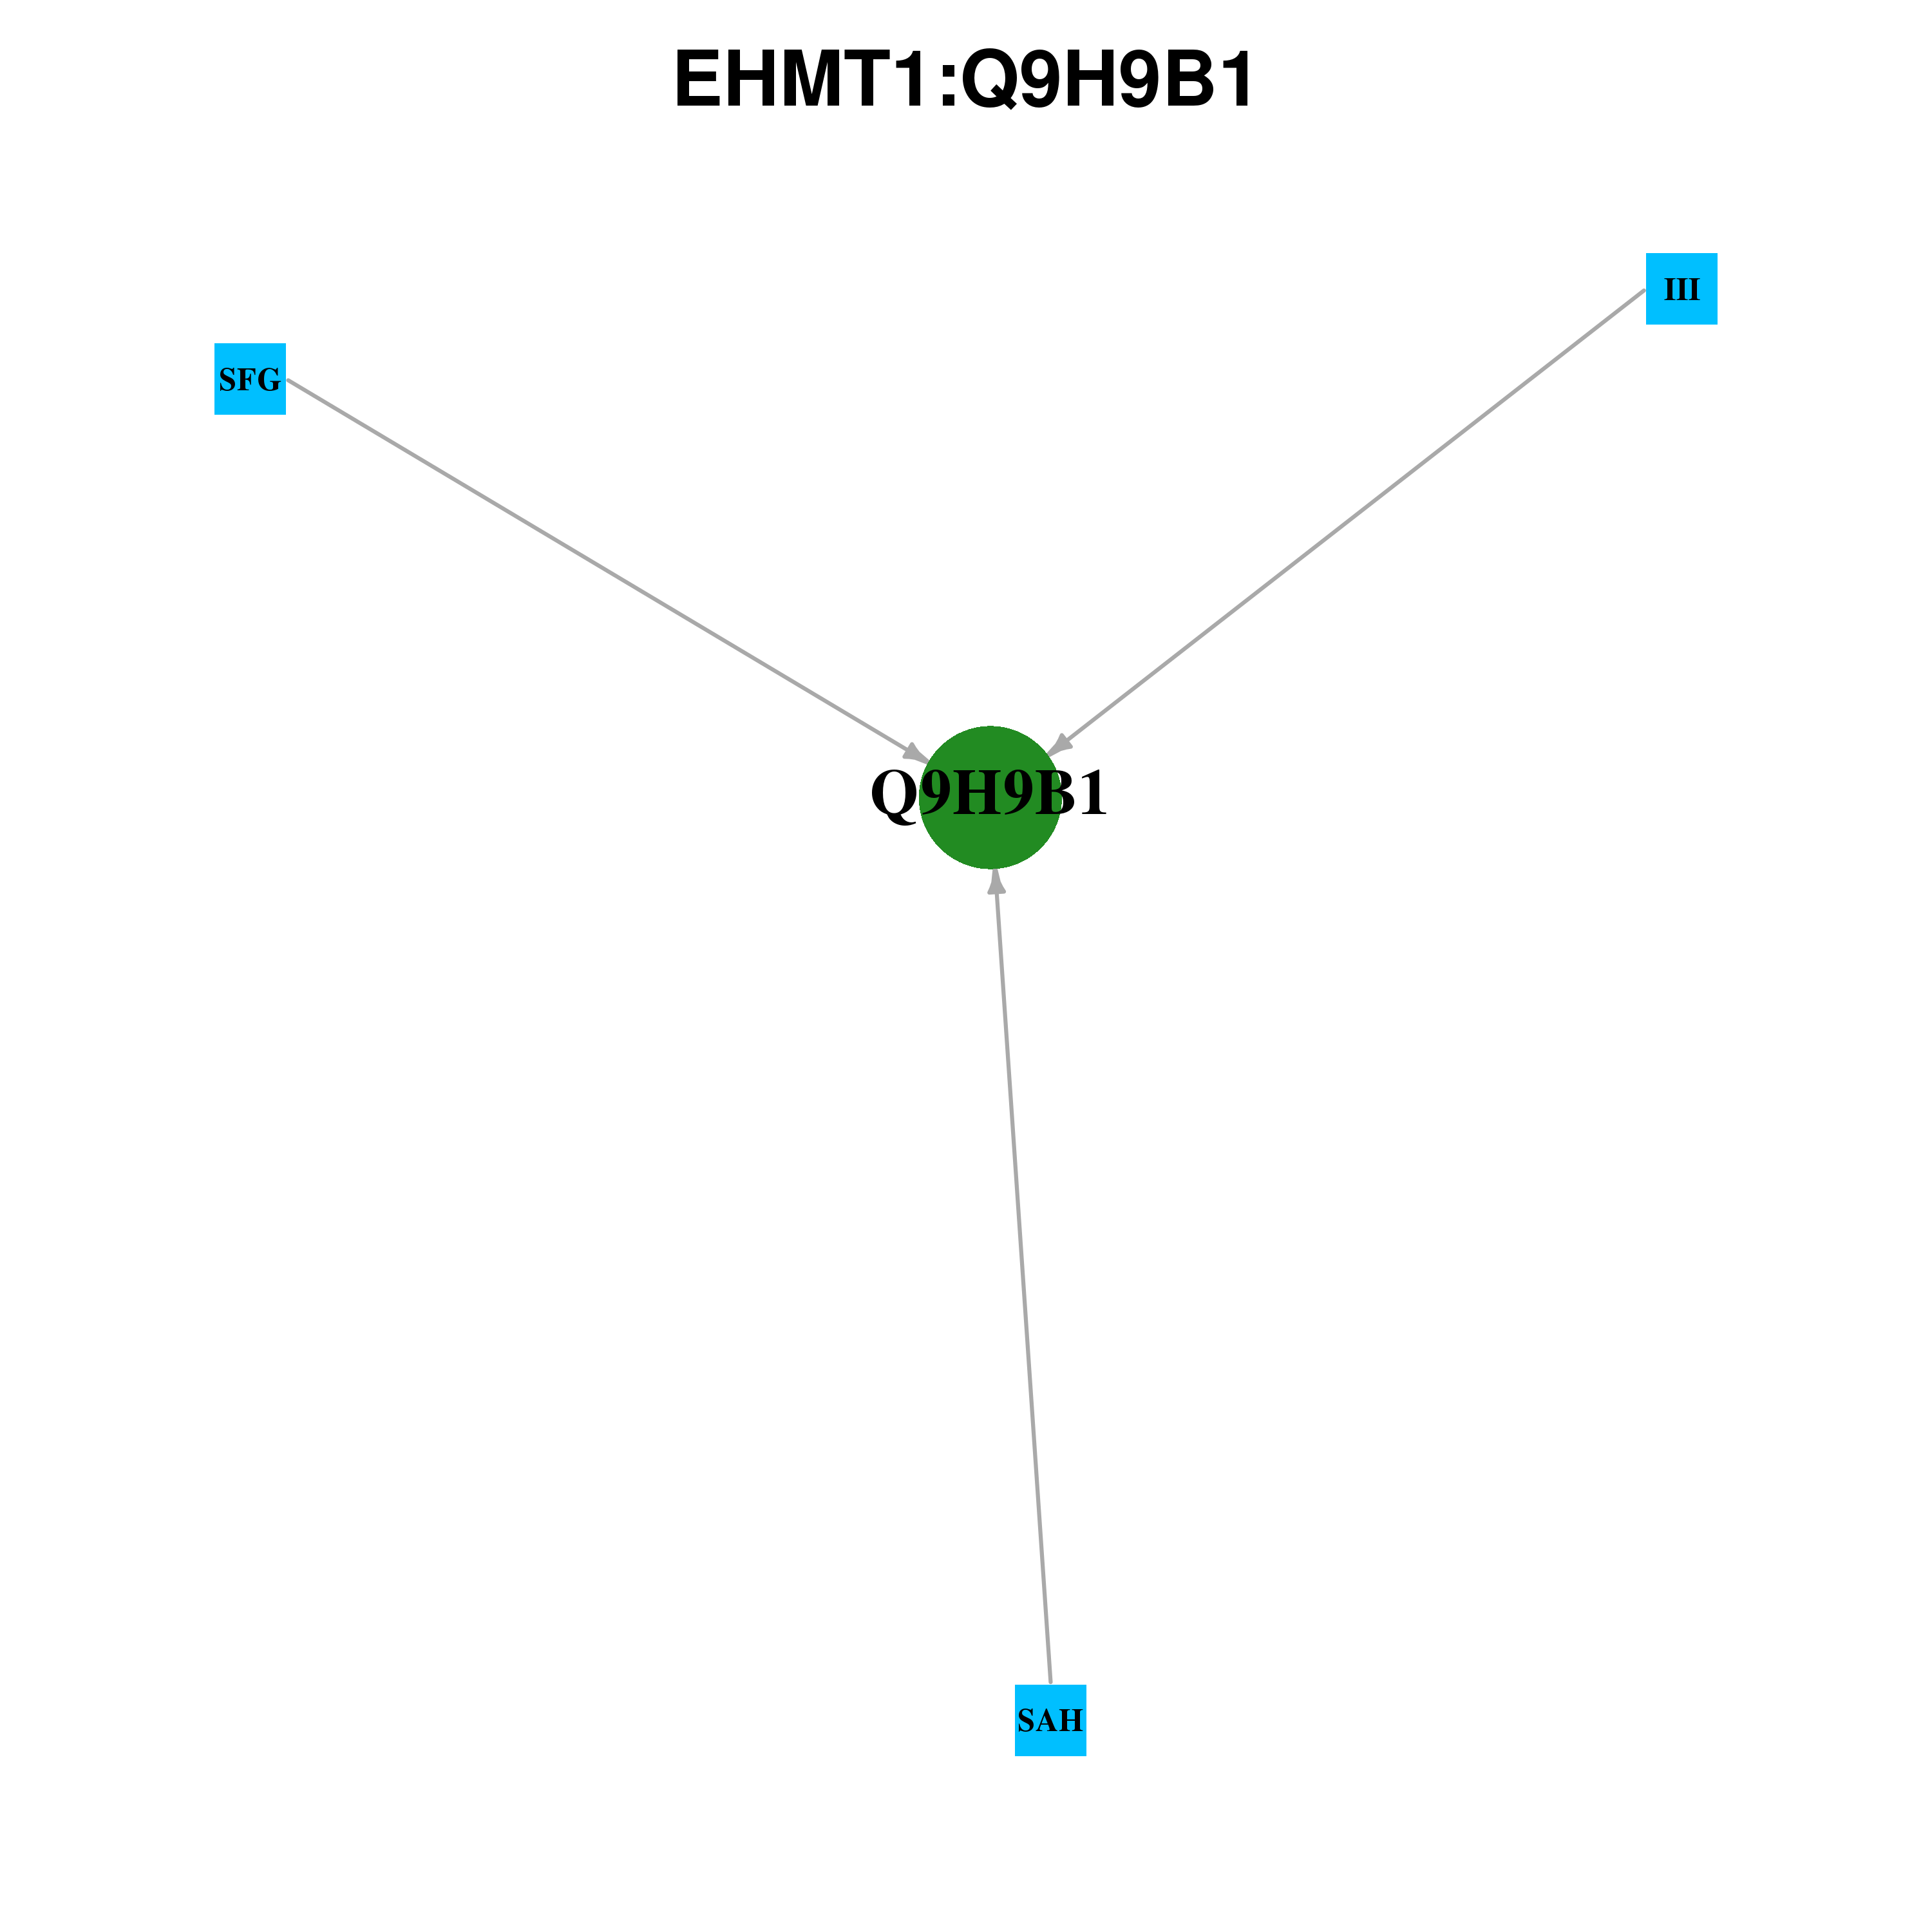 |
| Ligands binding to mutated ligand binding site of EHMT1 go to BioLip |
| Ligand ID | Ligand short name | Ligand long name | PDB ID | PDB name | mutLBS |
| Top |
| Conservation information for LBS of EHMT1 |
| Multiple alignments for Q9H9B1 in multiple species |
| LBS | AA sequence | # species | Species |
 |
Copyright © 2016-Present - The University of Texas Health Science Center at Houston |