|
mutLBSgeneDB |
| |
| |
| |
| |
| |
| |
|

| Gene summary for CD1A |
 Gene summary Gene summary |
| Basic gene Info. | Gene symbol | CD1A |
| Gene name | CD1a molecule | |
| Synonyms | CD1|FCB6|HTA1|R4|T6 | |
| Cytomap | UCSC genome browser: 1q23.1 | |
| Type of gene | protein-coding | |
| RefGenes | NM_001763.2, | |
| Description | CD1A antigen, a polypeptideT-cell surface antigen T6/Leu-6T-cell surface glycoprotein CD1acluster of differentiation 1 Acortical thymocyte antigen CD1Adifferentiation antigen CD1-alpha-3epidermal dendritic cell marker CD1ahTa1 thymocyte antigen | |
| Modification date | 20141207 | |
| dbXrefs | MIM : 188370 | |
| HGNC : HGNC | ||
| Ensembl : ENSG00000158477 | ||
| HPRD : 01776 | ||
| Vega : OTTHUMG00000017512 | ||
| Protein | UniProt: P06126 go to UniProt's Cross Reference DB Table | |
| Expression | CleanEX: HS_CD1A | |
| BioGPS: 909 | ||
| Pathway | NCI Pathway Interaction Database: CD1A | |
| KEGG: CD1A | ||
| REACTOME: CD1A | ||
| Pathway Commons: CD1A | ||
| Context | iHOP: CD1A | |
| ligand binding site mutation search in PubMed: CD1A | ||
| UCL Cancer Institute: CD1A | ||
| Assigned class in mutLBSgeneDB | C: This gene just belongs to mutLBSgenes. | |
| Gene ontology having evidence of Inferred from Direct Assay (IDA) from Entrez |
| GO ID | GO Term | PubMed ID |
| Top |
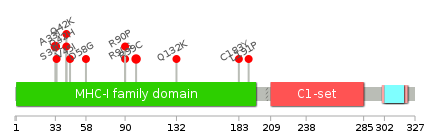
| Ligand binding site mutations for CD1A |
| Lollipop-style diagram of mutations at LBS in amino-acid sequence. We represented ligand binding site mutations only. (You can see big image via clicking.) |
 |
| Cancer type specific mutLBS sorted by frequency |
| LBS | AAchange of nsSNV | Cancer type | # samples | I98 | R99C | SKCM | 2 | D192 | L191P | BLCA | 1 | L131,L133 | Q132K | COAD | 1 | W31 | A33T | COAD | 1 | Y36 | S34C | HNSC | 1 | R90 | R90P | LUAD | 1 | R90 | R90S | LUAD | 1 | C183 | C183Y | STAD | 1 | W40 | Q42K | STAD | 1 | V45 | V45I | STAD | 1 | W31 | A33T | UCEC | 1 | W40 | Q42H | UCEC | 1 | W57 | D58G | UCEC | 1 |
| cf) Cancer type abbreviation. BLCA: Bladder urothelial carcinoma, BRCA: Breast invasive carcinoma, CESC: Cervical squamous cell carcinoma and endocervical adenocarcinoma, COAD: Colon adenocarcinoma, GBM: Glioblastoma multiforme, LGG: Brain lower grade glioma, HNSC: Head and neck squamous cell carcinoma, KICH: Kidney chromophobe, KIRC: Kidney renal clear cell carcinoma, KIRP: Kidney renal papillary cell carcinoma, LAML: Acute myeloid leukemia, LUAD: Lung adenocarcinoma, LUSC: Lung squamous cell carcinoma, OV: Ovarian serous cystadenocarcinoma, PAAD: Pancreatic adenocarcinoma, PRAD: Prostate adenocarcinoma, SKCM: Skin cutaneous melanoma, STAD: Stomach adenocarcinoma, THCA: Thyroid carcinoma, UCEC: Uterine corpus endometrial carcinoma. |
| Top |
| Protein structure related information for CD1A |
| Relative protein structure stability change (ΔΔE) using Mupro 1.1 Mupro score denotes assessment of the effect of mutations on thermodynamic stability. (ΔΔE<0: mutation decreases stability, ΔΔE>0: mutation increases stability) |
 : nsSNV at non-LBS : nsSNV at non-LBS : nsSNV at LBS : nsSNV at LBS |
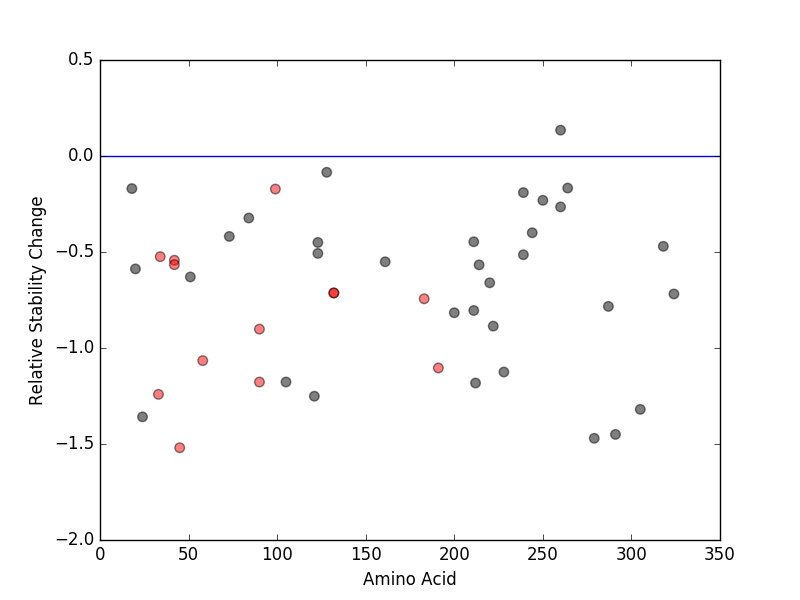 |
| nsSNVs sorted by the relative stability change of protein structure by each mutation Blue: mutations of positive stability change. and red : the most recurrent mutation for this gene. |
| LBS | AAchange of nsSNV | Relative stability change | V45 | V45I | -1.5194644 | W31 | A33T | -1.2412611 | R90 | R90S | -1.1773386 | D192 | L191P | -1.1039615 | W57 | D58G | -1.0657151 | R90 | R90P | -0.9017996 | C183 | C183Y | -0.74369015 | L133 | Q132K | -0.71333179 | L131 | Q132K | -0.71333179 | W40 | Q42H | -0.56605625 | W40 | Q42K | -0.54297624 | Y36 | S34C | -0.52432817 | I98 | R99C | -0.1721616 |
| (MuPro1.1: Jianlin Cheng et al., Prediction of Protein Stability Changes for Single-Site Mutations Using Support Vector Machines, PROTEINS: Structure, Function, and Bioinformatics. 2006, 62:1125-1132) |
| Structure image for CD1A from PDB |
| PDB ID | PDB title | PDB structure | 1ONQ | Crystal Structure of CD1a in Complex with a Sulfatide |  |
| Top |
| Differential gene expression and gene-gene network for CD1A |
| Differential gene expression between mutated and non-mutated LBS samples in all 16 major cancer types |
| Differential co-expressed gene network based on protein-protein interaction data (CePIN) |
| Top |
| Top |
| Phenotype information for CD1A |
| Gene level disease information (DisGeNet) |
| Disease ID | Disease name | # PubMed | Association type |
| Mutation level pathogenic information (ClinVar annotation) |
| Allele ID | AA change | Clinical significance | Origin | Phenotype IDs |
| Top |
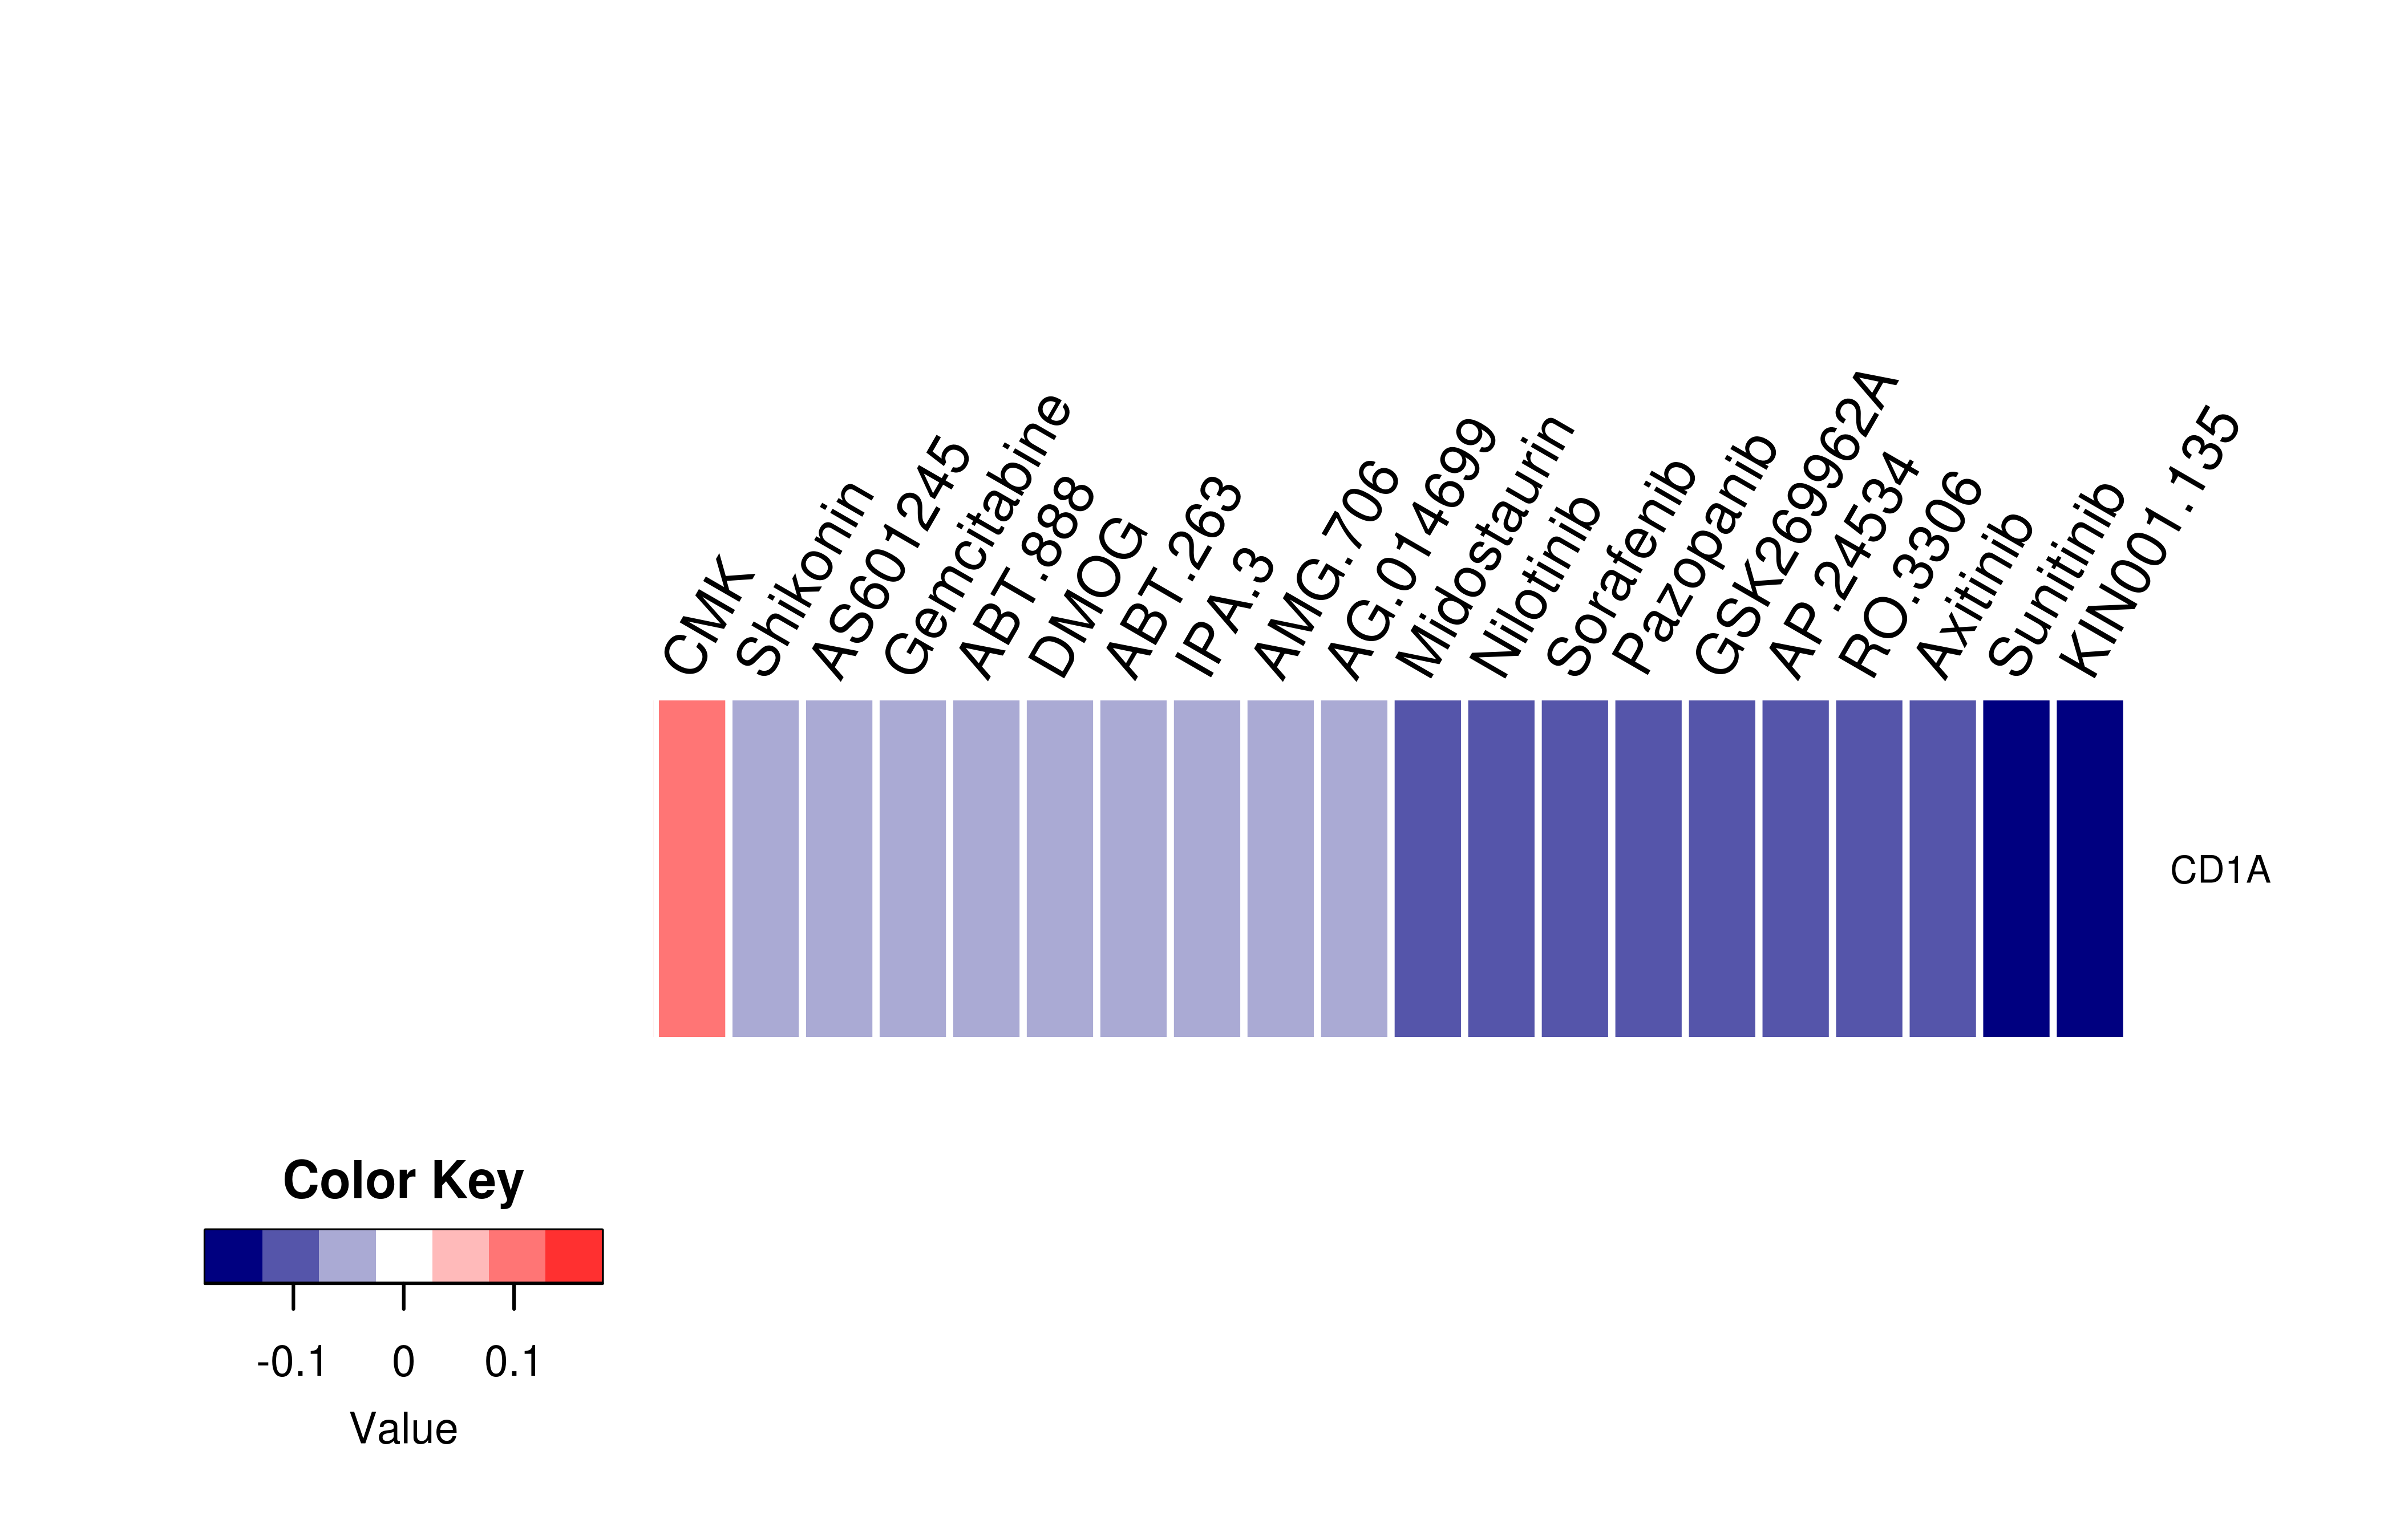
| Pharmacological information for CD1A |
| Gene expression profile of anticancer drug treated cell-lines (CCLE) Heatmap showing the correlation between gene expression and drug response across all the cell-lines. We chose the top 20 among 138 drugs.We used Pearson's correlation coefficient. |
 |
| Gene-centered drug-gene interaction network |
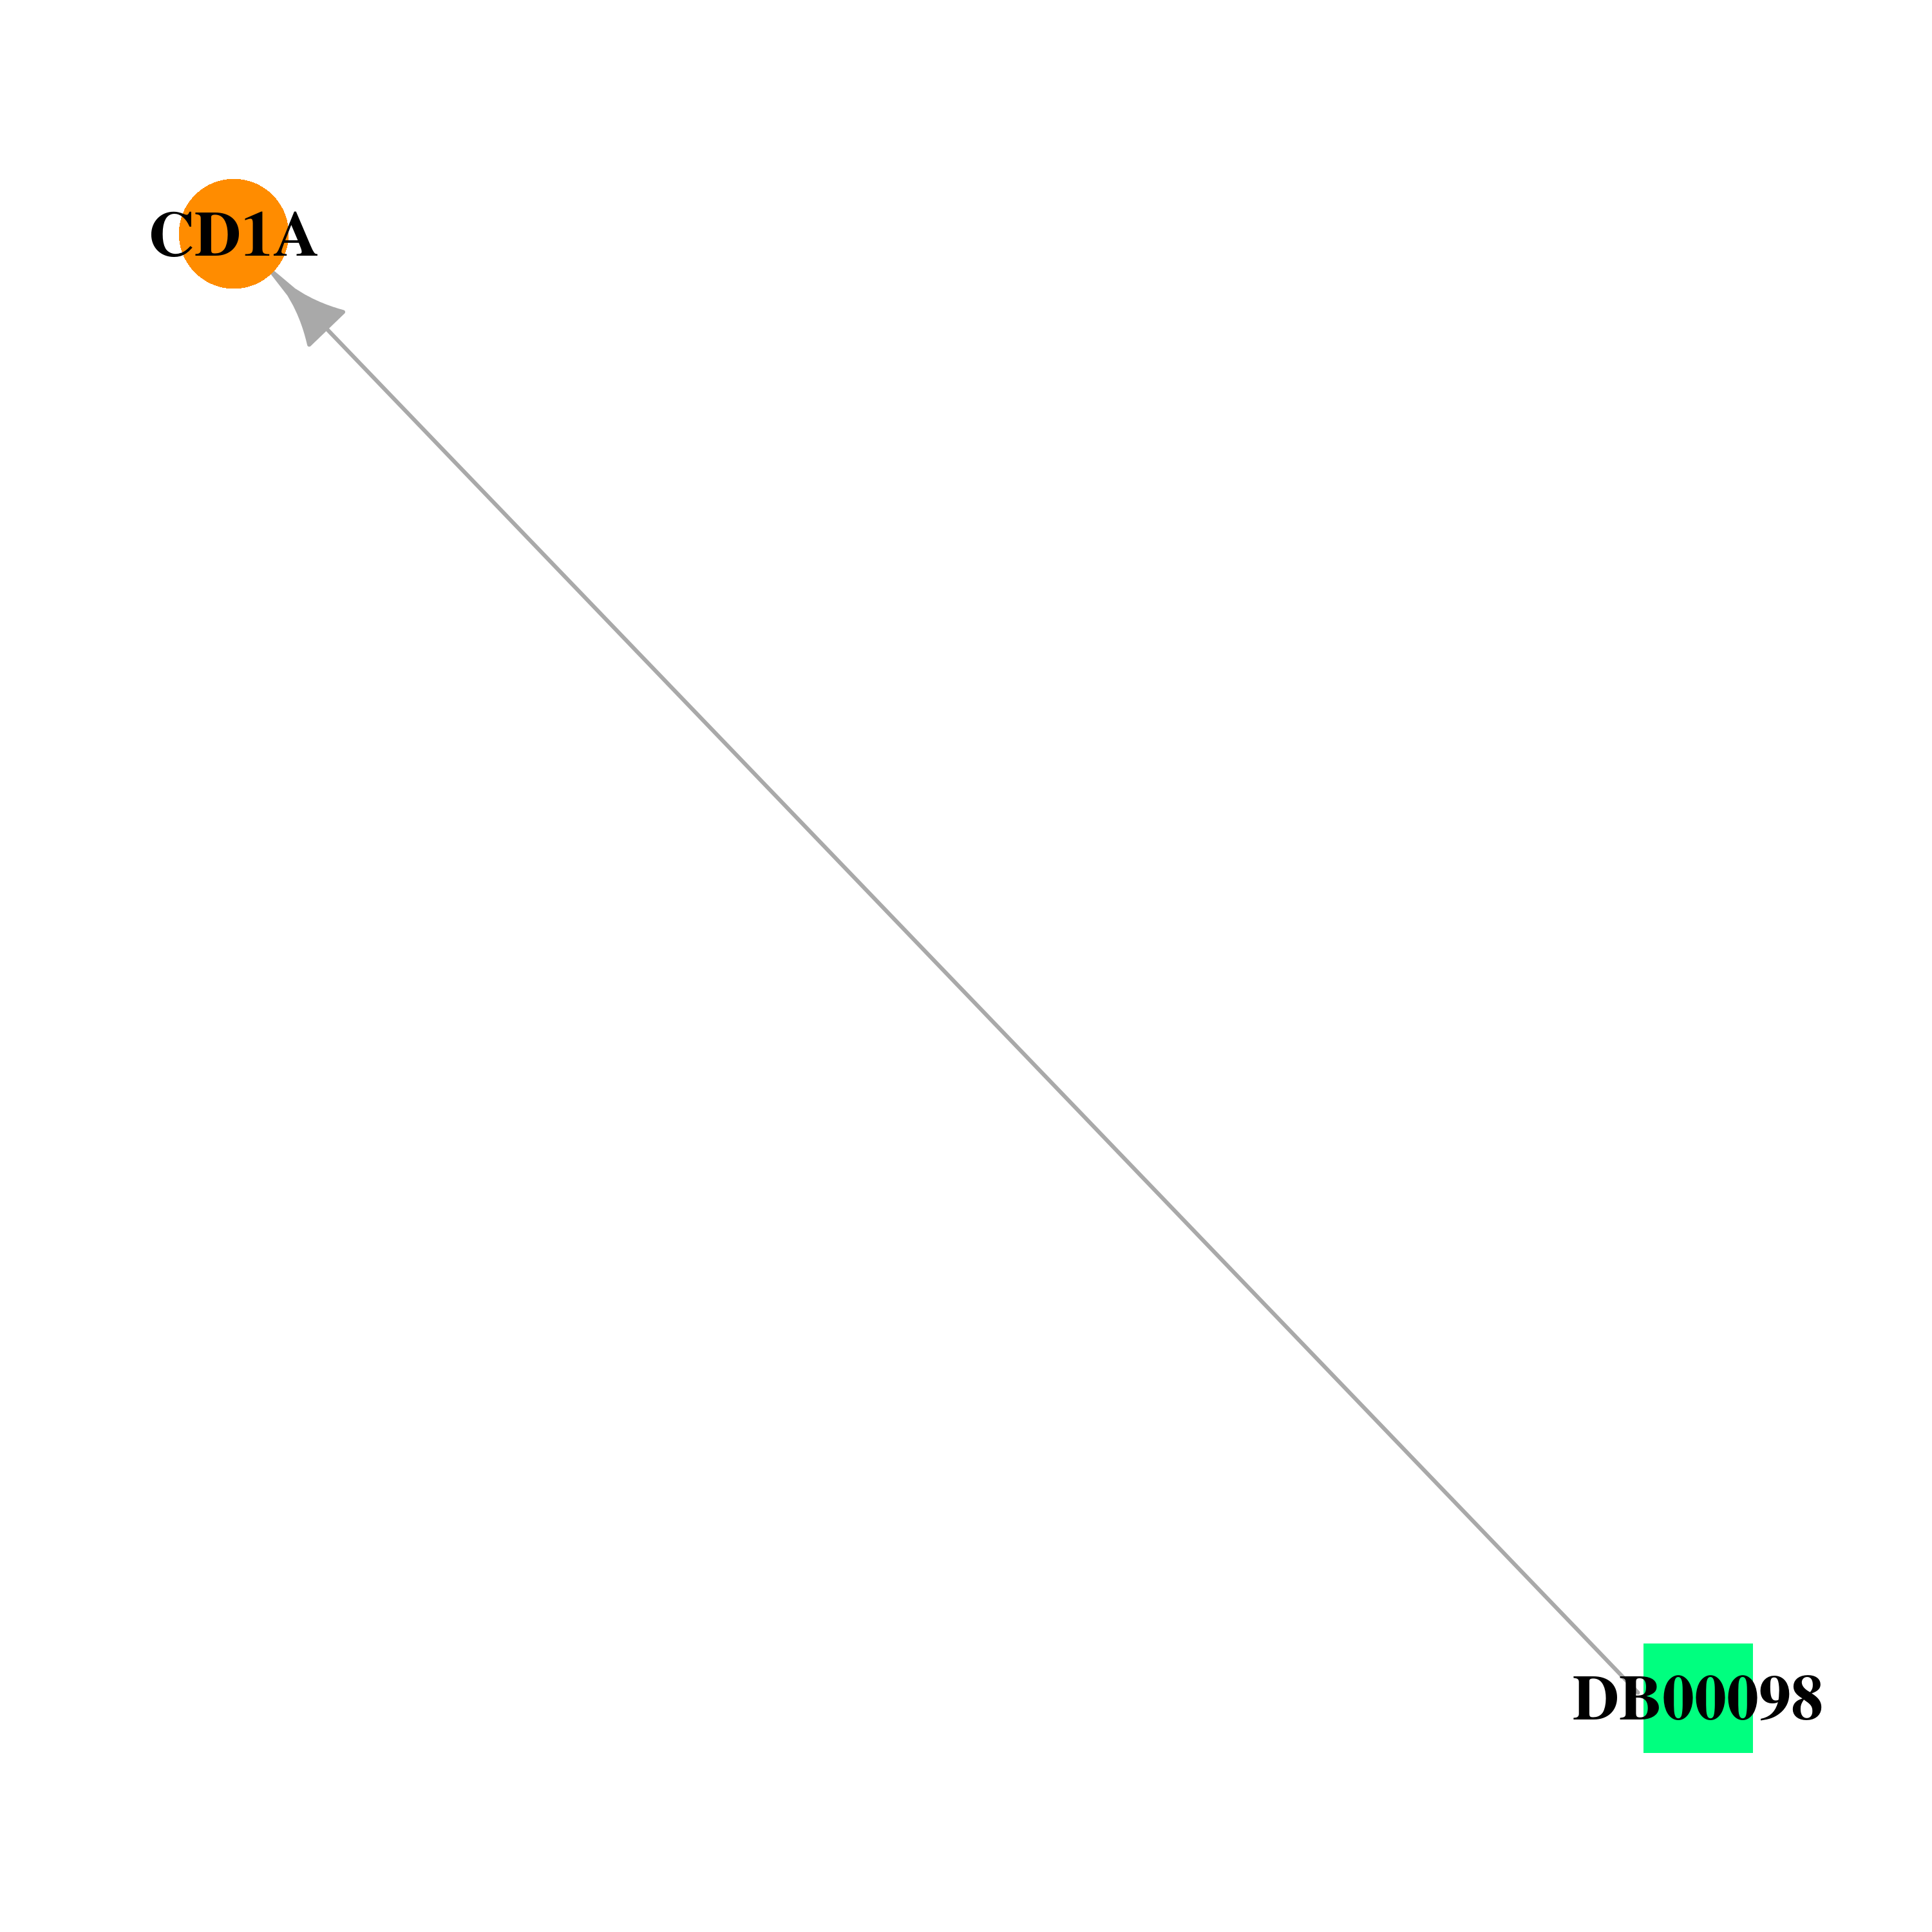 |
| Drug information targeting mutLBSgene (Approved drugs only) |
| Drug status | DrugBank ID | Name | Type | Drug structure |
| Approved | DB00098 | Anti-thymocyte Globulin (Rabbit) | Biotech |  |
| Gene-centered ligand-gene interaction network |
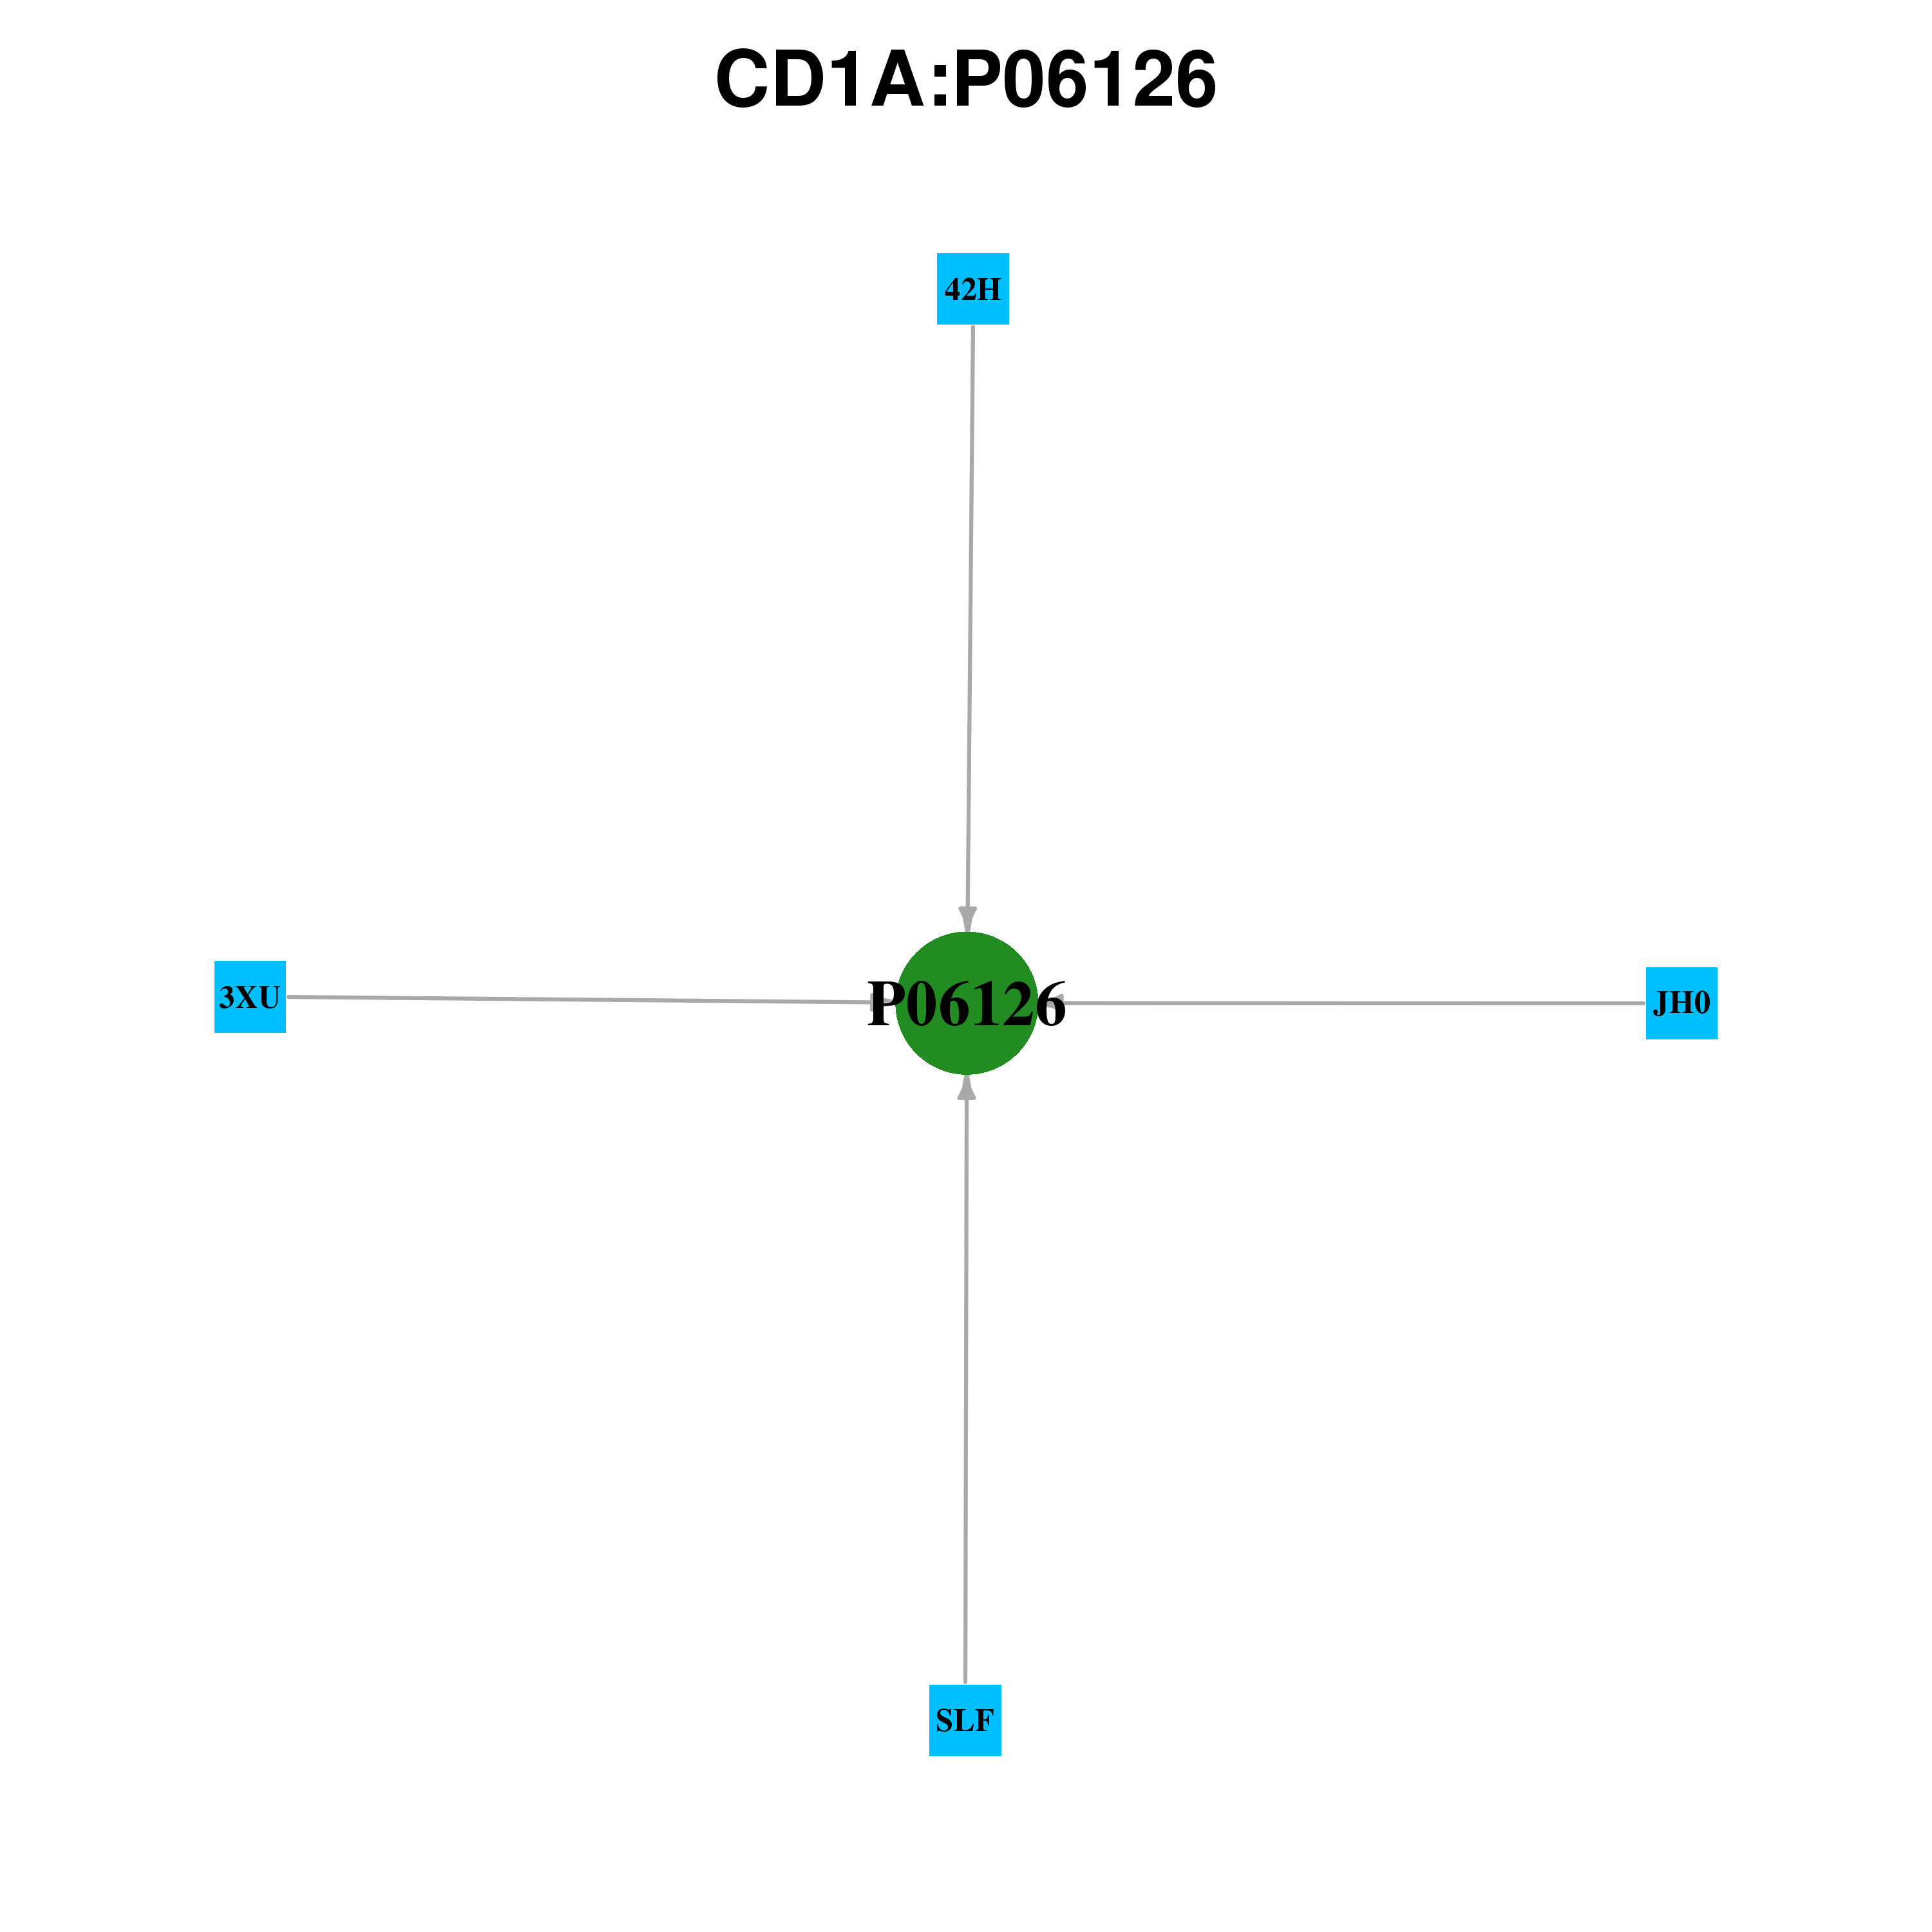 |
| Ligands binding to mutated ligand binding site of CD1A go to BioLip |
| Ligand ID | Ligand short name | Ligand long name | PDB ID | PDB name | mutLBS | 42H | (4R,7R,18Z)-4,7-DIHYDROXY-N,N,N-TRIMETHYL-10-OXO-3,5,9- TRIOXA-4-PHOSPHAHEPTACOS-18-EN-1-AMINIUM 4-OXIDE | 4x6e | A | W40 |
| Top |
| Conservation information for LBS of CD1A |
| Multiple alignments for P06126 in multiple species |
| LBS | AA sequence | # species | Species |
 |
Copyright © 2016-Present - The University of Texas Health Science Center at Houston |