Application cases of WebCSEA
1. Eye disease gene list
1.1 Dataset summary
This dataset includes 119 eye-related disease genes were obtained from the RetNet (https://sph.uth.edu/retnet/). The RetNet summarized and provided genes that were identified to be responsible to inherited retinal diseases, including retinitis pigmentosa, macular degeneration and Usher syndrome, among others.
1.2 Result highlights
Cell-type-Specific Enrichment Analysis (CSEA) results of 119 eye-related disease genes in 12 Organ systems.
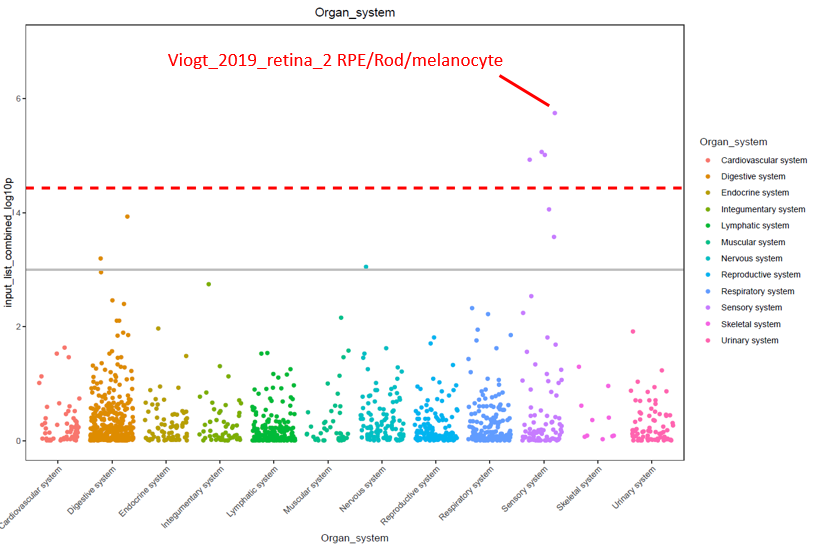
The dashed red line indicates the significant threshold (p = 3.69 x 10^-5) corrected with 1355 tissue-cell types. The solid grey line indicates the nominal significance (p = 1 x 10^-3). In each category of organ systems, dots represent all the tissue-cell types stratified by that organ system. We highlighted the retina RPE/Rod/melanocyte from sensory system. Y-axis is the –log10(combined p-value) from the CSEA result.
CSEA results of 119 eye-related disease genes in top 20 tissues with cell types enriched.
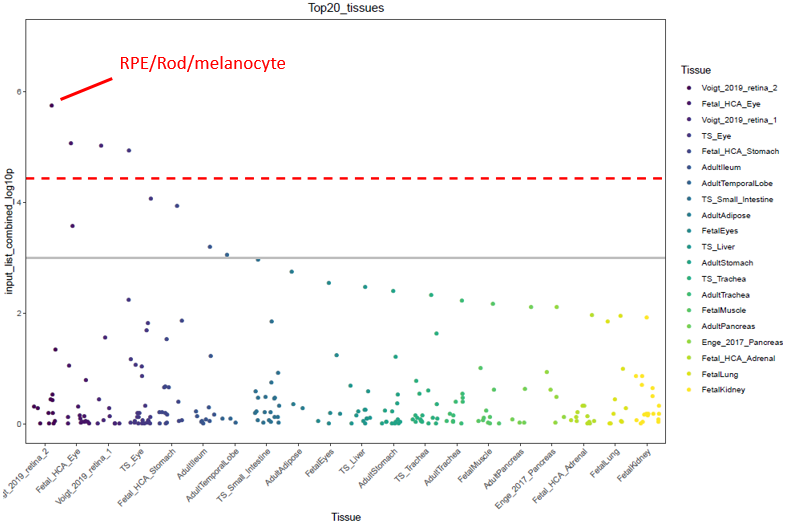
The dashed red line indicates the significant threshold (p = 3.69 x 10^-5) corrected with 1355 tissue-cell types. The solid grey line indicates the nominal significance (p = 1 x 10^-3). In each category of tissues, dots represent all the tissue-cell types and descend by the order of most significant tissue-cell type in this tissue. ROE/Rod/melanocyte is the cell type enriched with eye disease genes. Y-axis is the –log10(combined p-value) from the CSEA result.
2. Bulk RNA-seq differentially expressed gene analysis
2.1 Dataset summary
This dataset includes 190 human homologue genes derived from the differentially expressed genes (DEGs) analysis of pancreatic ductal adenocarcinoma (PDAC) mouse with CD73 inhibitor administration AB680 treatment vs control [1].
2.2 Result highlights
Cell-type-Specific Enrichment Analysis (CSEA) results of 190 human homologue DEGs in 12 Organ systems.
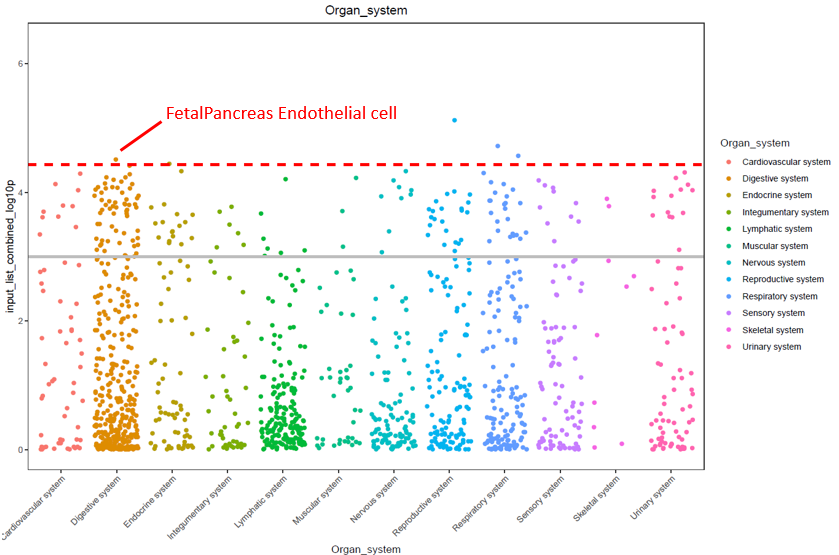
The dashed red line indicates the significant threshold (p = 3.69 x 10^-5) corrected with 1355 tissue-cell types. The solid grey line indicates the nominal significance (p = 1 x 10^-3). In each category of organ systems, dots represent all the tissue-cell types stratified by that organ system. Fetal Pancreas Endothelial cell is found to be the most pancreas-related cell type. Y-axis is the –log10(combined p-value) from the CSEA result.
CSEA results of 190 human homologue DEGs in top 20 tissues with cell types enriched
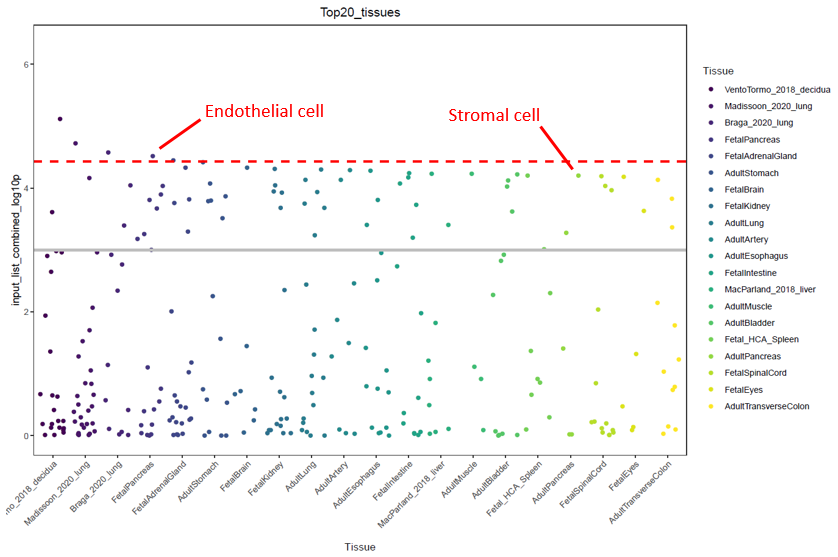
The dashed red line indicates the significant threshold (p = 3.69 x 10^-5) corrected with 1355 tissue-cell types. The solid grey line indicates the nominal significance (p = 1 x 10^-3). ). In each category of tissues, dots represent all the tissue-cell types and descend by the order of most significant tissue-cell type in this tissue. Endothelial cell and Stromal cell from kidney cells are found related to these differentially expressed gene list. Y-axis is the –log10(combined p-value) from the CSEA result.
1. Singh, Kanchan, Erika Y. Faraoni, Yulin Dai, Vidhi Chandra, Emily Vucic, Tingting Mills, Melissa Pruski et al. "Pancreatic cancer ductal cell of origin drives CD73-dependent generation of immunosuppressive adenosine." bioRxiv (2021).
3. Kidney Developmental gene list
3.1 Dataset summary
This dataset includes 471 fetal kidney cap mesenchyme specific genes, which were identified by Wang et al.[1] Those genes were identified through differentially gene expression analysis in each cell cluster.
3.2 Result highlights
Cell-type-Specific Enrichment Analysis (CSEA) results of 471 fetal kidney cap mesenchyme specific genes in 12 Organ systems.
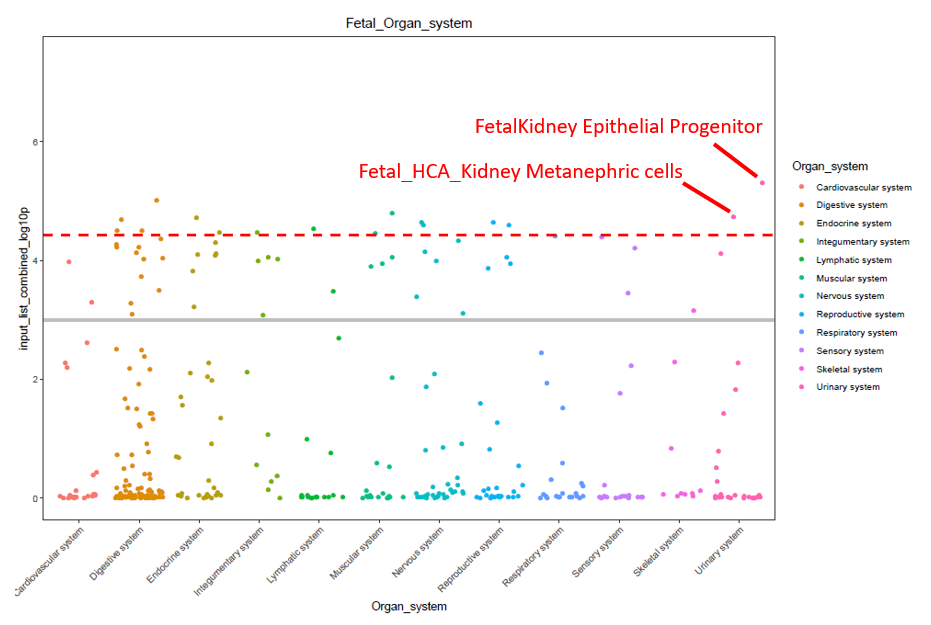
The dashed red line indicates the significant threshold (p = 3.69 x 10^-5) corrected with 1355 tissue-cell types. The solid grey line indicates the nominal significance (p = 1 x 10^-3). In each category of fetal organ systems, dots represent all the tissue-cell types stratified by that fetal organ system. We highlighted the two significantly enriched fetal Kidney cell types in Urinary system. Y-axis is the –log10(combined p-value) from the CSEA result.
CSEA results of 471 fetal kidney cap mesenchyme specific genes in top 20 tissues with cell types enriched

The dashed red line indicates the significant threshold (p = 3.69 x 10^-5) corrected with 1355 tissue-cell types. The solid grey line indicates the nominal significance (p = 1 x 10^-3). In each category of tissues, dots represent all the tissue-cell types and descend by the order of most significant tissue-cell type in this tissue. Fetal kidney epithelial progenitor is the most significant fetal tissue-cell type. Y-axis is the –log10(combined p-value) from the CSEA result.
1. Wang P, Chen Y, Yong J, Cui Y, Wang R, Wen L, Qiao J, Tang F: Dissecting the Global Dynamic Molecular Profiles of Human Fetal Kidney Development by Single-Cell RNA Sequencing. Cell Rep 2018, 24(13):3554-3567 e3553.
4. Alzheimer’s Disease risk gene list
4.1 Dataset summary
This dataset includes 537 genes related to Alzheimer’s Disease (AD) from the Agora (https://agora.ADknowledgeportal.org) assessed by 4/20/2021. These 537 genes were identified from multiple evidences using computational analyses of high-dimensional genomic, proteomic and/or metabolomic data generated from human samples, which could be the targets of Alzheimer's Disease treatment or prevention.
4.2 Result highlights
Cell-type-Specific Enrichment Analysis (CSEA) results of 537 Alzheimer’s Disease gene list in adult tissues from 12 Organ systems.

The dashed red line indicates the significant threshold (p = 3.69 x 10^-5) corrected with 1355 tissue-cell types. The solid grey line indicates the nominal significance (p = 1 x 10^-3). In each category of organ systems, dots represent all the tissue-cell types stratified by that adult organ system. We highlighted the Excitatory Neuron is the only one significant, which belongs to nervous system. Y-axis is the –log10(combined p-value) from the CSEA result.
Cell-type-Specific Enrichment Analysis (CSEA) results of 537 Alzheimer’s Disease gene list in top 20 tissues with cell types enriched.
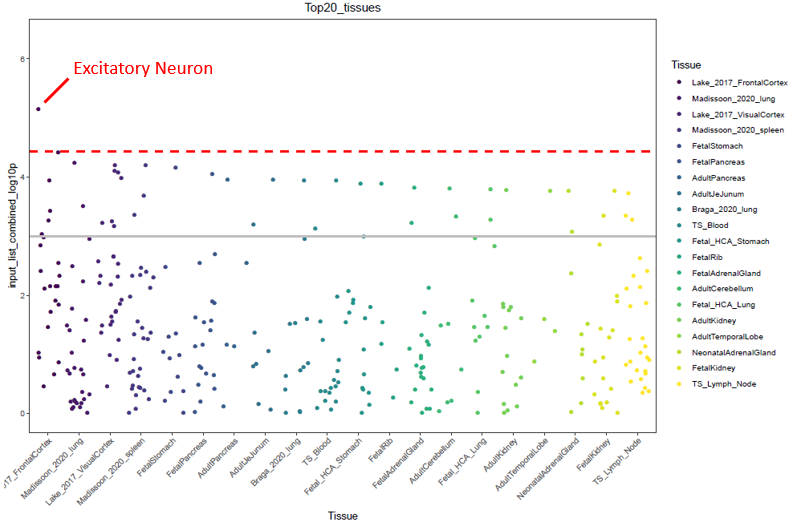
The dashed red line indicates the significant threshold (p = 3.69 x 10^-5) corrected with 1355 tissue-cell types. The solid grey line indicates the nominal significance (p = 1 x 10^-3). In each category of tissues, dots represent all the tissue-cell types and descend by the order of most significant tissue-cell type in this tissue. Excitatory Neuron is the most significant tissue-cell type in Frontal Cortex. Y-axis is the –log10(combined p-value) from the CSEA result.
5. Lung adenocarcinoma tissue-specific gene list from TissGDB
5.1 Dataset summary
This dataset includes 104 signature genes for Lung adenocarcinoma (LUAD) derived from TissGDB: tissue-specific gene database in cancer [1].
5.2 Result highlights
Cell-type-Specific Enrichment Analysis (CSEA) results of 104 LUAD signature genes in 12 Organ systems.
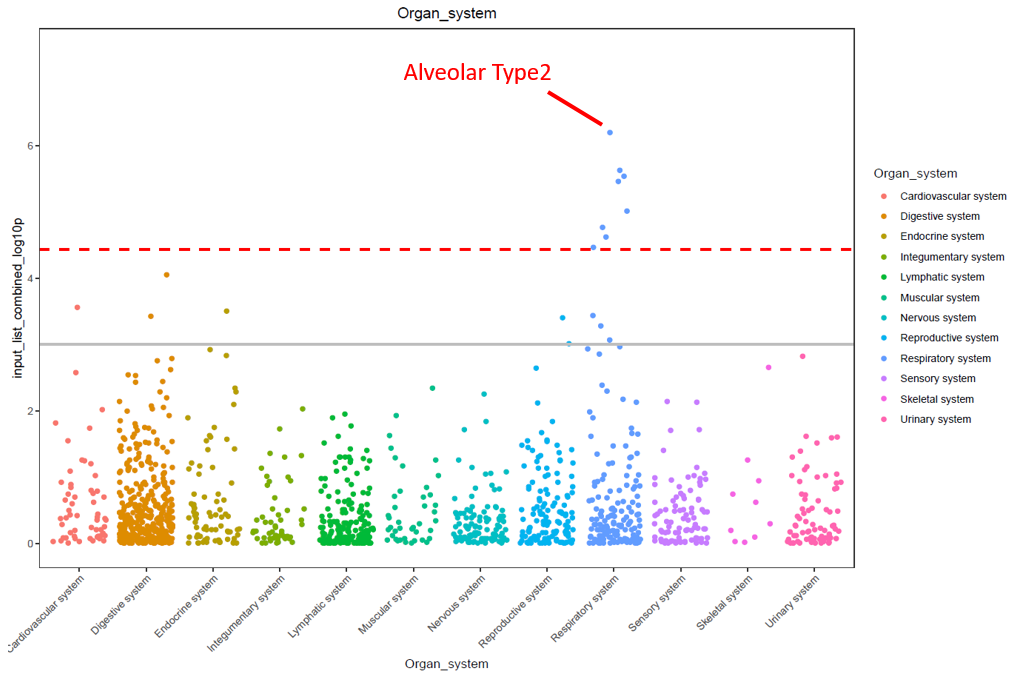
The dashed red line indicates the significant threshold (p = 3.69 x 10^-5) corrected with 1355 tissue-cell types. The solid grey line indicates the nominal significance (p = 1 x 10^-3). In each category of organ systems, dots represent all the tissue-cell types stratified by that organ system. We highlighted the Alveolar Type2 cell from lung is the most significant, which belongs to respiratory system. Y-axis is the –log10(combined p-value) from the CSEA result.
CSEA results of 104 LUAD signature genes in top 20 tissues with cell types enriched.
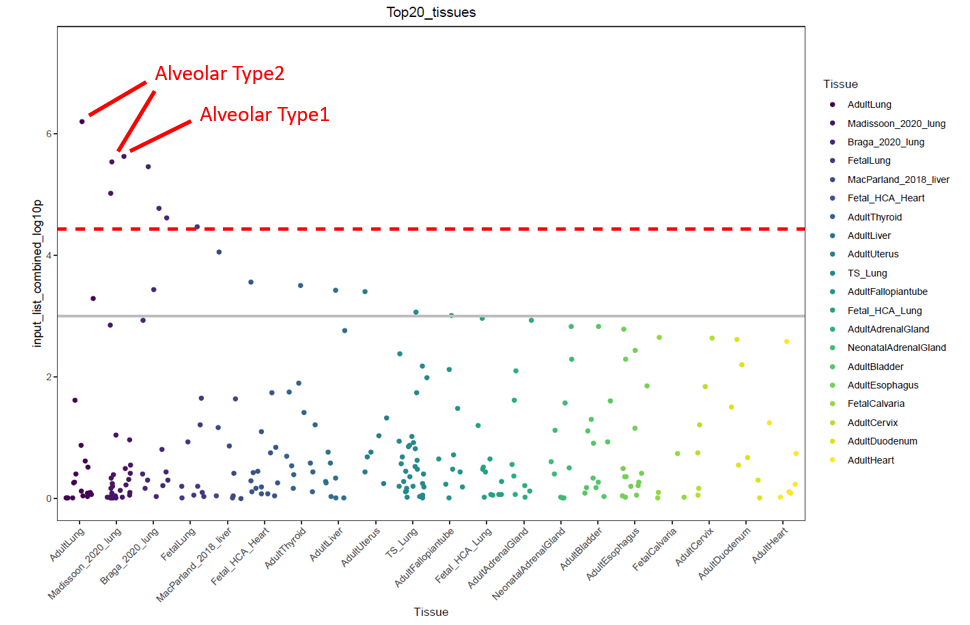
The dashed red line indicates the significant threshold (p = 3.69 x 10^-5) corrected with 1355 tissue-cell types. The solid grey line indicates the nominal significance (p = 1 x 10^-3). In each category of tissues, dots represent all the tissue-cell types and descend by the order of most significant tissue-cell type in this tissue. Alveolar Type 1 and Alveolar Type 2 cells are the most significant tissue-cell type in multiple lung single-cell panels. Y-axis is the –log10(combined p-value) from the CSEA result.
1. Kim, Pora, Aekyung Park, Guangchun Han, Hua Sun, Peilin Jia, and Zhongming Zhao. "TissGDB: tissue-specific gene database in cancer." Nucleic acids research 46, no. D1 (2018): D1031-D1038.
6. Type2 diabetes gold standard gene list from T2D Knowledge Portal
6.1 Dataset summary
This dataset includes 22 gold standard GWAS genes for Type 2 Diabetes (T2D) derived from T2D Knowledge Portal (https://t2d.hugeamp.org/).
6.2 Result highlights
Cell-type-Specific Enrichment Analysis (CSEA) results of 22 gold standard T2D GWAS risk genes in 12 Organ systems.

The dashed red line indicates the significant threshold (p = 3.69 x 10^-5) corrected with 1355 tissue-cell types. The solid grey line indicates the nominal significance (p = 1 x 10^-3). In each category of organ systems, dots represent all the tissue-cell types stratified by that organ system. Y-axis is the –log10(raw p-value) from the CSEA analysis. The results highlighted that the digestive system were the most related organ system and top three significant tissue-cell types are small intestine enterocyte, pancreas beta cell, and fetal pancreas islet endocrine cells, respectively.
Cell-type-Specific Enrichment Analysis (CSEA) results of 22 gold standard T2D GWAS risk genes in top general cell types

The dashed red line indicates the significant threshold (p = 3.69 x 10^-5) corrected with 1355 tissue-cell types. The solid grey line indicates the nominal significance (p = 1 x 10^-3). In each category of general cell types, dots represent all tissue-cell types annotated in this general cell type and descend by the order of most significant tissue-cell type in this tissue. Y-axis is the –log10(raw p-value) from the CSEA result. The three most significant general cell types were annotated as Enterocyte, Type B pancreatic cell, and endocrine cells, respectively.
7. Example1: Hepatocyte signature genes
7.1 Dataset summary
This dataset includes 154 Hepatocyte signature genes from PangalaoDB [1] assessed by 3/27/2020.
7.2 Result highlights
Cell-type-Specific Enrichment Analysis (CSEA) results of 154 Hepatocyte signature genes from PangalaoDB in tissues from 12 Organ systems.

The dashed red line indicates the significant threshold (p = 3.69 x 10^-5) corrected with 1355 tissue-cell types. The solid grey line indicates the nominal significance (p = 1 x 10^-3). In each category of tissues, dots represent all the tissue-cell types and descend by the order of most significant tissue-cell type in this tissue. Hepatocyte was annotated as the most significant cell from multiple liver single-cell panel. Y-axis is the –log10(combined p-value) from the CSEA result.
Cell-type-Specific Enrichment Analysis (CSEA) results of 154 Hepatocyte signature genes from top 20 tissues with cell types enriched
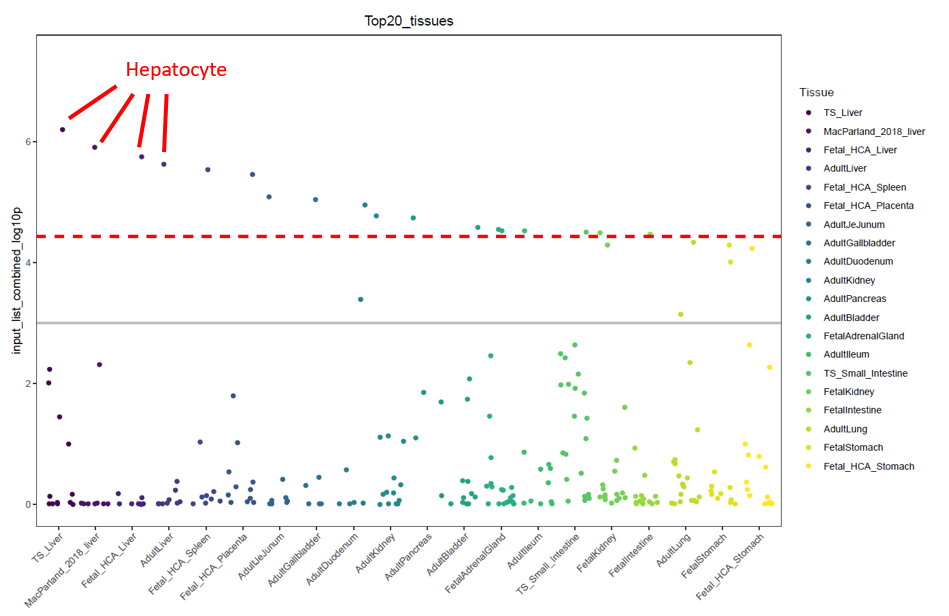
The dashed red line indicates the significant threshold (p = 3.69 x 10^-5) corrected with 1355 tissue-cell types. The solid grey line indicates the nominal significance (p = 1 x 10^-3). In each category of general cell types, dots represent all tissue-cell types annotated in this general cell type and descend by the order of most significant tissue-cell type in this tissue. Y-axis is the –log10(raw p-value) from the CSEA result. The three most significant general cell types were annotated as Enterocyte, Type B pancreatic cell, and endocrine cells, respectively.
1. Franzén, Oscar, Li-Ming Gan, and Johan LM Björkegren. "PanglaoDB: a web server for exploration of mouse and human single-cell RNA sequencing data." Database 2019 (2019).
8. Example2: Synapse Intracellular signal transduction pathway
8.1 Dataset summary
This dataset includes 150 genes involved in neural synapse intracellular signal transduction pathway derived from our previous work[1].
8.2 Result highlights
Cell-type-Specific Enrichment Analysis (CSEA) results of 150 synapse intracellular signal transduction pathway genes in 12 Organ systems.
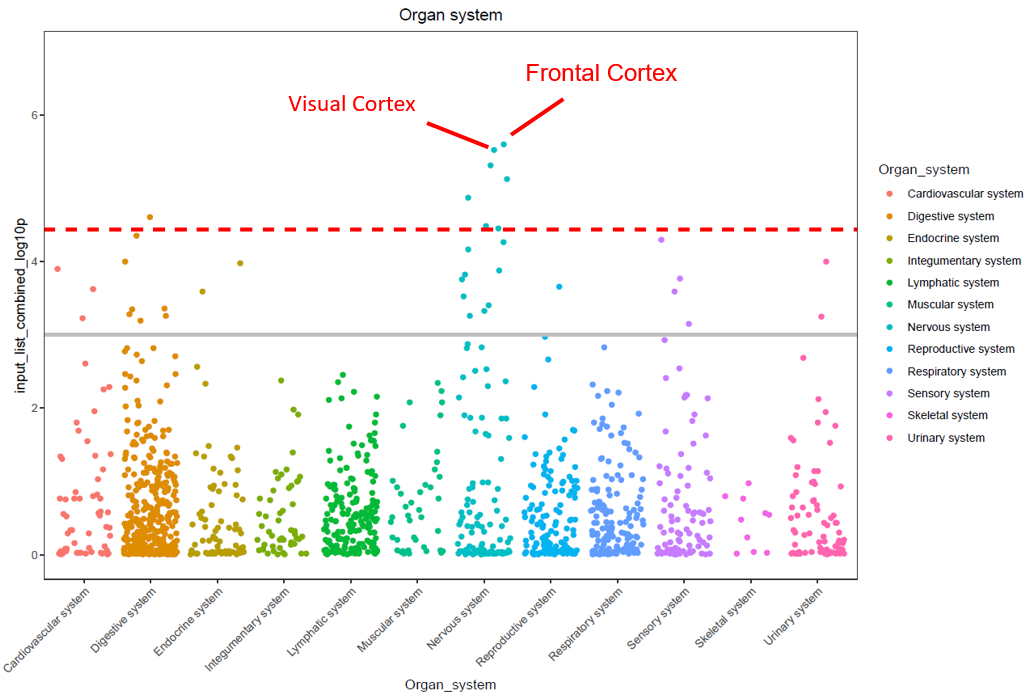
The dashed red line indicates the significant threshold (p = 3.69 x 10^-5) corrected with 1355 tissue-cell types. The solid grey line indicates the nominal significance (p = 1 x 10^-3). X-axis is organ systems. In each category of organ systems, each dot represents all the tissue-cell types stratified by different organ system. Y-axis is the –log10(combined p-value) from the CSEA analysis. The results highlighted that the nervous system is the most enriched organ system. The two tissues are visual cortex and frontal cortex.
CSEA results of 150 synapse intracellular signal transduction pathway genes in top 20 general cell types enriched
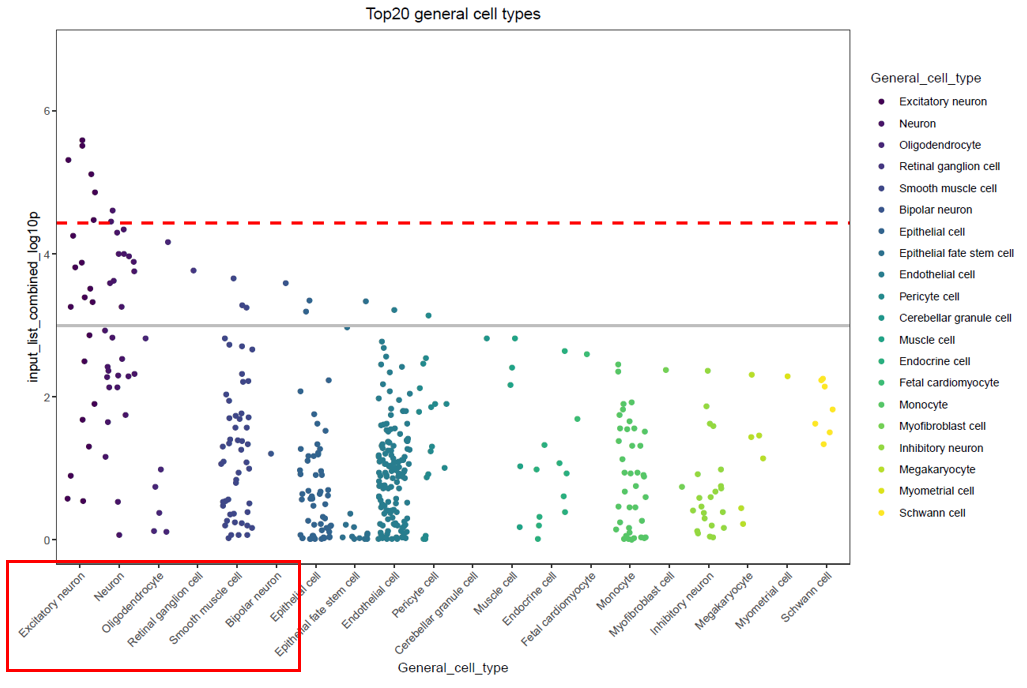
The dashed red line indicates the significant threshold (p = 3.69 x 10^-5) corrected with 1355 tissue-cell types. The solid grey line indicates the nominal significance (p = 1 x 10^-3). In each category of general cell types, dots represent all tissue-cell types annotated in this general cell type and descend by the order of most significant tissue-cell type in this general cell type. Y-axis is the –log10(combined p-value) from the CSEA result. The results highlighted that the excitatory neurons and a few cell types with similar function.
1. Jia, P., Han, G., Zhao, J., Lu, P. and Zhao, Z. (2017) SZGR 2.0: a one-stop shop of schizophrenia candidate genes. Nucleic Acids Res, 45, D915-D924.