1. Introduction
The accurate assessment of the tissue-cell-type specificity from the candidate gene list provides biological insight into the context of these genes manifesting their impact on the human body. However, this process is challenging mainly because of the following points; 1) the lack of comprehensive human tissue-cell type (TC) panels; 2) the cell-type specificity measurement could be biased by the different length of signature genes among tissue-cell types (TCs); 3) the different length of input gene sets could also lead to results from cell-type-specific enrichment analysis (CSEA) incomparable. To overcome these challenges, we developed the WebCSEA (Web-based Cell-type-Specific Enrichment Analysis) to unbiasedly measure the cell-type specificity of a given inquiry gene list and output the metrics and visualization for each collected human TC. We benchmarked our WebCSEA with a couple of known tissue- and cell-type-specific signature genes to evaluate the performance.
2. Human scRNA-seq tissue panel collection
To overcome previously discussed challenges, we developed the WebCSEA (Web-based Cell-type-Specific Enrichment Analysis) to harness the human organ transcriptome profilings recently generated by the leading consortiums such as Human Cell Landscape, Human Cell Atlas, and Tabula Sapiens via single-cell RNA sequencing (scRNA-seq) technology. Overall, we collected more than 5.5 million cells from 111 tissues and 1,355 TCs, belonging to 61 adult and fetal tissues across 12 human organ systems (11 human organ systems + sensory system). We filtered out those low expressed genes and used our in-house t-statistic-based method "deTS" to train the tissue-cell-type signature genes.
3. Permutation-based cell-type specificity test
To address the common bias raised by different lengths of signature genes and input gene lists during the enrichment analysis, we developed a permutation-based method to normalize the effect of gene set length by leveraging the nature that the human complex traits and diseases have "moderate" tissue- and cell type- specificity among different TCs. Intuitively, if one gene list is ranked as the top quantile of a large-scale complex trait-associated gene (TAGs) based on CSEA raw p-value, we reject the null hypothesis that this gene list has no enrichment with this TC. To generate biological meaningful random shuffle gene sets for the permutation method, we curated current available TAGs from ~5,600 genome-wide association studies (GWAS) and ~3,700 rare-variants association phenotypes from UK BioBank, GWAS catalog, and GeneBass. After stringent quality control criteria, we kept 19,663 TAGs ranging from 20 genes to 2,000 genes.
We adapted these 19,663 TAGs as the ideal random gene sets for permutation shuffle. First, we follow the formulas below for each inquiry gene list and conduct the CSEA across 1,355 TCs to get the permutated p-values by ranking among 19,663 TAGs and 1,355 TCs. Then we use Fisher's method to combine an overall p-value from the permutated p-values by TAGs and TCs.
Pperm(i) = rank (Praw(i), P#TAG(i))/ 19,663 × cumulative factor (1)
PTC(i) = rank (Praw(i), P#TC(i))/ 1355 (2)
X42 ~ -2 ln(Pperm(i) * PTC(i)) (3)
Specifically, i indicates the ith TC, where Praw(i) is the hypergeometric test of inquiry gene list and TC-specific genes by our previous method deTS; the cumulative factor is an empirical parameter used to adjust the TAGs length difference. Here we use the proportion of TAGs in a total of 19,663 TAGs with at least the length of input gene list; P#TAG(i) represents the vector of permutated CSEA pvalues for 19,663 TAGs; Then, the Praw(i) is further ranked over all the 1,355 CSEA P#TC(i) in ith TC. Lastly, we used the Fisher’s method to combine p values from Pperm(i) and PTC(i) in ith TC into one chi-squared distribution statistic (X2). The sum of 2 independent chi-squared values, following a chi-squared distribution with 2*2 degrees of freedom.
4.Input page
The input of the WebCSEA is just a list of gene symbols, length of which ranges from 20 to 2,000. We will assign a job so the user to retrieve or share the enrichment result within 30 days.

- Job identifier: An automatically generated identifier for retrieve or share the enrichment result within 30 days.
- Gene list: Users are recommended to input gene symbol list with the length from 20 to 2,000 to obtain a meaningful enrichment. The system will automatically exclude genes with unknown gene symbols. Reminder: Input gene list that is shorter than 20 genes might be inaccurate during chi-squared approximation. Therefore, the user should be cautious about interpreting the result.
- Number of confirmed genes used in WebCSEA: We used the GRCh38 (ENSEMBL 99 version) as the background reference.
- Function buttons:Click Submit after typing in all the gene list. Click “Reset” to empty the Gene list. Click Example to use example gene list for a test run.
5. Output page
Tissue-cell-type specificity across 1,355 TCs by organ systems/tissues/cell types.
For each inquiry gene list, we will conduct the CSEA over 1,355 TCs and generate combined p-values to measure the tissue-cell-type specificity without the bias from the number of signature genes between different TCs and input gene list size.
After the job finishes, the system will indicate the Job status as “Finished”.

We provide extensive visualization function such as, interactive heatmap, interactive and static jitter plots to displays the cell-type specificity across 1,355 human TCs by human organ system, developmental-stage, and top-ranked tissues and cell types.
1) Interactive jitter plots
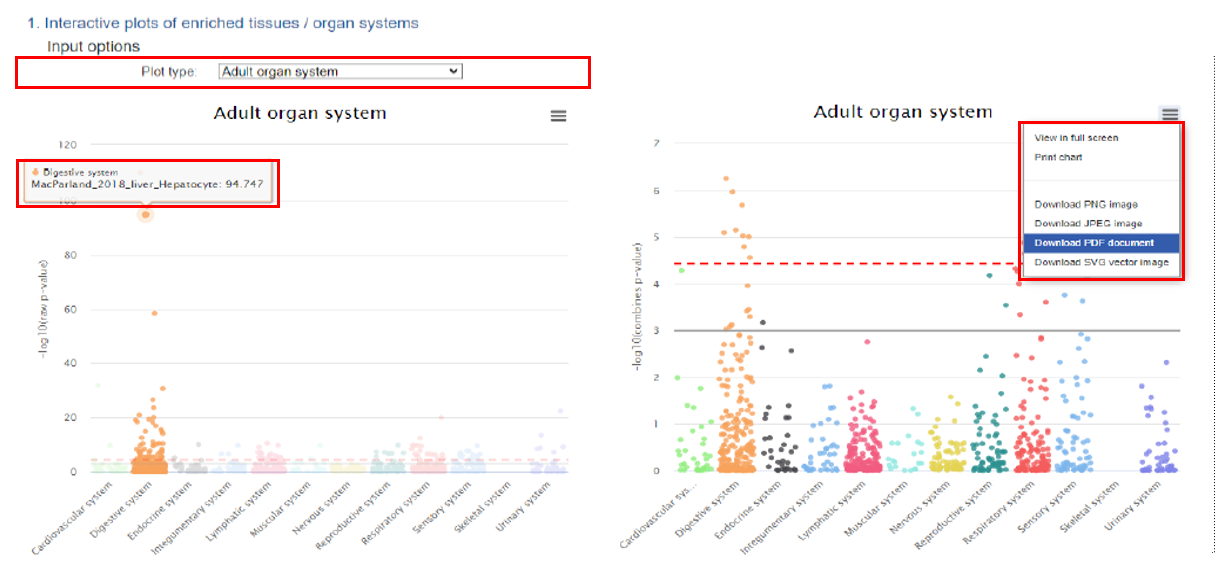
We provided several input options to display the cell-type-specificity enrichment results, including by organ systems, adult and fetal developmental stages, top 20 tissues, and top 20 general cell type in both raw and combine p-value CSEA results. When the mouse is moved to each dot, the dots in that specific column will all be highlighted and the detailed tissue cell type information and –log10 (P) in that specific category will be displayed in the floating window. The user could further download the corresponding plot in JPEG, SVG and PDF format. The users could further highlight the tissue-cell type of interest on those downloaded files.
2) Static jitter plots
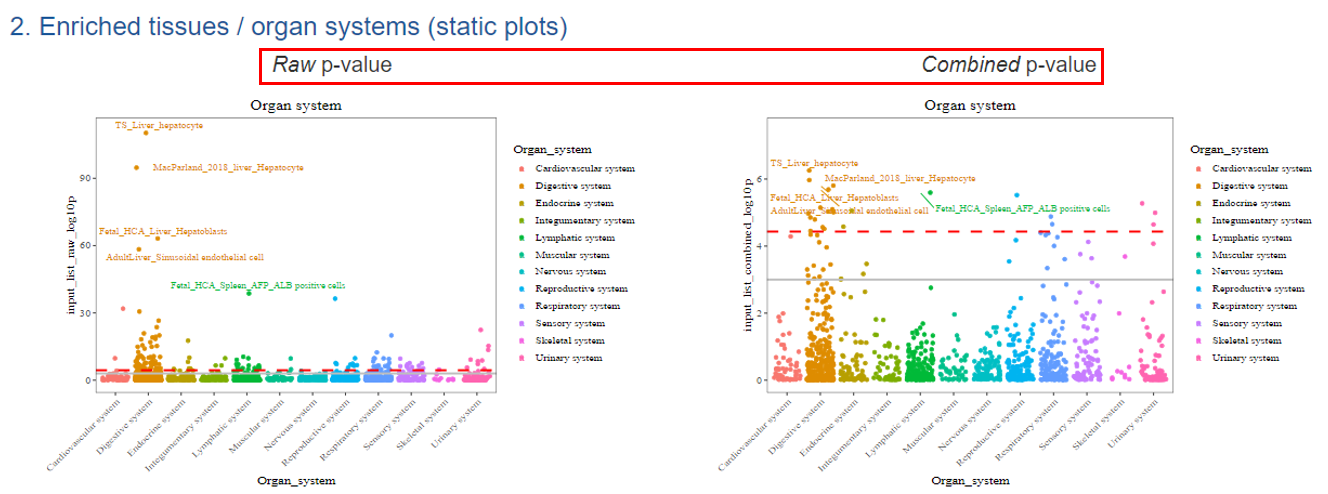
For each static CSEA result, we have the visualization for both raw p-value (left) and combined p-value (right) results in five major categories, including by human organ system, adult organ system, fetal organ system, and top-ranked tissues and general cell types. We annotated the top 5 TCs in each category of stratification. All the visualization could be reproduced with the script provided from Github (https://github.com/davidroad/WebCSEA).
2-1) CSEA results by tissues / Organ systems
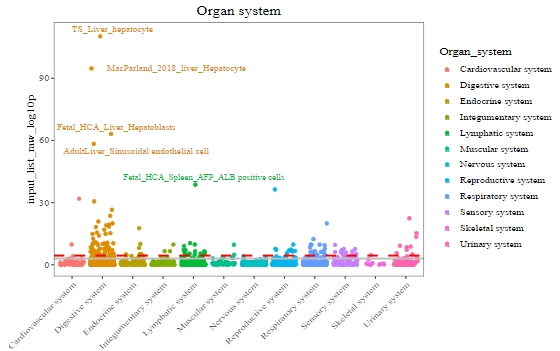
Each dot represents one TC categorized by 12 Organ system. The red dashed line indicates the Bonferroni-corrected significance (p = 3.69 x 10^-5) by 1,355 tissue-cell types. The grey solid line indicates the nominal significance (p = 1 x 10^-3). X-axis represents the 12 organ systems. Y-axis indicates the tissue-cell-type specificity (–log10 (combined p-value)) for each TC from CSEA. Top 5 general TCs are highlighted.
2-2) Top 20 tissues ordered by the most significant TC in each tissue
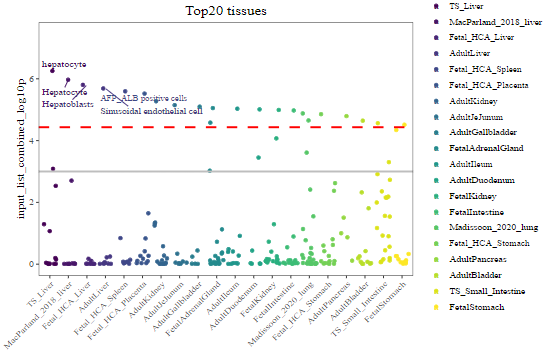
Each dot represents one TC within each tissue. The red dashed line indicates the Bonferroni-corrected significance (p = 3.69 x 10^-5) by 1,355 tissue-cell types. The grey solid line indicates the nominal significance (p = 1 x 10^-3). X-axis represents the top 20 tissues. Y-axis indicates the tissue-cell-type specificity (–log10 (combined p-value)) for each TC from CSEA. Top 5 general cell types are highlighted.
2-3) CSEA result by Organ system stratified by developmental stage

The dashed red line indicates the Bonferroni-corrected significance (p = 3.69 x 10^-5) by 1,355 tissue-cell types. The solid grey line indicates the nominal significance (p = 1 x 10^-3). X-axis represents the 12 organ systems. Y-axis indicates the tissue-cell-type specificity (–log10 (combined p-value)) for each TC from CSEA. Top 5 general TCs are highlighted.
2-4) Top 20 most significant general cell types
The dashed red line indicates the Bonferroni-corrected significance (p = 3.69 x 10^-5) by 1,355 tissue-cell types. The solid grey line indicates the nominal significance (p = 1 x 10^-3). X-axis represents the 12 organ systems. Y-axis indicates the tissue-cell-type specificity (–log10 (combined p-value)) for each TC from CSEA. Top 5 general cell types are highlighted.
3) Top 3 enriched cell types and genes based on combined p-values

We list the top three cell-type-specific TCs and the intersected genes.
4) Interactive p-value heatmap
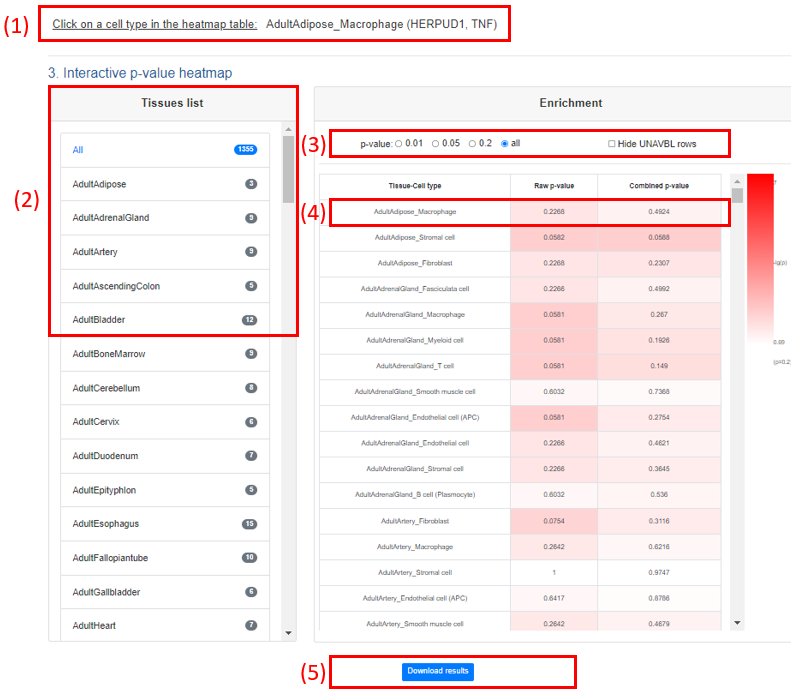
The color of the heatmap is proportional to the tissue-cell type specificity of inquiry gene list. The row is TCs, and two columns are raw-pvalue and combined-pvalue generated by CSEA, respectively.
(1). Interactively select the genes in TC: The users could click the TC on the heatmap to get the intersected genes of inquiry gene list and that TC.
(2). Interactively select the tissue list: The users could click the TC on tissue list to get specific tissue. The heatmap will be on should the selected tissue.
(3). We could select the different threshold for the combined-pvalue or hide those rows don’t obtain the CSEA results due to without intersect genes.
(4). The raw and combined pvalues from the CSEA results are showed in the each cube, respectively.
(5). Click the Download results to obtain the all the CSEA results used to generate the output page, including both raw p-value and combined p-value plots and CSEA results of Tissue, TC, Organ system, Praw, Pperm, PTC, combined p-value, and intersect genes. .
6. Application examples (Go to application list page)
(1) Application 1: Eye disease gene list
(2) Application 2: Bulk RNA-seq differentially expressed gene analysis
(3) Application 3: Kidney Developmental gene list
(4) Application 4: Alzheimer’s Disease risk gene list
(5) Application 5: Lung adenocarcinoma tissue-specific gene list from TissGDB
(6) Application 6: Type2 diabetes gold standard gene list from T2D Knowledge Portal
(7) Example 1: Hepatocyte signature genes
(8) Example 2: Synapse Intracellular signal transduction pathway
7. Relevant works
Yulin Dai#, Ruifeng Hu#, Andi Liu, Kyung Serk Cho, Astrid Marilyn Manuel, Xiaoyang Li, Xianjun Dong, Peilin Jia, Zhongming Zhao, WebCSEA: web-based cell-type-specific enrichment analysis of genes, Nucleic Acids Research, 2022, gkac392, https://doi.org/10.1093/nar/gkac392
Yulin Dai#, Ruifeng Hu#, Astrid Marilyn Manuel, Andi Liu, Peilin Jia, and Zhongming Zhao. CSEA-DB: an omnibus for human complex trait and cell type associations. Nucleic Acids Research 49, no. D1 (2021): D862-D870. PubMed
Guangsheng Pei, Yulin Dai, Zhongming Zhao, and Peilin Jia. deTS: tissue-specific enrichment analysis to decode tissue specificity. Bioinformatics 35, no. 19 (2019): 3842-3845. PubMed
Guangsheng Pei, Fangfang Yan, Lukas M. Simon, Yulin Dai, Peilin Jia, and Zhongming Zhao*. (2022) " "deCS: A tool for systematic cell type annotations of single-cell RNA sequencing data among human tissues." Genomics, Proteomics and Bioinformatics.
Peilin Jia#, Yulin Dai#, Ruifeng Hu, Guangsheng Pei, Astrid M. Manuel and Zhongming Zhao*. (2020) "TSEA-DB: a trait-tissue association map for human complex traits and diseases." Nucleic Acids Res, 48, D1022-D1030.