Gene Page: HCP5
Summary ?
| GeneID | 10866 |
| Symbol | HCP5 |
| Synonyms | 6S2650E|D6S2650E|P5-1 |
| Description | HLA complex P5 (non-protein coding) |
| Reference | MIM:604676|HGNC:HGNC:21659|Ensembl:ENSG00000206337|HPRD:05245| |
| Gene type | ncRNA |
| Map location | 6p21.3 |
| Pascal p-value | 2.697E-9 |
| Fetal beta | -0.026 |
| DMG | 1 (# studies) |
| eGene | Cerebellar Hemisphere Myers' cis & trans |
Gene in Data Sources
| Gene set name | Method of gene set | Description | Info |
|---|---|---|---|
| CV:GWASdb | Genome-wide Association Studies | GWASdb records for schizophrenia | |
| CV:PGCnp | Genome-wide Association Study | GWAS | |
| DMG:Wockner_2014 | Genome-wide DNA methylation analysis | This dataset includes 4641 differentially methylated probes corresponding to 2929 unique genes between schizophrenia patients (n=24) and controls (n=24). | 1 |
| GSMA_I | Genome scan meta-analysis | Psr: 0.033 |
Section I. Genetics and epigenetics annotation
 Differentially methylated gene
| Probe | Chromosome | Position | Nearest gene | P (dis) | Beta (dis) | FDR (dis) | Study |
|---|---|---|---|---|---|---|---|
| cg06480496 | 6 | 31430675 | HCP5 | 5.705E-4 | -0.482 | 0.049 | DMG:Wockner_2014 |
 eQTL annotation
| SNP ID | Chromosome | Position | eGene | Gene Entrez ID | pvalue | qvalue | TSS distance | eQTL type |
|---|---|---|---|---|---|---|---|---|
| rs12087645 | chr1 | 18509666 | HCP5 | 10866 | 0.08 | trans | ||
| rs16852306 | chr2 | 167417804 | HCP5 | 10866 | 0.06 | trans | ||
| rs10505414 | chr8 | 122940787 | HCP5 | 10866 | 0.01 | trans | ||
| rs10990447 | chr9 | 98412986 | HCP5 | 10866 | 0.19 | trans | ||
| rs1955728 | chr14 | 39976063 | HCP5 | 10866 | 0.15 | trans |
Section II. Transcriptome annotation
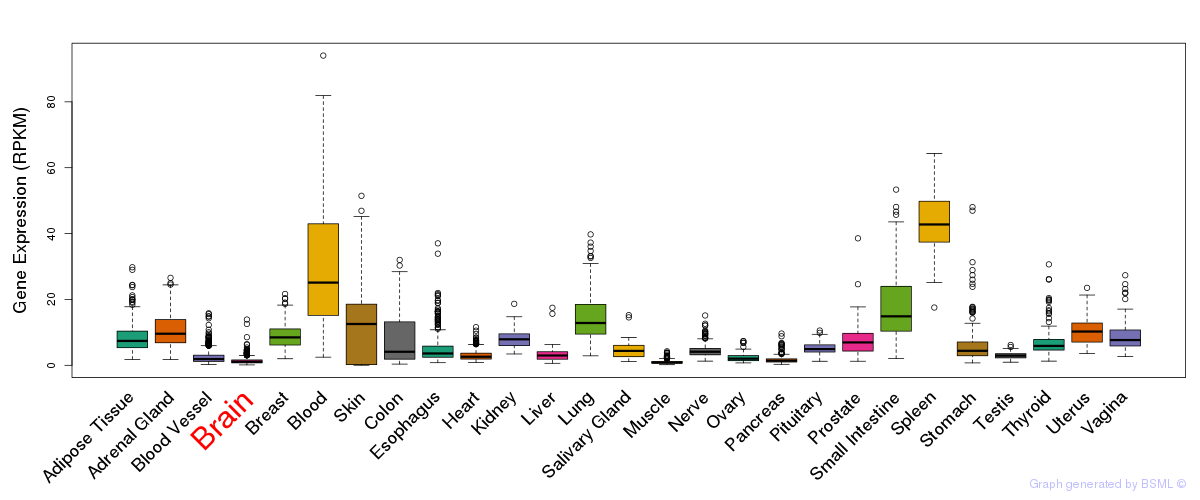
General gene expression (GTEx)

Gene expression during devlopment (BrainCloud)
Footnote:
A total of 269 time points ploted, with n=38 fetal samples (x=1:38). Each triangle represents one time point.
Gene expression of temporal and spatial changes (BrainSpan)
Footnote:
SC: sub-cortical regions; SM: sensory-motor regions; FC: frontal cortex; and TP: temporal-parietal cortex
ST1: fetal (13 - 26 postconception weeks), ST2: early infancy to late childhood (4 months to 11 years), and ST3: adolescence to adulthood (13 - 23 years)
The bar shown representes the lower 25% and upper 25% of the expression distribution.
Top co-expressed genes in brain regions
| Top 10 positively co-expressed genes | ||
| Gene | Pearson's Correlation | Spearman's Correlation |
| SELPLG | 0.56 | 0.50 |
| TBXAS1 | 0.54 | 0.52 |
| ITGAM | 0.53 | 0.47 |
| C3AR1 | 0.53 | 0.53 |
| CD74 | 0.53 | 0.46 |
| LAPTM5 | 0.52 | 0.53 |
| ALOX5AP | 0.52 | 0.49 |
| HLA-DRA | 0.51 | 0.44 |
| LILRB1 | 0.51 | 0.45 |
| HLA-DPA1 | 0.50 | 0.47 |
| Top 10 negatively co-expressed genes | ||
| Gene | Pearson's Correlation | Spearman's Correlation |
| GTF3C6 | -0.27 | -0.24 |
| BCL7C | -0.26 | -0.26 |
| SH3BP2 | -0.25 | -0.24 |
| PLEKHO1 | -0.25 | -0.19 |
| TTLL2 | -0.25 | -0.18 |
| RBMX2 | -0.24 | -0.25 |
| EXOSC8 | -0.24 | -0.23 |
| CCDC28B | -0.24 | -0.27 |
| RP9P | -0.24 | -0.36 |
| AS3MT | -0.24 | -0.20 |
Section V. Pathway annotation
| Pathway name | Pathway size | # SZGR 2.0 genes in pathway | Info |
|---|---|---|---|
| HOLLMANN APOPTOSIS VIA CD40 DN | 267 | 178 | All SZGR 2.0 genes in this pathway |
| BERTUCCI MEDULLARY VS DUCTAL BREAST CANCER UP | 206 | 111 | All SZGR 2.0 genes in this pathway |
| GRAHAM CML DIVIDING VS NORMAL QUIESCENT DN | 95 | 57 | All SZGR 2.0 genes in this pathway |
| ENK UV RESPONSE EPIDERMIS UP | 293 | 179 | All SZGR 2.0 genes in this pathway |
| PUJANA ATM PCC NETWORK | 1442 | 892 | All SZGR 2.0 genes in this pathway |
| BENPORATH CYCLING GENES | 648 | 385 | All SZGR 2.0 genes in this pathway |
| SUNG METASTASIS STROMA DN | 54 | 34 | All SZGR 2.0 genes in this pathway |
| ONDER CDH1 TARGETS 1 UP | 140 | 85 | All SZGR 2.0 genes in this pathway |
| ZHAN MULTIPLE MYELOMA UP | 64 | 46 | All SZGR 2.0 genes in this pathway |
| HADDAD B LYMPHOCYTE PROGENITOR | 293 | 193 | All SZGR 2.0 genes in this pathway |
| ACEVEDO LIVER CANCER UP | 973 | 570 | All SZGR 2.0 genes in this pathway |
| MITSIADES RESPONSE TO APLIDIN UP | 439 | 257 | All SZGR 2.0 genes in this pathway |
| BOQUEST STEM CELL DN | 216 | 143 | All SZGR 2.0 genes in this pathway |
| LEE EARLY T LYMPHOCYTE DN | 57 | 36 | All SZGR 2.0 genes in this pathway |
| CAIRO HEPATOBLASTOMA CLASSES DN | 210 | 141 | All SZGR 2.0 genes in this pathway |
| KYNG RESPONSE TO H2O2 VIA ERCC6 DN | 46 | 31 | All SZGR 2.0 genes in this pathway |
| KUMAR PATHOGEN LOAD BY MACROPHAGES | 275 | 155 | All SZGR 2.0 genes in this pathway |
| KUMAR AUTOPHAGY NETWORK | 71 | 46 | All SZGR 2.0 genes in this pathway |
| ZWANG EGF INTERVAL DN | 214 | 124 | All SZGR 2.0 genes in this pathway |