Gene Page: TPPP
Summary ?
| GeneID | 11076 |
| Symbol | TPPP |
| Synonyms | TPPP/p25|TPPP1|p24|p25|p25alpha |
| Description | tubulin polymerization promoting protein |
| Reference | MIM:608773|HGNC:HGNC:24164|Ensembl:ENSG00000171368|HPRD:18522|Vega:OTTHUMG00000131011 |
| Gene type | protein-coding |
| Map location | 5p15.3 |
| Pascal p-value | 0.86 |
| Sherlock p-value | 0.047 |
| Fetal beta | -2.129 |
| DMG | 1 (# studies) |
| Support | G2Cdb.humanPSD G2Cdb.humanPSP CompositeSet Darnell FMRP targets |
Gene in Data Sources
| Gene set name | Method of gene set | Description | Info |
|---|---|---|---|
| CV:PGCnp | Genome-wide Association Study | GWAS | |
| DMG:Wockner_2014 | Genome-wide DNA methylation analysis | This dataset includes 4641 differentially methylated probes corresponding to 2929 unique genes between schizophrenia patients (n=24) and controls (n=24). | 1 |
Section I. Genetics and epigenetics annotation
 Differentially methylated gene
| Probe | Chromosome | Position | Nearest gene | P (dis) | Beta (dis) | FDR (dis) | Study |
|---|---|---|---|---|---|---|---|
| cg26663609 | 5 | 691161 | TPPP | 1.271E-4 | 0.352 | 0.03 | DMG:Wockner_2014 |
Section II. Transcriptome annotation
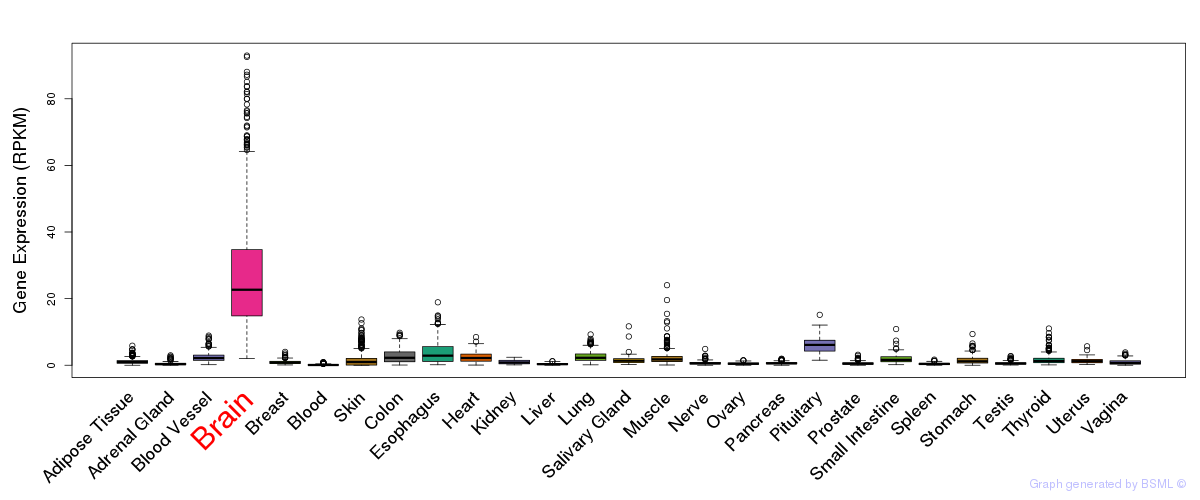
General gene expression (GTEx)

Gene expression during devlopment (BrainCloud)
Footnote:
A total of 269 time points ploted, with n=38 fetal samples (x=1:38). Each triangle represents one time point.
Gene expression of temporal and spatial changes (BrainSpan)
Footnote:
SC: sub-cortical regions; SM: sensory-motor regions; FC: frontal cortex; and TP: temporal-parietal cortex
ST1: fetal (13 - 26 postconception weeks), ST2: early infancy to late childhood (4 months to 11 years), and ST3: adolescence to adulthood (13 - 23 years)
The bar shown representes the lower 25% and upper 25% of the expression distribution.
Top co-expressed genes in brain regions
| Top 10 positively co-expressed genes | ||
| Gene | Pearson's Correlation | Spearman's Correlation |
| POT1 | 0.88 | 0.86 |
| PTGES3 | 0.86 | 0.86 |
| TMEM68 | 0.86 | 0.83 |
| FBXL5 | 0.86 | 0.83 |
| MAPKSP1 | 0.86 | 0.83 |
| BBS10 | 0.85 | 0.84 |
| C3orf38 | 0.85 | 0.84 |
| NMD3 | 0.85 | 0.81 |
| ORC4L | 0.85 | 0.85 |
| UBE2N | 0.84 | 0.82 |
| Top 10 negatively co-expressed genes | ||
| Gene | Pearson's Correlation | Spearman's Correlation |
| AF347015.26 | -0.70 | -0.70 |
| MT-CO2 | -0.70 | -0.67 |
| AF347015.33 | -0.69 | -0.67 |
| AF347015.8 | -0.68 | -0.68 |
| AF347015.2 | -0.67 | -0.65 |
| MT-CYB | -0.67 | -0.67 |
| AF347015.15 | -0.67 | -0.67 |
| AF347015.18 | -0.65 | -0.69 |
| AF347015.27 | -0.62 | -0.63 |
| TINAGL1 | -0.61 | -0.65 |
Section III. Gene Ontology annotation
| Molecular function | GO term | Evidence | Neuro keywords | PubMed ID |
|---|---|---|---|---|
| GO:0005515 | protein binding | IPI | 15590652 | |
| GO:0008017 | microtubule binding | ISS | - | |
| Biological process | GO term | Evidence | Neuro keywords | PubMed ID |
| GO:0001578 | microtubule bundle formation | ISS | - | |
| GO:0032273 | positive regulation of protein polymerization | IDA | 15590652 | |
| GO:0031334 | positive regulation of protein complex assembly | ISS | - | |
| GO:0046785 | microtubule polymerization | ISS | - | |
| Cellular component | GO term | Evidence | Neuro keywords | PubMed ID |
| GO:0005625 | soluble fraction | ISS | - | |
| GO:0048471 | perinuclear region of cytoplasm | IDA | 15590652 |
Section V. Pathway annotation
| Pathway name | Pathway size | # SZGR 2.0 genes in pathway | Info |
|---|---|---|---|
| SENGUPTA NASOPHARYNGEAL CARCINOMA DN | 349 | 157 | All SZGR 2.0 genes in this pathway |
| DODD NASOPHARYNGEAL CARCINOMA UP | 1821 | 933 | All SZGR 2.0 genes in this pathway |
| NIKOLSKY BREAST CANCER 5P15 AMPLICON | 26 | 15 | All SZGR 2.0 genes in this pathway |
| LU AGING BRAIN DN | 153 | 120 | All SZGR 2.0 genes in this pathway |
| BILD E2F3 ONCOGENIC SIGNATURE | 246 | 153 | All SZGR 2.0 genes in this pathway |
| GRADE COLON CANCER UP | 871 | 505 | All SZGR 2.0 genes in this pathway |
| GOBERT OLIGODENDROCYTE DIFFERENTIATION DN | 1080 | 713 | All SZGR 2.0 genes in this pathway |
Section VI. microRNA annotation
| miRNA family | Target position | miRNA ID | miRNA seq | ||
|---|---|---|---|---|---|
| UTR start | UTR end | Match method | |||
| miR-1/206 | 70 | 76 | m8 | hsa-miR-1 | UGGAAUGUAAAGAAGUAUGUA |
| hsa-miR-206SZ | UGGAAUGUAAGGAAGUGUGUGG | ||||
| hsa-miR-613 | AGGAAUGUUCCUUCUUUGCC | ||||
- SZ: miRNAs which differentially expressed in brain cortex of schizophrenia patients comparing with control samples using microarray. Click here to see the list of SZ related miRNAs.
- Brain: miRNAs which are expressed in brain based on miRNA microarray expression studies. Click here to see the list of brain related miRNAs.