Gene Page: DIRAS3
Summary ?
| GeneID | 9077 |
| Symbol | DIRAS3 |
| Synonyms | ARHI|NOEY2 |
| Description | DIRAS family GTP binding RAS like 3 |
| Reference | MIM:605193|HGNC:HGNC:687|Ensembl:ENSG00000162595|HPRD:05547| |
| Gene type | protein-coding |
| Map location | 1p31 |
| Pascal p-value | 0.145 |
| Fetal beta | -0.274 |
| DMG | 1 (# studies) |
| eGene | Myers' cis & trans |
Gene in Data Sources
| Gene set name | Method of gene set | Description | Info |
|---|---|---|---|
| DMG:Wockner_2014 | Genome-wide DNA methylation analysis | This dataset includes 4641 differentially methylated probes corresponding to 2929 unique genes between schizophrenia patients (n=24) and controls (n=24). | 1 |
| GSMA_IIA | Genome scan meta-analysis (All samples) | Psr: 0.02692 |
Section I. Genetics and epigenetics annotation
 Differentially methylated gene
| Probe | Chromosome | Position | Nearest gene | P (dis) | Beta (dis) | FDR (dis) | Study |
|---|---|---|---|---|---|---|---|
| cg21808053 | 1 | 68513063 | DIRAS3 | 4.84E-5 | -0.372 | 0.021 | DMG:Wockner_2014 |
 eQTL annotation
| SNP ID | Chromosome | Position | eGene | Gene Entrez ID | pvalue | qvalue | TSS distance | eQTL type |
|---|---|---|---|---|---|---|---|---|
| rs7838399 | chr8 | 8457079 | DIRAS3 | 9077 | 0.18 | trans | ||
| rs510992 | chr18 | 24268491 | DIRAS3 | 9077 | 0.14 | trans | ||
| rs506038 | chr18 | 24271081 | DIRAS3 | 9077 | 0.13 | trans |
Section II. Transcriptome annotation
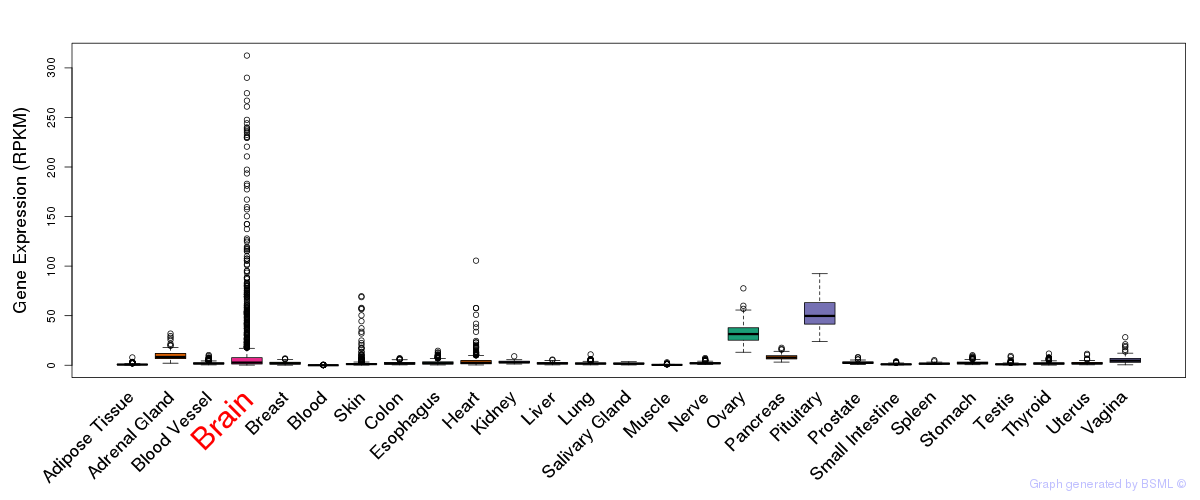
General gene expression (GTEx)

Gene expression during devlopment (BrainCloud)
Footnote:
A total of 269 time points ploted, with n=38 fetal samples (x=1:38). Each triangle represents one time point.
Gene expression of temporal and spatial changes (BrainSpan)
Footnote:
SC: sub-cortical regions; SM: sensory-motor regions; FC: frontal cortex; and TP: temporal-parietal cortex
ST1: fetal (13 - 26 postconception weeks), ST2: early infancy to late childhood (4 months to 11 years), and ST3: adolescence to adulthood (13 - 23 years)
The bar shown representes the lower 25% and upper 25% of the expression distribution.
Top co-expressed genes in brain regions
| Top 10 positively co-expressed genes | ||
| Gene | Pearson's Correlation | Spearman's Correlation |
| INPP4A | 0.94 | 0.95 |
| MTMR9 | 0.92 | 0.95 |
| ABI2 | 0.92 | 0.94 |
| ARHGEF7 | 0.92 | 0.94 |
| YWHAG | 0.92 | 0.93 |
| MAPRE2 | 0.92 | 0.93 |
| GABRB3 | 0.91 | 0.94 |
| MAP2 | 0.91 | 0.93 |
| PAFAH1B1 | 0.91 | 0.92 |
| DLG3 | 0.90 | 0.91 |
| Top 10 negatively co-expressed genes | ||
| Gene | Pearson's Correlation | Spearman's Correlation |
| FXYD1 | -0.72 | -0.74 |
| SLC25A18 | -0.69 | -0.71 |
| TLCD1 | -0.69 | -0.73 |
| HSD17B14 | -0.68 | -0.72 |
| AF347015.31 | -0.68 | -0.74 |
| MT-CO2 | -0.68 | -0.74 |
| CLDN10 | -0.68 | -0.70 |
| HIGD1B | -0.68 | -0.74 |
| TSC22D4 | -0.67 | -0.69 |
| AC021016.1 | -0.67 | -0.72 |
Section III. Gene Ontology annotation
| Molecular function | GO term | Evidence | Neuro keywords | PubMed ID |
|---|---|---|---|---|
| GO:0000166 | nucleotide binding | IEA | - | |
| GO:0003924 | GTPase activity | TAS | 9874798 | |
| GO:0005525 | GTP binding | IEA | - | |
| Biological process | GO term | Evidence | Neuro keywords | PubMed ID |
| GO:0000079 | regulation of cyclin-dependent protein kinase activity | TAS | 9874798 | |
| GO:0006349 | genetic imprinting | TAS | 9874798 | |
| GO:0007264 | small GTPase mediated signal transduction | TAS | 9874798 | |
| Cellular component | GO term | Evidence | Neuro keywords | PubMed ID |
| GO:0005886 | plasma membrane | IEA | - |
Section V. Pathway annotation
| Pathway name | Pathway size | # SZGR 2.0 genes in pathway | Info |
|---|---|---|---|
| CHEMNITZ RESPONSE TO PROSTAGLANDIN E2 DN | 391 | 222 | All SZGR 2.0 genes in this pathway |
| PIEPOLI LGI1 TARGETS UP | 15 | 11 | All SZGR 2.0 genes in this pathway |
| THUM SYSTOLIC HEART FAILURE UP | 423 | 283 | All SZGR 2.0 genes in this pathway |
| HORIUCHI WTAP TARGETS UP | 306 | 188 | All SZGR 2.0 genes in this pathway |
| KAN RESPONSE TO ARSENIC TRIOXIDE | 123 | 80 | All SZGR 2.0 genes in this pathway |
| BLALOCK ALZHEIMERS DISEASE DN | 1237 | 837 | All SZGR 2.0 genes in this pathway |
| SATO SILENCED BY METHYLATION IN PANCREATIC CANCER 1 | 419 | 273 | All SZGR 2.0 genes in this pathway |
| ACEVEDO METHYLATED IN LIVER CANCER DN | 940 | 425 | All SZGR 2.0 genes in this pathway |
| CHICAS RB1 TARGETS SENESCENT | 572 | 352 | All SZGR 2.0 genes in this pathway |
| ZWANG TRANSIENTLY UP BY 2ND EGF PULSE ONLY | 1725 | 838 | All SZGR 2.0 genes in this pathway |