 |
||||||
|
|
||||||
Data Source for Expression Study |
| 1. Method |
|---|
|
There are two kinds of expression data in SZGR, one for the purpose of data collection while the other for annotation. To collect schizophrenia related genes, we incorporated the Stanley Medical Research Institute (SMRI), which has assembled a large number of microarrays for schizophrenia and bipolar studies. They provided meta-analysis of 12 individual gene expression datasets involved in 988 arrays (November 2007) ( Higgs et al. 2006). We downloaded the overall P values for the genes and extracted those genes whose P values were less than 0.05. We assigned score to each gene by its -log10 P, where P is based on the t-statistic for the weighted fold change and combined standard error of the fold change. On the other hand, to annotate genes we have collected (not only those of the expression dataset, but all the genes from the 6 sources in SZGR), we used the data from Gene Atlas (version 2) ( Su et al. 2004) which contains gene expression profile in 79 human tissues. Gene expression in a tissue was measured using the arithmetic mean of the average difference (AD) values of their corresponding probe sets. The ADs for a gene are dynamically plotted in a single graph as shown in the gene page. |
| 2. Dataset Description |
|
The expression study resulted in 726 genes which are differently expressed between the schizophrenia post-mortem and control samples. |
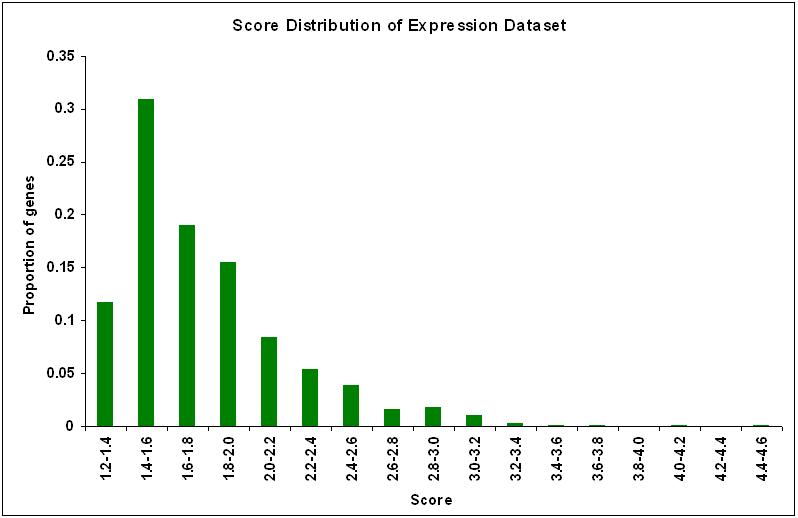 |
| Figure 1. Score distribution of expression dataset |
| References |
|
| Copyright © Bioinformatics and Systems Medicine Laboratory All Rights Reserved since 2009. |