Differentially Expressed Genes
| GSE Num | Phenotype | Group1 (#) | Group2 (#) | DEGs | Tissue | Pubmed |
|---|---|---|---|---|---|---|
| GSE6264 | Nicotine Use | Case (6) | Ctrl (9) | 1112 (p-adj<0.05&|log2FC|>1) 6263 (p-adj<0.2&|log2FC|>0.58) | Lymphoblast cell lines | 17342724 |
| GSE44456 | Alcohol Consumption | Case (20) | Ctrl (19) | 1 (p-adj<0.05&|log2FC|>1) 13 (p-adj<0.2&|log2FC|>0.58) | Postmortem Hippocampus | 23981442 |
| GSE20568 | Nicotine Addiction | Case (5) | Ctrl (5) | 0 (p-adj<0.05&|log2FC|>1) 1 (p-adj<0.2&|log2FC|>0.58) | Nucleus Accumbens | 20477762 |
| GSE20568 | Alcohol abuse and Nicotine addiction | Case (5) | Ctrl (5) | 0 (p-adj<0.05&|log2FC|>1) 3 (p-adj<0.2&|log2FC|>0.58) | Nucleus Accumbens | 20477762 |
| GSE54839 | Cocaine Addiction | Case (10) | Ctrl (10) | 2 (p-adj<0.05&|log2FC|>1) 58 (p-adj<0.2&|log2FC|>0.58) | Midbrain | 24642598 |
| GSE71939 | Cocaine Exposure (6H) | Case (3) | Ctrl (3) | 6 (p-adj<0.05&|log2FC|>1) 167 (p-adj<0.2&|log2FC|>0.58) | SH-SY5Y neuroblastoma cell | 26506053 |
| GSE62699 | Alcohol Dependence | Case (18) | Ctrl (18) | 236 (p-adj<0.05&|log2FC|>1) 1032 (p-adj<0.2&|log2FC|>0.58) | Nucleus Accumbens | 26381263 |
| GSE49376 | Alcohol Dependence | Case:Female (7) | Case:male (16) | 5 (p-adj<0.05&|log2FC|>1) 6 (p-adj<0.2&|log2FC|>0.58) | Postmortem Prefrontal Cortex | 24163133 |
| GSE29555 | Alcohol Dependence | Case (17) | Case (15) | 10 (p-adj<0.05&|log2FC|>1) 244 (p-adj<0.2&|log2FC|>0.58) | Basolateral Amygdata | - |
| GSE29555 | Alcohol Dependence | Case (17) | Case (15) | 5 (p-adj<0.05&|log2FC|>1) 92 (p-adj<0.2&|log2FC|>0.58) | Central Nucleus of Amygdata | - |
| GSE29555 | Alcohol Dependence | Case (17) | Case (15) | 0 (p-adj<0.05&|log2FC|>1) 39 (p-adj<0.2&|log2FC|>0.58) | Midial Nucleus of Amygdata | - |
| GSE29555 | Alcohol Dependence | Case (17) | Case (15) | 0 (p-adj<0.05&|log2FC|>1) 73 (p-adj<0.2&|log2FC|>0.58) | Superior Frontal Cortex | - |
Top Ranked Genes in Different Tissues Based on Sherlock Analysis
Show
genes for
(sorted by p-value)
| Rank | Gene ID | Symbol | p-value (raw) | Logarithm Bayes factor (LBF) |
|---|
Top Ranked Genes/Pathways Based on Pascal Analysis
Genes
genes for
| Rank | Gene ID | Gene Symbol | p-value |
|---|
Pathways
pathways for
| Rank | Pathway | p-value |
|---|
Top Ranked Genes in Different Tissues Based on MetaXcan Analysis
Show
genes for
(sorted by p-value)
| Rank | Gene ID | Symbol | p-value | z-score | Effect Size | Pred_r2 | Pred p-value |
|---|
Tissue-Specific Enrichment Analysis (TSEA)
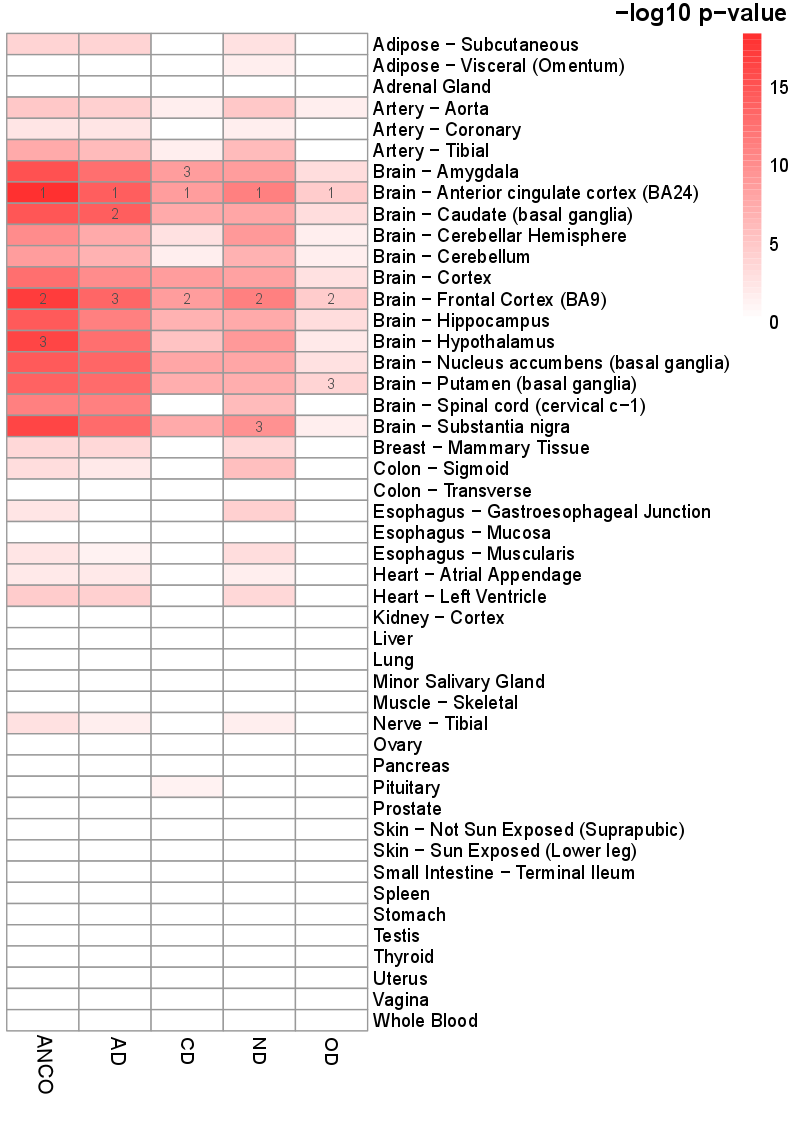 Footnote:
The Tissue-Specific Enrichment Analysis(TSEA) was done by using SNP-mapped genes.
* : the most (1st) enriched tissue.
+ : the second (2nd) enriched tissue.
- : the third (3rd) enriched tissue
Enrichment of tissue specific eQTL (Top 5 ranked tissues)
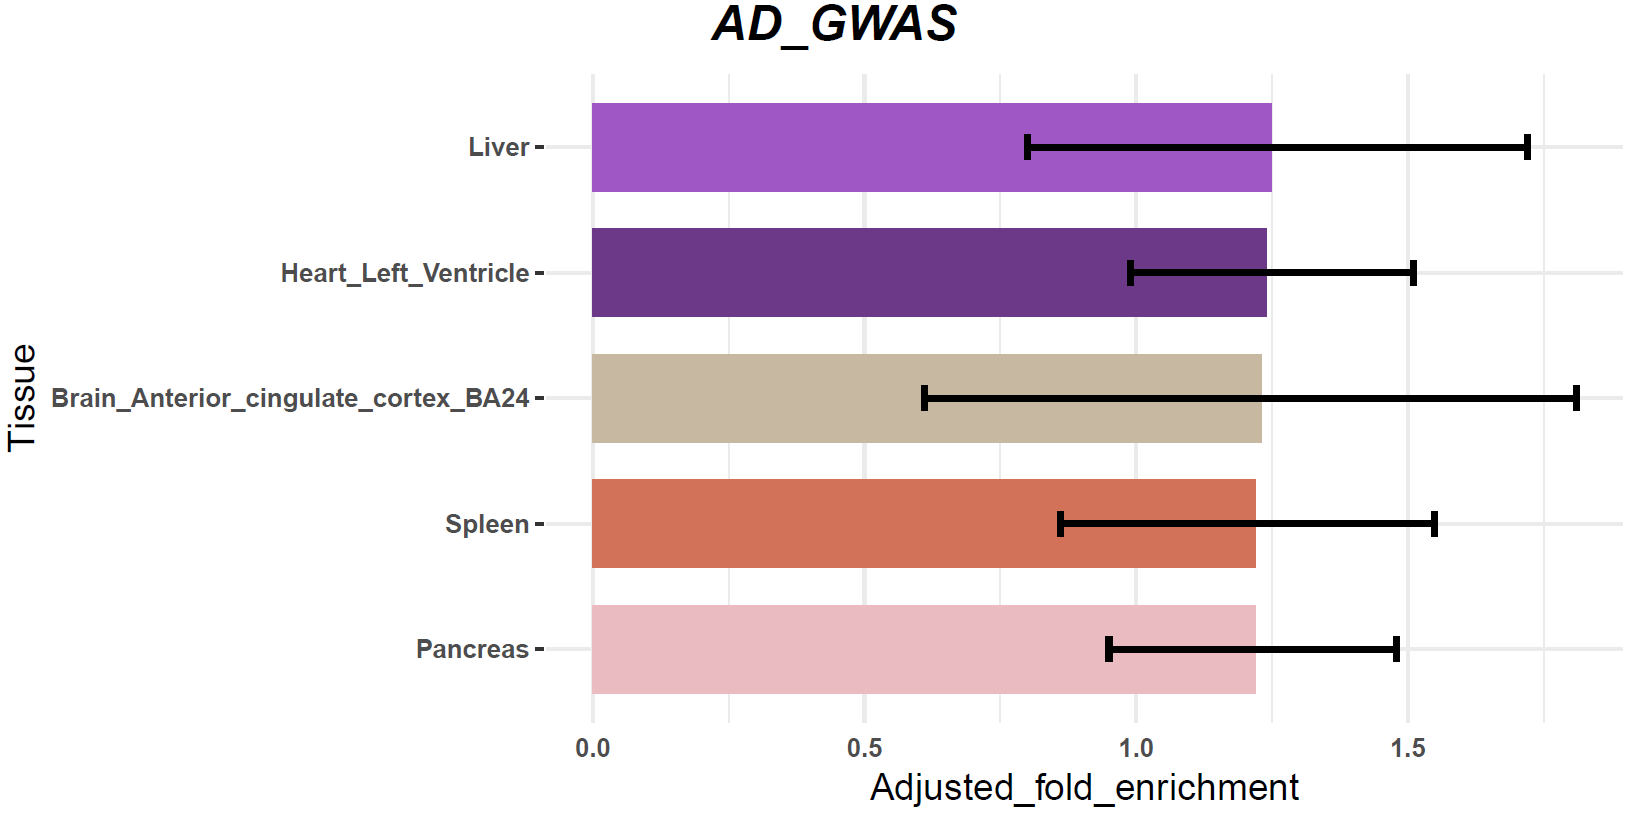
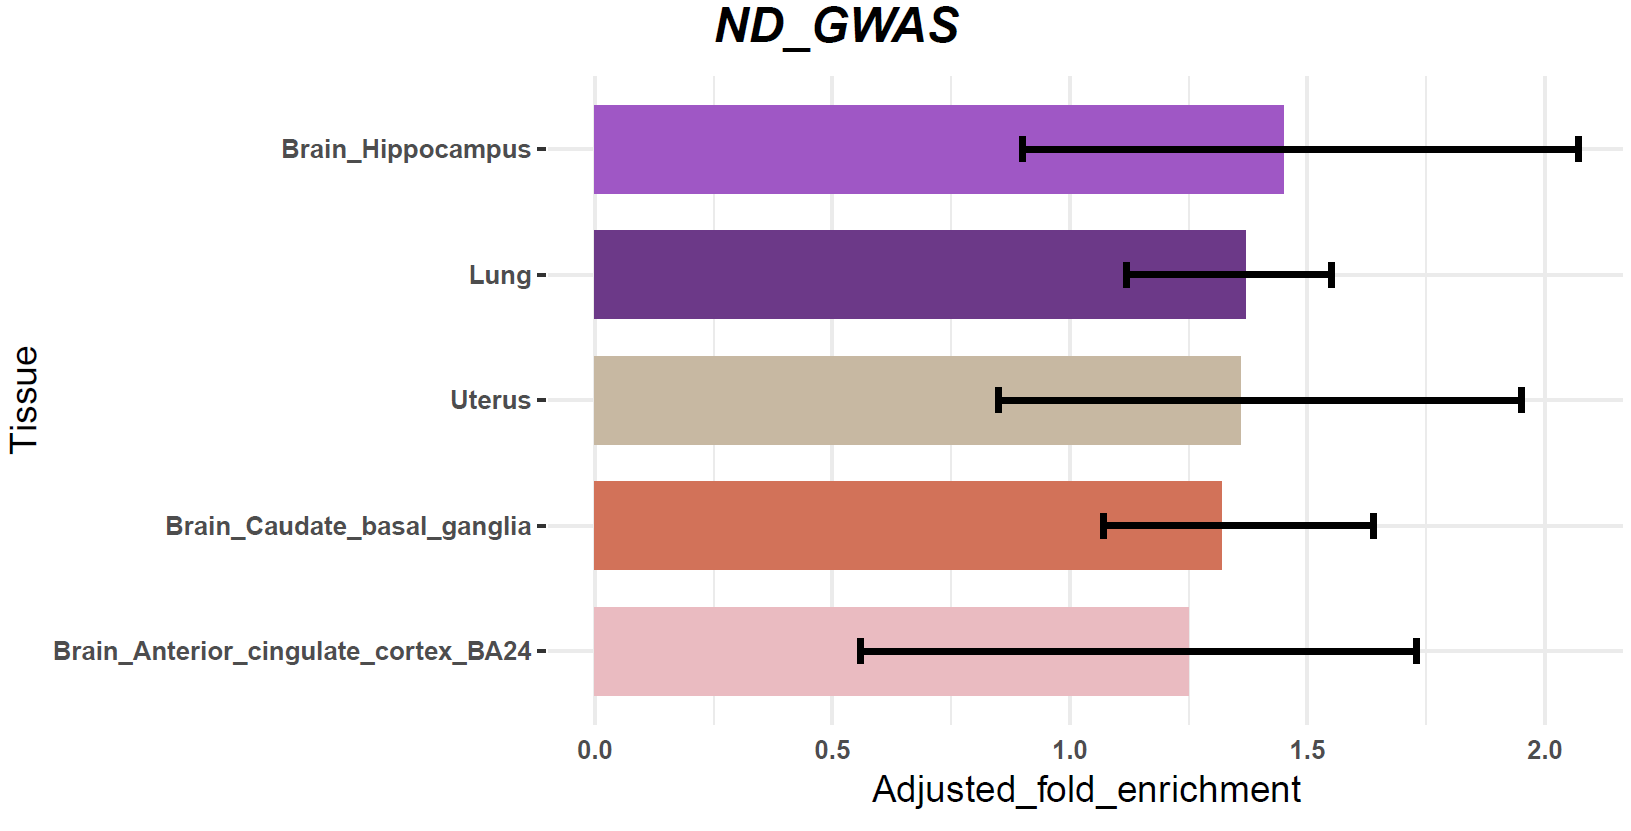 Footnote:
By using the collected two GWAS datasets about AD and ND, we conducted the enrichment analysis of tissue specific eQTL accoding to the most recent published methods .