Documents [PDF]
1. Collection and process of raw data
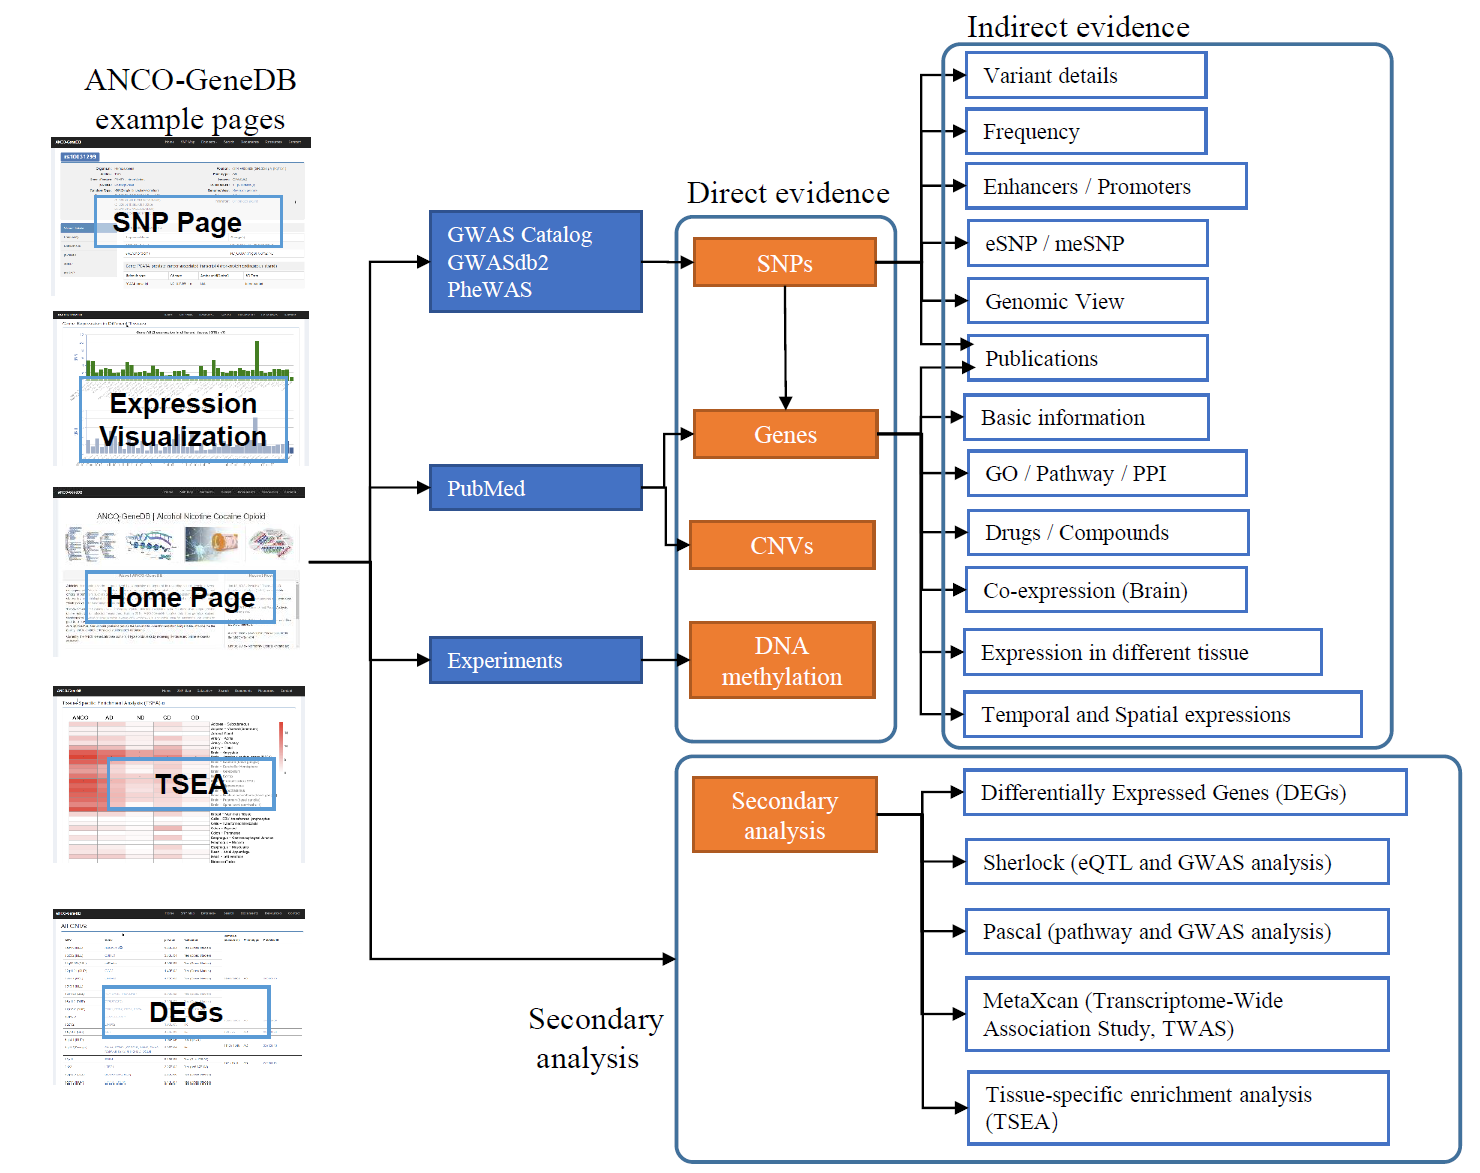
We aimed to build an addiction-associated gene database for four types of substance dependence, Alcohol Dependence (AD), Nicotine Dependence (ND), Cocaine Dependence (CD), and Opioid Dependence (OD). We arrange our collected data as datasets, including data records retrieved from online resources (SNPs, Genes, Microarray Expression, Drugs, and CNVs), data from experiments (DNA Methylation (meDNA)) and data from secondary analyses results (Secondary Analyses). Each dataset can be accessed from the menu tab "Datasets".
SNPs
SNP data were collected from GWAS Catalog (p-value < 1e-5), GWASdb2 (p-value < 1e-3) and PheWAS (p-value < 1e-3) databases in February 2018.
Genes
Genes were gathered from two approaches: genes harboring or located nearby addiction-associated SNPs and genes retrieved from literature. To map SNPs to genes, we followed the dbSNP annotation. For genes that have been previously studied in addiction, we used the NCBI E-utilities function to query the PubMed for each protein-coding gene. If there is any literature in the result, we kept the PubMed IDs and recorded this gene as an ANCO-dependence related gene.
Drugs
Drugs and their target genes were collected from DrugBank and The Comparative Toxicogenomics Database (CTD). The drug data were also used as annotation data for the gene.
Copy Number Variants (CNVs)
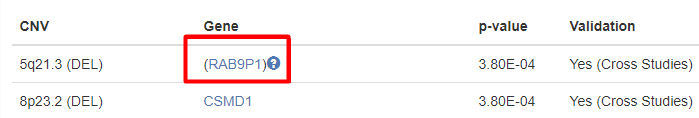
We searched PubMed by using the query string: ("Copy Number Variant" OR "CNV") AND "[ANCO Dependence Terms]". We manually read the query results and extracted CNVs from these publications. (In the CNVs Dataset table, gene in brackets means this gene has no overlap with the CNV region, it is the nearest gene from that CNV region.)
DNA Methylation
DNA Methylation data were collected from Dr. Huiping Zhang's Lab, it is the prefrontal cortex DNA methylation results from alcohol dependence study, including 1,812 CpGs identified in males and 154 CpGs identified in females. The DNA Methylation data were also used for gene annotation.
Differentially Expressed Genes
We searched the GEO database and collected related datasets to get Differentially Expressed Genes (DEGs). GEO2R was used to define the differentially expressed genes.
Secondary Analysis
-
Two Genome Wide Association Study (GWAS) datasets about AD and ND were collected. Sherlock (eQTL and GWAS analysis), Psacal (Pathway and GWAS analysis) and MetaXcan (Transcriptome-Wide Association Study, or TWAS) Analysis had been done on these two datasets.
-
Summary statistics data of a Genome-Wide Association Study of Alcohol Dependence in an European-American Population is from Study of Addiction: Genetics and Environment (SAGE) (phs000092) [1]
(https://www.ncbi.nlm.nih.gov/projects/SNP/gViewer/gView.cgi?aid=2906) -
Summary statistics data of a Genome-Wide Association Study meta-analysis of Nicotine Dependence (cigs per day) in an European Ancestry population is from Tobacco and Genetics Consortium (TAG) [2]
(https://www.med.unc.edu/pgc/results-and-downloads)
-
Summary statistics data of a Genome-Wide Association Study of Alcohol Dependence in an European-American Population is from Study of Addiction: Genetics and Environment (SAGE) (phs000092) [1]
- Tissue-Specific Enrichment Analysis (TSEA):
To check the ANCO genes distribution enriched in different tissues based on GTEx data, we have done the Tissue-Specific Enrichment Analysis (TSEA) using Fisher's Exact Test. ANCO dependence-associated genes were found to be specifically enriched in brain regions.
- Enrichment of tissue specific eQTL (eQTLenrich):
Rationale is to build a tissue-trait association through the enrichment level of significant GWAS SNP (eQTL) in each tissue. eQTLEnrich is designed to test the distribution of GWAS p values for each set of eQTLs (FDR < 0.05) in trait associations compared to an empirical null distribution sampled from non-significant variant- gene expression associations (FDR> 0.05). For each tissue the fraction of eQTLs (FDR < 0.05) with GWAS variant p < 0.05 compared to expectation 5%, assuming GWAS p-value in uniform distribution will be the fold-enrichment for each tissue. An adjusted fold-enrichment is computed by dividing the fold-enrichment for each tissue-trait pair by the fold-enrichment of all null-eVariants (GWAS P value < 0.05) for the tissue-trait pair. Then, repeat the fold-enrichment for 100-100000 times in non-significant variant set (GWAS P > 0.05, matching the size eQTL set and similar genomic feature like distance of eQTL to TSS of the target gene, MAF, and number of proxy variants (at r2 >= 0.5), representing local linkage disequilibrium). The P value is the calculated by the count (fold-enrichment of eQTL set >= fold-enrichment of repeat set) divided by the repeat times.
Thus, eQTLEnrich could be used to evaluate the impact (enrichment) of a set of moderate significant GWAS in tissue-trait pairs.By using the collected two GWAS datasets about AD and ND mentioned above, we conducted the enrichment analysis of tissue specific eQTL accoding to the most recent published methods [3].
Reference:- Bierut, Laura J., et al. "A genome-wide association study of alcohol dependence." Proceedings of the National Academy of Sciences 107, 5082-5087 (2010).
- Furberg, Helena, et al. "Genome-wide meta-analyses identify multiple loci associated with smoking behavior." Nature genetics 42, 441–447 (2010).
- Gamazon, Eric R., et al. "Using an atlas of gene regulation across 44 human tissues to inform complex disease-and trait-associated variation." Nature genetics 50, 956–967 (2018).
2. Data Statistics
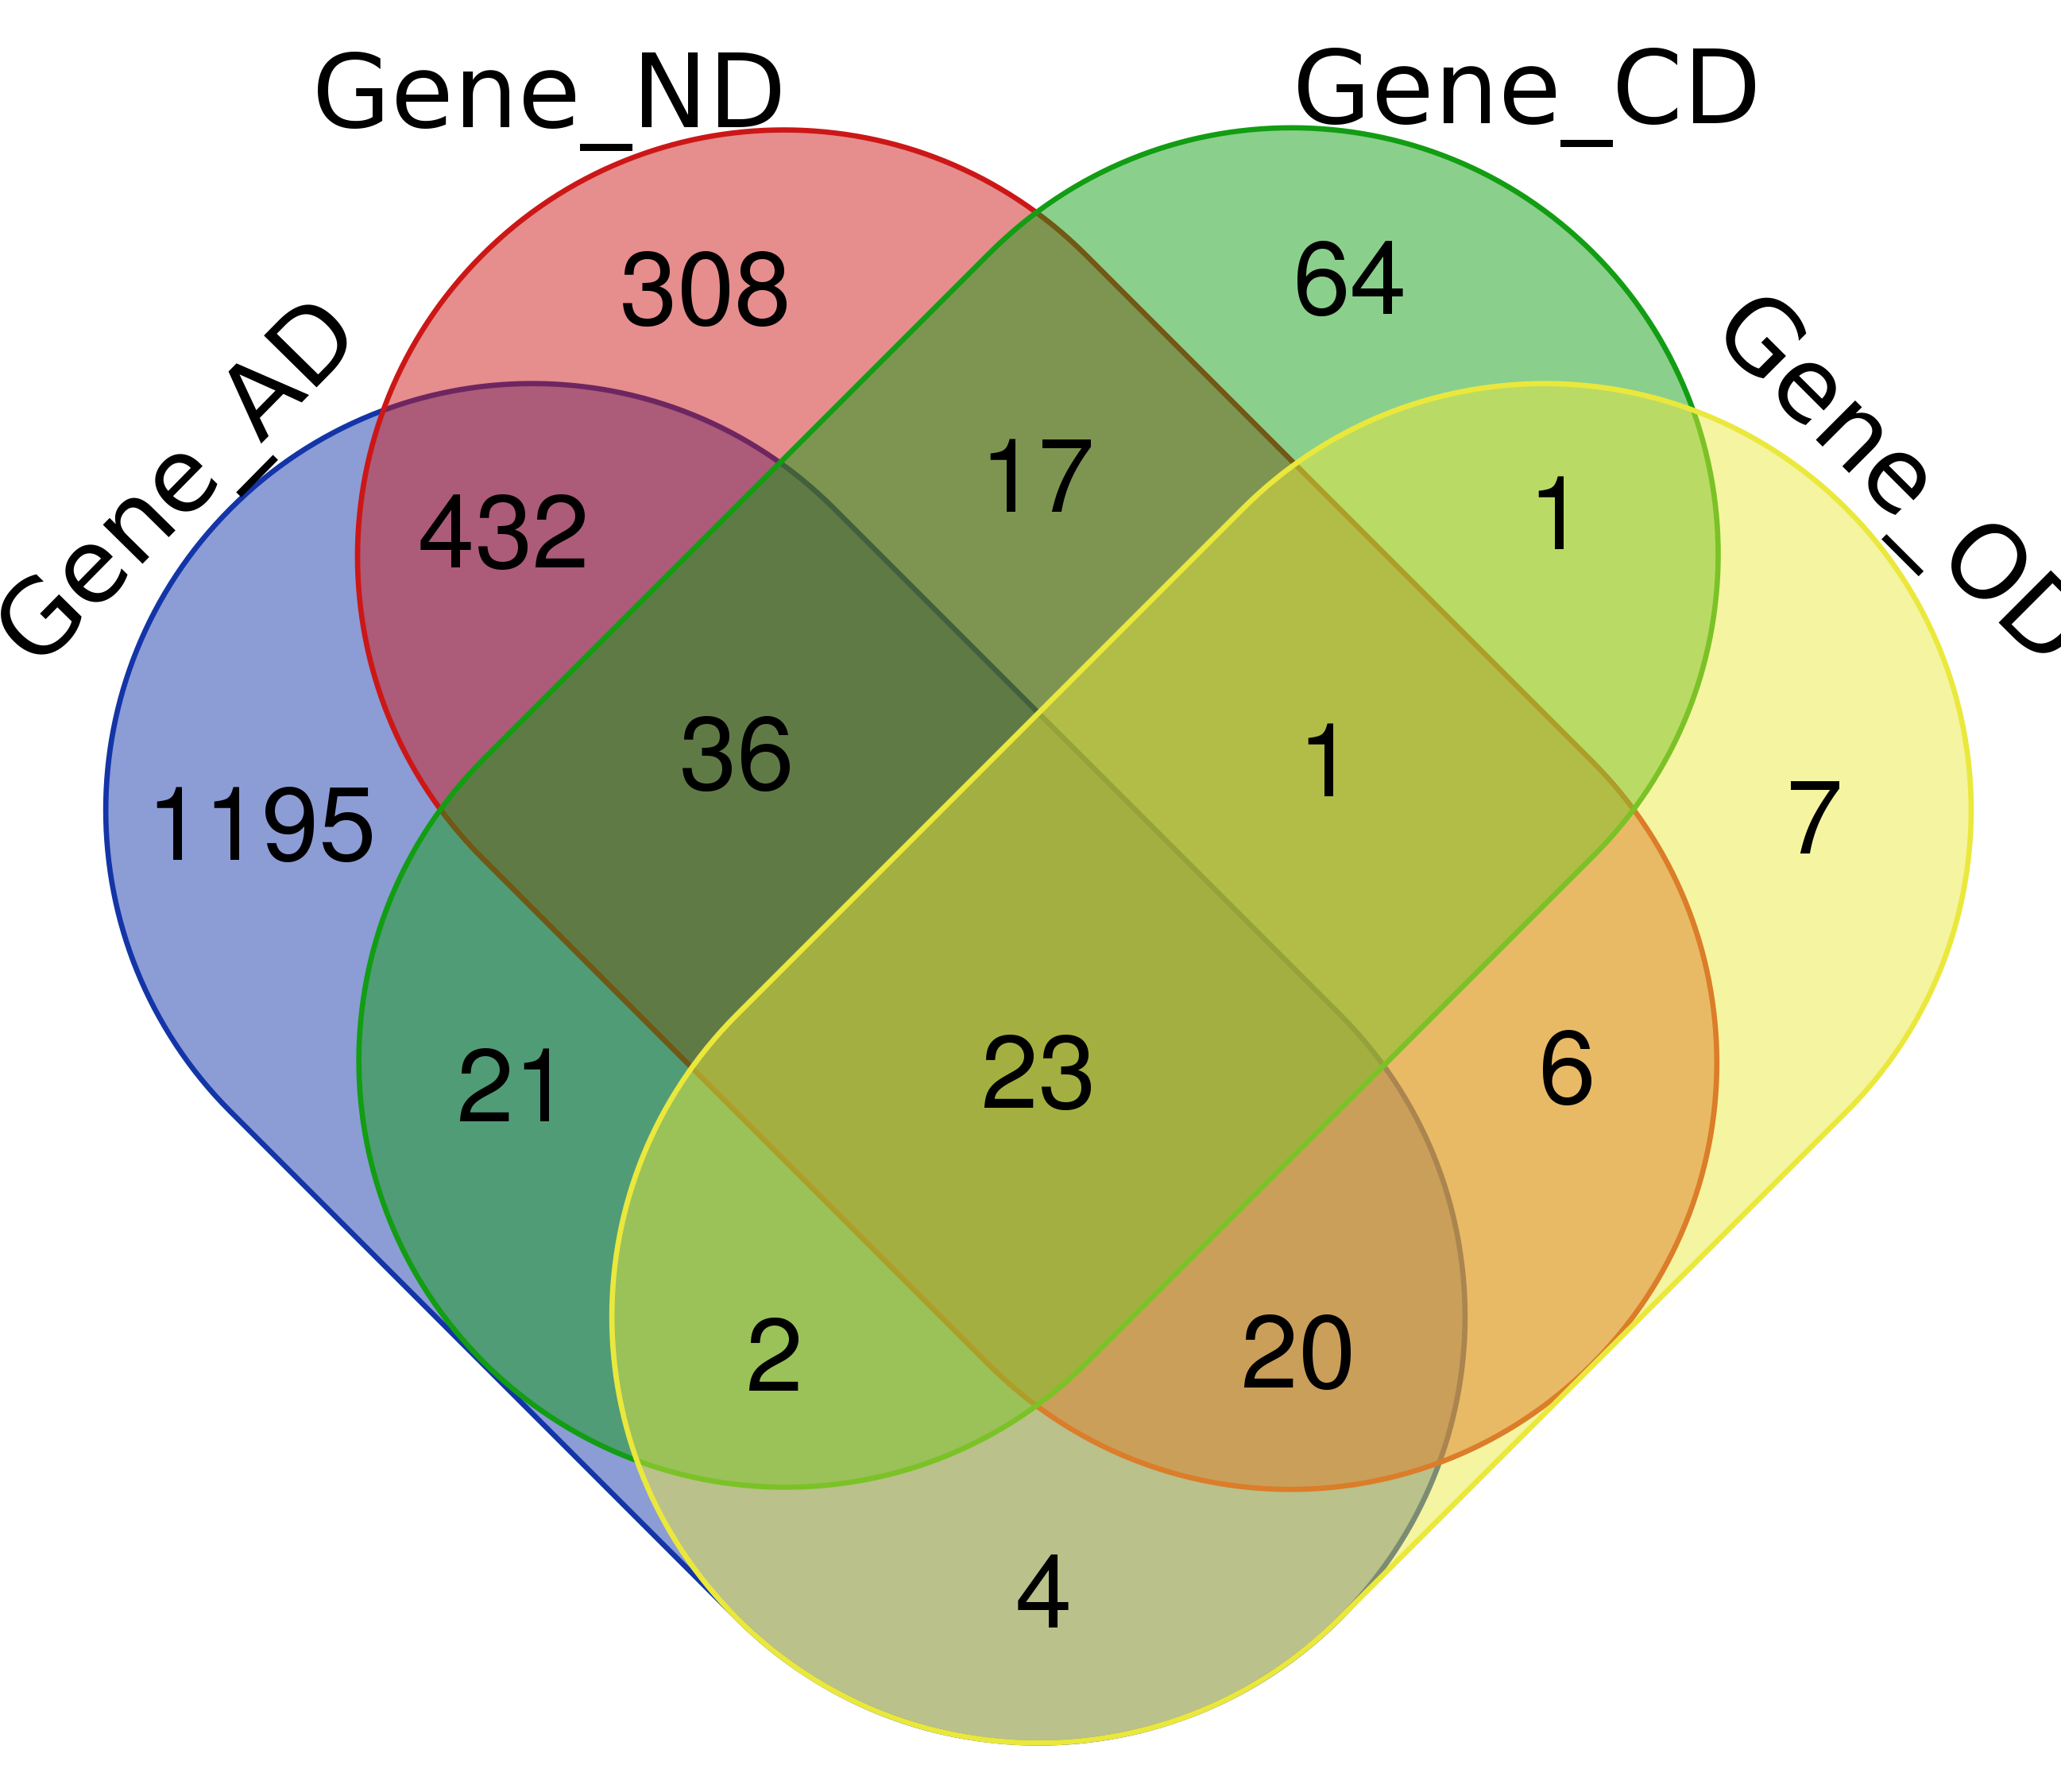
Venn Diagram

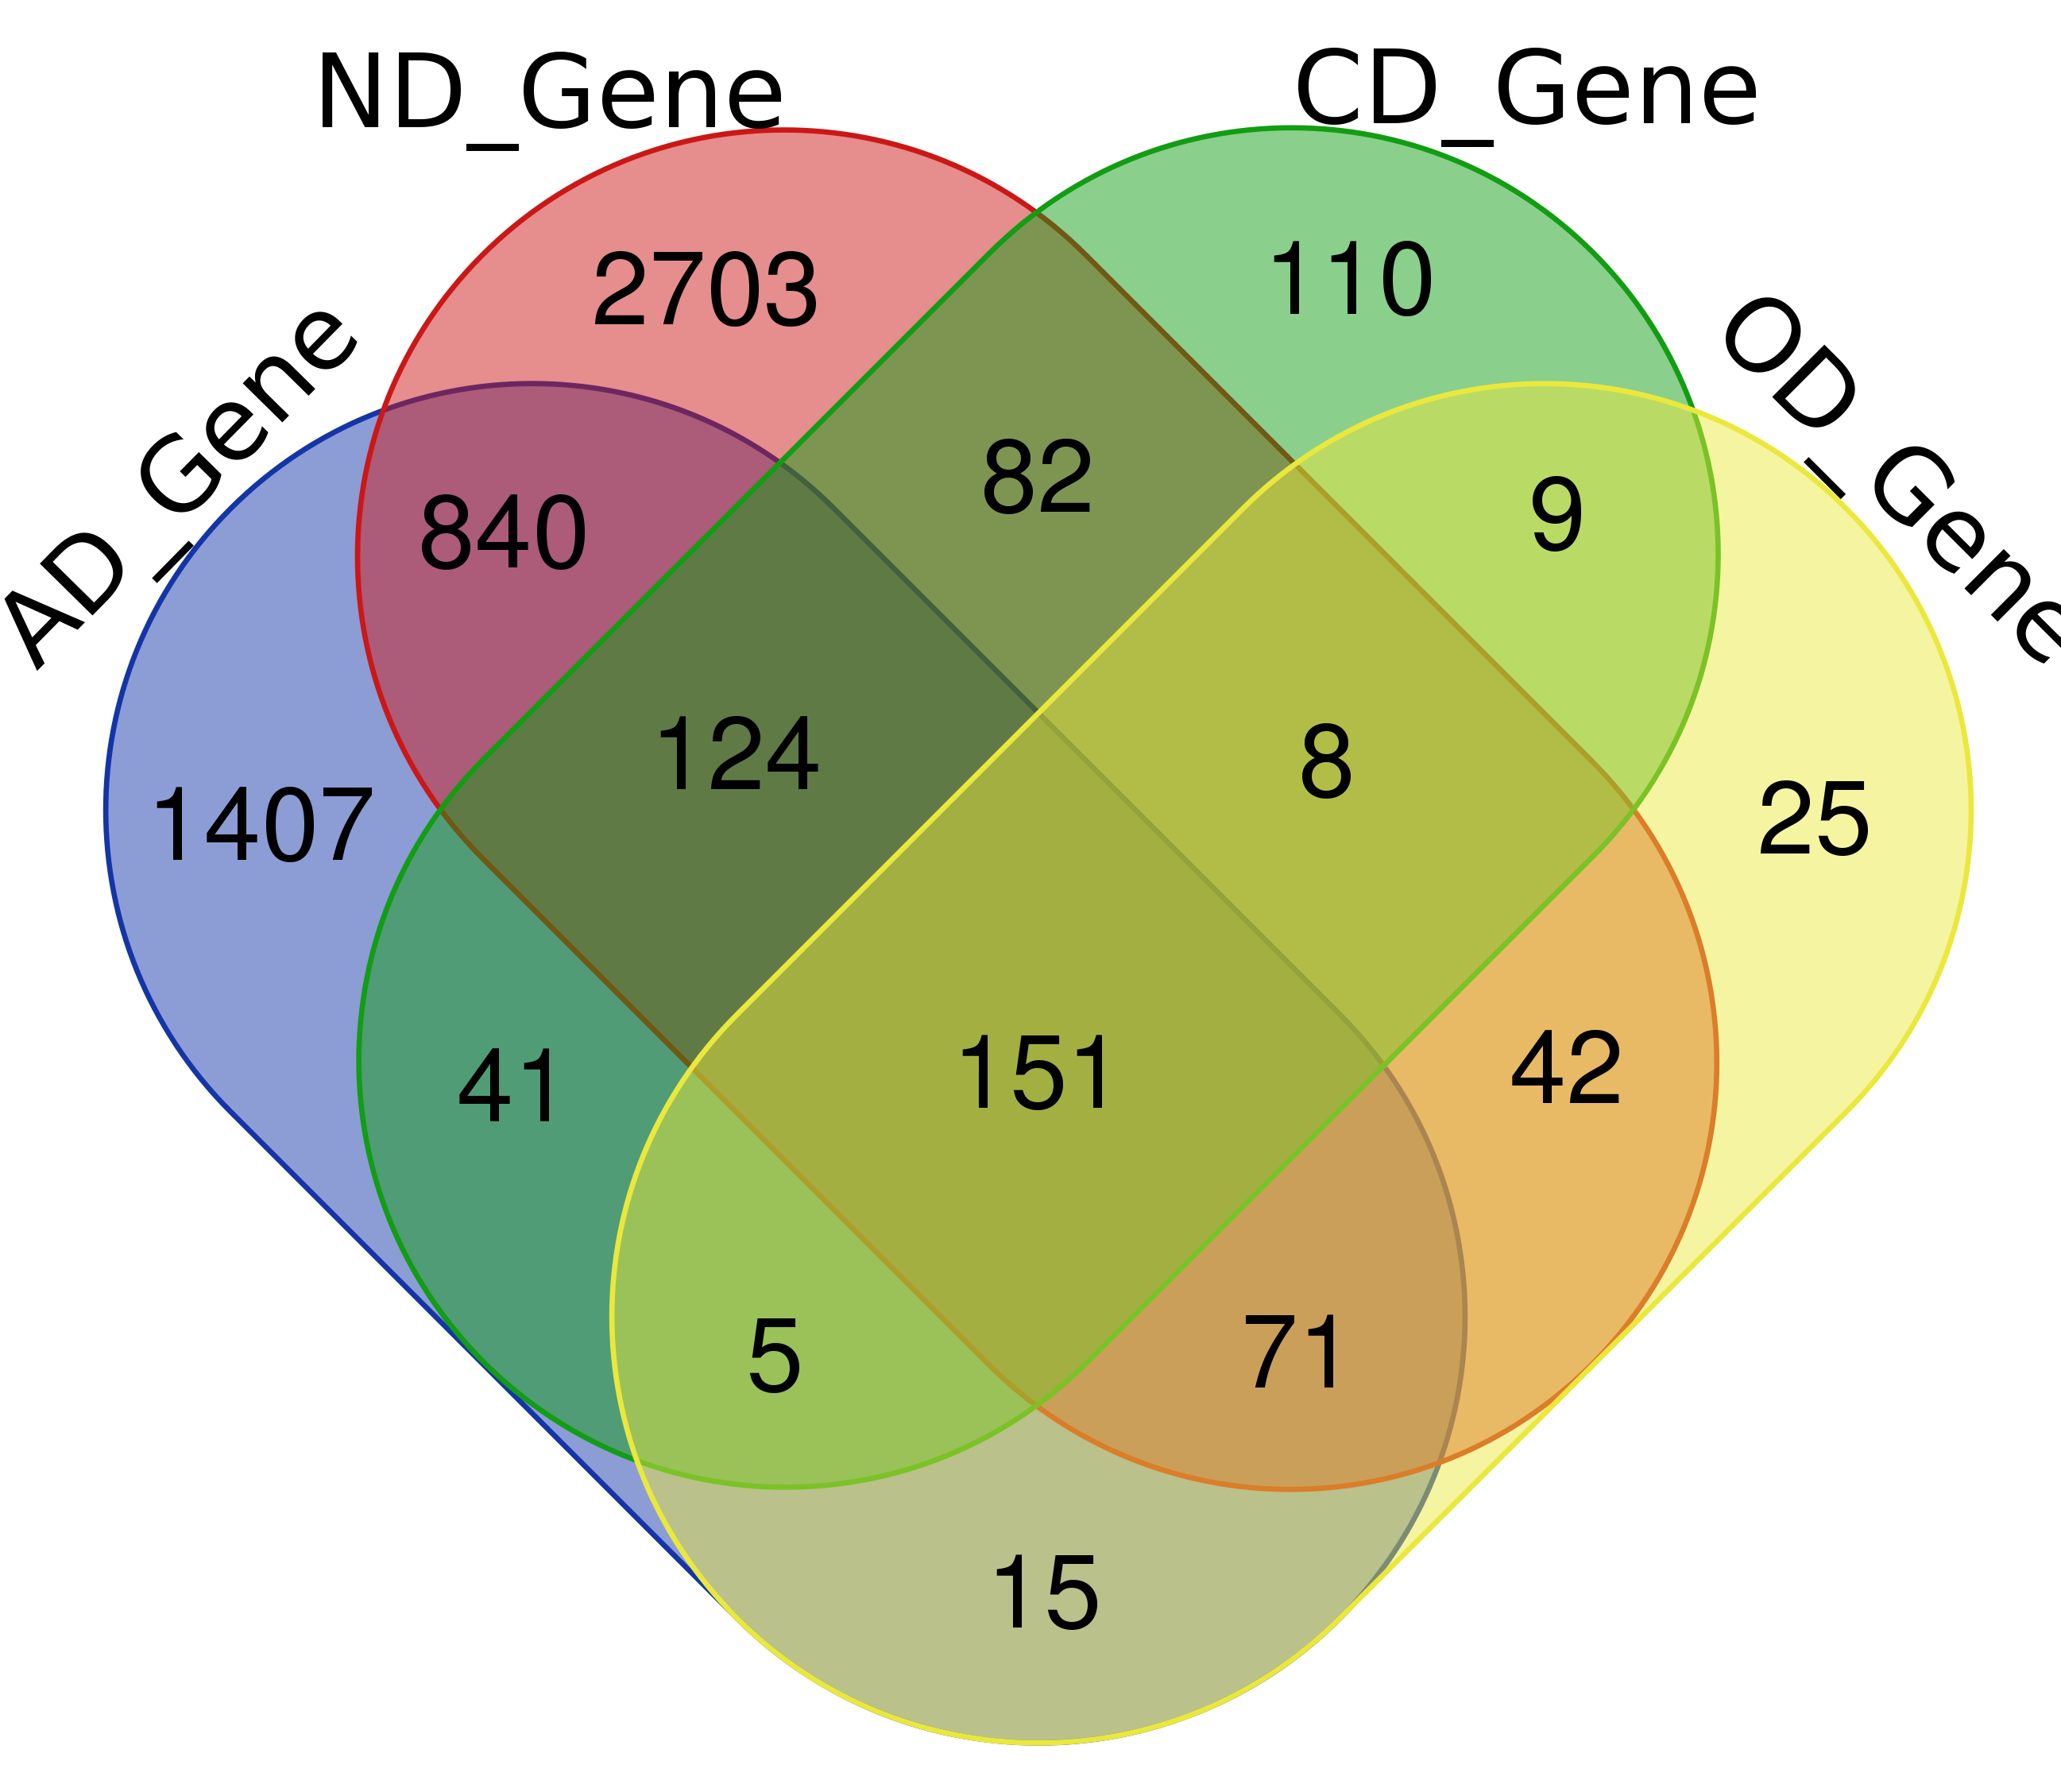
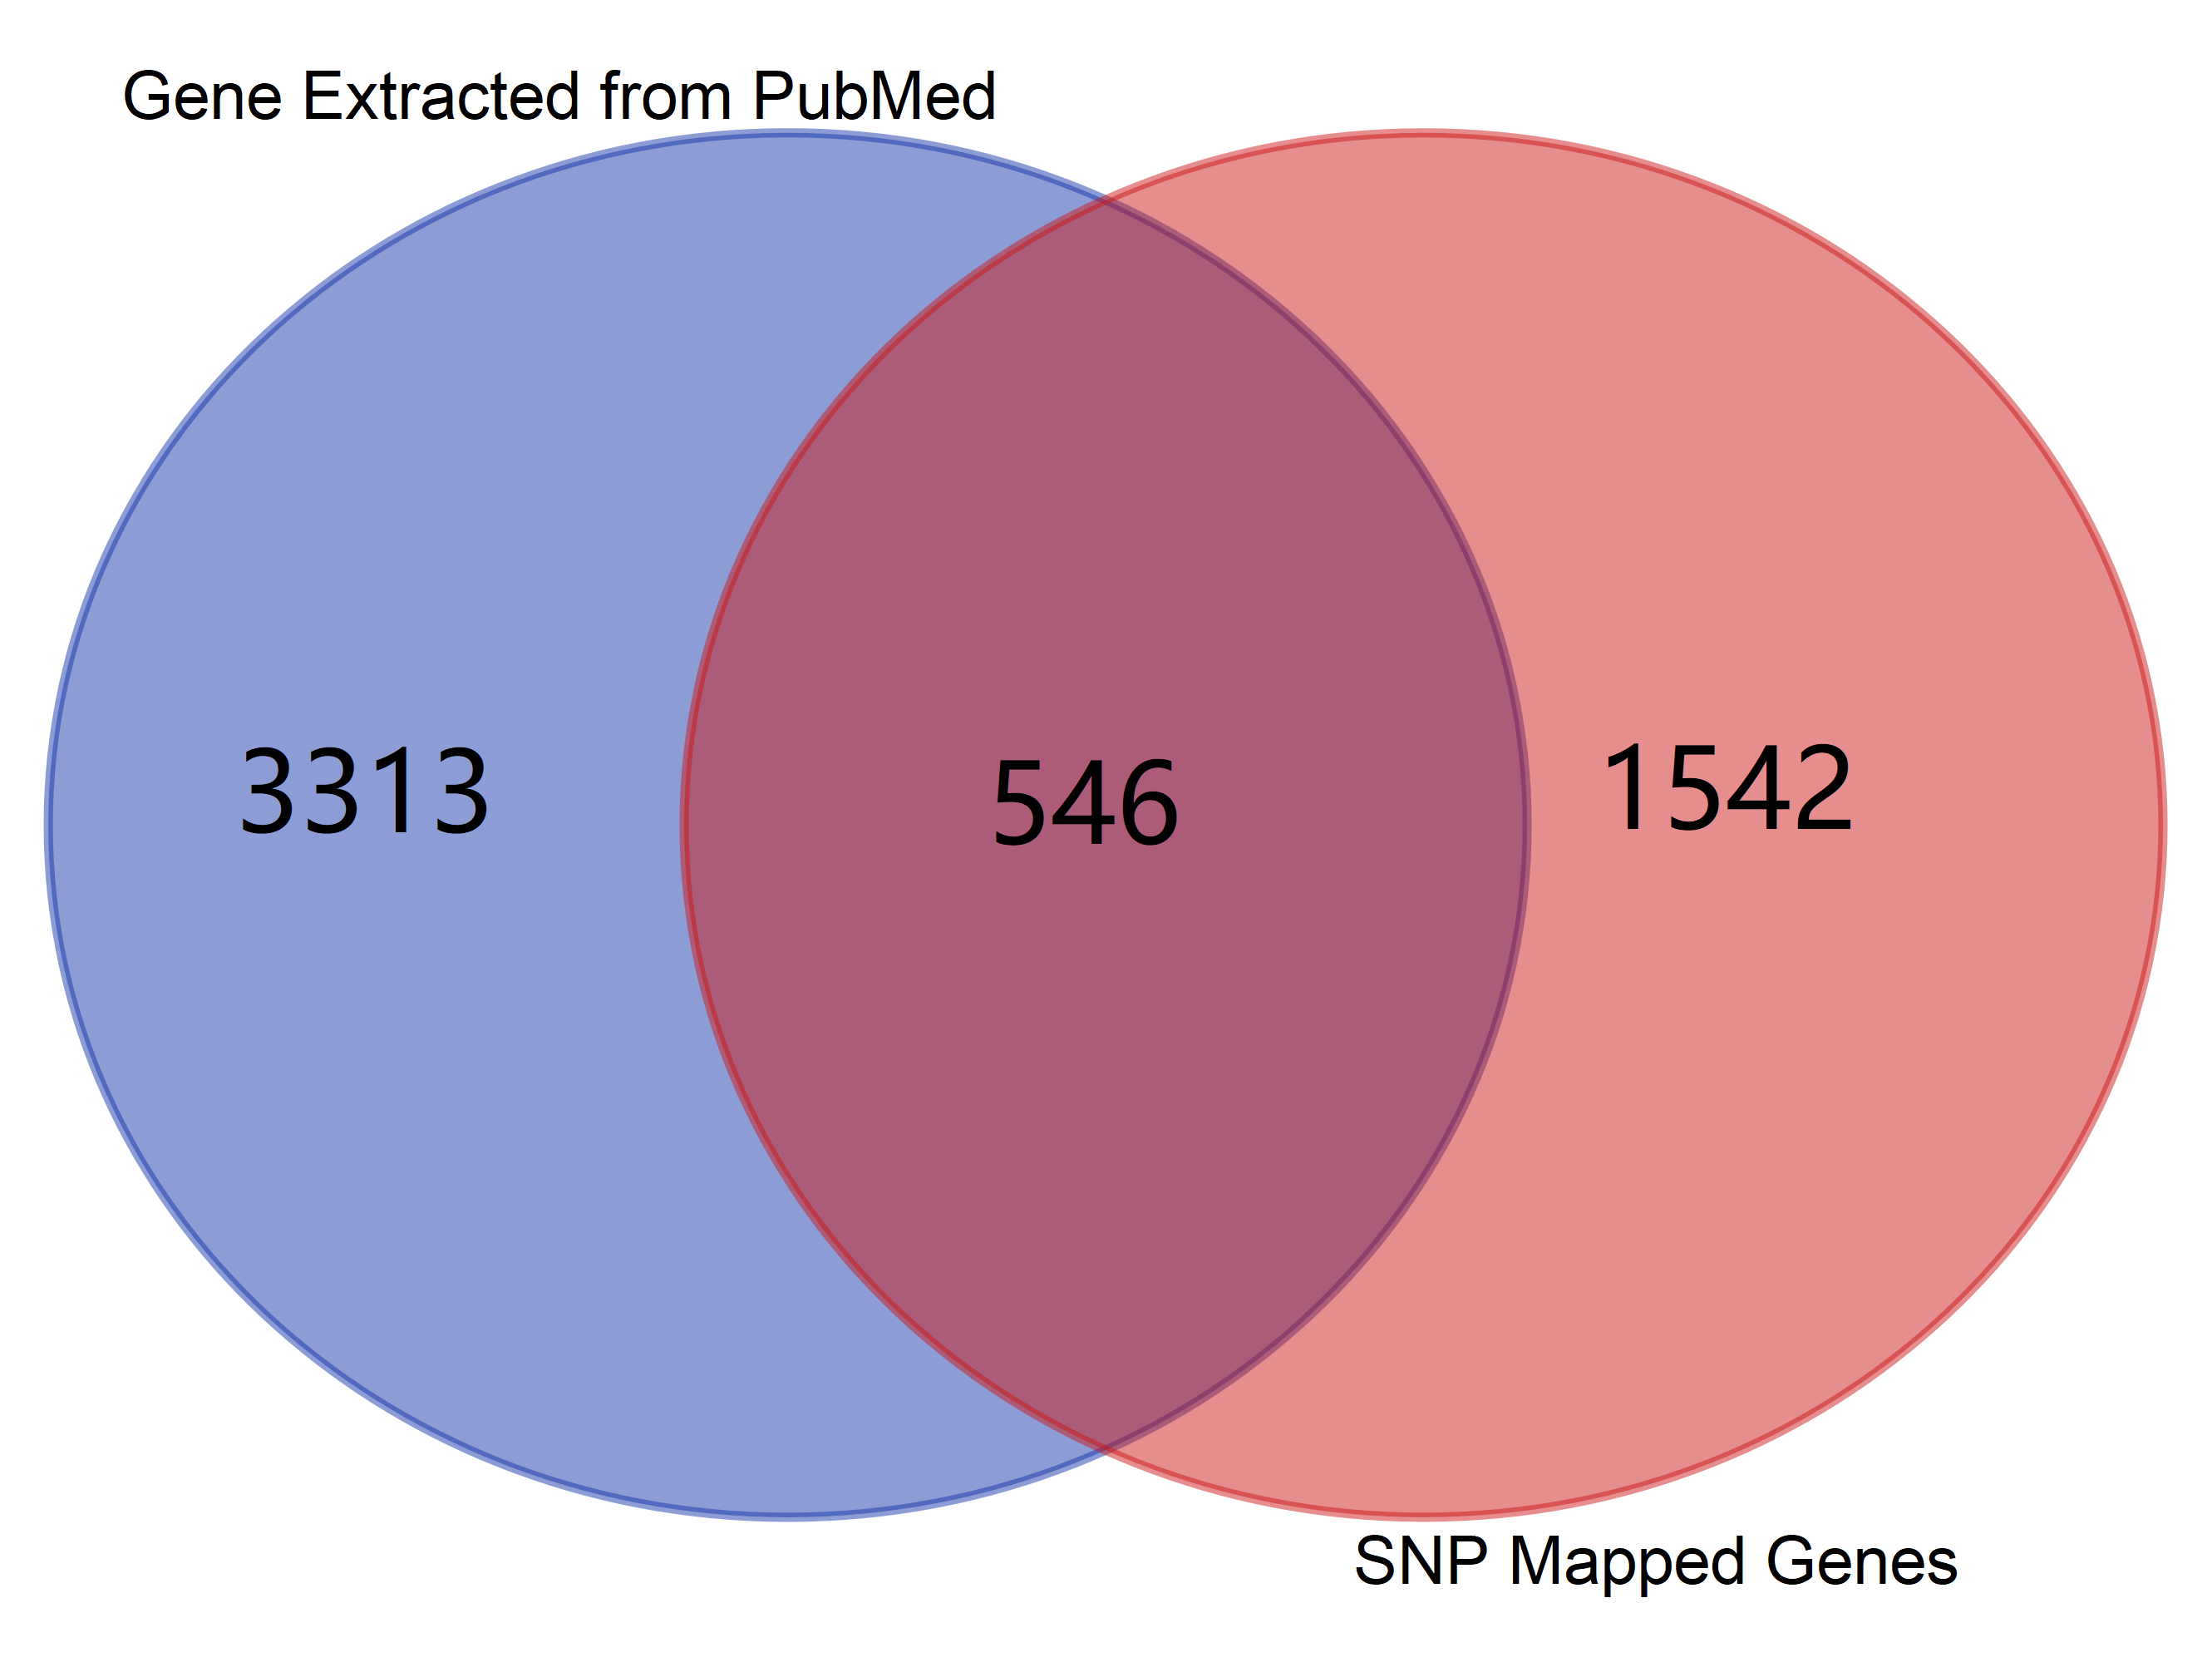 Note: Click The Number to Check Genes
Data Summary
| Datasets | AD | ND | CD | OD |
|---|---|---|---|---|
| Genes | 2,654 (1,733)* | 4,021 (843) | 530 (165) | 326 (64) |
| SNPs | 4,985 | 1,080 | 250 | 40 |
| #GEO | 4 | 3 | 2 | 0 |
| Drugs (DrugBank) | 3,371 | 4,675 | 2,243 | 1,969 |
| CNVs | 17 | 1 | 1 | 10 |
| Enhancers | 510,567 (Within 5 kbps) | |||
| Promoters | 71,325 (Within 5 kbps) | |||
| eSNPs | 804 (Brain tissues) | |||
| meSNPs | 396 (Brain tissues) | |||
3. SNP Map
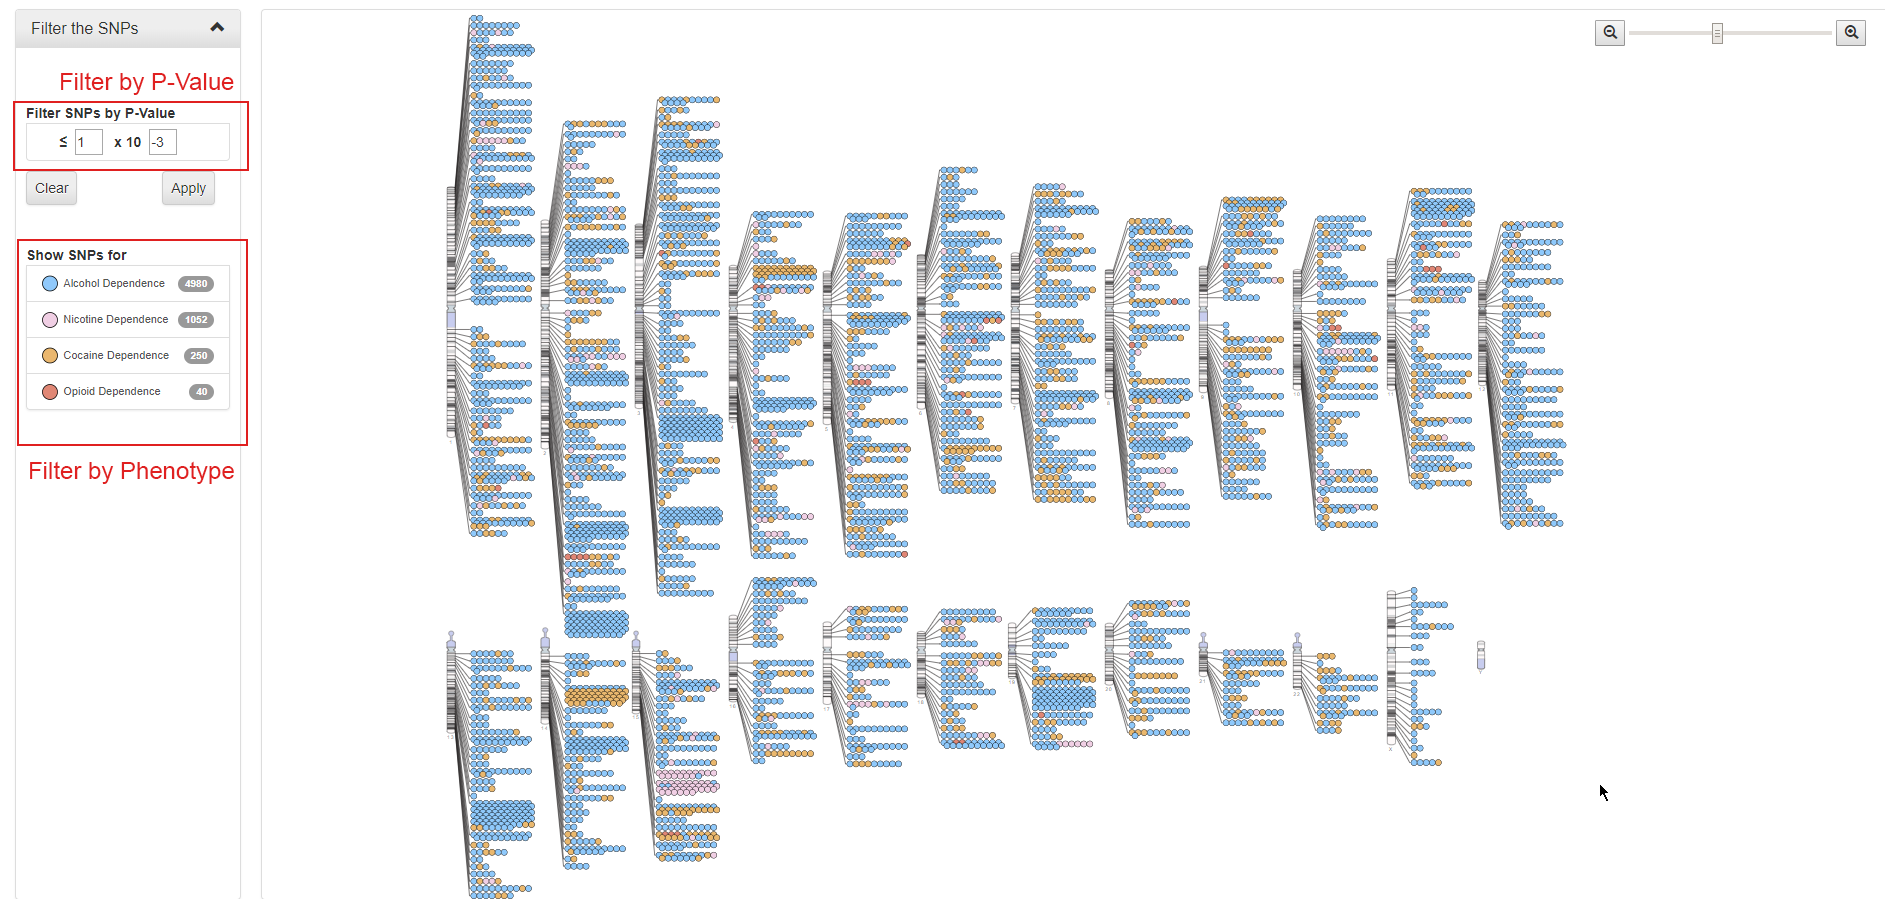
SNP Map
All the collected SNPs were mapped to its location on Chromosome. SNPs belong to different phenotype dataset were marked with different colors, each node represents an SNP, and each node on the map can be clicked and links to the detail page of the corresponding SNP. On the left side of the page, the filter functions are provided, SNPs can be filtered by P-Values and Phenotypes.
4. SNP page
This is a page for the annotations of each SNP. The SNP page starts with a summary table of the SNP basic information. Following the summary table, a group of tables show the related annotations, including Variant Details(Genomic Placements, Gene Variants), Frequencies in different populations, supportive publications, P-Values in different studies, eQTL (if the SNP is an eSNP in brain), meQTL (if the SNP is a meSNP in brain). A genomic view is available to look the around of the SNP. Enhancers (if there are any within 50kb of the SNP), and promoters (if any) are presented at last.
4.1 The basic information of the SNP.
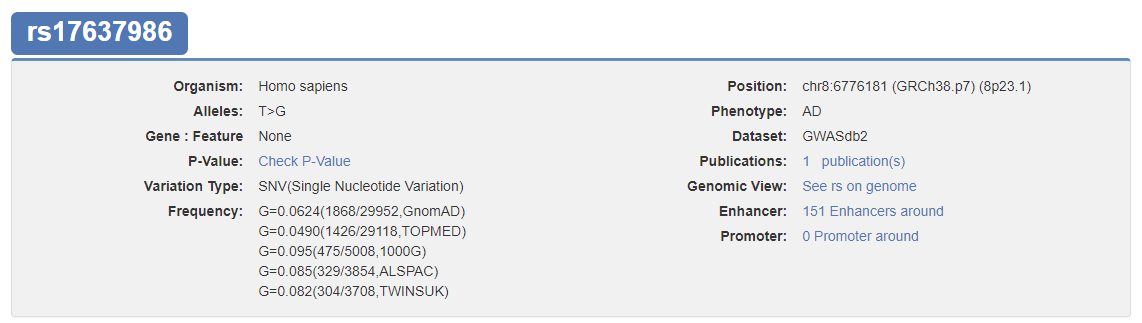
It shows the basic information of the SNP.
4.2 The basic information of the SNP.
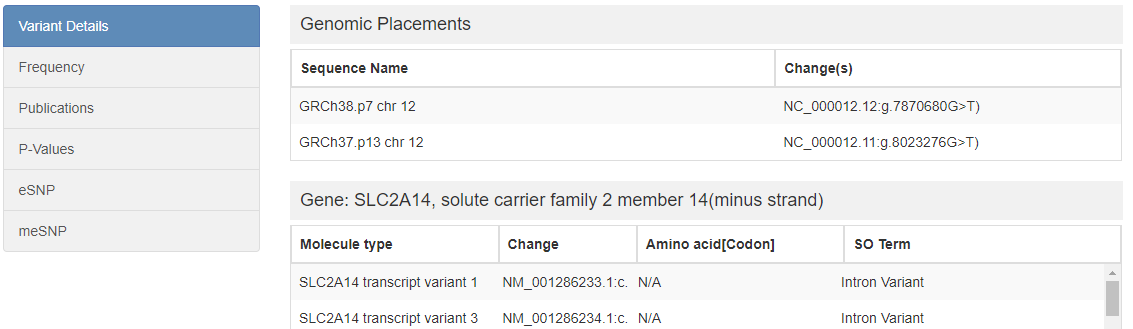
A group of tables was used to show more annotation information. the tabs on the left side can be clicked, and the table on the right side will be changed correspondingly.
4.3 Genomic View
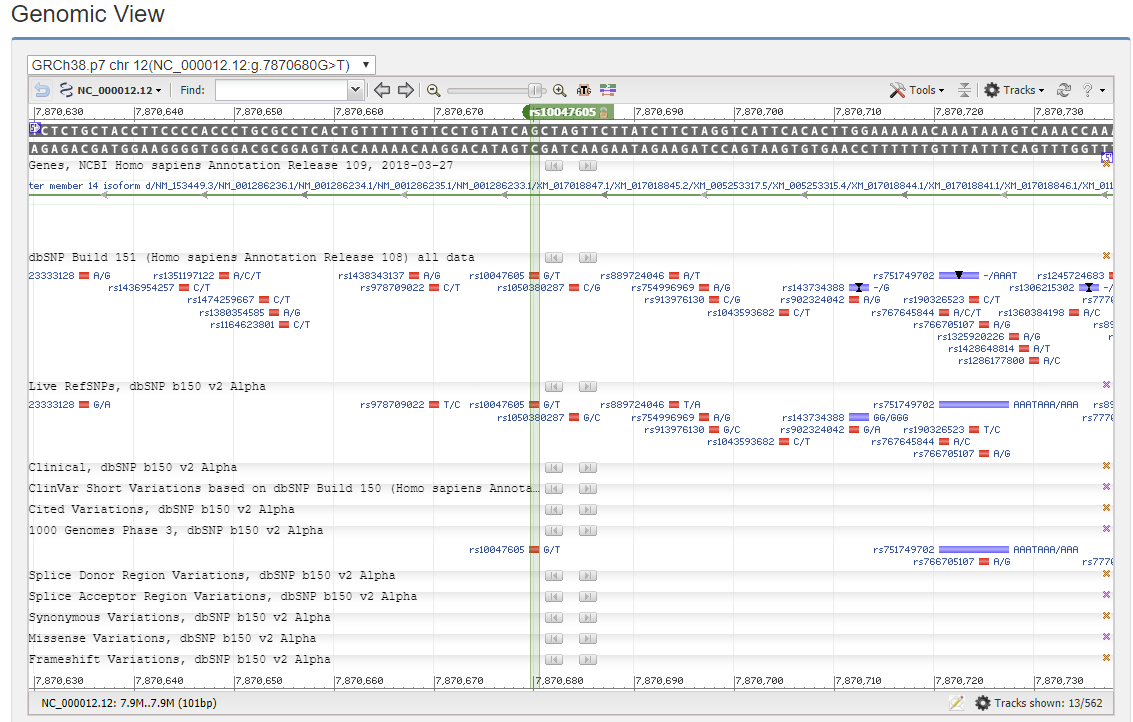
The Genomic View shows the position of the SNP and the nearby genomic information.
4.4Enhancers and Promoters.
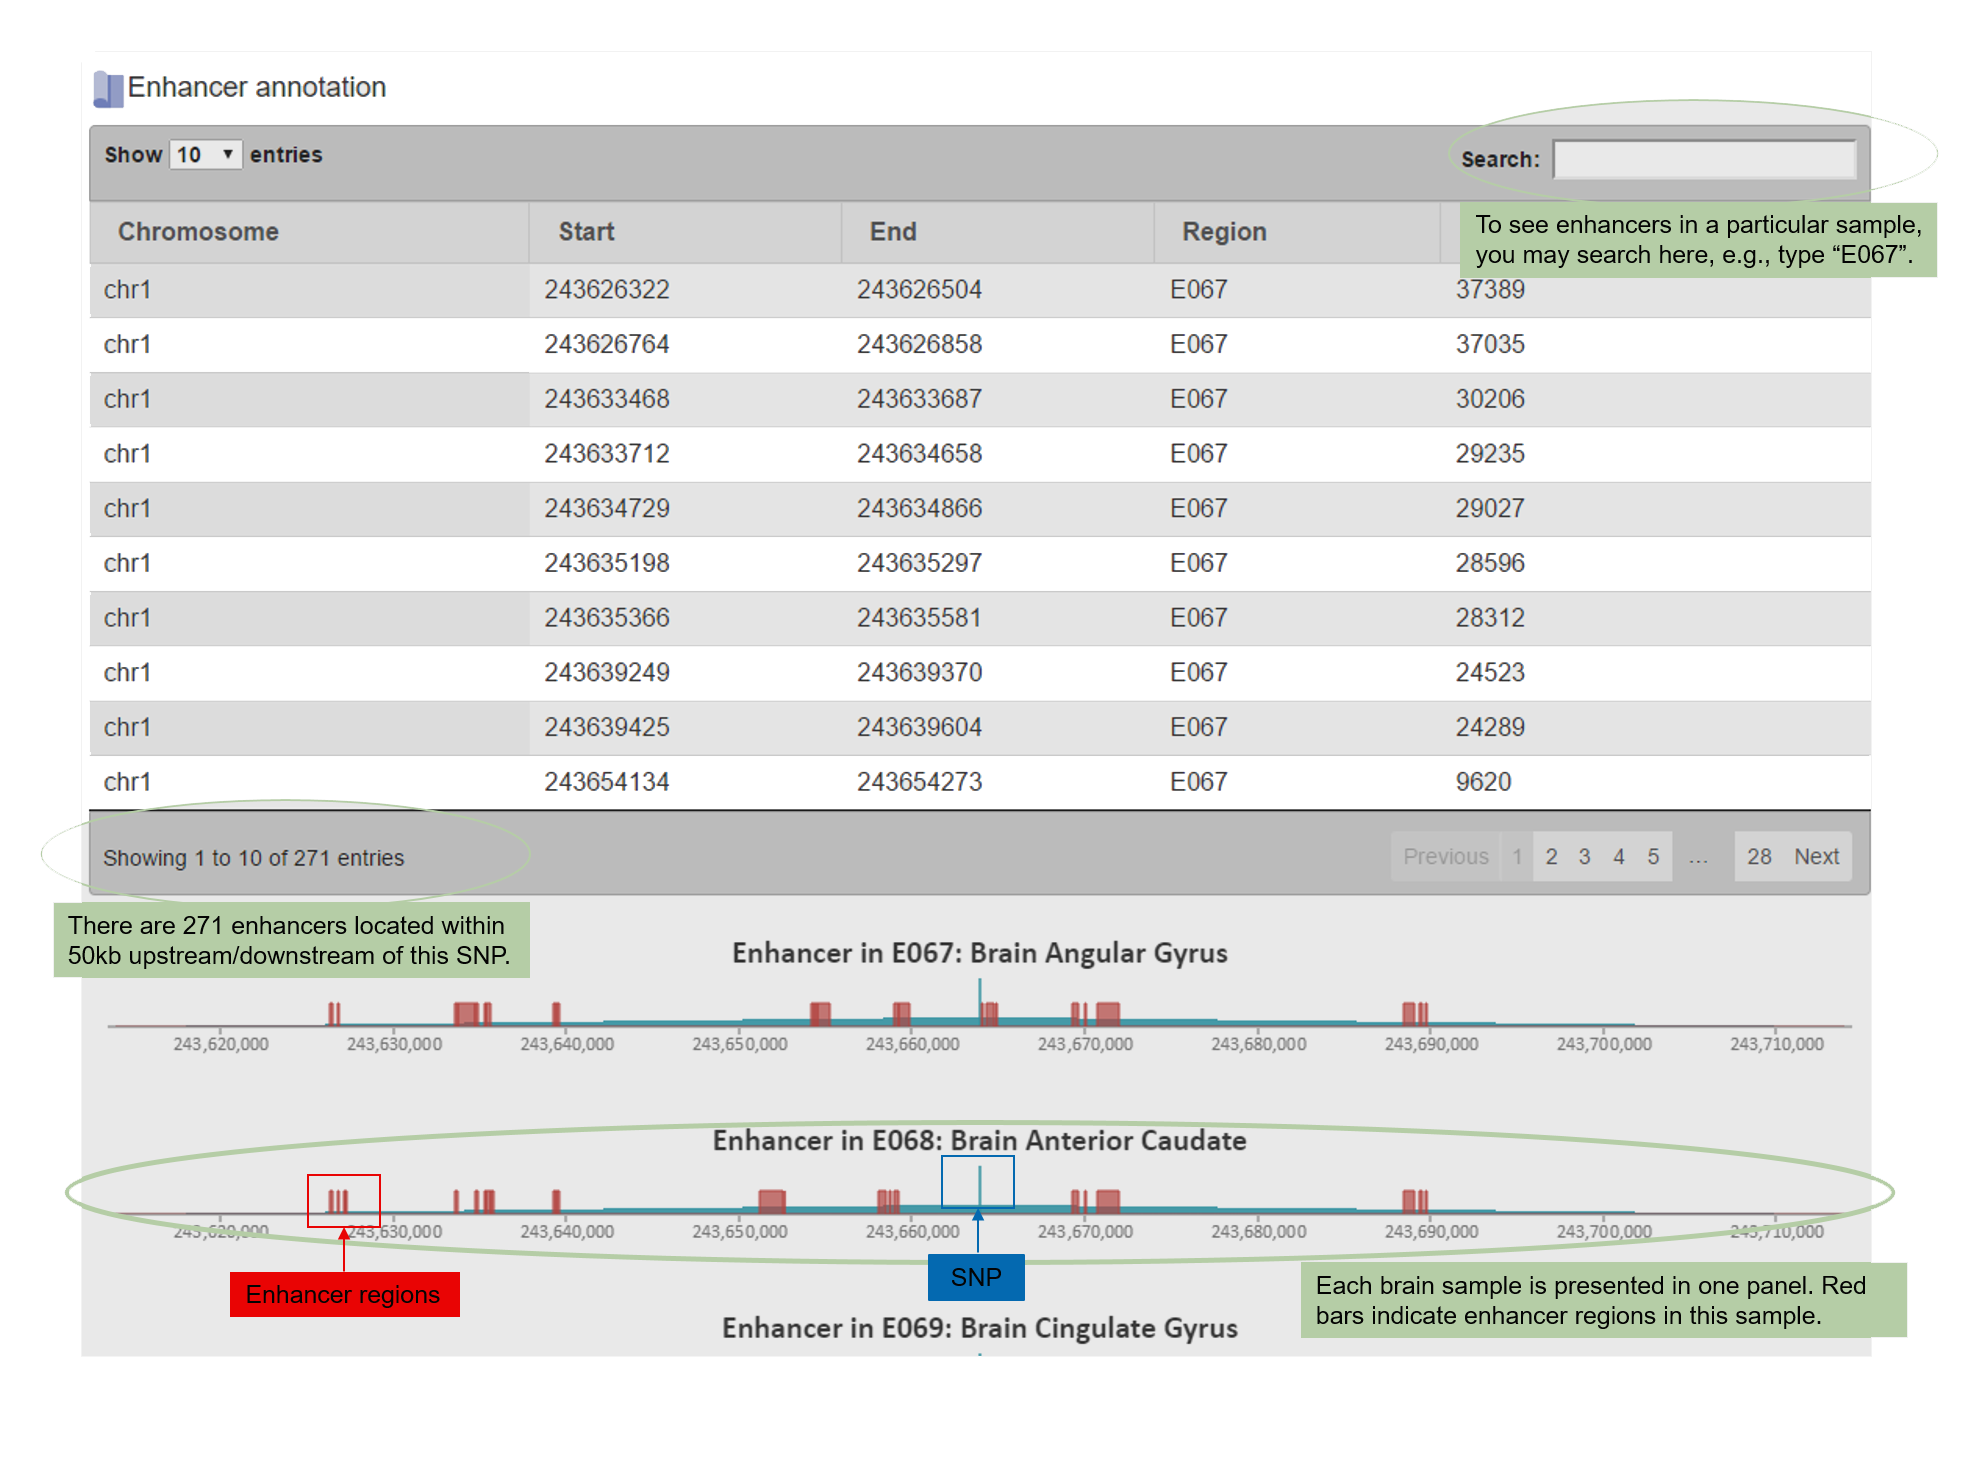
The enhancer and promoter information is listed as both tables and figures.
5. Gene Page
This page shows the annotation information for a gene. The GENE page is heavily loaded with many types of information. It typically takes a few seconds to load.
5.1 The basic information of a Gene.
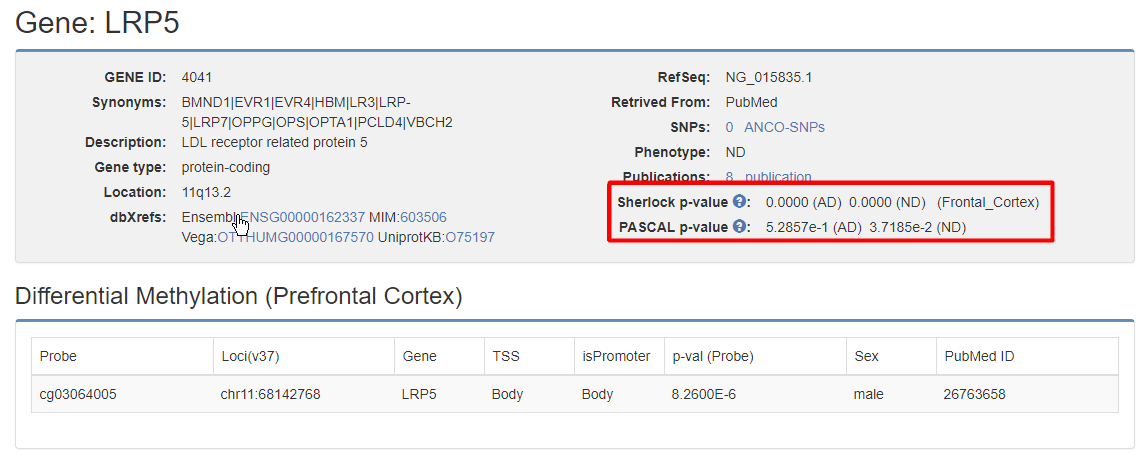
It shows the basic information of the Gene. Sherlock p-value and Logarithm Bayes Factor(LBF), and Pascal p-value are calculated for each gene. If this gene is associated with DNA Methylation in Brain-Prefrontal Cortex, a Differential Methylation table will be shown.
5.2 Gene expression in different tissues.
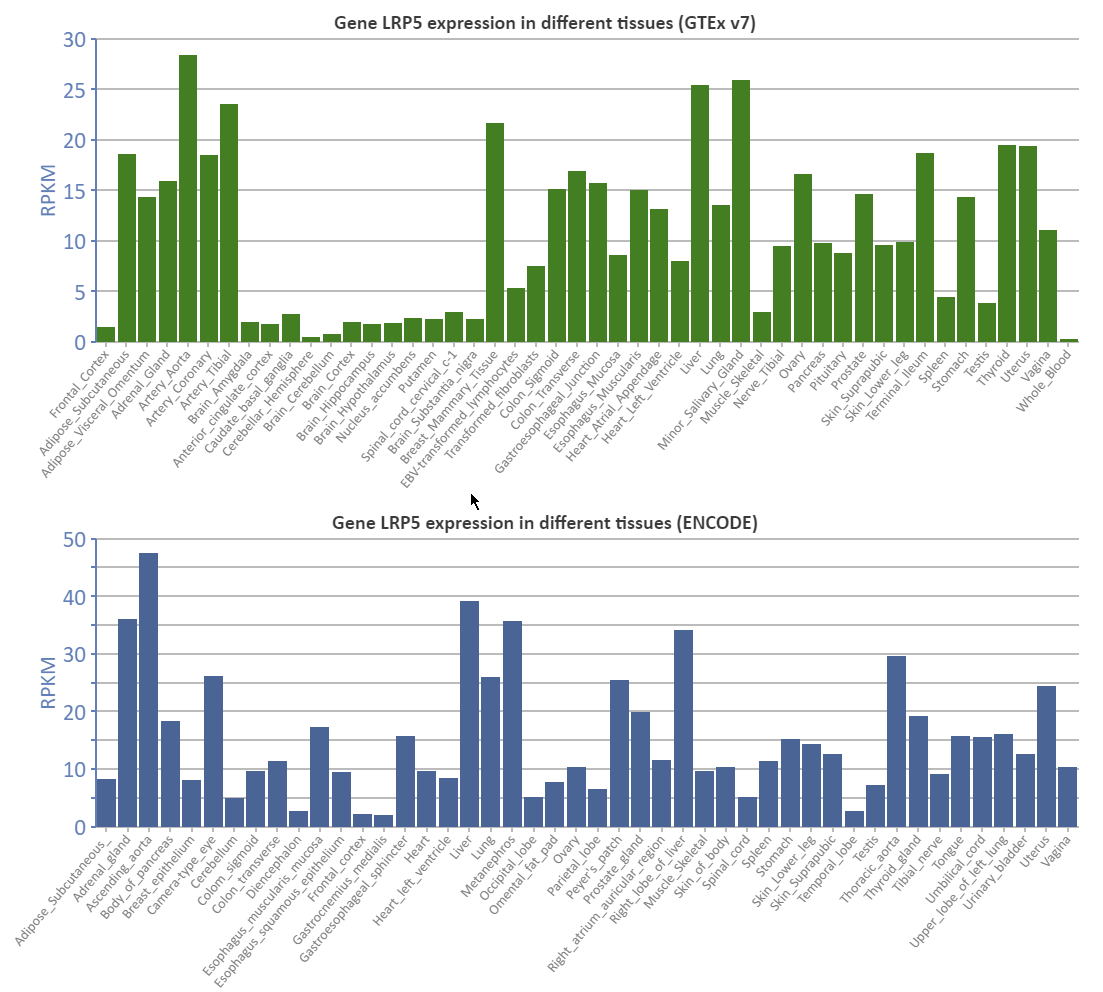
Gene expression data from GTEx v7 and ENCODE are shown as a Column Chart.
5.3 Temporal and Spatial Expressions
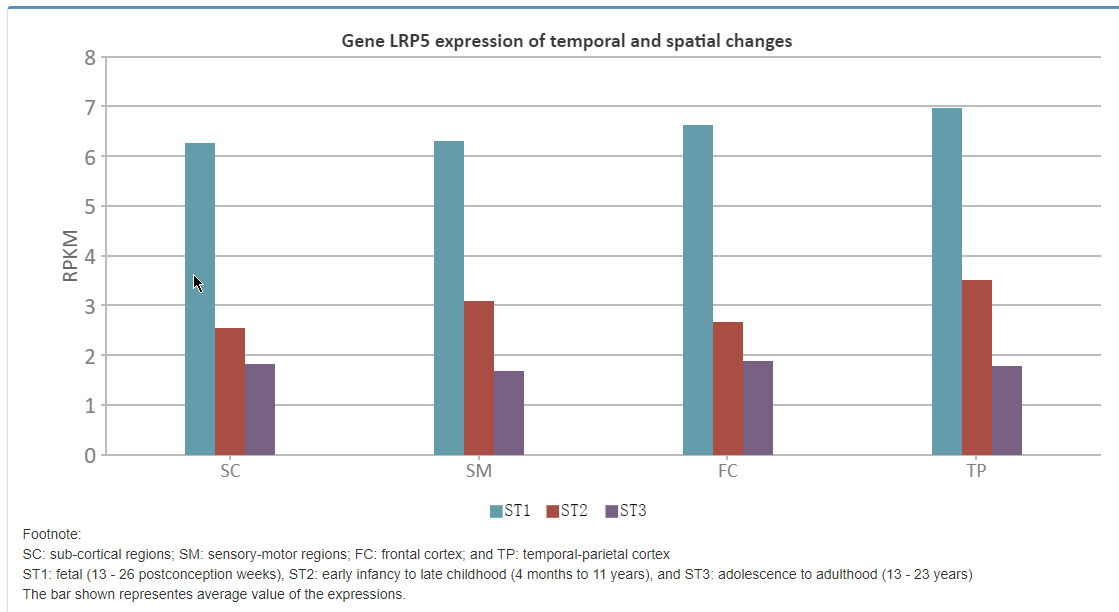
Temporal and Spatial Expression data from BrainSpan were shown.
5.4 Top co-expressed genes.
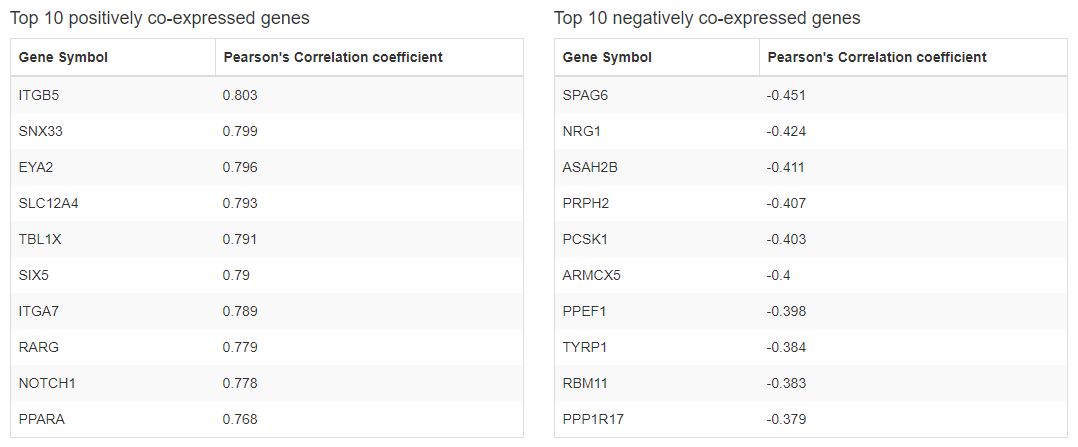
Top 10 positively and negatively co-expressed genes in Brain-Frontal Cortex(BA9) were calculated by using GTEx v7 dataset.
5.5 Drug, GO/Pathway, PPI, and Publication.
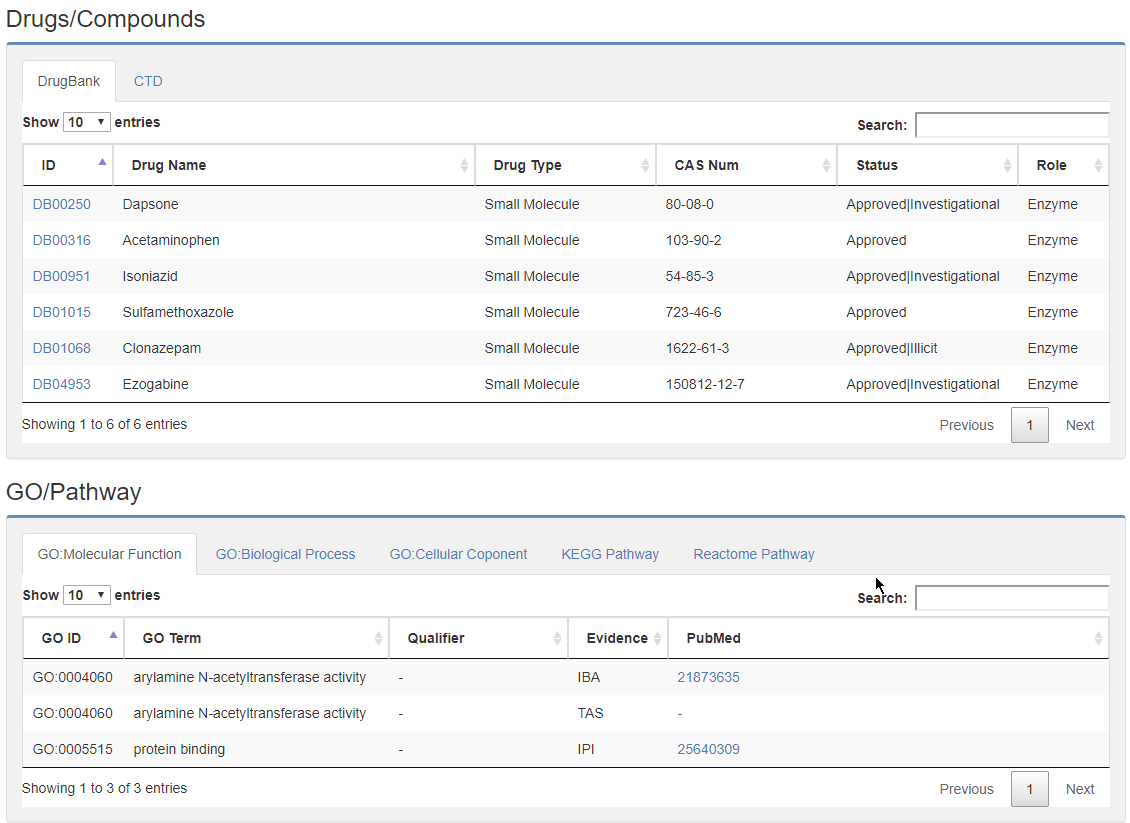
At last, Gene related drugs/Compounds from DrugBank and CTD were listed, also, GO term, pathway data from KEGG and Reactome were provided, The supportive publications were listed at the bottom.
6. Search Function
To search for a gene, please use the gene symbol or gene ID. A list of genes whose symbols contain the query string will be listed. For example, searching using "AKT" will lead to AKT1, AKT2, and AKT3. A brief illustration of the resultant page is shown below.
To search for SNPs, you may use the function to search directly using the rs ID (if you know the ID). This will lead to the SNP page (see section "4. Illustration of the SNP page" below for illustration).
Alternatively, if the user only knows the genomic region where the SNP is listed, the function "search by region" can be applied.
Additionally, we provide a combinatorial query function, phenotype related Genes/Drugs/SNPs can be retrieved.