1. Methods
1.1 Database construction pipeline
1.2 Collection and process of raw data
The human kinases were obtained from KinBase and UniprotKB. A total of 547 kinase proteins were collected and mapped to the latest records in NCBI Gene, UniprotKB, Ensembl, and RefSeq databases. Kinase group, family and subfamily annotations were curated from KinBase, UniprotKB and PhosphoSitePlus websites. Functional annotation and kinase amino acid (AA) sequences were obtained from UniprotKB as the basic annotation information.
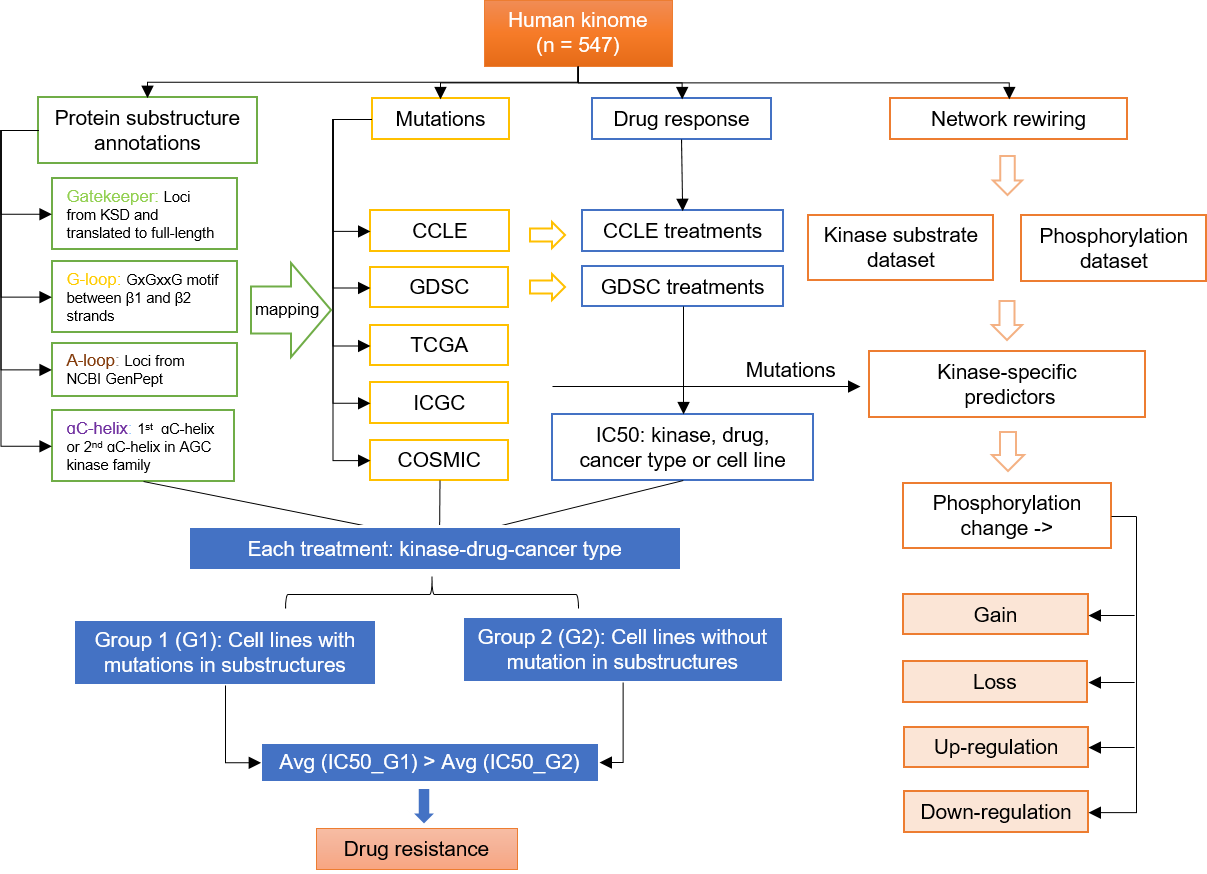
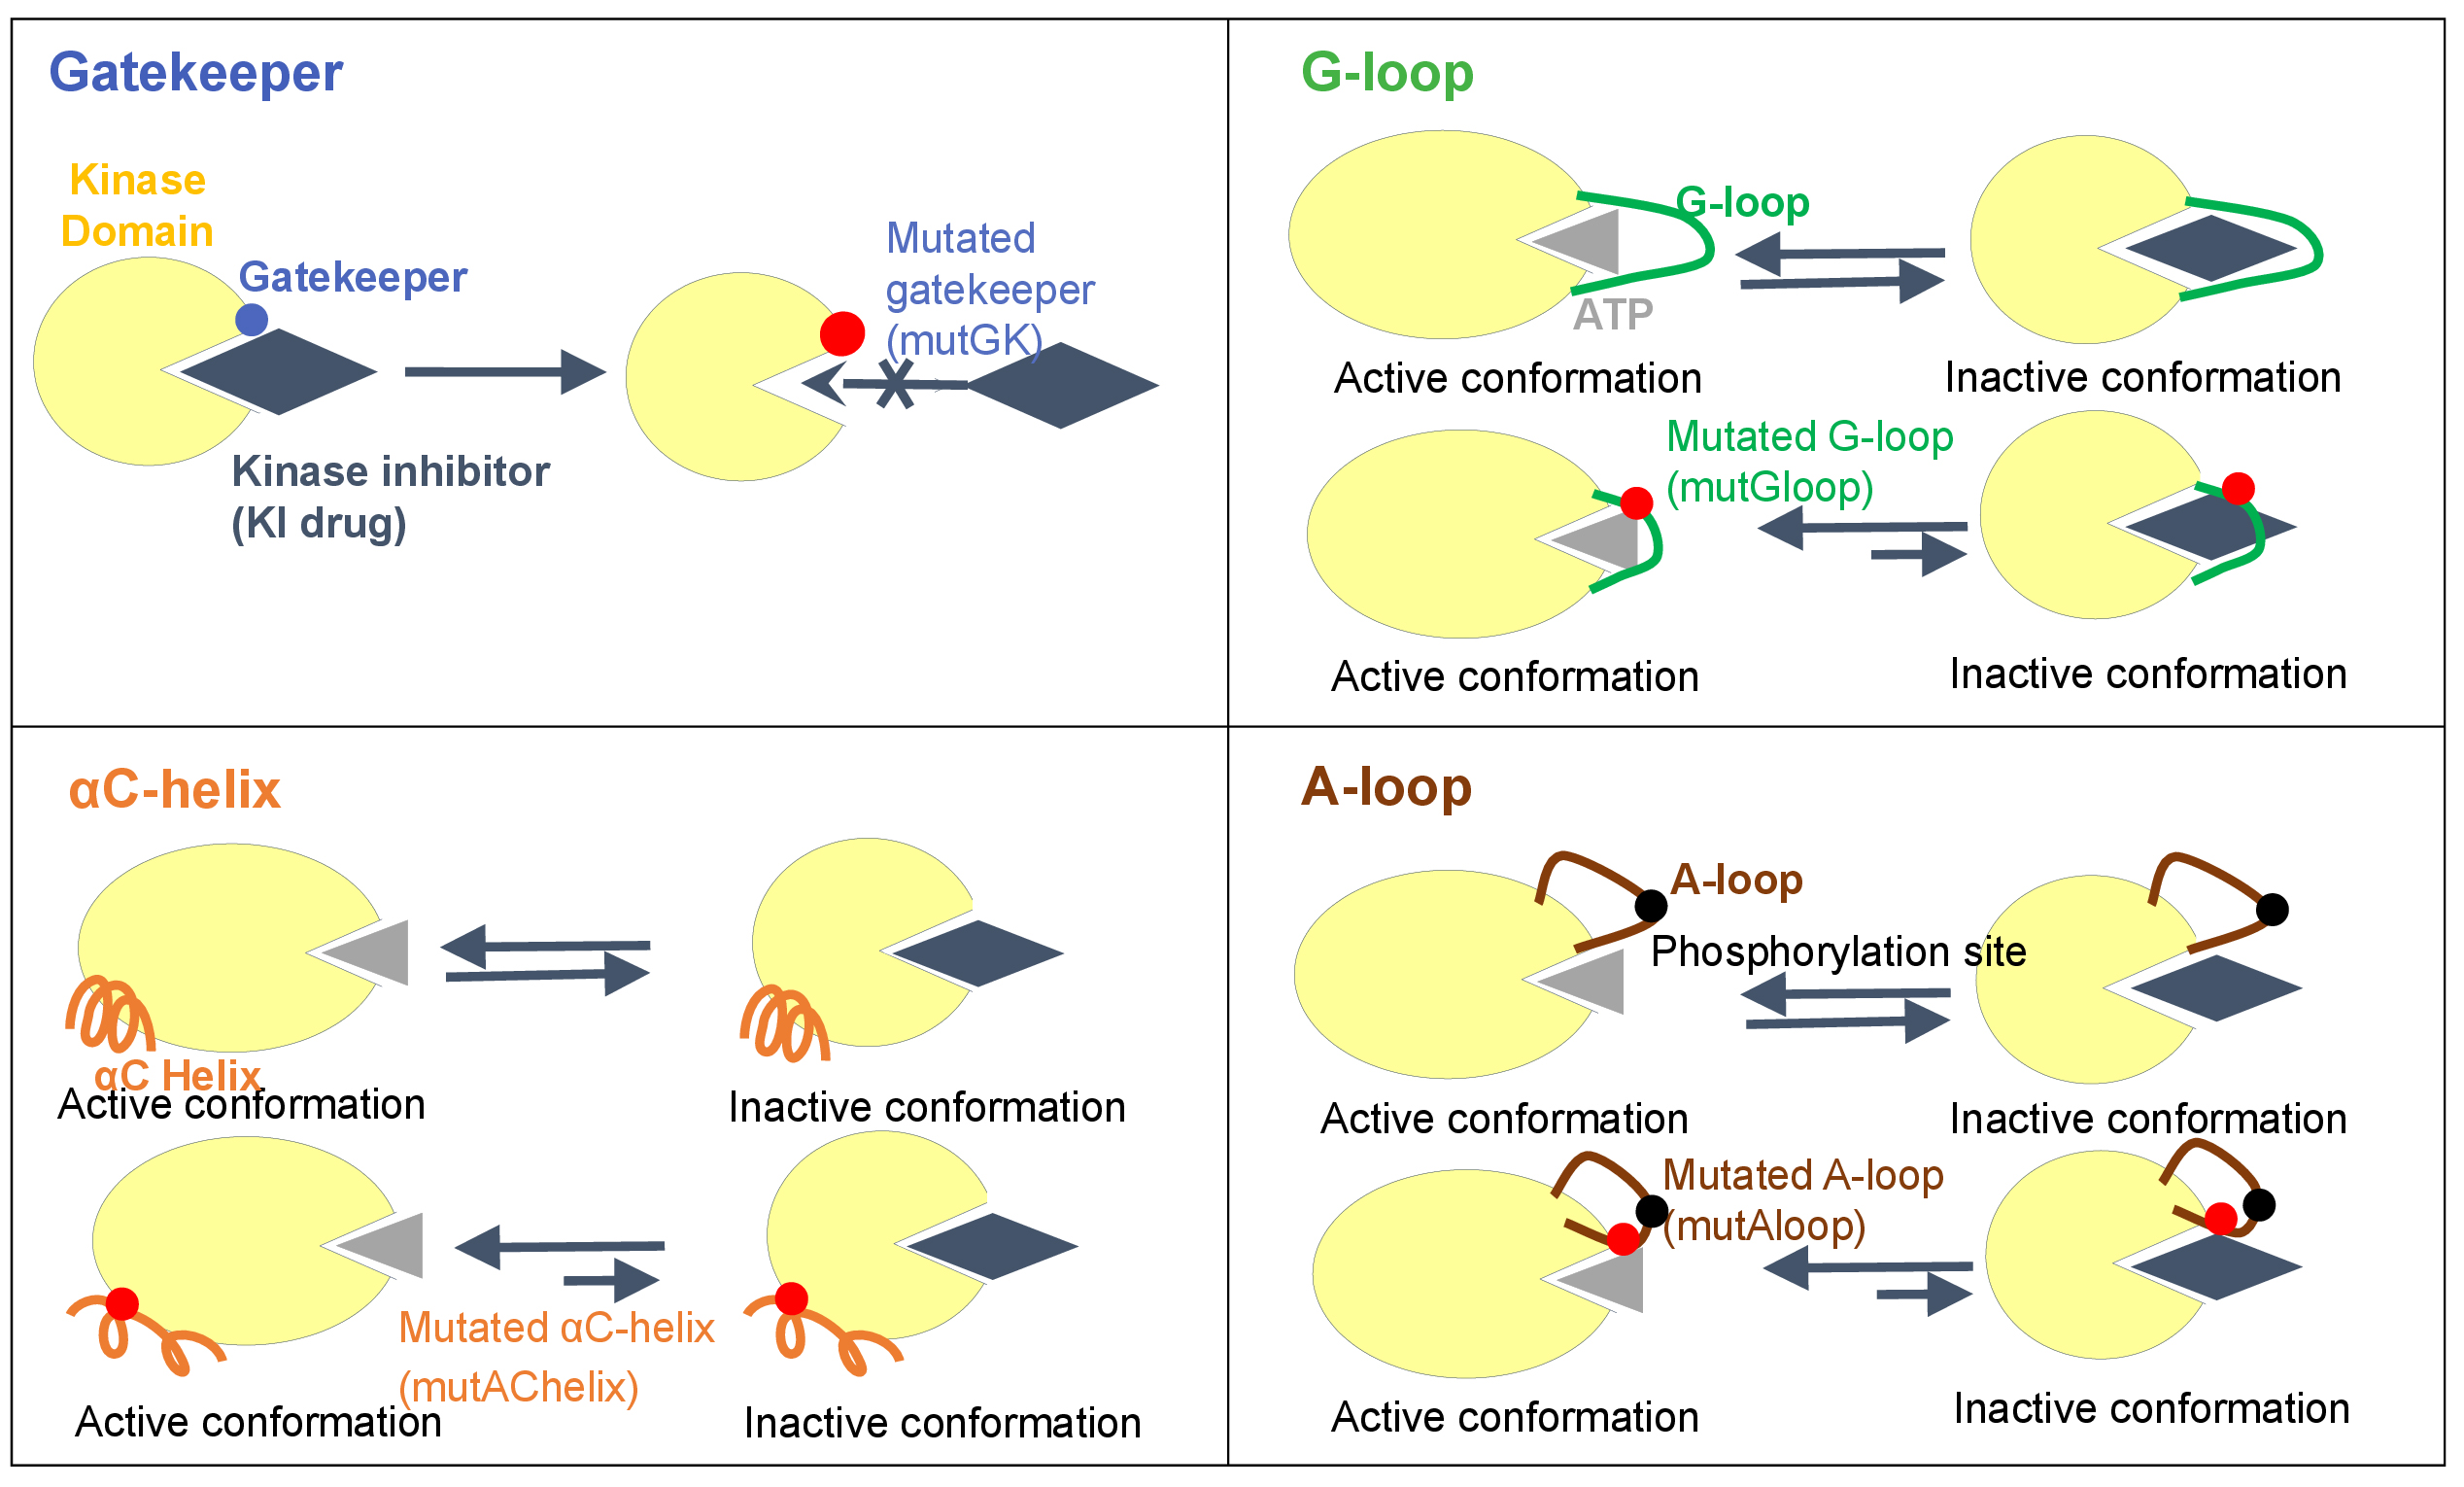
To date, there are four models are known that kinase mutations may influence on the interaction between kinase and KIs: Gatekeeper, G-loop, αC-helix, and A-loop. Specifically, we have studied and identified the locations of each of these four categories in the human kinase proteins as following:
- Gatekeeper residue is a single amino acid located near the protein-drug binding site. In wild-type kinases, gatekeeper residues have small side chains that sterically accommodate drugs. These small side chains can be mutated into bulky side chains that impede drug-protein binding. This confers drug resistance.
- A-loop, which called activation loop or T-loop, is located in the C-lobe. A-loop contains a phosphorylation site, which upon phosphorylation, induces a conformational change on the loop, and then allows a substrate to bind. The activation loop and P+1 loop constitute the activation segment that runs from the DFG (Asp-Phe-Gly) motif to the APE (Ala-Pro-Glu) motif. A-loop mutations may have indirect effects that disfavor drug binding by increasing entropy or destabilizing the inactive conformation.
- G-loop, which is also named glycine-rich loop, and P-loop (phosphorylation loop) have a conserved consensus motif GxGxxG, where G represents glycine, and x can be any amino acid. G-loop mutation can cause clinical resistance to type 2 kinase inhibitors (T2KIs) by destabilizing the inactive conformation, stabilizing the active conformation, and/or removing direct drug interactions.
- αC-helix, also called C-helix and αC, is a single α-helix located in the N-lobe of KD between β3 and β4 strands. αC-helix is usually the first α-helix in the kinases domain (from N-terminus), but in some kinases such as AGC kinases, a short αB–helix may precede αC-helix.
We obtained the substructure locus information of 547 human kinases from UniProt, KSD, and NCBI databases. After removing duplicated kinases and filtering out the kinases without specific locus information of four categories mentioned above, we obtained 388 unique human kinases. Among them, 344, 312, 172, and 231 kinases had Gatekeeper, A-loop, G-loop, and αC-helix locus information, respectively
Somatic mutation data were downloaded from 5 pan-cancer datasets: CCLE, GDSC, TCGA, ICGC, and COSMIC. All the AA changes were mapped to the major protein sequence downloaded from UniprotKB, and mutation records with unmatched AA type or AA position were filtered out. Finally, we got 679,374 mutations from the 5 dataset in all remaining samples (CCLE: 34,096, GDSC: 23,848, TCGA: 66,528, ICGC: 162,557, COSMIC: 392,345). A total of 180,856 AA position-unique mutations were curated from 5 pan-cancer datasets if only counting the unique mutation positions in the kinase AA sequence.
We downloaded the drug response data from CCLE and GDSC along with the cell line annotation files (CCLE cell lines, GDSC cell lines). We only kept the treatments records that are targeted to the kinases in our collected kinase list. 390,460 drug treatment records were deposited in the database.
1.3 Investigation of cancer mutation on kinase functional substructure
Pan-cancer somatic mutations were mapped to the locus of the 4 kinds of substructure for the 388 kinases. Overlapping these substructure loci with four largest cancer mutation datasets resulted in 32,997 mutations records in 4,742 unique AA positions from the 5 mutation datasets.
1.4 Identification of kinase regulatory network-rewiring mutations
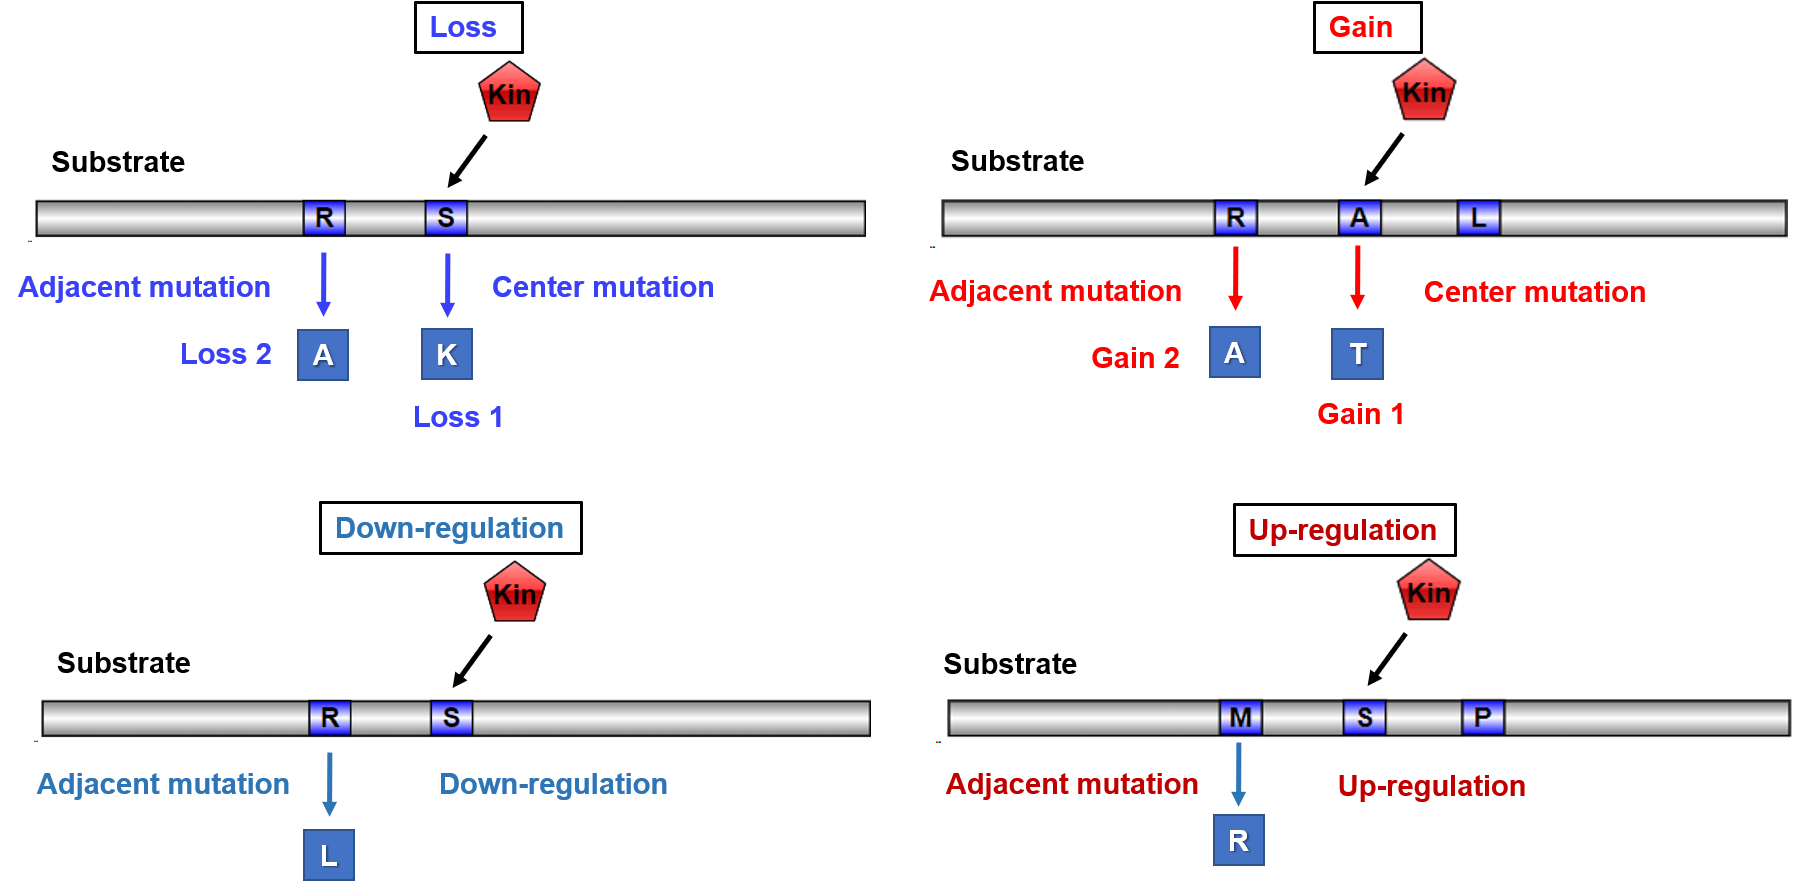
Phosphorylation sites are enriched in disease mutations and rare variants in the population. Such mutations usually alter sequence motifs bounded by specific kinases and may cause rewiring of signaling networks. Thus, interpreting genetic variation with site-specific kinase regulatory network may reveal new mechanisms of genetic variation and protein function and help decipher genotype-phenotype associations in human variation and disease. Using more than 600 kinase specific predictors, we systematically investigated the influence of cancer mutations on kinase-specific phosphorylation sites, which were identified from more than 251,522 kinase regulatory cancer mutation-related network-rewiring records. These records were divided into four entries, namely gain, loss, up-regulation, and down-regulation.
1.5 Kinome-wide drug response and resistance
Raw drug response data that are associated with human kinases were collected from CCLE and GDSC for pan-cancer. Only the drug treatments that target the kinase proteins were included for downstream analysis. We obtained 390,592 drug response data that are related to human kinases for pan-cancer. By utilizing the GDSC dataset, cell lines were divided into two groups for each treatment by drug, kinase, and cancer type following the rules: 1) group 1 (G1) included cell lines with mutations in the substructures and group 2 (G2) included cell lines without mutations in any of the 4 substructure region, or 2) G1 included cell lines with a primary mutation in the substructures and G2 included cell lines possessing a secondary mutation besides the primary mutation in any of the 4 substructure region. The average IC50 values were calculated for each group to assess the drug resistance. A total of 137 treatments were concluded to be potential drug resistance with Avg(IC50_G1) > Avg(IC50_G2).
2. Query
Our database was developed in a user-friendly manner. KinaseMD provided four implemented search options, including General search, Batch search, Advanced search, and BLAST search. Users can conveniently query the database with one or multiple keywords.
2.1 General search
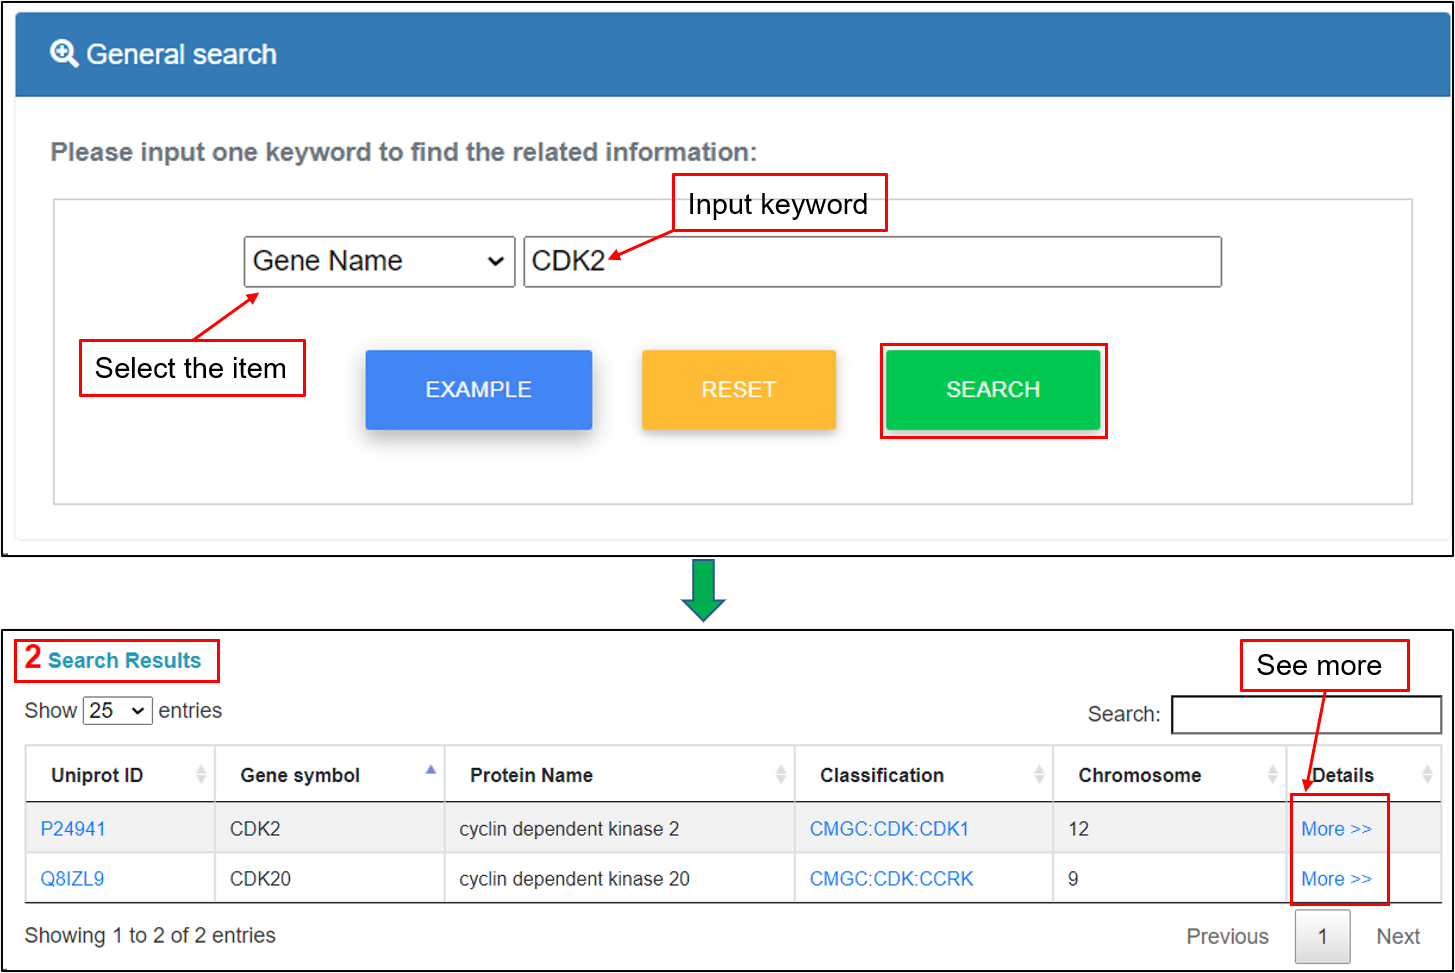
For the general search, users can directly search the KinaseMD database by inputting one keyword and related tag. For example, if the keyword “CDK2” of “Gene Name” is submitted, the corresponding results are shown in a tabular format, including UniProt accessions, gene symbols, protein names, kinase classification, chromosome and more details. Detailed annotations can be retrieved through the "More" link.
2.2 Batch search
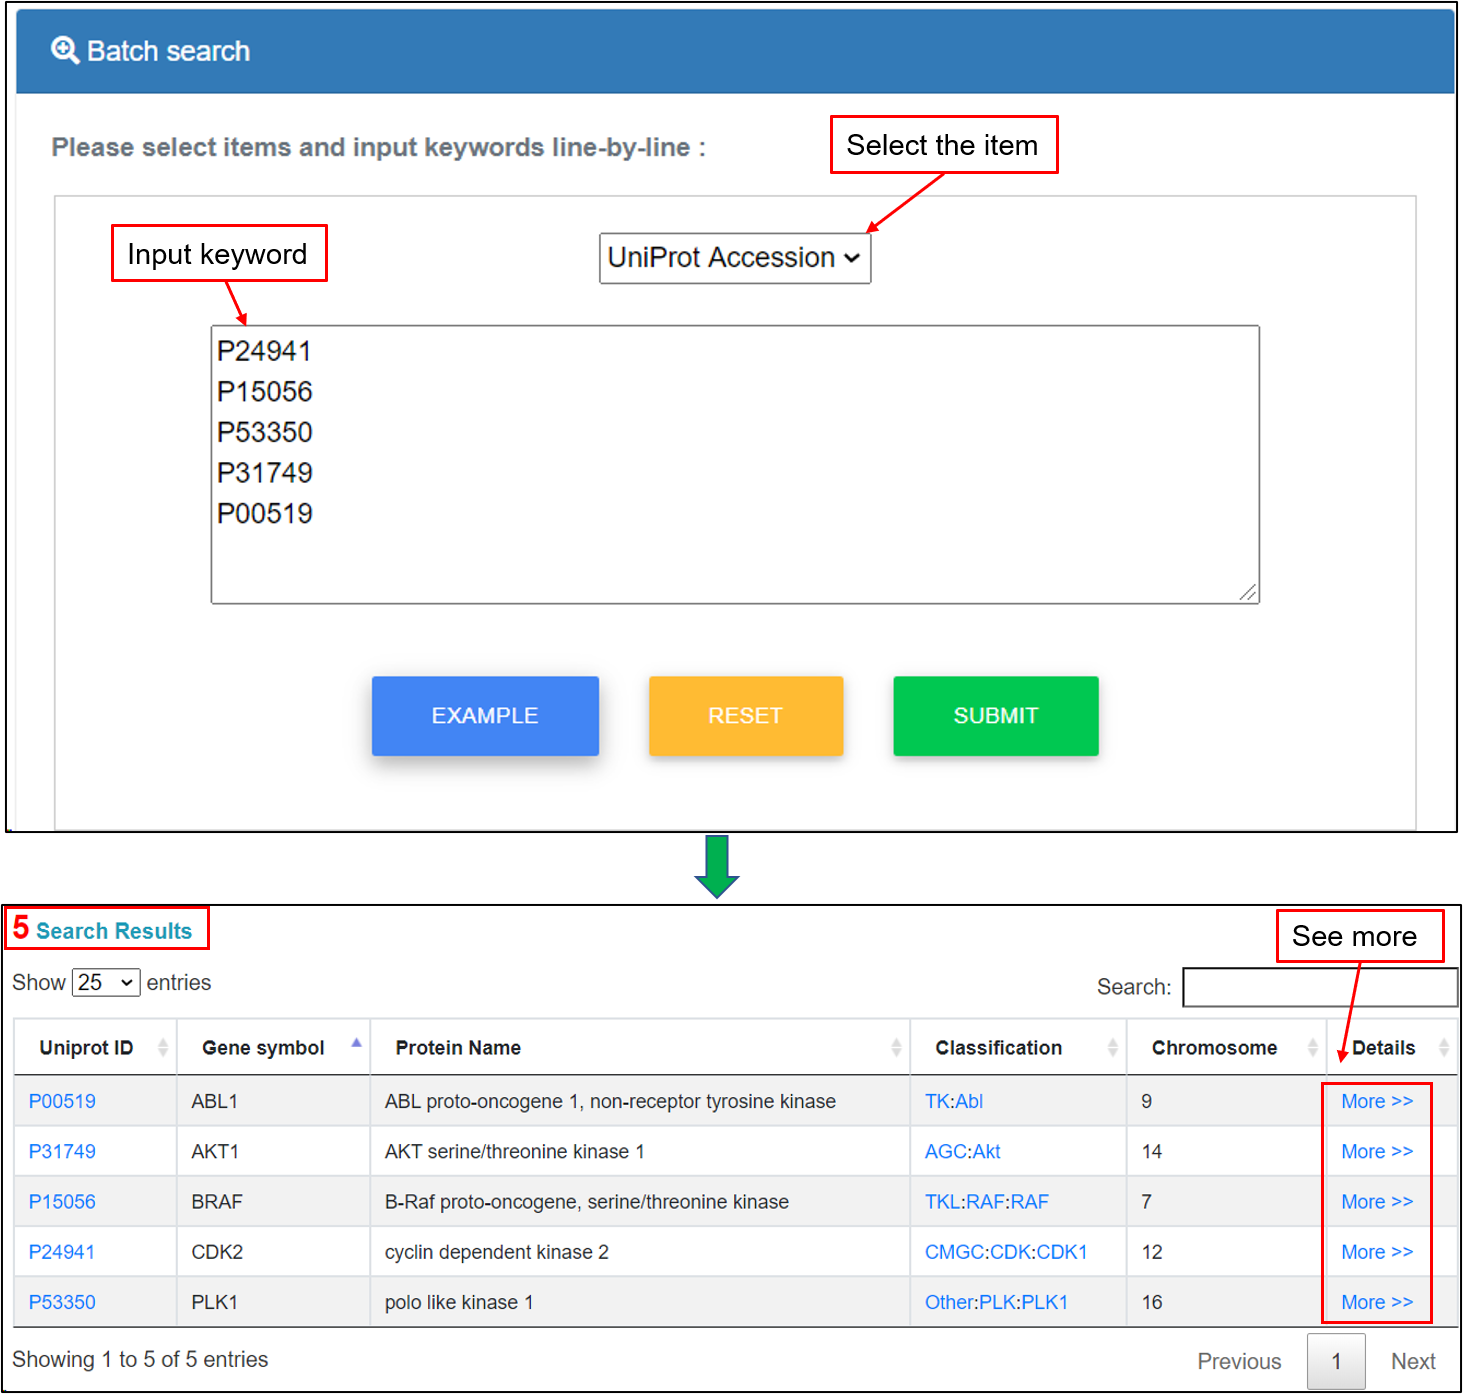
Users can enter multiple keywords, such as gene ID, UniProt accession, ensemble ID, gene name, protein name, chromosome, kinase group and kinase family, in a line-by-line format for querying. For example, if the multiple keyword "UniProt Accession", including "P24941", "P15056", "P53350", "P31749" and "P00519", are submitted, the corresponding results are shown in a tabular format, including UniProt accessions, gene symbols, protein names, kinase classification, chromosome and more details. Users could click the "More" link to see more annotations.
2.3 Advanced search
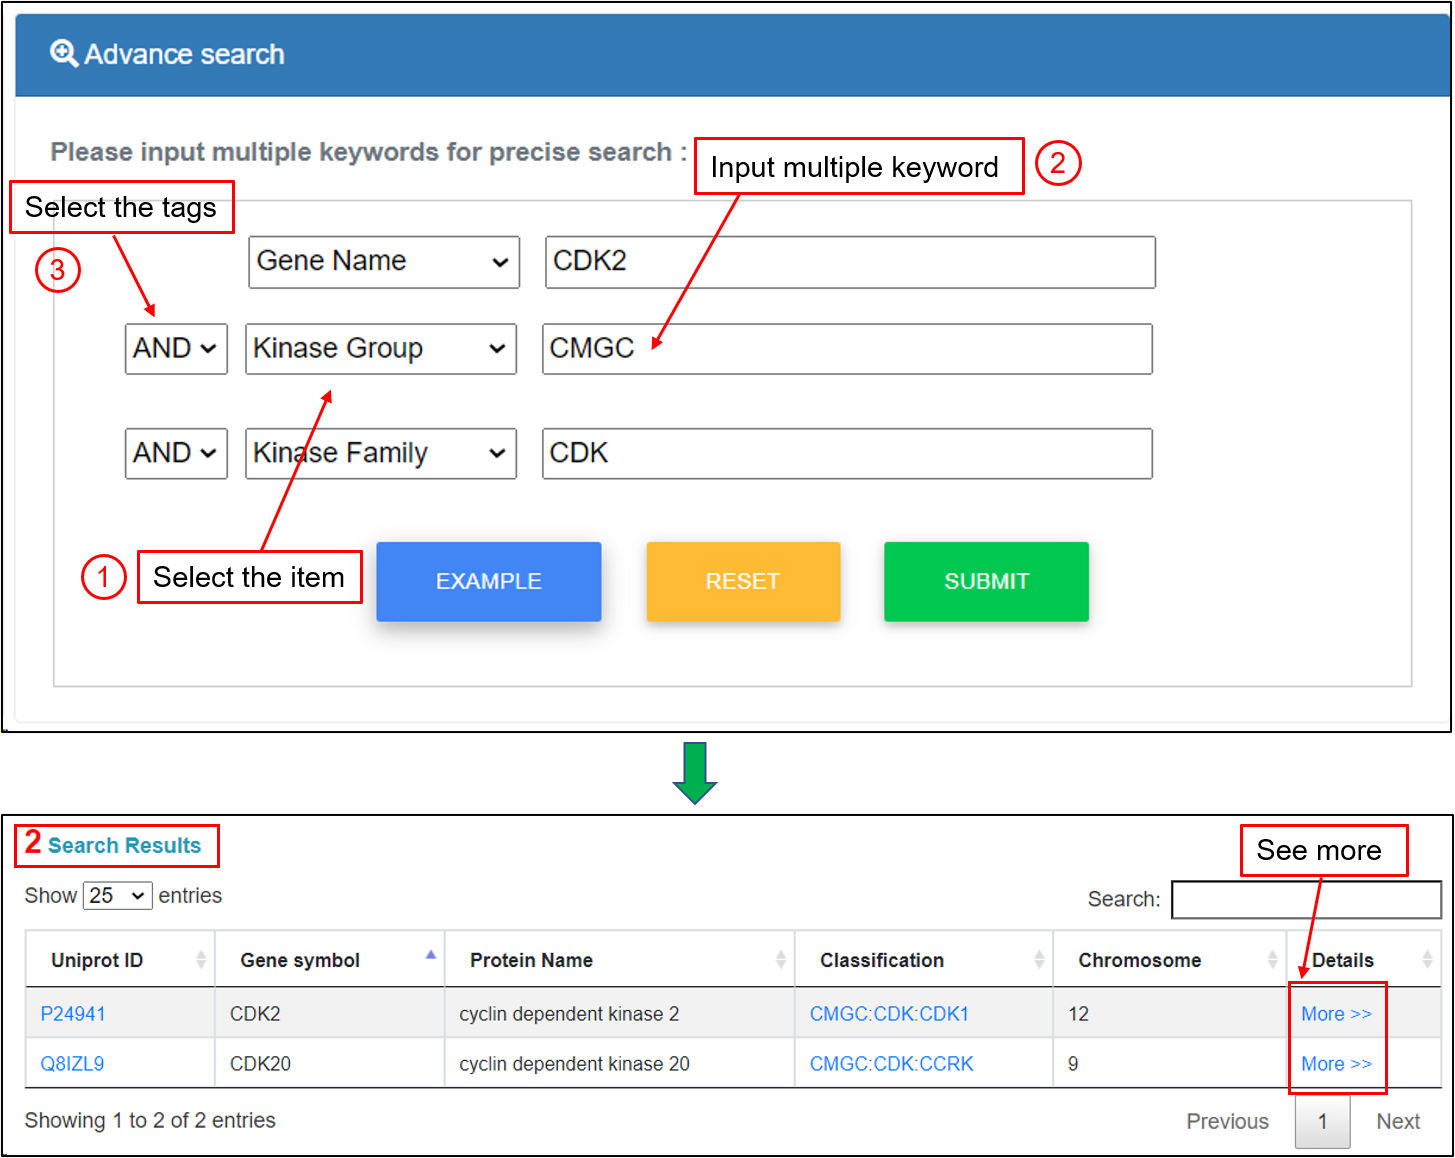
In this option, users could use relatively complex and combined keywords to locate precise information, with up to three search terms. The interface of the search engine allows querying by different database fields and the linking of queries through three operators "and" and "or". For example, if the keyword "CDK2" of “Gene Name”, the keyword "CMGC" of "Kinase Group" and the keyword "CDK" of "Kinase Family" are submitted, the corresponding results are shown in a tabular format, including UniProt accessions, gene symbols, protein names, kinase classification, chromosome, and more details. Users could click the "More" link to see more annotations.
2.4 BLAST search
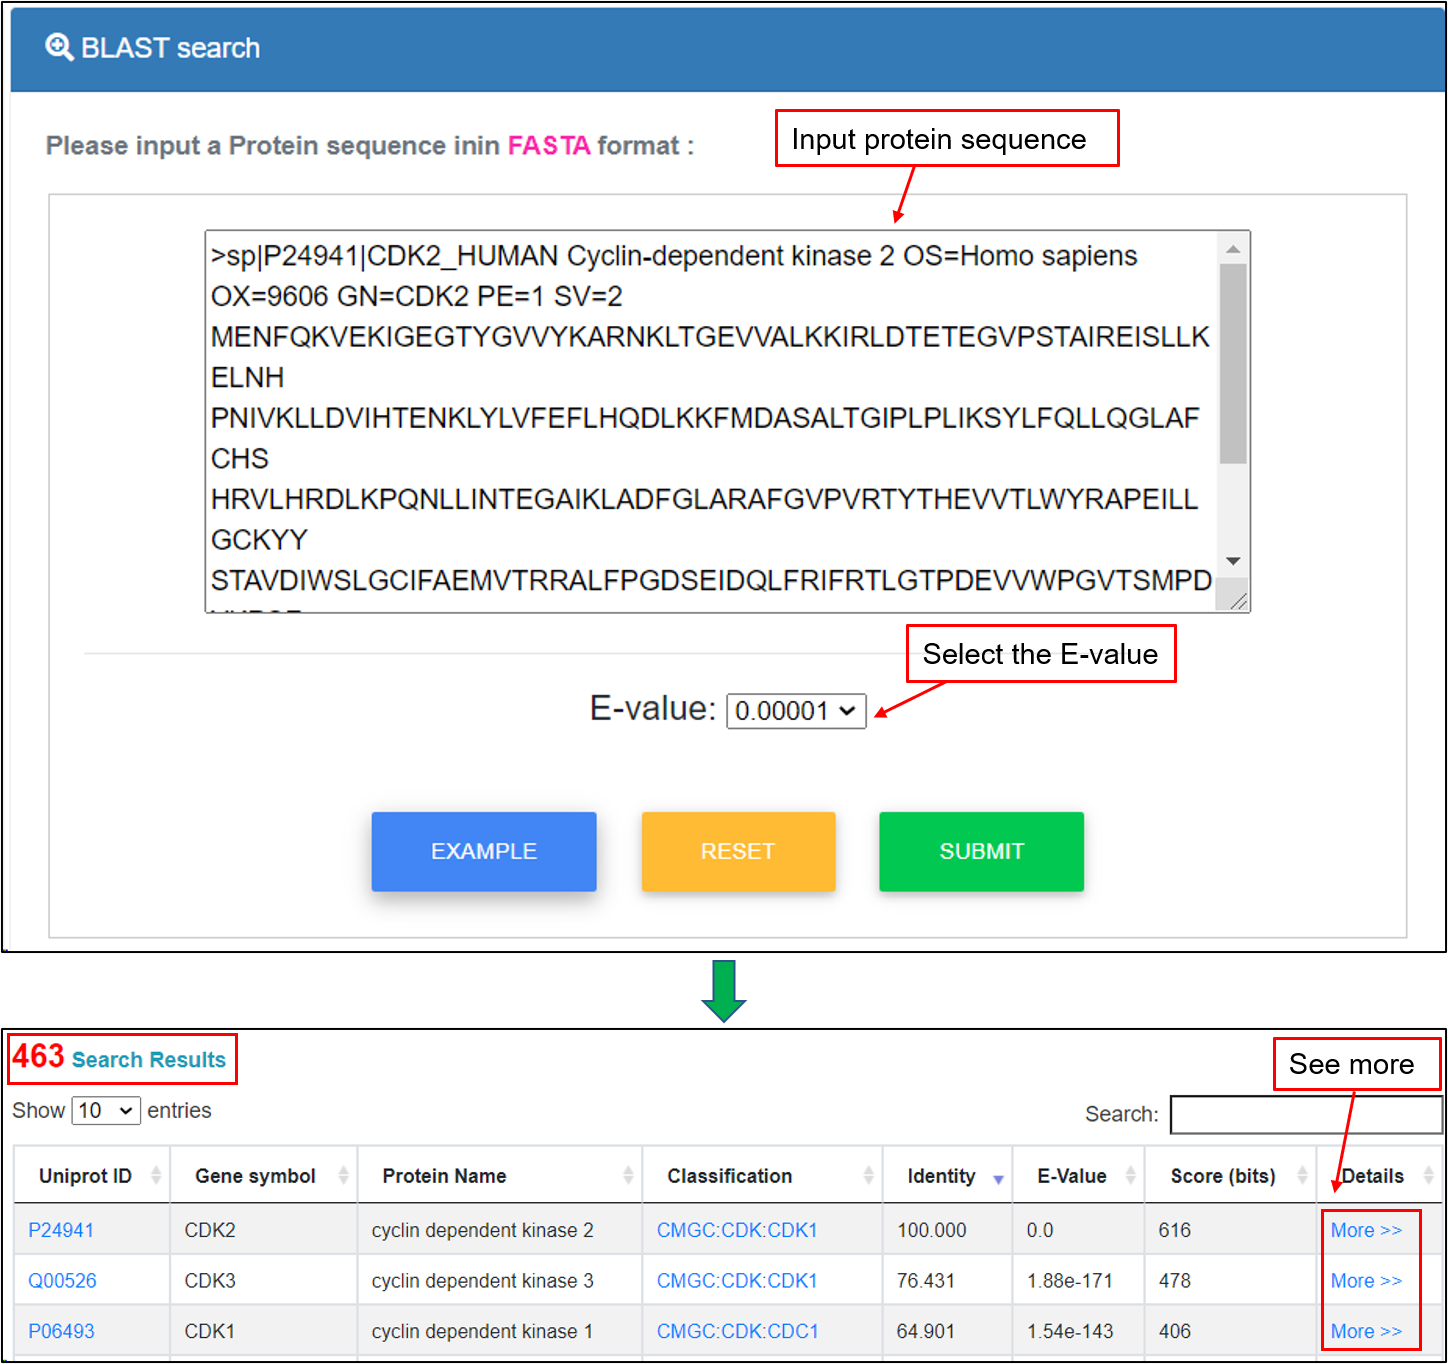
This option was designed for querying the KinseDB by protein sequences. The blastp program of NCBI BLAST packages was included in the database. Users can enter a protein sequence in FASTA format to search identical or homologous proteins. For example, if the protein sequence of "CDK2" gene and user-defined “E-value” is submitted, the corresponding homologous proteins greater than that value will be shown in a tabular format, including UniProt accessions, gene symbols, protein names, kinase classification, identity, E-value, Score (bits) and more details. Users could click the "More" link to see more annotations.
3. Compendium
The kinase page has abundant information. It can be visited by the search or browse function (click the link in data tables). The website page contains 6 tabs is provided to show the detailed annotations for each kinase.
3.1 Kinase information and function annotations
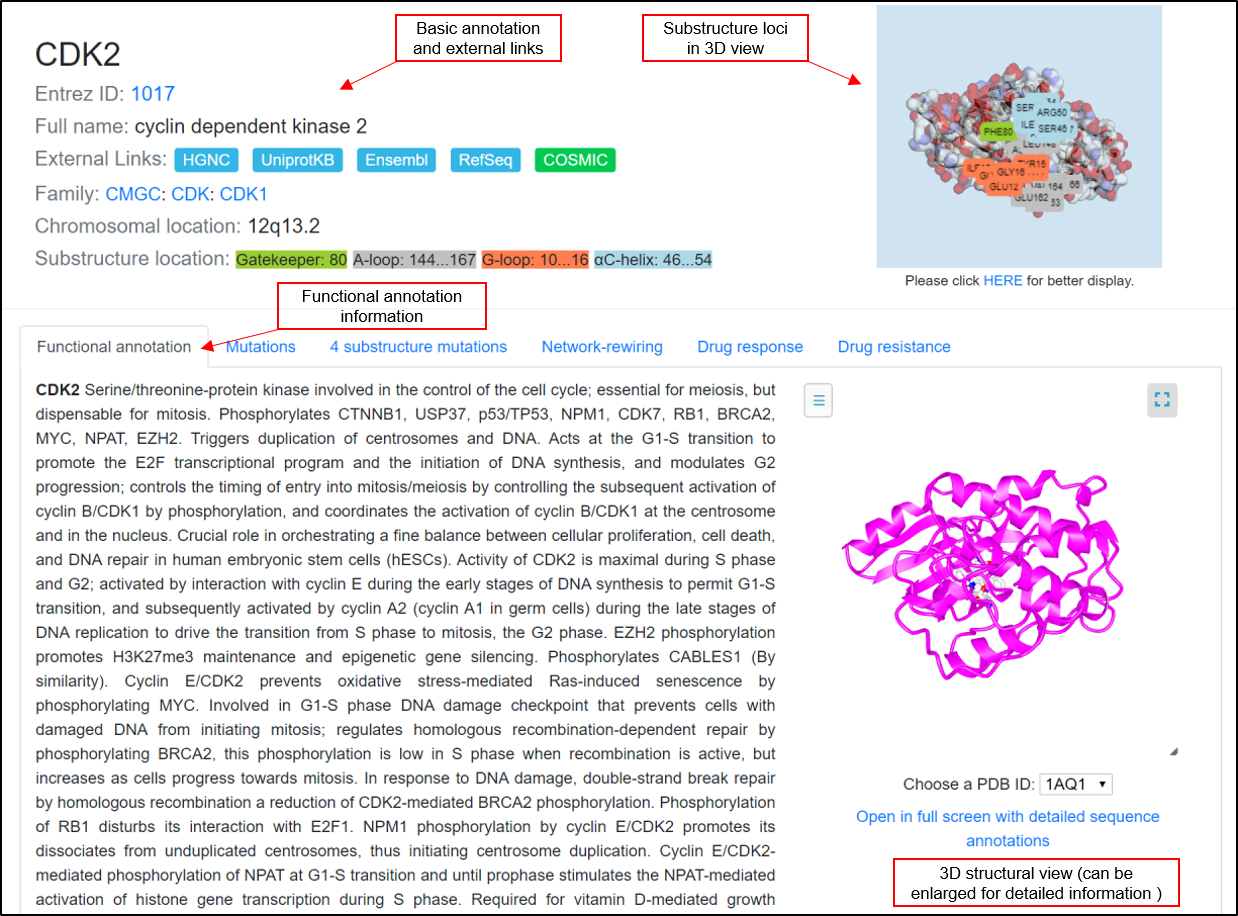
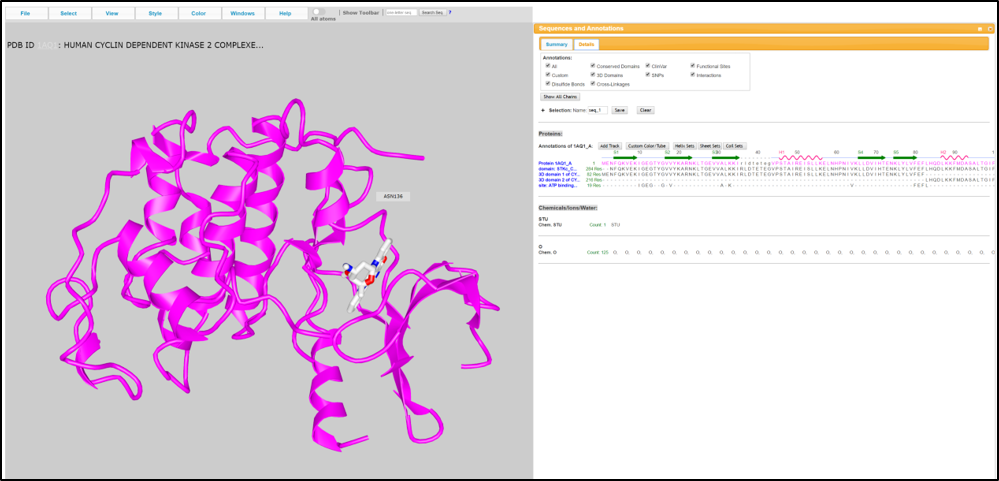
The basic annotation information for the kinase proteins is shown in this tab, including the gene symbol, full name. External links are also provided to some well-known database, family annotation, and loci of the four kinds of the substructure. The loci can be viewed in a large size with PDB ID switching.
The functional annotation includes the description of kinase role in our body. Additionally, the relevant gene ontology(GO) terms (GO-biological processes, GO-molecular functions, and GO-cellular components) were collected and displayed in this tab.
The 3D structure view is provided for the user to look into the AA sequence characters.
3.2 Cancer mutations
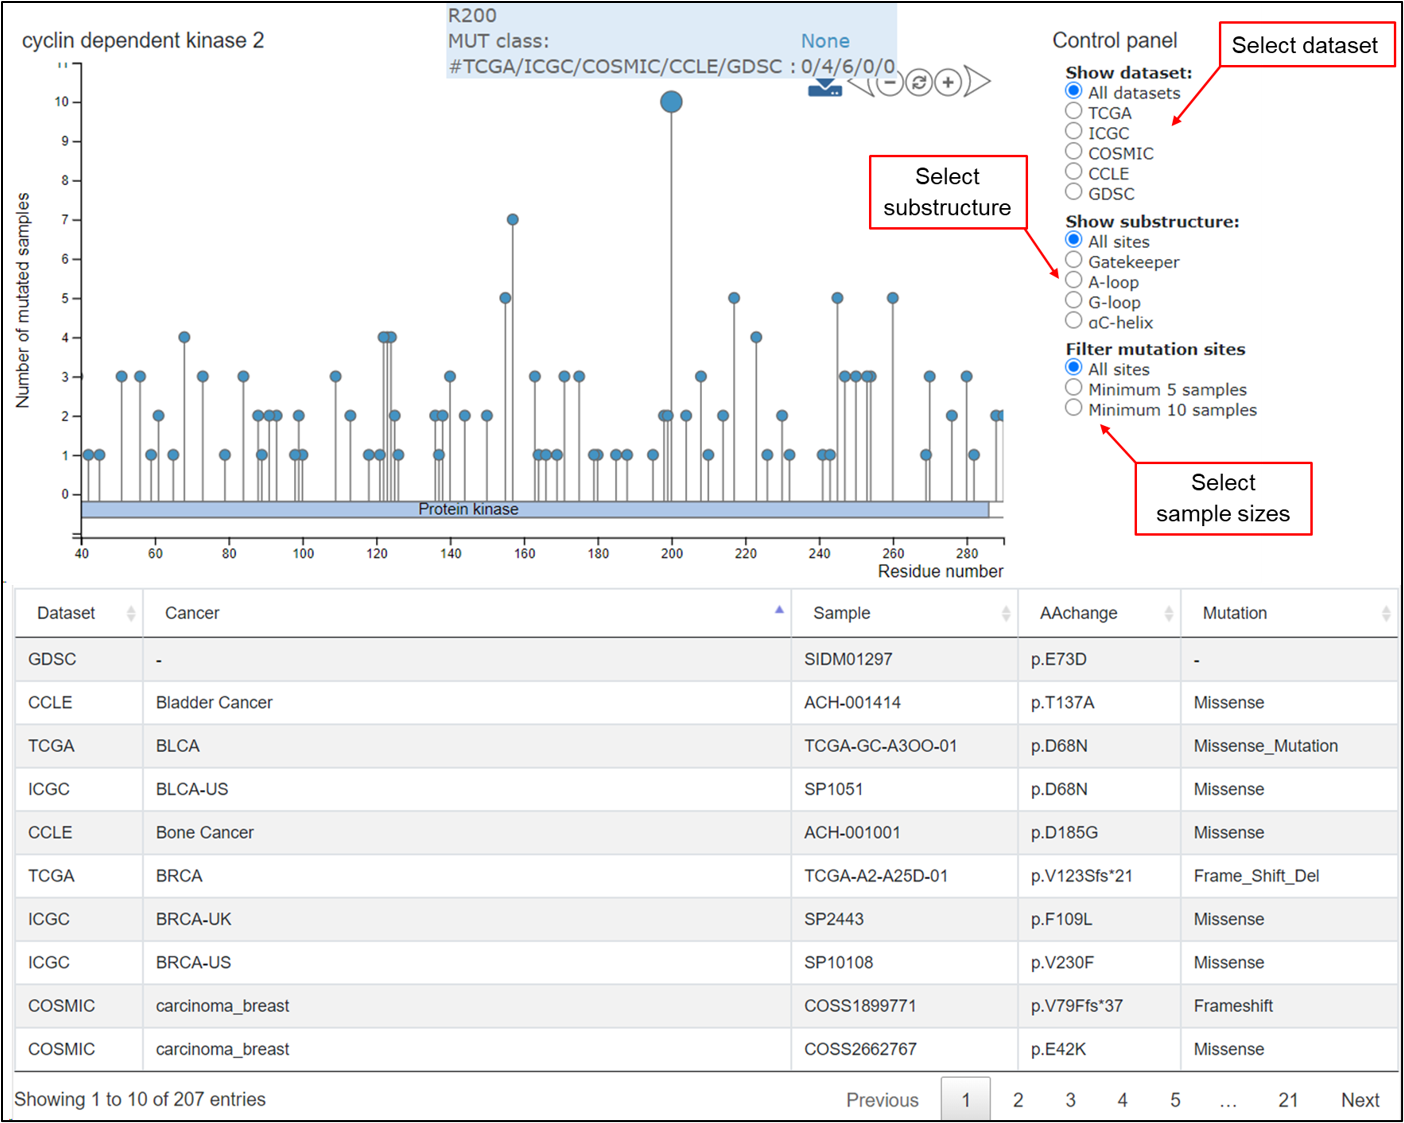
The mutation data were shown for the selected kinase protein in this tab. The needle plot on the top displays the sample counts in the mutation positions. Users can use the control panel on the right upper corner to choose specific mutations, and the plot will change dynamically. A table at the bottom shows the full list of mutations in the selected kinase in different samples from the 5 pan-cancer datasets.
3.3 Kinase substructure
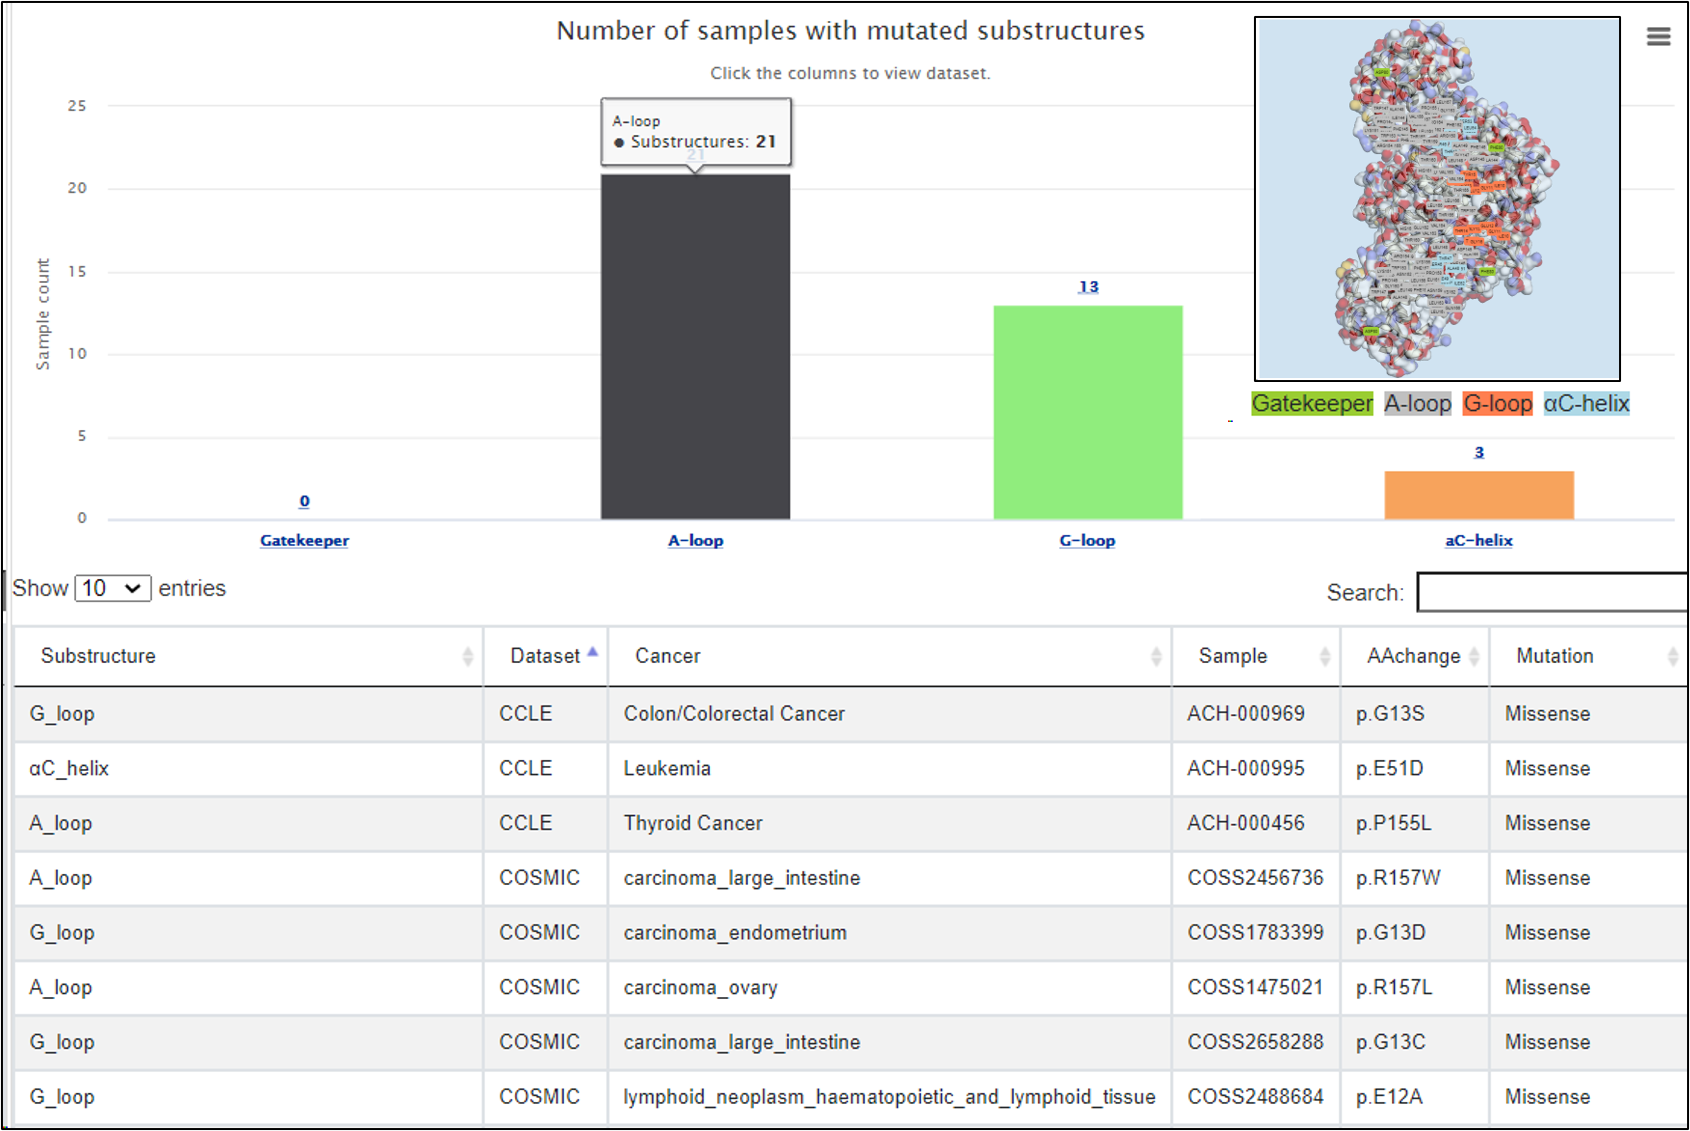
In this tab, mutations in the four kinds of substructure were listed. A bar plot displayed the number of mutated samples in each substructure. Clicking on the bar will show the number of mutated samples in each pan-cancer dataset.
3.4 Regulatory network-rewiring mutations
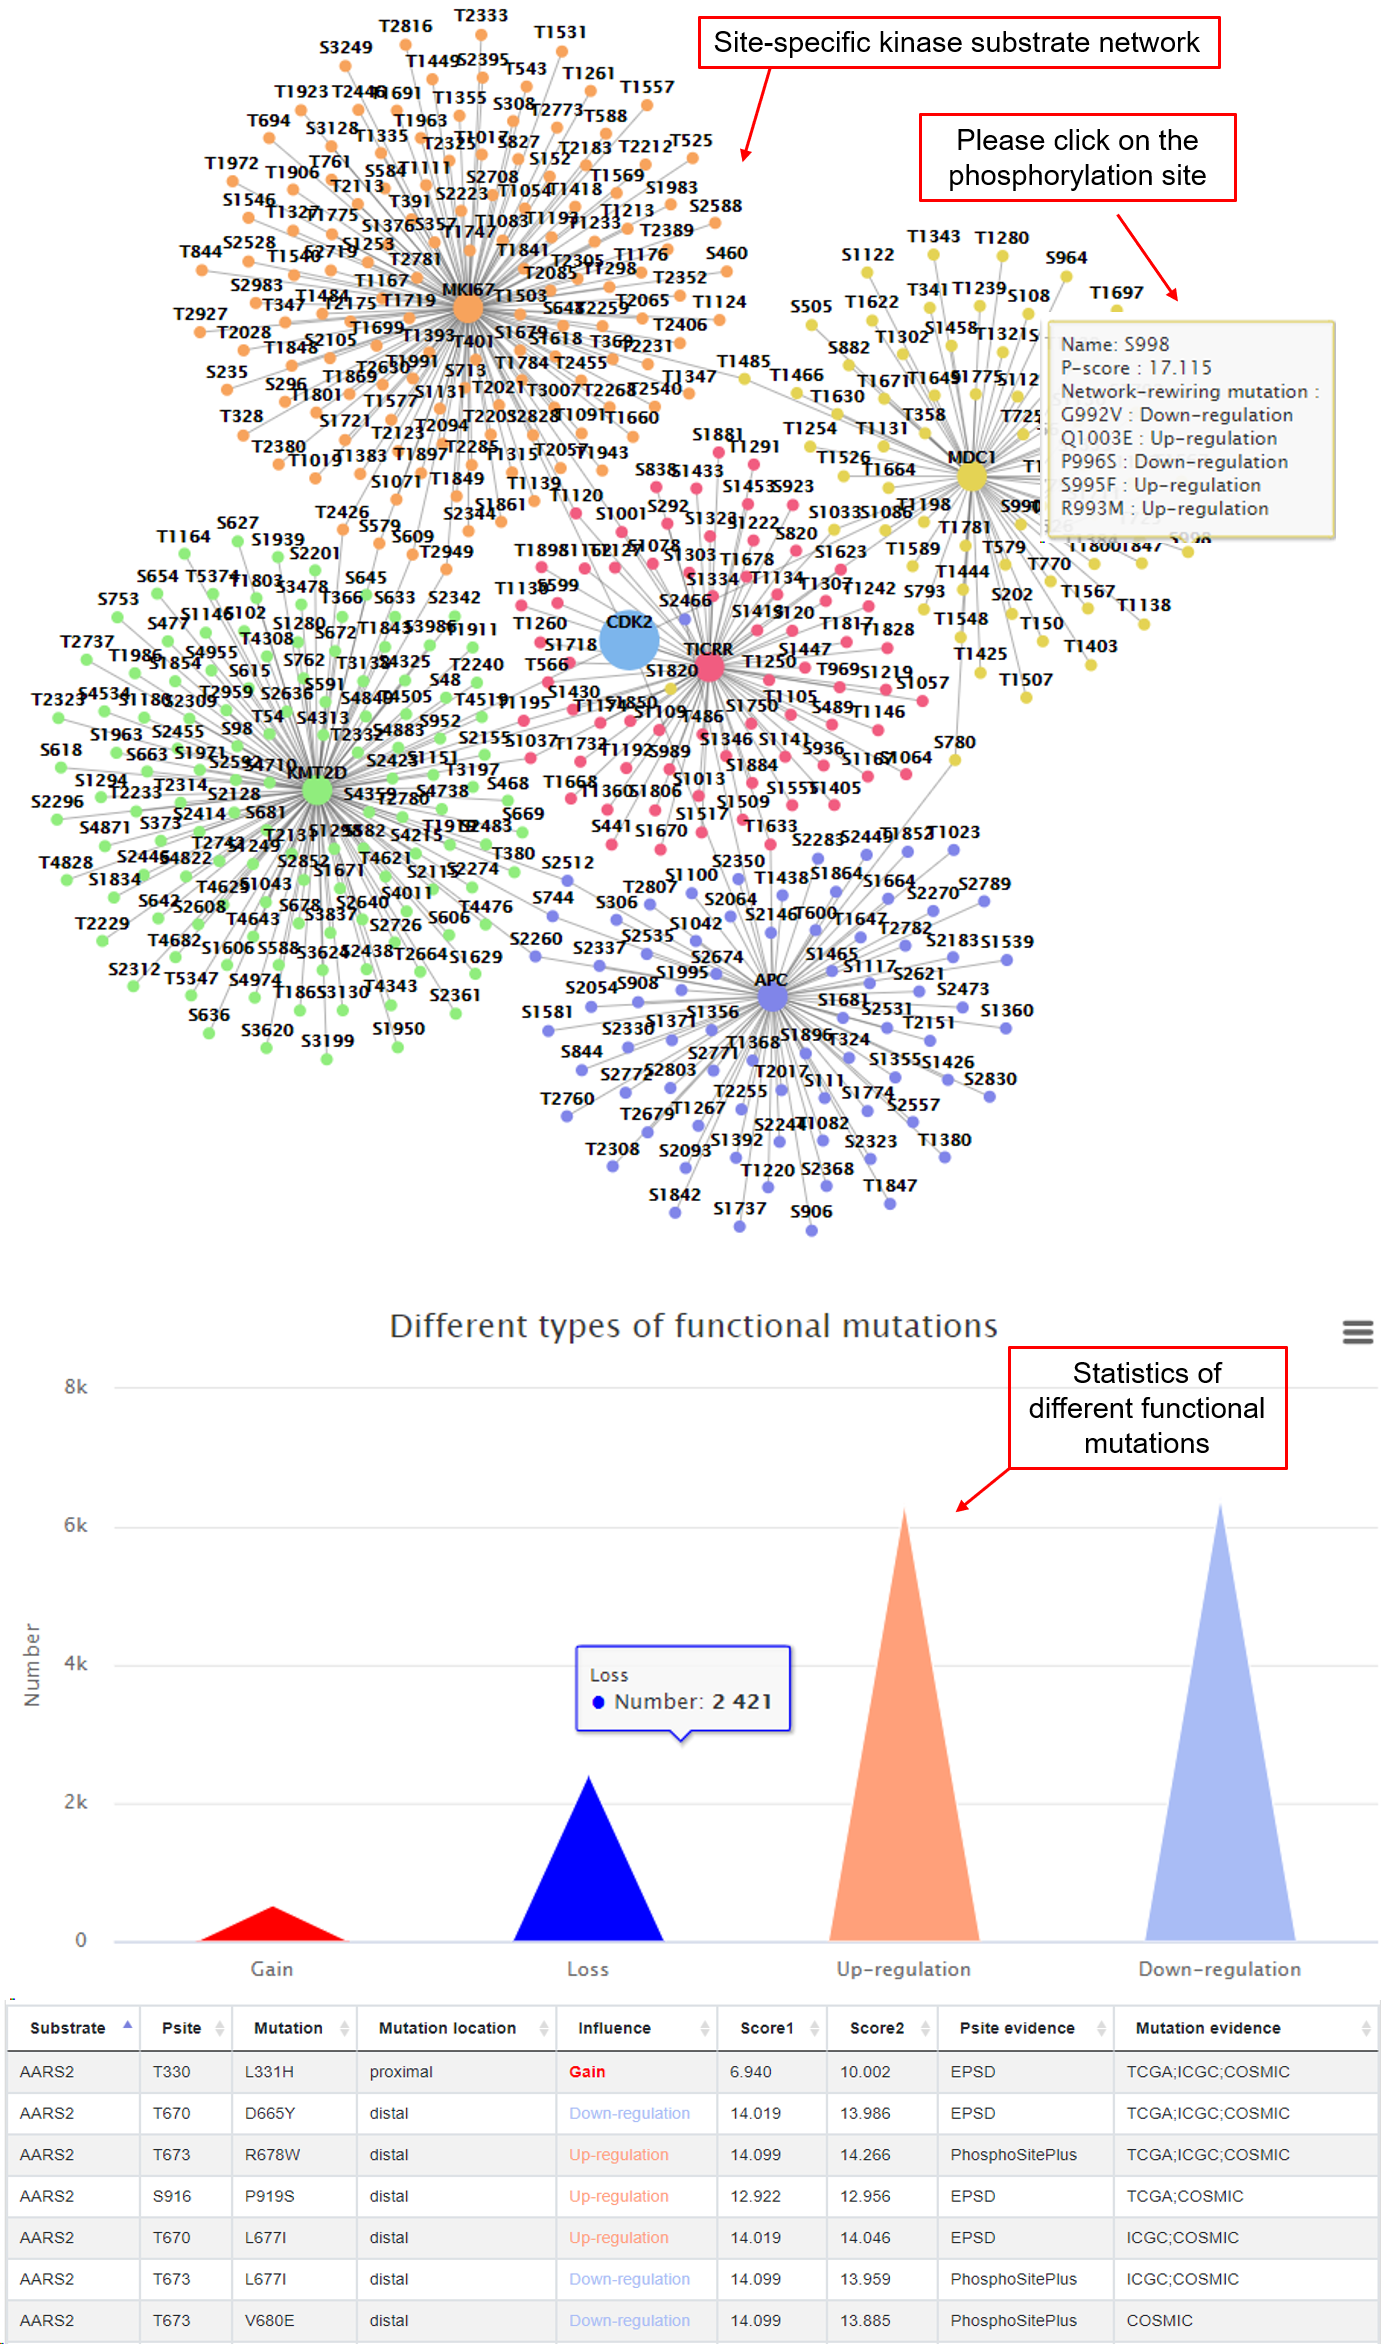
In this tab, it shows the site-specific kinase regulatory network that can be affected by mutations. The number of the functional mutations were summarized and shown in a bar plot, which will give users an intuitional view of the main consequences that may be caused by mutations in this kinase. A detailed table were provided as well to check the consequence from a specific mutation.
3.5 Drug response
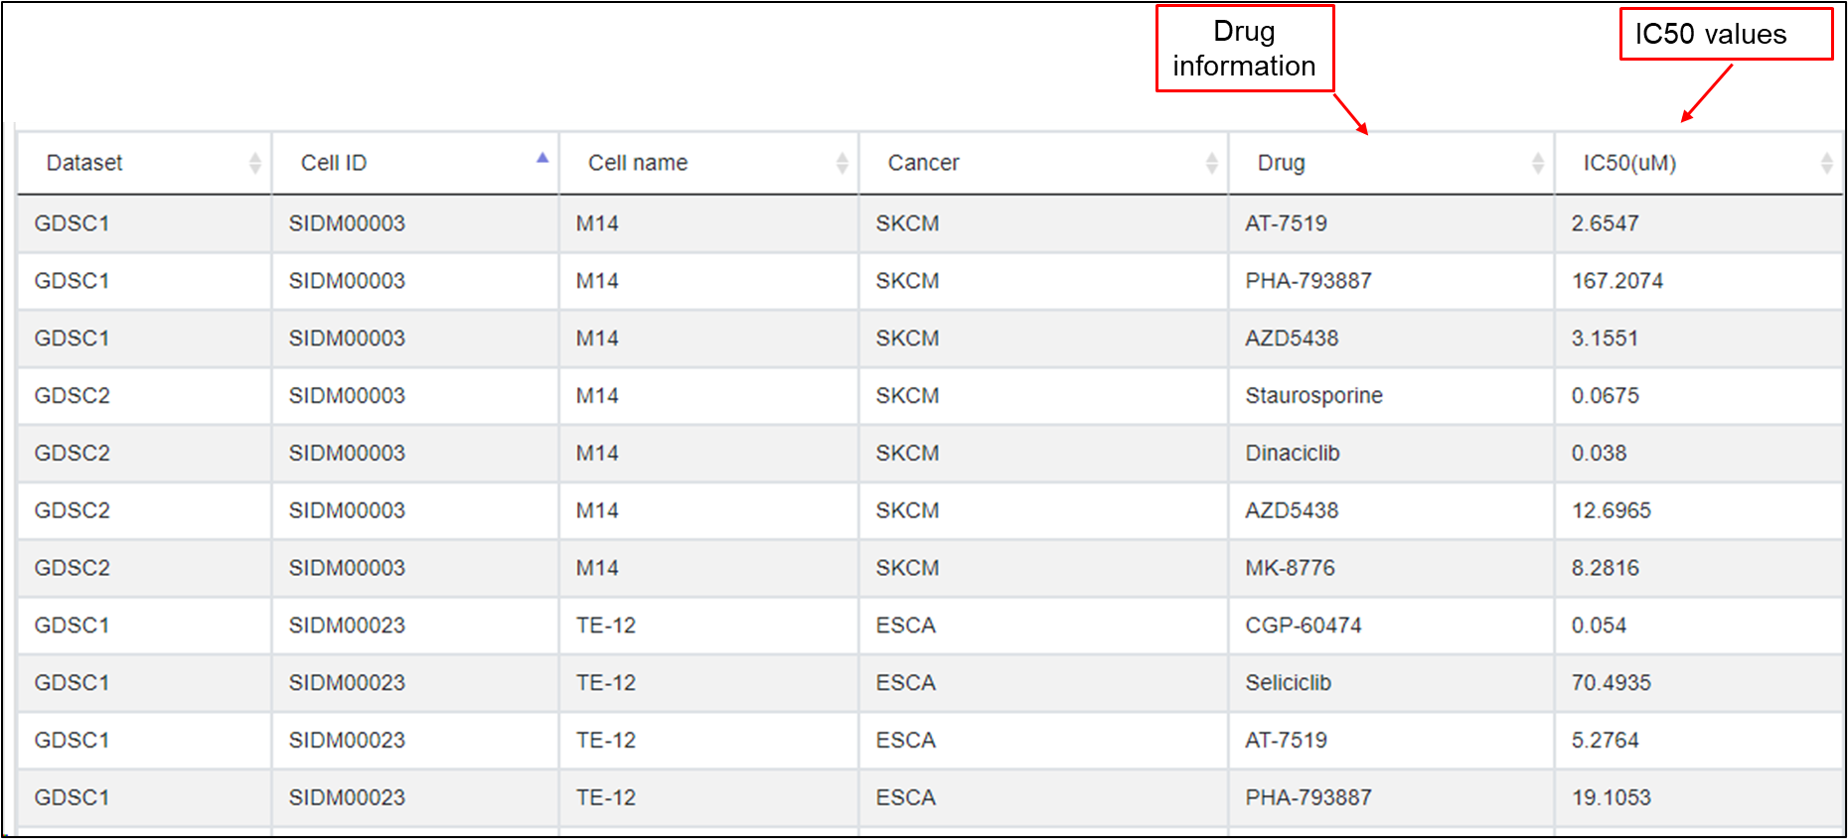
In this tab, all the drug treatments data associated with the selected kinase were listed for different cancer types in multiple cell lines that harbor different mutations.
3.6 Drug resistance
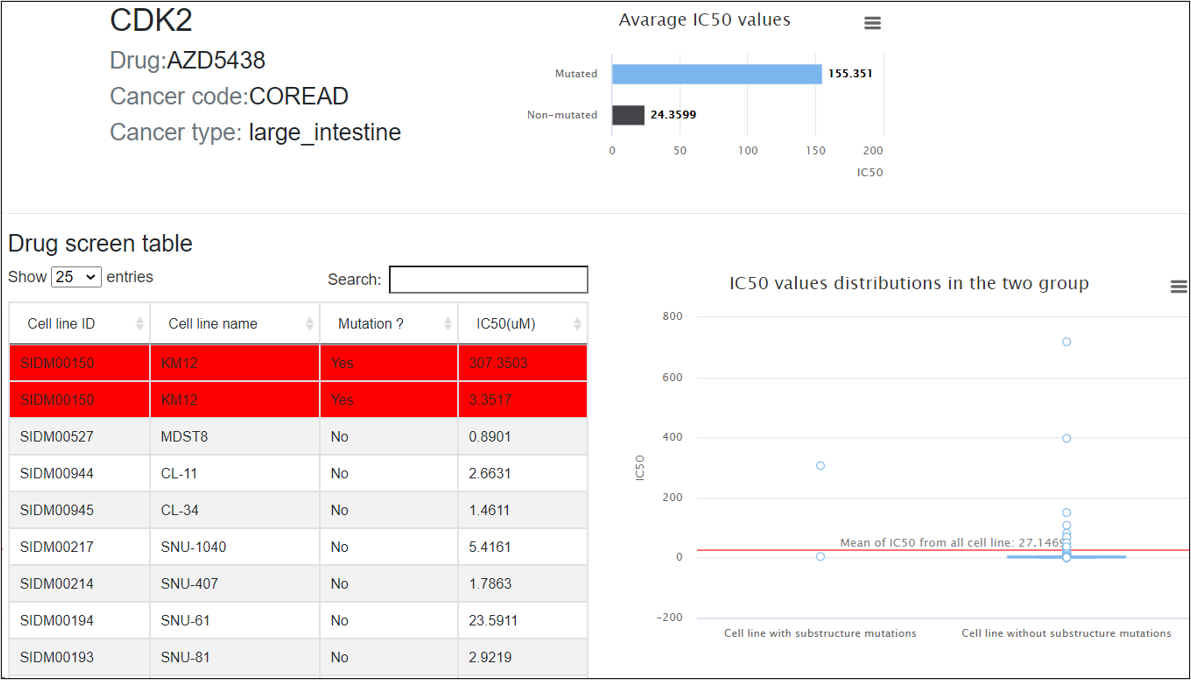
If the kinase can cause potential drug resistance, mutations in the substructure of the kinase will be displayed in this tab, as well as the drugs and corresponding cancer types that drug resistances involved in.
4. How to cite
Please cite: Ruifeng Hu, Haodong Xu, Peilin Jia, Zhongming Zhao, KinaseMD: kinase mutations and drug response database, Nucleic Acids Research, gkaa945, https://doi.org/10.1093/nar/gkaa945.