Gene Page: SALL2
Summary ?
| GeneID | 6297 |
| Symbol | SALL2 |
| Synonyms | COLB|HSAL2|Sal-2|ZNF795|p150(Sal2) |
| Description | spalt-like transcription factor 2 |
| Reference | MIM:602219|HGNC:HGNC:10526|Ensembl:ENSG00000165821|HPRD:03743|Vega:OTTHUMG00000168826 |
| Gene type | protein-coding |
| Map location | 14q11.1-q12 |
| Pascal p-value | 0.632 |
| DEG p-value | DEG:Sanders_2014:DS1_p=0.149:DS1_beta=0.038200:DS2_p=2.94e-03:DS2_beta=0.151:DS2_FDR=3.34e-02 |
| Fetal beta | 0.673 |
| eGene | Meta |
| Support | CompositeSet Darnell FMRP targets |
Gene in Data Sources
| Gene set name | Method of gene set | Description | Info |
|---|---|---|---|
| CV:PGCnp | Genome-wide Association Study | GWAS | |
| DEG:Sanders_2013 | Microarray | Whole-genome gene expression profiles using microarrays on lymphoblastoid cell lines (LCLs) from 413 cases and 446 controls. | |
| GSMA_I | Genome scan meta-analysis | Psr: 0.047 |
Section I. Genetics and epigenetics annotation
Section II. Transcriptome annotation
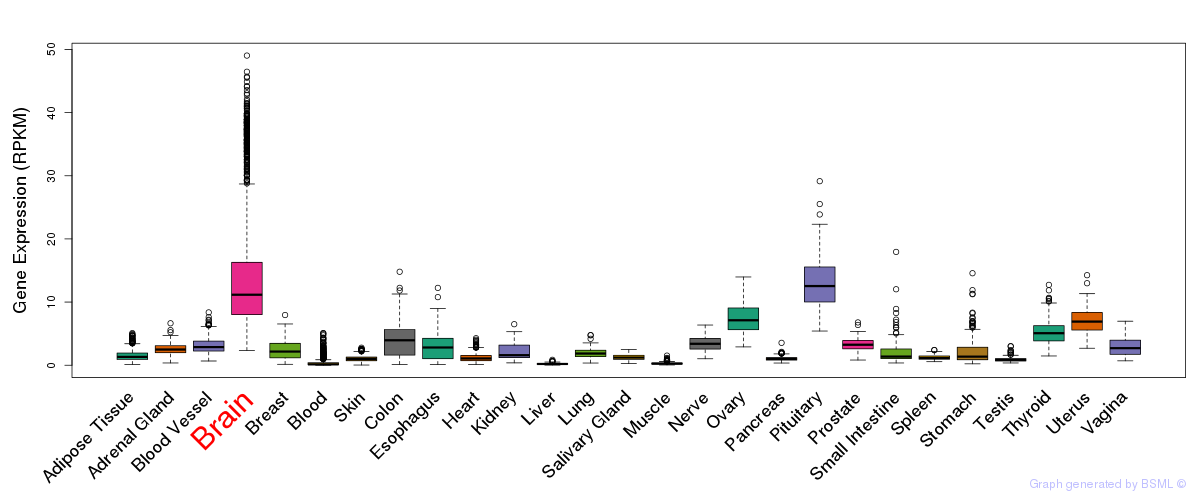
General gene expression (GTEx)

Gene expression during devlopment (BrainCloud)
Footnote:
A total of 269 time points ploted, with n=38 fetal samples (x=1:38). Each triangle represents one time point.
Gene expression of temporal and spatial changes (BrainSpan)
Footnote:
SC: sub-cortical regions; SM: sensory-motor regions; FC: frontal cortex; and TP: temporal-parietal cortex
ST1: fetal (13 - 26 postconception weeks), ST2: early infancy to late childhood (4 months to 11 years), and ST3: adolescence to adulthood (13 - 23 years)
The bar shown representes the lower 25% and upper 25% of the expression distribution.
Top co-expressed genes in brain regions
| Top 10 positively co-expressed genes | ||
| Gene | Pearson's Correlation | Spearman's Correlation |
| NTNG1 | 0.79 | 0.80 |
| KCNK13 | 0.79 | 0.74 |
| SLC17A6 | 0.79 | 0.66 |
| TTC39A | 0.79 | 0.66 |
| PTPN3 | 0.79 | 0.67 |
| BTBD11 | 0.78 | 0.75 |
| PAPPA | 0.77 | 0.41 |
| CIT | 0.76 | 0.74 |
| B3GALTL | 0.76 | 0.72 |
| RGS16 | 0.76 | 0.41 |
| Top 10 negatively co-expressed genes | ||
| Gene | Pearson's Correlation | Spearman's Correlation |
| PLEKHO1 | -0.28 | -0.29 |
| SIGIRR | -0.28 | -0.48 |
| WDR86 | -0.26 | -0.29 |
| IGFBP2 | -0.25 | -0.30 |
| RPL28 | -0.25 | -0.44 |
| NEUROD2 | -0.25 | -0.15 |
| FOXG1B | -0.24 | -0.14 |
| ISLR2 | -0.24 | -0.07 |
| SH2D2A | -0.24 | -0.41 |
| EIF4EBP1 | -0.24 | -0.34 |
Section III. Gene Ontology annotation
| Molecular function | GO term | Evidence | Neuro keywords | PubMed ID |
|---|---|---|---|---|
| GO:0003700 | transcription factor activity | NAS | - | |
| GO:0008270 | zinc ion binding | IEA | - | |
| GO:0046872 | metal ion binding | IEA | - | |
| Biological process | GO term | Evidence | Neuro keywords | PubMed ID |
| GO:0006355 | regulation of transcription, DNA-dependent | NAS | - | |
| GO:0006350 | transcription | IEA | - | |
| Cellular component | GO term | Evidence | Neuro keywords | PubMed ID |
| GO:0005622 | intracellular | IEA | - | |
| GO:0005634 | nucleus | NAS | - |
Section V. Pathway annotation
| Pathway name | Pathway size | # SZGR 2.0 genes in pathway | Info |
|---|---|---|---|
| GAL LEUKEMIC STEM CELL UP | 133 | 78 | All SZGR 2.0 genes in this pathway |
| DELYS THYROID CANCER DN | 232 | 154 | All SZGR 2.0 genes in this pathway |
| LINDGREN BLADDER CANCER CLUSTER 1 UP | 121 | 71 | All SZGR 2.0 genes in this pathway |
| LINDGREN BLADDER CANCER CLUSTER 3 DN | 229 | 142 | All SZGR 2.0 genes in this pathway |
| OUELLET CULTURED OVARIAN CANCER INVASIVE VS LMP UP | 69 | 40 | All SZGR 2.0 genes in this pathway |
| RICKMAN METASTASIS UP | 344 | 180 | All SZGR 2.0 genes in this pathway |
| BENPORATH ES 1 | 379 | 235 | All SZGR 2.0 genes in this pathway |
| BENPORATH NANOG TARGETS | 988 | 594 | All SZGR 2.0 genes in this pathway |
| LI WILMS TUMOR VS FETAL KIDNEY 1 DN | 163 | 115 | All SZGR 2.0 genes in this pathway |
| KAYO AGING MUSCLE UP | 244 | 165 | All SZGR 2.0 genes in this pathway |
| BLALOCK ALZHEIMERS DISEASE UP | 1691 | 1088 | All SZGR 2.0 genes in this pathway |
| CUI TCF21 TARGETS 2 UP | 428 | 266 | All SZGR 2.0 genes in this pathway |
| LABBE WNT3A TARGETS UP | 112 | 71 | All SZGR 2.0 genes in this pathway |
| CONRAD STEM CELL | 39 | 27 | All SZGR 2.0 genes in this pathway |
| LI WILMS TUMOR | 27 | 12 | All SZGR 2.0 genes in this pathway |
| CHIANG LIVER CANCER SUBCLASS PROLIFERATION UP | 178 | 108 | All SZGR 2.0 genes in this pathway |
| KIM BIPOLAR DISORDER OLIGODENDROCYTE DENSITY CORR UP | 682 | 440 | All SZGR 2.0 genes in this pathway |
| WIERENGA STAT5A TARGETS DN | 213 | 127 | All SZGR 2.0 genes in this pathway |
| DELACROIX RAR BOUND ES | 462 | 273 | All SZGR 2.0 genes in this pathway |